 Open Access Article
Rapid and efficient mechanosynthesis of alkali and alkaline earth molybdates†
Andres
Lara-Contreras
 ,
Patrick
Julien
 *,
Jennifer
Scott
and
Emily C.
Corcoran
*
Department of Chemistry and Chemical Engineering, Royal Military College of Canada, 13 General Crerar Crescent, Kingston, ON, Canada. E-mail: Patrick.Julien@rmc.ca; Emily.Corcoran@rmc.ca
First published on 12th August 2024
Abstract
Complex molybdates are traditionally prepared via solid-state synthesis and aqueous chemistry methods, which generally require long reaction times and large solvent volumes or high sintering temperatures. However, these techniques often result in undesired secondary species, incomplete reactions, and relatively low yields. Mechanochemistry has proven effective for the synthesis of complex molybdates. This work expands on the development of the mechanochemical synthesis of various heptamolybdates (i.e., sodium, rubidium, and cesium), and trimolybdates (i.e., sodium, rubidium, cesium, strontium, and barium). The obtained materials were characterized via powder X-ray diffraction, Fourier-transform infrared spectroscopy, Raman spectroscopy, thermo-gravimetric analysis, and scanning electron microscopy to assess the purity, morphology, and quality of the sample. High purity samples of the various trimolybdates and heptamolybdates were obtained in less than three hours of reaction time, with minimal energy input and by-products. Mechanochemistry provides a fast, more sustainable, and simple procedure for the synthesis of a wide variety of both trimolybdates and heptamolybdates including the monohydrate form of sodium trimolybdate instead of the trihydrate variant commonly obtained from aqueous reactions.
Introduction
Molybdates (i.e., compounds containing metal-centred MoOn polyhedra linked by shared corners, faces, or edges)1,2 have been widely studied, and are of interest in various fields including superconductors,3 photocatalysis,4–6 and pharmaceuticals.7,8 Due to the relatively high fission yield of molybdenum (i.e., ∼6% in 235U),9 it is of interest for the nuclear industry to understand its behaviour in nuclear fuels. As molybdenum accumulates in the fuel, it interacts with existing oxygen and other fission products such as Na, Rb, Cs, Ba, and Sr to form complex oxides.10–12 Existing predictions of the thermochemical behaviour of complex nuclear fuels can be improved by comparing the thermodynamic analysis of non-radioactive homologue compounds to that of nuclear materials. The thermodynamics of advanced fuels-international database (TAF-ID)13 gathers reliable, self-consistent thermodynamic data of various nuclear materials. Several studies in the literature investigate the thermodynamic properties of some molybdates, especially lower-ordered molybdates like MxMoO4 (M = Na, Rb, Cs, Ca, Sr, Ba). Higher order molybdates, such as trimolybdates or heptamolybdates (i.e., [Mo3O10]2− and [Mo7O24]6−, respectively), still require further study of their thermodynamic properties for the accurate implementation into computational thermodynamic models. The first step in the development of thermodynamic models for the TAF-ID is the synthesis of the complex, non-radioactive homologue materials. This work focuses on the synthesis of Na, Rb, Cs, Sr, and Ba trimolybdates, as well as Na, Rb, and Cs heptamolybdates that are suitable for thermodynamic assessment.Traditionally, various polyoxomolybdates were prepared via solid-state synthesis (SSS) and aqueous synthesis, with typical examples of synthetic methods in the literature shown in Table 1.10,14–21 The methods involving SSS typically require long sintering periods (i.e., ranging from several days to weeks), intimate mixing of the compounds, and, in most cases, iterative grinding and mass adjustment of the reactants to improve purity of the product.22 Heptamolybdates have traditionally been synthesized using aqueous and hydrothermal methods which require extended heating and mixing times (i.e., days in most cases) as well as an exhaustive control of several variables simultaneously (i.e., pH, temperature, pressure, reactant concentration, etc.) to minimize variability in the obtained product.
| Compound | Traditional synthesis method | References |
|---|---|---|
| a One additional report of BaMo3O10·3H2O has been found in the PFD-4 Database (card no. 00-060-0848), but no experimental details were provided. b Three different hydrated versions of the compound were reported by Meullemeestre (i.e., 1.75, 3, and 4H2O), all produced via the same methodology. | ||
| Na2Mo3O10·3H2O | Aqueous | 23 |
| Na2Mo3O10·H2O | Aqueous | 24 |
| Na6Mo7O24·14H2O | Hydrothermal | 21 |
| Aqueous | 25 and 26 | |
| Rb2Mo3O10·H2O | Hydrothermal | 12, 18, 27 and 28 |
| Rb6Mo7O24·4H2O | Hydrothermal | 19 |
| Cs2Mo3O10·H2O | Solvothermal | 29 |
| BaMo3O10 | Solid-state | 10 and 30 |
| BaMo3O10·3H2Oa | Aqueous | 31 |
| SrMo3O10·4H2Ob | Aqueous | 31 |
An alternative synthesis method that has proven effective in the preparation of polyoxometalates, as well as various other compounds (e.g., pharmaceuticals, polymers, etc.), is mechanochemistry.32,33 This technique uses the mechanical stress produced during processes such as ball milling to induce a chemical reaction.33 Ball milling offers several advantages as it can increase reactivity and lower the temperature of consolidation in inorganic and ceramic settings.32 In addition, these techniques offer shorter processing times and reduce the use of solvents while producing high yield, high purity samples.34
Mechanochemistry has only recently been reported for the synthesis of molybdates. In 2021, Wilke and Casati synthesized potassium and ammonium heptamolybdate tetrahydrates ((NH4)6Mo7O24·4H2O and K6Mo7O24·4H2O) via mechanochemistry using stoichiometric mixtures of molybdenum(VI) oxide (MoO3) and potassium or ammonium bicarbonates in the presence of minimal water (30–200 μL).35 Furthermore, in 2023, Gancheva et al. used mechanosynthesis to prepare BaMoO4 with the same starting materials, but in less time compared to the traditional SSS.36
This work presents the synthesis of Na, Rb, and Cs heptamolybdates and Na, Rb, Cs, Sr, and Ba trimolybdates using mechanochemical synthesis as a reliable, sustainable, and efficient alternative to produce non-radioactive homologues of nuclear fuel materials suitable for thermodynamic analysis. In addition, the physicochemical characterization of the obtained products is presented.
Results and discussion
Similarly to most solid-state syntheses, the molybdates herein were prepared starting from MoO3 and the corresponding alkali or alkaline earth metal carbonate, as presented in Fig. 1. The volume of water added (50 μL) was selected as an intermediate value from those reported by Wilke and Casati35 for the synthesis of ammonium and potassium heptamolybdates. Ball milling was used as an alternative to efficiently prepare the various heptamolybdates and trimolybdates while minimizing the solubility limitations and formation of secondary by-products faced during other synthesis processes.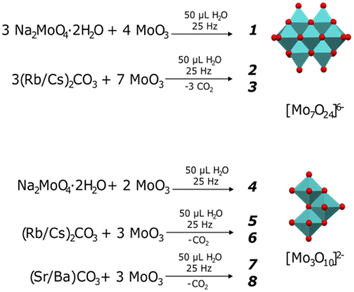 | ||
| Fig. 1 Preparation of heptamolybdates [Mo7O24]6− (1-Na, 2-Rb, 3-Cs) and trimolybdates [Mo3O10]2− (4-Na, 5-Rb, 6-Cs, 7-Sr, 8-Ba). | ||
Synthesis and characterization of compounds 1 (Na6Mo7O24·14H2O), 2 (Rb6Mo7O24·4H2O) and 3 (Cs6Mo7O24·7H2O)
The three-alkali metal heptamolybdates were prepared using stoichiometric mixtures of MoO3 and either Na2MoO4·2H2O or Sr/BaCO3 as the source of alkali metal. Na2MoO4·2H2O was chosen over the carbonate due to sodium bicarbonate contamination possibly formed after exposure of the sodium carbonate to air humidity. High purity samples of compounds 1, 2, and 3 were obtained after ball milling for 30 minutes, similar to the results obtained by Wilke and Casati35 and analysed using powder X-ray diffraction (PXRD). In terms of peak position and intensity, the obtained patterns for the three compounds show a high degree of similarity to those simulated from data reported in the PDF-4 (powder diffraction file) database,24 hence showing good agreement with measurements previously reported in the literature. No significant contamination or by-products were detected (see Fig. 2). As single crystal structural data were available for compounds 1 and 3, Rietveld refinements were performed, with RP values of 5.954 and 3.383, and Rwp of 7.879 and 4.453, respectively, while only considering the phase corresponding to the target compound. The low RP and Rwp values confirm good agreement between the measured and calculated patterns (detailed results of the Rietveld refinements can be found in Fig. S1 and S3†).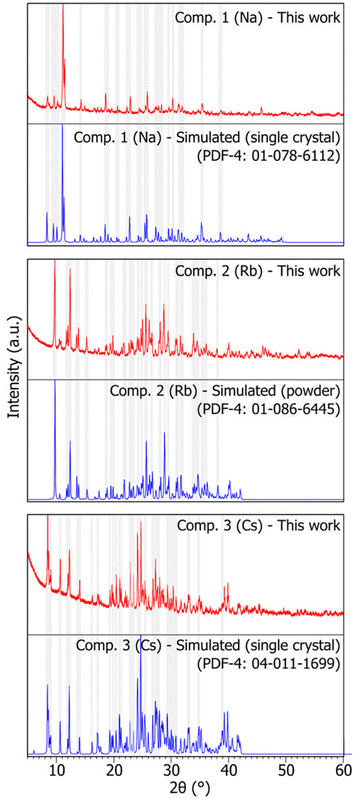 | ||
| Fig. 2 X-ray diffraction patterns of synthesized heptamolybdates. Compounds 1, 2, and 3 (Na, Rb, and Cs, respectively). Red: sample pattern obtained in this work. Blue: simulated pattern from single crystal data (compounds 1 and 3) or powder data (compound 2), obtained from the PDF-4 database.24 Some shaded areas are in place between corresponding experimental and simulated patterns for easier comparison. The reader is referred to the digital version of this article for the colour version of the figure. | ||
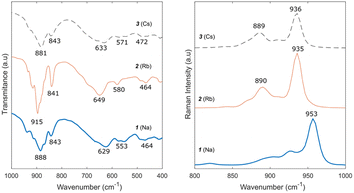
Fourier-transform infrared (FTIR) spectra of compounds 1–3 are shown in Fig. 3. Peaks within the fingerprint region (i.e., 400–1000 cm−1) were clearly identified (i.e., 900–1000, 840, 650, 580, 470, and 409 cm−1) and correspond to those reported in the literature for other heptamolybdates.37–39 The bands at 933–865 cm−1 correspond to the stretching vibrations of molybdenum and terminal oxygen (Mo–Ot) in the cluster, the 841 cm−1 band corresponds to Mo–O–Mo stretching vibrations,38 and the 667 and 578 cm−1 bands correspond to the Mo–O stretching vibration.39 Vibrations below 510 cm−1 remain unassigned. Similarly, the Raman spectra (also presented in Fig. 3) of the three compounds correspond to those reported in the literature for other heptamolybdates.37,40–42 Although a small shift can be observed between compounds, likely caused by the presence of different cations, the main assigned bands are observed: Mo–Ot symmetrical vibration at 937 cm−1, Mo–O asymmetrical vibration at 900 cm−1, and 860 cm−1 symmetrical Mo–O–Mo vibration.40
Micrographs of samples of compounds 1, 2, and 3 were obtained using Scanning Electron Microscopy (SEM) (Fig. 4) at two different magnifications (i.e., 100× and 500×). Overall, the samples present very small particle sizes (ranging from <20 μm to 250 μm) with irregular edges and shapes, as expected from the mechanical force applied during ball milling. Some particle clumps are observed, most likely formed upon drying of the sample and crystallization of solubilized material. Qualitative elemental analysis was obtained using the EDAX (energy dispersive X-ray spectroscopy) accessory of the SEM and the main X-ray energy peaks observed (Fig. S17†) were those expected from the sample (i.e., Na/Rb/Cs, Mo, and O). The presence of carbon is evidenced as double-sided carbon tape was used to fix the sample to the holder. In addition, a small amount of fluorine was identified in compound 3 at 0.677 keV,43 most likely a result of minimal contamination from particles being released from the polytetrafluoroethylene (PTFE) reaction vessel.
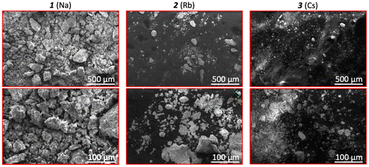 | ||
| Fig. 4 SEM micrographs obtained of compounds 1, 2, and 3. Top: Micrographs at 100× (scale: 500 μm) and 500× (scale: 100 μm) magnification. | ||
To assess the hydration content of the compounds and quantify the presence of PTFE contamination, if any, thermo-gravimetric analysis (TGA) was performed in the temperature range 30–600 °C (Table 2). For compounds 1 and 3, the initial mass change found in the sample was less than expected. Specifically, instead of the 14 mol of water per mol of anhydrous compound 1, only 7.3 mol of water were found. Similarly, compound 3 contained 5.4 mol of water instead of the 7 mol reported in the literature. Samples of compound 1 prepared via aqueous methods present a three-step dehydration process26 encompassing a total mass loss equivalent to 14 mol of water per mol of anhydrous material, contrary to the single mass loss event observed in this work. This lower-than-expected water content may be attributed to the synthesis conditions, where only 50 μL of water were used, as well as the 18 hour vacuum drying process, possibly inducing the loss of lattice water. However, the structure of the heptamolybdate cluster in the compounds was preserved, as suggested by the PXRD and FTIR spectroscopy results. The mass loss in compound 2 was equivalent to 4.0 mol of water per mol of anhydrous material, consistent with the values reported in the literature.19 An additional mass change was observed in the heating curves of compounds 2 and 3 at 359.2 and 402.4 °C, respectively, consistent with either the initial decomposition temperature of PTFE or condensation of the molybdates at these elevated temperatures.39,44,45 As the mass loss is equivalent to only 1.06 and 1.23% of the initial sample mass, the amount of PTFE is minimal. Contamination could be minimized by substituting the material of the reaction vessel when longer milling times are required. Qualitative assessment of the solubility of the compounds indicates that the three synthesized heptamolybdates are soluble in water. Further quantitative study of the solubility of the heptamolybdates in water is required.
| Compound | Mass change [%] | Temperature [°C] | Cause | Expected value |
|---|---|---|---|---|
| 1 | 10.02% | 56.6 | 7.3 mol H2O | 14 mol H2O |
| 2 | 4.34% | 11.5 | 4.0 mol H2O | 4 mol H2O |
| 1.06% | 359.2 | PTFE | — | |
| 3 | 4.63% | 50.7 | 5.4 mol H2O | 7 mol H2O |
| 1.23% | 402.4 | PTFE | — | |
| 4 | 2.14% | 57.0 | 0.6 mol H2O | 1 mol H2O |
| 3.25% | 226.2 | 1.0 mol H2O | — | |
| 1.14% | 470.5 | PTFE | — | |
| 5 | 2.70% | 97.5 | 1.0 mol H2O | 1 mol H2O |
| 0.57% | 406.7 | PTFE | — | |
| 6 | 2.73% | 86.9 | 1.1 mol H2O | 1 mol H2O |
| 1.45% | 363.4 | PTFE | — | |
| 7 | 2.79% | 63.1 | 1.0 mol H2O | 4 mol H2O |
| 5.27% | 120.8 | 1.8 mol H2O | — | |
| 1.30% | 202.9 | 0.4 mol H2O | — | |
| 1.03% | 287.1 | 0.4 mol H2O | — | |
| 2.20% | 462.7 | PTFE | — | |
| 8 | 8.28% | 77.6 | 3.0 mol H2O | 3 mol H2O |
| 2.65% | 465.7 | PTFE | — |
Synthesis of alkali metal trimolybdates: compounds 4 (Na2Mo3O10·H2O), 5 (Rb2Mo3O10·H2O), and 6 (Cs2Mo3O10·H2O)
Various polytypes of the [Mo3O10]2− anion have been identified in the literature, including both the tri- and monohydrates of sodium trimolybdate. Since the mechanosynthesis approach proved applicable to produce heptamolybdates, this study similarly pursued the synthesis of the trimolybdates by adjusting the ratio of starting materials accordingly (see Fig. 1). The reaction of sodium molybdate with MoO3 produced solely the monohydrated trimolybdate, Na2Mo3O10·H2O (4), as evidenced by the PXRD pattern (Fig. 5). Although this compound has been reported in the PDF-4 database (card no. 00-050-0625) as a private communication, with cell parameters and space group, there is no reported crystal structure. To the best knowledge of the authors, no other report of this compound is present in the literature. On the other hand, Na2Mo3O10·3H2O has been characterized, and its crystallographic properties and structure have been reported.23 Evidence shows that mechanochemistry favours the formation of the monohydrate compound as key characteristic peaks of the trihydrate trimolybdate (i.e., 2θ = 9.014, 11.094, and 27.074° with relative intensities of 100, 23, and 20%, respectively) are absent in the PXRD pattern.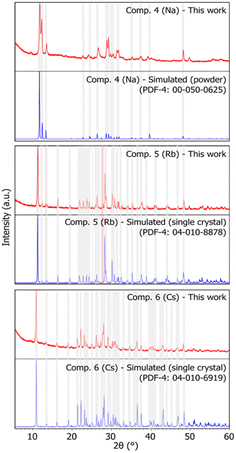 | ||
| Fig. 5 X-ray diffraction patterns of compounds 4–6 (Na, Rb, and Cs, respectively). Red: sample pattern obtained in this work. Blue: simulated pattern from powder data (compound 4, obtained from the PDF-4 database24 or compounds 5 and 6, obtained from single crystal data). Some shaded areas are in place between corresponding experimental and simulated patterns for easier comparison. The red shaded area highlights a peak of MoO3. The reader is referred to the digital version of this article for the colour version of the figure. | ||
The reaction of stoichiometric mixtures of MoO3 and (Rb/Cs)2CO3 under mechanochemical conditions produced Rb2Mo3O10·H2O (5) and Cs2Mo3O10·H2O (6), respectively. The PXRD patterns of compounds 5 and 6 (Fig. 5) correspond to those of the patterns simulated from single crystal X-ray diffraction data (PDF-4 04-010-8878 and 04-010-6919).24 These compounds form chains of edge-sharing MoO6 octahedra in a zig-zag configuration and are classified within space group Pnma (69). Similarities in the PXRD patterns between the two compounds can be observed despite a slight variation in the 2θ position of the peaks related to differences in the cation size. In the PXRD pattern of compound 5, two additional peaks at 2θ = 12.8 and 27.3° (shaded in red in Fig. 5) were observed, and can be accounted for as residual MoO3, equivalent to 7.2% of the sample, according to the results of the Rietveld refinement (Rp = 4.607, Rwp = 5.978) (see Fig. S5†).
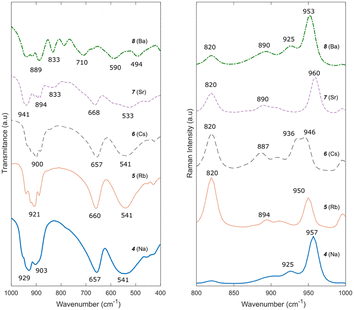
The FTIR spectra of compounds 4, 5, and 6 (Fig. 6) are very similar, with expected small shifts in the bands due to the size difference of the cations.46,47 Peaks at 975–880 cm−1, a peak at 650 cm−1, and a broad band at 545 cm−1 belong to the vibration of Mo–O–Mo bridges in the structure and are characteristic of trimolybdates.37,48 Similarly, the Raman spectra of compounds 4, 5 and 6 also present slight shifts from each other to lower wavenumbers as the cation size increases. The bands at 958, 913 and 896 cm−1 correspond to the symmetrical stretching vibration of Mo–Ot.49
Micrographs of compounds 4 to 6 are presented in Fig. 7. The particle size of all the compounds is within the range <20 to 300 μm, as expected from the active milling process. The EDAX spectra of the compounds indicate the presence of the expected elements (i.e., Na/Rb/Cs, Mo, and O), as well as C and a weak F peak, from the carbon tape and the presence of small amounts of PTFE in the sample (Fig. S18†).
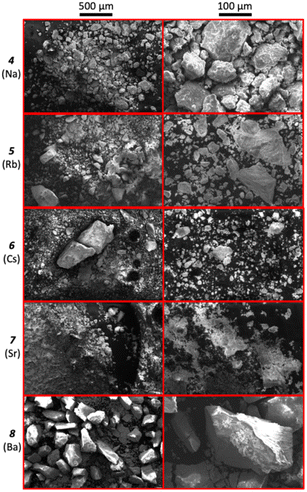 | ||
| Fig. 7 SEM micrographs at 100× (left, scale: 500 μm) and 500× (right, scale: 100 μm) magnification of 4 (Na) to 8 (Ba). | ||
TGA performed on compound 4 (Table 2) indicates three different mass losses with onsets 57.0 and 226.2 °C, corresponding to 0.6 and 1.0 mol of H2O, slightly higher than expected based on the literature (i.e., one mol of water per mol of material). A third mass loss was observed at about 470 °C, equivalent to 1.14% of the initial sample mass and consistent with the decomposition temperature of PTFE or condensation of the molybdates, as previously discussed. Despite the longer milling time (i.e., 60 min for compound 4vs. 30 min for compound 1), the PTFE content of the sample remained very low. Results for compounds 5 and 6 show mass losses equivalent to 1.0 and 1.1 mol of water per mol of anhydrous material, respectively, in good agreement with the mass losses reported in the literature for the compounds.12,29 Qualitative analysis of the solubility of the alkali trimolybdates in water indicate poor solubility. Future work is required to quantitatively determine the solubility of the compounds for further applications.
The results indicate that mechanochemistry is an effective technique for the synthesis of alkali metal trimolybdates. Furthermore, for the case of sodium trimolybdate, mechanochemistry favours the formation of the monohydrate form of the trimolybdate, leading to a similar crystallographic profile to that of rubidium and cesium trimolybdate monohydrates.
Synthesis of alkaline earth metal trimolybdates: compound 7 (SrMo3O10·4H2O) and compound 8 (BaMo3O10·3H2O)
The preparation of compounds 7 and 8via mechanochemistry was pursued similarly to that of compounds 4, 5, and 6, using a stoichiometric mixture of the corresponding carbonate (i.e., SrCO3 and BaCO3) and MoO3. To achieve completion, the reaction to prepare compounds 7 and 8 required 180 and 150 minutes of ball milling, respectively. Assessed using PXRD (Fig. 8), the completion of the reaction was determined based on the qualitative comparison between the obtained pattern and that reported in the PDF-4 database (card no. 00-032-1245 and 00-060-0848, for compound 7 and 8, respectively).24 The pattern for compound 7 reported in the database contains peaks with relative intensities approximated to 25, 50, 75, and 100% of the peak with the highest intensity, as reported by Meullemeestre.31 Hence, the assessment was based merely on the 2θ position of the observed peaks compared to that of the reported pattern, as presented in Fig. 8. A more detailed comparison can be observed in Fig. S7 and S8.† A peak at 25.6° in the pattern of compound 7 (shaded in red in Fig. 8) indicates the presence of minimal unreacted, hydrated MoO3. Since the crystal structures of the compounds have not been determined in the literature, it is not possible to identify properly the nature of the trimolybdate arrangement within the compound or quantify the presence of residual reactants in the sample. However, this work presents a PXRD pattern for compound 7 with more detailed relative intensities compared to that reported in the PDF-4 database24 and by Meullemeestre,31 as found in Fig. S7.†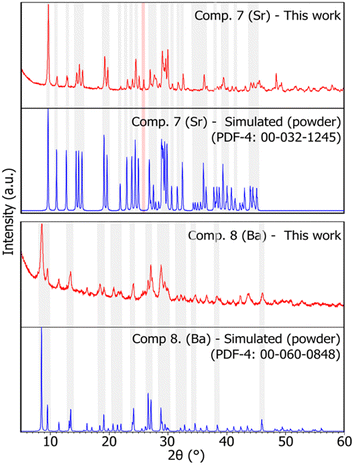 | ||
| Fig. 8 X-ray diffraction patterns of compounds 7 and 8 (Sr, and Ba), respectively. Red: sample pattern obtained in this work. Blue: simulated pattern from powder data obtained from the PDF-4 database.24 Some shaded areas are in place between corresponding experimental and simulated patterns for easier comparison. The red shaded area highlights a peak of MoO3. The reader is referred to the digital version of this article for the colour version of the figure. | ||
The FTIR spectra (Fig. 6) of compounds 7 and 8 correspond to those reported by Meullemeestre31 for strontium and barium trimolybdates. Although similar to compounds 4–6, the relative intensity and position of the bands in the IR spectrum of compound 7, especially between 900 and 1000 cm−1, differs slightly, potentially caused by the positioning of the divalent cation in the structure compared to the monovalent cations in compounds 4–6. Furthermore, an additional weak peak is observed, around 843 cm−1, which can be explained by the presence of hydrated MoO3 in the sample.50 The IR spectrum of compound 8 is different from that of the previously reported trimolybdates. Nonetheless, it is similar to that reported in the literature by Meullemeestre.31 The Raman spectra of compounds 7 and 8 (Fig. 6) are similar to those of compounds 4–6, with the major peak at 950 cm−1 present. Further study of the crystal structure of compounds 7 and 8 is required to better determine and assign the IR and Raman bands in the spectra.
Micrographs of compounds 7 and 8 (Fig. 7) show particles with various sizes (i.e., ranging from <20 μm to 500 μm). EDAX spectra (Fig. S18†) of the compounds indicate the presence of the expected elements, as well as C. Fluorine is observed in the spectrum of compound 8, although expected in minimal quantities based on the intensity of the peak. TGA analysis of compounds 7 and 8 (Table 2) present various mass change events. Compound 7 displays four mass loss events with onset temperatures in the range 60–290 °C, accounting to 3.6 mol of H2O per mol of anhydrous material. Similarly, compound 8 presents one mass loss event with onset at 77.6 °C corresponding to 3.0 mol of water per mol of anhydrous material. The total mass losses are consistent with those reported by Meullemeestre for both compounds (i.e., 4 and 3 mol of water per mol of trimolybdate in compounds 7 and 8, respectively31). Additionally, compounds 7 and 8 present an additional mass loss equivalent to 2.20 and 2.65% of the initial sample mass at 460 °C, which could be attributed to PTFE present in the sample or condensation of the molybdates. The contamination risk with PTFE may be eliminated by using chemically inert zirconia milling jars instead. Compounds 7 and 8 were found poorly soluble in water, and future work is required to measure their solubility. Overall, mechanochemistry was demonstrated as a straightforward procedure which enables the synthesis of a wide variety of molybdates in high purity and yields.
Experimental
All reactants were used as received from the provider: molybdenum(VI) oxide >99.5% (Strem Chemicals Inc. USA), cesium carbonate >99.999% (Sigma-Aldrich, Canada), rubidium carbonate >99.9% (Sigma-Aldrich, Canada), sodium molybdate dihydrate >99.9% (Sigma-Aldrich, Canada), and barium carbonate, >99% (Sigma-Aldrich, Canada). Custom-made PTFE (i.e., polytetrafluoroethylene) snapping vials where manufactured, with an inner volume of approximately 30 mL. One zirconia ball of 8 mm and approximately 1.5 g was placed in each vial during the milling process. Ball milling was performed in a Retsch MM400 ball mill operating at 25 Hz in intervals of 30 and/or 60 minutes. For all reactions, 50 μL of double-deionized water were added prior to milling. The amounts of reactants and experimental conditions are presented in Table 3. After milling, samples were dried for 18 h under vacuum at room temperature prior to sample characterization.| Compound | Reactants | Mols [mmol], um = ±0.01 mmol | Milling time [min], ut = ±0.1 min |
|---|---|---|---|
| 1. Na6Mo7O24·14H2O | Na2MoO4·2H2O | 0.69 | 30 (1 × 30 min) |
| MoO3 | 0.92 | ||
| 2. Rb6Mo7O24·4H2O | Rb2CO3 | 0.53 | 60 (1 × 60 min) |
| MoO3 | 1.23 | ||
| 3. Cs6Mo7O24·7H2O | Cs2CO3·3H2O | 0.42 | 60 (2 × 30 min) |
| MoO3 | 0.98 | ||
| 4. Na2Mo3O10·H2O | Na2MoO4·2H2O | 0.56 | 60 (2 × 30 min) |
| MoO3 | 1.13 | ||
| 5. Rb2Mo3O10·H2O | Rb2CO3 | 0.44 | 30 (1 × 30 min) |
| MoO3 | 1.35 | ||
| 6. Cs2Mo3O10·H2O | Cs2CO3 | 0.43 | 30 (1 × 30 min) |
| MoO3 | 1.11 | ||
| 7. SrMo3O10·4H2O | SrCO3 | 0.52 | 180 (3 × 60 min) |
| MoO3 | 1.55 | ||
| 8. BaMo3O10·3H2O | BaCO3 | 0.51 | 150 (2 × 60 min + 1 × 30 min) |
| MoO3 | 1.43 |
Powder X-ray diffraction measurements were performed with an Empyrean Panalytical X-ray diffractometer (Panalytical, The Netherlands) in a Bragg–Brentano configuration equipped with a Cu tube (Kα = 1.541 Å) set at 40 mA and 45 kV, and a 3DPix detector. Measurements were performed in the 2θ range 5–90° with a duration of 1 h. The obtained diffraction patterns were processed using the HighScore Plus suite (Panalytical, The Netherlands), and phases were identified using the patterns available in the Powder Diffraction File Database (PDF-4, Version 2023 (ref. 24)). Rietveld refinement analysis was performed for samples with available structural data in the PDF-4 database using the Rietveld refinement functionality of HighScore Plus (Panalytical, The Netherlands). For Rietveld refinements, only unit cell parameters, sample displacement, and background correction were refined.
Fourier-transform infrared (FTIR) spectroscopy measurements were performed in a Nicolet i5 spectrometer (Thermo Fisher Scientific, USA) in transmittance mode. Samples were prepared as KBr pellets with a 100![[thin space (1/6-em)]](https://www.rsc.org/images/entities/char_2009.gif) :
:![[thin space (1/6-em)]](https://www.rsc.org/images/entities/char_2009.gif) 1 proportion. The collected spectra were processed using the OMNIC Software (Thermo Fisher Scientific, USA) for peak labelling.
1 proportion. The collected spectra were processed using the OMNIC Software (Thermo Fisher Scientific, USA) for peak labelling.
Raman Spectroscopy measurements were performed on solid samples using a InPhotonics 785 nm laser and Ocean Insight QE-Pro spectrometer, with dark and non-linearity corrections applied in OceanView software.
Thermo-gravimetric analysis (TGA) measurements were performed in a TA Instruments Q10 thermo-gravimetric analyzer (TA Instruments, USA) in the range 25–600 °C with a heating rate of 10 °C min−1 under a nitrogen atmosphere at 60 mL min−1. Obtained data were processed using the TA Universal Analysis software (TA Instruments, USA) for mass change quantification and onset temperature determination.
Scanning electron microscopy (SEM) analysis was performed using a FEI Quanta 250FEG (FEI, USA) at 10−3 Pa pressure and the electron beam set to 20 keV with a working distance of 10 mm. The samples were mounted in a 10 mm sample holder covered with double-sided carbon tape. Additional adhesive was placed on top of the carbon tape to fix the powdered samples hence avoiding loose particles inside the chamber. Particle size measurements were performed at 100× and 500× using the ×T Microscope Control Software – V 6.2.8 (FEI, USA). Energy dispersive X-ray spectroscopy (EDAX) measurements were performed using an EDAX Octane Elite EDS detector (EDAX, USA) attached to the SEM equipment. Measurements were performed with counting resolutions higher than 500 cps, and a take-off angle of 5.57°. The measurements were performed in point analysis mode with a measurement time of 30 seconds per point. Elemental identification was performed in the EDAX-TEAM Software Package (EDAX, USA).
Qualitative solubility assessment was performed by attempting to dissolve ∼10 mg of sample in 5 mL of water, stirring for 10 minutes. Visual inspection of the solution was used to determine the extent of the solubility of the compound.
Conclusions
The mechanochemical synthesis of complex oxides including sodium, rubidium, and cesium heptamolybdates and sodium, rubidium, cesium, strontium, and barium trimolybdates demonstrates the versatility, efficiency, and convenience of mechanochemistry for rapidly preparing high-purity samples with minimal secondary reactions and high crystallinity. Furthermore, mechanochemistry favours the formation of sodium trimolybdate monohydrate over the formation of the trihydrate version favoured in aqueous synthesis. In contrast, for solution state reactions, the solubility of the reactants and products plays a large role in the morphology of the final material: reactants with higher solubility led to shorter reaction times reducing the mechanical stress in the material, while products with higher solubility result in larger particle sizes and agglomeration. The mechanochemical synthesis of the compounds was performed using minimal amounts of solvent (i.e., water), with high reaction yields, shorter operational times, and minimal contamination. This proves the technique effective as a sustainable alternative to traditional synthesis methods like solid-state or aqueous synthesis to obtain homologues suitable for the thermochemical study of nuclear materials.Data availability
The data supporting this article have been included as part of the ESI.†Author contributions
Andres Lara-Contreras: conceptualization, investigation, methodology, data curation, formal analysis, writing – original draft. Patrick Julien: conceptualization, resources, funding acquisition, investigation, methodology, formal analysis, writing – review and editing. Jennifer Scott: supervision, resources, funding acquisition, writing – review and editing. Emily C. Corcoran: supervision, resources, funding acquisition, writing – review and editing.Conflicts of interest
There are no conflicts to declare.Acknowledgements
The authors acknowledge financial support from the Natural Sciences and Engineering Research Council of Canada (NSERC) and the CANDU Owners' Group (COG) through Grant No. NSERC CRDPJ 513294-17 and the Royal Military College of Canada.Notes and references
- M. Cindric, Polyoxomolybdates and Polyoxomolybdovanadates – from Structure to Functions: Recent Results, Croat. Chem. Acta, 2009, 82(2), 345–362 CAS.
- M. T. Pope and A. Müller, Polyoxometalates: From Platonic Solids to Anti-Retroviral Activity, Springer Netherlands, Dordrecht, 1994, vol. 10, pp. 1–6 Search PubMed.
- E. Coronado and C. J. Gómez-García, Polyoxometalate-Based Molecular Materials, Chem. Rev., 1998, 98, 273–296 CrossRef CAS PubMed.
- L. Li, Y. Hua, X.-N. Li, Y. Guo and H. Zhang, Reunderstanding the photoinduced charge transfer process of ammonium polyoxomolybdate, Dalton Trans., 2019, 48, 10683–10688 RSC.
- M.-S. Wang, G. Xu, Z.-J. Zhang and G.-C. Guo, Inorganic–organic hybrid photochromic materials, Chem. Commun., 2010, 46, 361–376 RSC.
- R. Dessapt, M. Gabard, M. Bujoli-Doeuff, P. Deniard and S. Jobic, Smart Heterostructures for Tailoring the Optical Properties of Photochromic Hybrid Organic–Inorganic Polyoxometalates, Inorg. Chem., 2011, 50, 8790–8796 CrossRef CAS PubMed.
- H. Yanagie, A. Ogata, S. Mitsui, T. Hisa, T. Yamase and M. Eriguchi, Anticancer activity of polyoxomolybdate, Biomed. Pharmacother., 2006, 60, 349–352 CrossRef CAS.
- M. S. Hosseini, S. H. Javanmard, L. Rafiei, A. A. Hariri, N. Dana and M. Rostami, Anticancer Activity of Biotin Polyoxomolybdate Bioconjugate, Eurasian J. Med. Oncol., 2020, 4(1), 42–48 Search PubMed.
- R. W. Mills, A new UK fission yield evaluation UKFY3.7, EPJ Web Conf., 2017, 146, 04008 CrossRef.
- A. L. Smith, M. Rutten, L. Herrmann, E. Epifano, R. J. M. Konings, E. Colineau, J.-C. Griveau, C. Guéneau and N. Dupin, Experimental studies and thermodynamic assessment of the Ba-Mo-O system by the CALPHAD method, J. Eur. Ceram. Soc., 2021, 41, 3664–3686 CrossRef CAS.
- A. L. Smith, T. N. Pham Thi, C. Guéneau, J.-C. Dumas, E. Epifano, W. van Burik and N. Dupin, Thermodynamic modelling assessment of the ternary system Cs-Mo-O, Calphad, 2021, 75, 102350 CrossRef CAS.
- A. Forster, H. U. Kreusler and J. Fuchs, The Crystallinic Phases of the Alkali Trimolybdates, Z. Naturforsch., B: J. Chem. Sci., 1985, 40, 1139–1148 CrossRef.
- C. Guéneau, N. Dupin, L. Kjellqvist, E. Geiger, M. Kurata, S. Gossé, E. Corcoran, A. Quaini, R. Hania, A. L. Smith, M. H. A. Piro, T. Besmann, P. E. A. Turchi, J. C. Dumas, M. J. Welland, T. Ogata, B. O. Lee, J. R. Kennedy, C. Adkins, M. Bankhead and D. Costa, TAF-ID: An international thermodynamic database for nuclear fuels applications, Calphad, 2021, 72, 102212 CrossRef.
- S. Kouno, N. Shirakawa, I. Nagai, N. Umeyama, K. Tokiwa and T. Watanabe, The Synthesis and Characterization of Double-Layered Perovskite Sr3Mo2O7, J. Phys. Soc. Jpn., 2007, 76, 0947061–0947063 CrossRef.
- S. Kouno, N. Shirakawa, I. Nagai, N. Umeyama, K. Tokiwa and T. Watanabe, The synthesis of a quasi-2D metal oxide, Phys. Rev. B: Condens. Matter Mater. Phys., 2008, 403, 1029–1031 CrossRef CAS.
- N. Shirakawa and S. I. Ikeda, The synthesis and basic physical properties of a layered molybdenum perovskite Sr2MoO4, Physica C, 2001, 364–365, 309–312 CrossRef CAS.
- G. J. McCarthy and C. E. Gooden, Compound formation in the system Sr-Mo-O, J. Inorg. Nucl. Chem., 1973, 35, 2669–2672 CrossRef CAS.
- H.-U. Kreusler, A. Forster and J. Fuchs, The structure of the rubidium trimolybdate hydrate Rb2Mo3O10·H2O, Z. Naturforsch., 2018, 35, 242–244 CrossRef.
- B. R. Srinivasan, S. M. Morajkar, S. S. Khandolkar, C. Näther and W. Bensch, Synthesis, structure and properties of a hexarubidium heptamolybdate with bridging aqua ligands, Indian J. Chem., Sect. A, 2017, 56, 601–609 Search PubMed.
- S. Dash, Z. Singh, R. Prasad and D. D. Sood, The standard molar Gibbs free energy of formation of SrMoO3(s), J. Alloys Compd., 1993, 201, 99–102 CrossRef CAS.
- K. Sjöbom, B. Hedman, L. Kenne, Å. Pilotti, S. Svensson and C.-G. Swahn, Multicomponent polyanions. VII. The molecular and crystal structure of Na6Mo7O24(H2O)14, a compound containing sodium-coordinated heptamolybdate anions, Acta Chem. Scand., 1973, 27, 3673–3691 CrossRef.
- V. Grover, B. P. Mandal and A. K. Tyagi, Handbook on Synthesis Strategies for Advanced Materials, ed. A. K. Tyagi and R. S. Ningthoujam, Springer Singapore, Singapore, 2021, pp. 1–49 Search PubMed.
- W. Łasocha, A. Rafalska-Łasocha and H. Schenk, Crystal structure of fibrillar sodium trimolybdate hydrate by powder diffraction method, Cryst. Res. Technol., 1997, 32, 577–584 CrossRef.
- S. Gates-Rector and T. Blanton, The Powder Diffraction File: a quality materials characterization database, Powder Diffr., 2019, 34, 352–360 CrossRef CAS.
- L. Hao, J. Chen and X. Zhang, Redetermination of hexasodium heptamolybdate(VI) 14-hydrate, Acta Crystallogr., Sect. E: Struct. Rep. Online, 2010, 66, i34–i35 CrossRef CAS PubMed.
- A. Lara-Contreras, M. Affan, G. Schatte, J. Scott and E. C. Corcoran, Synthesis, characterization, and stability assessment of sodium and barium heptamolybdates, Appl. Radiat. Isot., 2024, 111473 CrossRef.
- J. Xue, Y. Jiang, J. Gang, M. Chen, J. Ye, H.-Y. Pan and S.-Y. Xu, One-atmosphere aqueous-solution synthesis of trimolybdate nanomaterials and the feasibility for mass production, J. Nanosci. Nanotechnol., 2012, 12, 7044–7051 CrossRef CAS PubMed.
- E. S. Zolotova, S. F. Solodovnikov, Z. A. Solodovnikova, V. N. Yudin, N. F. Uvarov and A. S. Sukhikh, Selection of alkali polymolybdates as fluxes for crystallization of double molybdates of alkali metals, zirconium or hafnium, revisited crystal structures of K2Mo2O7, K2Mo3O10, Rb2Mo3O10 and ionic conductivity of A2Mo2O7 and A2Mo3O10 (A = K, Rb, Cs), J. Phys. Chem. Solids, 2021, 154, 110054 CrossRef CAS.
- A. Michailovski, J. B. Willems, N. Stock and G. R. Patzke, Solvothermal synthesis and crystal structures of alkali molybdates, Helv. Chim. Acta, 2005, 88, 2479–2501 CrossRef CAS.
- S. Dash, Z. Singh, R. Prasad and V. Venugopal, Computer calculation of the 700 K isothermal section of the Ba-Mo-O system from thermodynamic data, High Temp. - High Pressures, 2000, 32, 215–225 CrossRef CAS.
- J. Meullemeestre, Les trimolybdates de Ca, Sr et Ba, Bull. Soc. Chim. Fr., 1978, 236–242 CAS.
- L. Takacs, The historical development of mechanochemistry, Chem. Soc. Rev., 2013, 42, 7649–7659 RSC.
- E. Boldyreva, Mechanochemistry of inorganic and organic systems: What is similar, what is different?, Chem. Soc. Rev., 2013, 42, 7719–7738 RSC.
- P. A. Julien, C. Mottillo and T. Friščić, Metal–organic frameworks meet scalable and sustainable synthesis, Green Chem., 2017, 19, 2729–2747 RSC.
- M. Wilke and N. Casati, A new route to polyoxometalates via mechanochemistry, Chem. Sci., 2022, 13, 1146–1151 RSC.
- M. Gancheva, R. Iordanova, I. Koseva, G. Avdeev, G. Burdina and P. Ivanov, Synthesis and luminescent properties of barium molybdate nanoparticles, Materials, 2023, 16, 7025 CrossRef CAS PubMed.
- S. Himeno, H. Niiya and T. Ueda, Raman studies on the identification of isopolymolybdates in aqueous solution, Bull. Chem. Soc. Jpn., 1997, 70, 631–637 CrossRef CAS.
- B. Sarr, A. Mbaye, M. A. Diallo, C. A. K. Diop, M. Sidibé, F. Maury, C. Charvillat and F. Michaud, A new good thermal stability hybrid material based on heptamolybdate cluster: Synthesis and structural characterization, Chem. Data Collect., 2020, 30, 100576 CrossRef CAS.
- J. Wienold, R. E. Jentoft and T. Ressler, Structural investigation of the thermal decomposition of ammonium heptamolybdate by in situ XAFS and XRD, Eur. J. Inorg. Chem., 2003, 1058–1071 CrossRef CAS.
- E. Payen, J. Grimblot and S. Kasztelan, Study of oxidic and reduced alumina-supported molybdate and heptamolybdate species by in situ laser Raman spectroscopy, J. Phys. Chem., 1987, 91, 6642–6648 CrossRef CAS.
- K. Murata and S. Ikeda, Studies on polynuclear molybdates in the aqueous solution by laser Raman spectroscopy, Spectrochim. Acta, Part A, 1983, 39, 787–794 CrossRef.
- G. Johansson, L. Pettersson, N. Ingri, P. G. Wahlbeck, E. Hoyer, V. P. Spiridonov and T. G. Strand, On the formation of hepta- and octamolybdates in aqueous solution. X-Ray scattering and Raman measurements, Acta Chem. Scand., Ser. A, 1979, 33, 305–312 CrossRef.
- EDAX - Ametek Inc. [internet], 2024 [cited April 2024], https://www.edax.com/resources/interactive-periodic-table#thumb.
- P. Tsai, Y. Guo, J. Chen and H. Shieh, An integrated approach to initiate preventive strategies for workers exposed to Teflon pyrolytic gases in a plastic industry, J. Occup. Health, 2000, 42, 297–303 CrossRef CAS.
- S. I. Madorsky, V. E. Hart, S. Straus and V. A. Sedlak, Thermal degradation of tetrafluoroethylene and hydrofluoroethylene polymers in a vacuum, J. Res. Natl. Bus. Stand., 1953, 51, 327–333 CrossRef CAS.
- R. H. Ellerbrock and H. H. Gerke, FTIR spectral band shifts explained by OM–cation interactions, J. Plant Nutr. Soil Sci., 2021, 184, 388–397 CrossRef CAS.
- W. Mozgawa, The influence of some heavy metals cations on the FTIR spectra of zeolites, J. Mol. Struct., 2000, 555, 299–304 CrossRef CAS.
- M. I. Khan, Q. Chen and J. Zubieta, Hydrothermal synthesis and crystal structure of the trimolybdate, (H3NCH2CH2NH3)Mo3O10, Inorg. Chim. Acta, 1993, 213, 325–327 CrossRef CAS.
- M. Wang, J. You, A. A. Sobol, J. Wang, J. Wu and X. Lv, Temperature-dependent Raman spectroscopic studies of microstructure present in dipotassium molybdate crystals and their melts: Raman studies of K2MonO3n+1 crystal and melts, J. Raman Spectrosc., 2016, 47, 1259–1265 CrossRef CAS.
- L. Seguin, M. Figlarz, R. Cavagnat and J.-C. Lassègues, Infrared and Raman spectra of MoO3 molybdenum trioxides and MoO3·xH2O molybdenum trioxide hydrates, Spectrochim. Acta, Part A, 1995, 51, 1323–1344 CrossRef.
Footnote |
| † Electronic supplementary information (ESI) available. See DOI: https://doi.org/10.1039/d4mr00042k |
| This journal is © The Royal Society of Chemistry 2024 |

