
 Open Access Article
 This Open Access Article is licensed under a Creative Commons Attribution-Non Commercial 3.0 Unported Licence
van der Waals-bonded graphene clusters enhance thermal conductivity of phase-change materials for advanced thermal energy management†
Liwen
Sun‡
ab,
Yandong
Wang‡
ab,
Lu
Chen
ab,
Junfeng
Ying
ab,
Qiuyu
Li
ab,
Li
Fu
 c,
Qingwei
Yan
ab,
Kai
Wu
d,
Chen
Xue
*ab,
Jinhong
Yu
ab,
Nan
Jiang
ab,
Kazuhito
Nishimura
e,
Cheng-Te
Lin
*ab and
Wen
Dai
*ab
c,
Qingwei
Yan
ab,
Kai
Wu
d,
Chen
Xue
*ab,
Jinhong
Yu
ab,
Nan
Jiang
ab,
Kazuhito
Nishimura
e,
Cheng-Te
Lin
*ab and
Wen
Dai
*ab
aKey Laboratory of Advanced Marine Materials, Ningbo Institute of Materials Technology and Engineering, Chinese Academy of Sciences, Ningbo 315201, P. R. China. E-mail: xuechen@nimte.ac.cn; linzhengde@nimte.ac.cn; daiwen@nimte.ac.cn
bCenter of Materials Science and Optoelectronics Engineering, University of Chinese Academy of Sciences, Beijing 100049, P. R. China
cCollege of Materials and Environmental Engineering, Hangzhou Dianzi University, Hangzhou 310018, P. R. China
dCollege of Polymer Science and Engineering, State Key Laboratory of Polymer Materials Engineering, Sichuan University, Chengdu 610065, P. R. China
eAdvanced Nano-processing Engineering Lab, Mechanical Systems Engineering, Kogakuin University, Tokyo 192-0015, Japan
First published on 27th July 2024
Abstract
Organic phase-change materials possess immense application potential, but their low thermal conductivity (≤0.5 W m−1 K−1) severely limits the thermal energy charge/discharge rate, impeding their practical implementation in the field of advanced energy. While incorporating thermally conductive fillers into the phase-change matrix can address this issue, achieving a thermal conductivity exceeding 10 W m−1 K−1 at a filler content below 30 vol% remains challenging, attributed to the absence of a well-designed filler interface and structure. Herein, a strategy for developing planar graphene clusters and subsequently integrating them with phase-change microcapsules to fabricate composites using compression molding was demonstrated. The proposed graphene clusters are formed by closely aligned and overlapping graphene sheets that bond together through van der Waals forces, resulting in a significant decrease in junction thermal resistance within the composites. Combining this interface design with compression-induced construction of a highly oriented structure, the composites achieved a remarkable thermal conductivity of 103 W m−1 K−1 with ≈29 vol% filler addition, enhancing the thermal energy charge/discharge rate by over two orders of magnitude. Furthermore, we demonstrated that the composites possess the essential enthalpy values, competent strength, and ease of shaping, making them applicable across various domains of thermal energy management.
New conceptsConventional approaches select high thermal conductivity graphene (3500–5300 W m−1 K−1) as a filler to increase the thermal conductivity of organic phase change materials (PCMs, κ ≤ 0.5 W m−1 K−1) to accelerate their thermal charging and discharging rates to meet the demands of practical applications. However, due to the high Rjunction between graphene sheets, it remains challenging to achieve thermal conductivity above 10 W m−1 K−1 at filler contents below 30 vol%. Herein, we prepared graphene clusters formed by tightly aligned and overlapping graphene sheets as fillers and combined them with phase change microcapsules (PCMCs) and compression moulding techniques to produce composites that are not only functional but also easy to use (VBGC/PCMCs). By combining this interface design with a compression-induced configuration with a highly oriented structure, the composites achieve a thermal conductivity of 103 W m−1 K−1, a filler addition of ≈29 vol%, and an increase in thermal charge rate of more than two orders of magnitude. Such shape-configurable graphene composites have demonstrated excellent thermal management efficiency in advanced energy fields such as high-power device cooling, photothermal power conversion, and thermal control design of new energy batteries. |
Introduction
Efficient thermal energy management utilizing phase-change materials, based on their inherent heat absorption and release characteristics, has been extensively applied in advanced energy fields, such as high-power device cooling, photo-thermal-electric conversion, new energy battery thermal control design, etc.1–3 Among various phase-change materials, organic solid–liquid phase-change materials have garnered widespread attention in scientific research and technological applications due to their advantages, including high energy density, thermal stability, non-toxicity, good biocompatibility, and cost-effectiveness.4–6 Nonetheless, the low intrinsic thermal conductivity (≤0.5 W m−1 K−1) of organic phase-change materials severely limits their thermal energy charge and discharge rate.7–9 This long-standing bottleneck has emerged as a critical challenge for their applications, gradually evolving into a prominent scientific issue in this field.Introducing highly thermally conductive fillers into phase-change matrices to prepare composites is an effective method for enhancing their thermal conductivity. Among various candidate fillers, graphene holds significant potential for development, not only due to its high intrinsic thermal conductivity (basal-plane: 3500–5300 W m−1 K−1) but also owing to its two-dimensional structural characteristics.10,11 This property allows graphene fillers to achieve interface modulation at multiple scales and structural design spanning from the micro-nano scale in low-dimension to the macro scale in three-dimension (3D).12,13 Numerous studies have demonstrated that to fully exploit the basal-plane thermal conductivity of graphene in the fabrication of highly thermally conductive composites, graphene fillers must satisfy four fundamental requirements: (i) high-quality graphene with high intrinsic thermal conductivity; (ii) relatively high volume fraction in matrices; (iii) low junction thermal resistance between the adjacent graphene sheets; (iv) a highly oriented arrangement of graphene with the basal orientation along the heat transfer direction.14–17
Guided by this design concept, the most effective approach currently considered is to prepare a highly oriented and high-quality 3D graphene framework and then fill its pores with phase-change matrices to obtain composites with enhanced thermal conductivity.9,18,19 For example, Dai et al. developed an anisotropic graphene framework and infused it with polyethylene glycol (PEG), leading to a composite thermal conductivity of 58.6 W m−1 K−1 (13.3 vol%), which represents the current highest achieved value in combining graphene fillers with organic phase-change materials.7 In practical thermal energy management applications, besides the requirement for further enhancement of thermal conductivity, it is also essential to mold composites into specific shapes or process them to establish specialized interfaces for devices.20,21 This application-oriented requirement poses considerable difficulties for the approach of filling graphene framework with phase-change matrices, due to the inherent brittleness of graphene frameworks and the typically soft nature of organic phase-change materials.22 Whether it is customizing the framework shape first and then filling it with phase-change matrices or directly processing the composite, constructing complex shapes or finely controlling the surface morphology is challenging. In contrast to the graphene framework approach, the direct blending of graphene fillers with molten phase-change matrices and subsequent solidification for composite preparation offers inherent advantages for addressing device applications.23 This is due to the ability to customize arbitrary shapes and surface structures through corresponding molds. However, the thermal conductivity of the composite prepared through the blending method is challenging to exceed 10 W m−1 K−1.24–26 This result is primarily attributed to the random distribution of graphene sheets in the phase-change matrices, failing to utilize its basal-plane thermal conductivity.8,23,27 Another crucial factor is that, in the blending process, the inevitable introduction of matrices between adjacent graphene sheets leads to high thermal resistance at the overlapping interface.7,28,29 This ultimately contributes to an increased total thermal resistance within bulk composites. In summary, the graphene framework approach primarily addresses the low thermal conductivity issue of phase-change materials, but encounters difficulties in processing and molding. Conversely, the blending approach is more operationally feasible for shaping, but falls short of thermal conductivity. In response to the practical application requirements for the performance and subsequent processing, both have certain limitations to some extent. Therefore, additional efforts must be directed toward developing phase-change materials that are both high-performance and suitable for practical applications.
Herein, to address this issue, graphene clusters were developed as fillers and directly blended with phase-change microcapsules (PCMCs) to fabricate phase-change composites using a subsequent compression molding technique. The proposed graphene clusters are assembled from highly oriented and overlapped graphene sheets that are bonded through van der Waals (vdW) interactions. This pre-established vdW-bonded interface significantly reduces the junction thermal resistance between adjacent graphene sheets, thereby enhancing nanoscale thermal conduction. As a result, the thermal conductivity of the resultant composites reaches as high as 103 W m−1 K−1 with ≈29 vol% graphene addition, significantly improving thermal energy charge and discharge rate during the phase-change process. Furthermore, through selecting PCMCs and applying integrated compression molding techniques, we have effectively resolved the challenges concerning the processing adaptability, performance reliability, and leakage issues of phase-change materials in practical applications.
Results and discussion
Preparation and structural characterization of VBGC/PCMCs
In the field of graphene-based composites, due to the presence of junctions thermal resistance between adjacent graphene sheets, the excellent thermal conductivity of graphene is challenging to translate into the bulk thermal conductivity of composites effectively.14 To solve this problem, Wang et al. employed a top-down approach to transform graphite flake into worm-like expanded graphite (WEG), elevating the thermal conductivity of phase-change materials to 35.0 W m−1 W−1 (40 wt%).28,30 This result primarily originates from the mutually docking graphene sheets within the WEG, forming a superior pathway for heat transfer, significantly reducing the junction thermal resistance of adjacent fillers. Nevertheless, due to the two-dimensional structure of graphene, the heat transfer area of the interface formed by graphene docking is limited, resulting in constrained thermal transport efficiency. Suppose the docking interface can be replaced with an interface formed by overlapping graphene sheets, which would contribute to an increased heat transfer area at the interface. In that case, the junction thermal resistance between the adjacent graphene sheets will be further reduced. Although synthesizing such a graphene structure is easily achievable through CVD homogeneous growth, the costs are extremely high, and the production capacity may struggle to meet the requirements for preparing composites.31 Thus, even though the concept is straightforward, there are certain challenges in its implementation.To achieve this goal, we propose a bottom-up concept of pre-assembling graphene sheets, which involves liquid-phase assembly of graphene sheets, high-temperature annealing, and uniform fragmentation, as schematically illustrated in Fig. 1a. In the initial stage of the experiment, the assembly of graphene sheets onto the skeleton surface of a porous PU film was achieved by continuously immersing the PU film into a graphene/ethanol solution (10 mg mL−1) through a self-developed roll-to-roll manufacturing setup. As depicted in Fig. 1b and c, the applied PU film, with a thickness of approximately 500 μm, exhibits an open-cell structure characterized by porous sizes ranging from 200 to 400 μm. Owing to the ultrathin nature of graphene sheets (Fig. 1d) and the relatively strong adsorption interaction between graphene and the PU, graphene sheets preferred face-to-face attachment on the surface of the PU skeleton (Fig. 1e–g). Subsequently, high-temperature treatment at 800 °C (1 h) was employed to remove the PU skeleton, resulting in a porous framework composed of interconnected graphene sheets (Fig. 1h–j). Through post-graphitization at 2850 °C (4 h), the quality of the graphene framework can be further improved by repairing structural defects and enlarging the graphene domain size, as evidenced by the Raman and XRD analyses (Fig. S1, ESI†). Finally, we subjected the as-prepared graphene framework to uniform fragmentation, obtaining powdered graphene clusters composed of highly oriented and overlapped graphene sheets (Fig. 1k–m and Fig. S2, ESI†). The specific surface area of the as-prepared planar graphene clusters decreases by 80% compared to the initial graphene sheets, as shown in Fig. 1n. A typical TEM image (Fig. 1o) illustrates that graphene clusters maintain an ultra-thin two-dimensional structure with a lateral size of 35–155 μm (Fig. S2c, ESI†). As the HRTEM and matching SAED exhibited in Fig. 1p and Fig. S2d (ESI†), we observed that the graphene sheets within the graphene cluster are not simply overlapped but have merged into highly compact vdW-bonded interfaces during the liquid-phase self-assembly followed by an extended graphitization process. We designate this type of vdW-bonded graphene cluster as VBGC.
 | ||
| Fig. 1 (a) Schematic illustrating the preparation of graphene clusters. (b) Optical and (c) SEM images of the porous PU film. (d) Typical SEM image of the raw graphene sheets. Optical and SEM images of (e)–(g) graphene-attached PU, (h)–(j) graphene framework and (k–m) graphene clusters. (n) N2 isothermal sorption curves of raw graphene sheets and graphene clusters. (o) and (p) Typical TEM images and the selected area electric diffraction patterns (SAED) of graphene clusters. | ||
To prepare phase-change composites, we employ a compression molding technique to combine as-prepared VBGC with phase-change microcapsules (PCMCs), schematically illustrated in Fig. 2a. During the compacting process, designing different molds facilitates the easy creation of composites with various shapes and surface textures (Fig. 2b and c). In Fig. 2d, the applied PCMCs are prepared through emulsion synthesis, consisting of a paraffin core and a melamine shell, with an average diameter of 2.5 μm (Fig. S3, ESI†). Due to the pressure-induced orientation principle in the compacting process, as the cross-sectional SEM images shown in Fig. 2e and f, PCMCs are embedded into the gaps formed by the highly oriented and horizontally arranged graphene sheets. In Fig. 2g and h, the graphene sheets constituting VBGC are tightly compressed, forming a close encapsulation structure with PCMCs. The orientation of the graphene sheets was examined through one-dimensional XRD analysis. As depicted in Fig. 2i, when an X-ray beam is directed at the top surface of the VBGC/PCMC composites, two prominent diffraction peaks at 26.5° and 54.4° are observed, corresponding to the (002) and (004) crystal planes of graphite, respectively. However, the two characteristic peaks vanished in the XRD pattern obtained from the cross-sectional surface of the same sample, signifying the horizontal alignment of graphene sheets.17 This highly anisotropic characteristic structure was further visually confirmed at the macroscopic scale through two-dimensional wide-angle X-ray diffraction (WAXD) and polarization Raman analysis, as shown in Fig. 2j and k, respectively. By combining the compression molding technique and the application of PCMCs as the matrix, in addition to achieving controlled alignment of graphene sheets, we also effectively addressed the longstanding challenge of phase-change material leakage at high temperatures. In Fig. 2l, in a force-heat coupled environment with heating at 100 °C and a pressure of 500 g, the as-prepared VBGC/PCMC composite can still maintain excellent structural stability, and there is no occurrence of any leakage.
 | ||
| Fig. 2 (a) Schematic illustrating the preparation of VBGC/PCMCs. The as-prepared VBGC/PCMCs with (b) various shapes and (c) surface textures. (d) Typical SEM image of PCMCs. (e) and (f) Typical cross-sectional and (g) and (h) top view SEM images of VBGC/PCMCs. (i) One-dimensional XRD, (j) two-dimensional wide-angle XRD, and (k) polarization Raman analysis of VBGC/PCMCs. (l) Mechanical strength test of VBGC/PCMCs at 100 °C. | ||
Thermal conductivity of VBGC/PCMCs
Based on the structure characterized by the horizontal alignment of graphene sheets, the as-prepared VBGC/PCMCs should exhibit excellent heat transfer performance. Therefore, we conducted tests and analysis on the thermal conductivity of VBGC/PCMCs in different directions, defining the direction consistent with the horizontal orientation as the preferred direction (κpre) and the direction perpendicular to it as the secondary direction (κsec), as shown in Fig. 3a. As a control group, we also measure the thermal conductivity of graphene sheets/PCMCs (GS/PCMCs), which were made from raw graphene sheets (after the same graphitization) and PCMCs, using the same compression molding process as VBGC/PCMCs. As the result shown in Fig. 3b and c, with the increase in filler content, both κpre and κsec of VBGC/PCMCs show a significant upward trend, reaching 103 W m−1 K−1 and 12 W m−1 K−1, respectively, when the filler content goes ≈29 vol%. In contrast, the thermal conductivity of GS/PCMCs is consistently lower than that of VBGC/PCMCs at all filler contents, with values of 9.4 W m−1 K−1 and 2.5 W m−1 K−1 at the same filler addition, respectively. | ||
| Fig. 3 (a) Schematic illustrating the thermal conductivity direction (κpre and κsec) of VBGC/PCMCs. The comparision of (b) κpre and (c) κsec between VBGC/PCMCs and GS/PCMCs. Crosss-sectional SEM image of (d) GS/PCMCs and (e) VBGC/PCMCs. 3D XCT scanning and angle statistics of the filler for the case of (f) and (g) GS/PCMCs and (h) and (i) VBGC/PCMCs. (j) Fitting of the experimental κpre of VBGC/PCMCs and GS/PCMCs based on the Agari model. (k) and (l) TEM images illustrating vdW-bonded interfaces of adjacent graphene sheets within VBGC/PCMCs. (m) The calculated temperature distribution of adjacent graphene sheets with vdW-bonded interface and the interface formed based on the non-bonding vdW interaction through the NEMD simulation. (n) Scheme illustrating the heat-transfer mechanism of the VBGC/PCMCs (o). | ||
We propose that one of the key factors contributing to the higher thermal conductivity of VBGC/PCMCs is the more orderly arrangement of fillers within the matrix compared to GS/PCMCs, as the comparable microstructure depicted in Fig. 3d–i. In the case of GS/PCMCs, the lateral sizes of graphene sheets (AVG: 4.2 μm, Fig. S2a, ESI†) closely approximates the particle diameter of the microcapsules (AVG: 2.5 μm, Fig. S3, ESI†). As the compression process causes a reduction in vertical space, the movement of microcapsules can result in the flipping of graphene sheets, thus inducing numerous short-range disorder structures (Fig. 3d). In contrast, the lateral size of VBGC (AVG: 70 μm, Fig. S2b, ESI†) is significantly larger than that of microcapsules, by which the movement of microcapsules has a minimal impact on the VBGC, thus forming a highly orderly arrangement of graphene sheets (Fig. 3e). Based on the angle statistics obtained through 3D XCT scanning (see Fig. 3f–i), inclination angles of 17.3° and 34.6° were derived for VBGCs and GSs within the matrix, respectively, consistent with the results obtained from microscopic morphology.
If we solely focus on the impact of graphene arrangement on thermal conductivity, VBGC/PCMCs should theoretically exhibit a higher κpre than GS/PCMCs, and κsec should be lower. However, the thermal conductivity presented in Fig. 3b and c reveals that VBGC/PCMCs demonstrate superior heat conduction performance in all directions. Hence, it is reasonable to assume that other mechanisms may contribute to the superior thermal conductivity enhancement of VBGC on the matrix. To conduct a more comprehensive investigation, we performed a qualitative analysis of the experimental thermal conductivity using the Agari heat conduction model:32
| (κpre)n = f × (κfiller)C·n + (1 − f) × (κPCMC)n | (1) |
κfiller = κgraphene![[thin space (1/6-em)]](https://www.rsc.org/images/entities/char_2009.gif) sheets × 〈cos2θ〉 sheets × 〈cos2θ〉 | (2) |
sheets represents the basal-plane thermal conductivity of graphene sheets and is taken as 103 W m−1 K−1 for this case. [θ] is the angle between the graphene sheets and the heat transfer direction, by which 〈cos2θ〉 can be calculated based on angle statistics results from Fig. 3g and i. Accordingly, to investigate the differences in thermal conduction pathways within VBGC/PCMCs and GS/PCMCs, we adjust parameter [C] to align eqn (1) and (2) with experimental data (Fig. S4, ESI†). The detailed calculation and the analysis can be seen in the ESI† (Section S1). According to the matching results in Fig. 3j and Table S1 (ESI†), the thermal conduction pathway formed internally in VBGC/PCMCs (C = 0.987 ± 0.024) exhibits superior heat transfer efficiency compared to GS/PCMCs (C = 0.546 ± 0.019).
The above analysis eliminates the influence of graphene arrangement, so the observed thermal conductivity difference between VBGC/PCMCs and GS/PCMCs is anticipated to arise from distinctions in the interfaces formed by adjacent graphene sheets. In the case of GS/PCMCs, the graphene sheets, initially discrete units, come together through dry contact during the compression process, by which the heat transfer interface between adjacent graphene sheets is established through non-bonding vdW interactions. In contrast, VBGC is formed by overlapping graphene through vdW-bonded interactions, and this feature is also preserved in VBGC/PCMCs. As evidenced by TEM images in Fig. 3k and l, the adjacent graphene sheets merge together to form the interface, giving rise to a tightly stacked arrangement of carbon atoms. Based on the non-equilibrium molecular dynamics (NEMD) simulations (Fig. 3m and Fig. S5, ESI†), the junction thermal conductance of such a vdW-bonded interface (4.54 × 10⁹ W m−2 K−1) is ≈20 times that of the interface formed by non-bonding vdW interactions (2.25 × 10⁸ MW m−2 K−1).
Indeed, the abundance of pre-established vdW-bonded interfaces in VBGC/PCMCs effectively lowers the junction thermal resistance between adjacent graphene sheets. However, this is just one aspect because, during the compression process similar to GS/PCMCs, there are interfaces formed by non-bonding vdW interactions within VBGC/PCMCs, which is also a crucial factor affecting thermal conductivity. To analyze this factor, VBGC was considered as an integral filler, and a nonlinear model proposed by Foygel was used to fit the experimental κpre, as outlined in eqn (3).33,34 The junction thermal resistance (Rjunction) between adjacent VBGCs based on the non-bonding vdW interactions can be calculated using eqn (4).
 | (3) |
 | (4) |
Based on the above analysis, the superior thermal conductivity of VBGC/PCMCs can be understood from multiple scales combined with material characteristics and the structure of VBGC, as illustrated in Fig. 3n. Initially, VBGC undergoes an extended graphitization during preparation to eliminate defects, endowing it with exceptionally high intrinsic quality, thereby establishing the foundation for excellent heat transfer performance. Additionally, in VBGC/PCMCs, beyond establishing vdW-bonded interfaces with superior heat transfer performance, our efforts have included optimizing the interfaces of non-vdW bonding interactions between adjacent VBGCs. These interface engineerings significantly reduce junction thermal resistance between adjacent fillers, establishing numerous efficient phonon transport channels within VBGC/PCMCs. Finally, by utilizing pressure-induced orientation effects, a highly oriented arrangement of graphene sheets is achieved, fully using its ultrahigh basal-plane thermal conductivity. With the collaborative influence of these three factors, the thermal conductivity of VBGC/PCMCs exceeds the 100 W m−1 K−1 level with a filler content lower than 30 vol%. To the best of our knowledge, this result currently stands unparalleled in graphene-based composites and is significantly ahead of others (Fig. 3o and Table S3, ESI†).8,14,15,18,19,29,30,35–67 It is essential to highlight that the preparation we employed does not involve constructing a continuous thermal pathway through the 3D graphene framework; fundamentally, it is a blending process. Therefore, the production of high-performance thermally conductive composite still originates from the rational design of filler structure and interfaces.
Phase-change capability of VBGC/PCMCs
As phase-change materials, apart from thermal conductivity, the capability to store heat stands out as a critical performance for practical applications. Accordingly, the differential scanning calorimetry (DSC) analysis was employed to measure the endothermic/exothermic curves of VBGC/PCMCs. In Fig. 4a and Fig. S6a (ESI†), as the filler content increases, the phase transition enthalpy (ΔHm) of VBGC/PCMC exhibits a decreasing trend, reaching 94.2 J g−1 with ≈29 vol% graphene addition. This value achieved is about 48% of the pure PCMC (196 J g−1), primarily because graphene in the composite did not undergo a phase transition process. Furthermore, we evaluated the influence of the enhanced thermal conductivity of the VBGC/PCMC on its phase transition speed by measuring the endothermic curves at different DSC heating rates. As DSC curves comparison shows in Fig. 4b and c, the onset melting temperature (Tonset) of the VBGC/PCMC remained nearly identical to that of pure PCMC. This result indicates that embedding PCMC into the interior of VBGC to form an encapsulated structure hardly affects its intrinsic solid–liquid phase transition. In contrast, the end melting temperature (Tend) of VBGC/PCMC (29 vol%) experiences a notable decrease of approximately 11 °C compared to that of pure PCMC at a heating rate of 10 °C min−1. Moreover, as shown in Fig. 4d and Fig. S6b and c (ESI†), this temperature difference (ΔTend) is further amplified to 19 °C as the heating rate increases to 50 °C min−1. We propose that the accelerated phase-change speed of VBGC/PCMC can be attributed to its superior thermal conductivity, primarily stemming from the well-organized VBGC serving as efficient heat pathways around the PCMC. | ||
| Fig. 4 (a) DSC curves of PCMC and VBGC/PCMCs. (b) Endothermic scan curves for PCMC and VBGC/PCMCs (≈29 vol%) at a DSC heating rate of 10 °C min−1, with the corresponding differential result showing in (c). (d) Tonset and Tend of PCMC and VBGC/PCMCs (≈29 vol%) versus the DSC heating rate. (e) Schematic of the Icepak simulation models and (f) the calculated transient temperature distribution for PCMC and VBGC/PCMCs (≈29 vol%). (g) A comparison of the thermal conductivity and the thermal effusivity of our VBGC/PCMCs and with the reported phase-change composites (Table S4, ESI†). The variational thermal conductivity of VBGC/PCMCs during (h) the thermal cycling and (i) 3000 rapid thermal shocks. (j) DSC curve during 20 heating cycles. | ||
To delve deeper into this heat transfer process, we employed finite element modeling (FEM) using a fluid dynamics software of Icepak to analyze the transient thermal response of VBGC/PCMC and pure PCMC. In Fig. 4e, a thermal conductivity model based on the structural characteristics of the composite was established. The initial temperature of the model is set to 20 °C, and constant temperature boundary conditions of 40 °C are applied to the sides of the model. Further specifics can be found in the ESI† (Fig. S7). In Fig. 4f, for the case of VBGC/PCMC, the time required for the temperature measurement point to increase by 2 °C (T1 = 22 °C) is only 4.26 ms, which is more than two orders of magnitude lower than that of the pure PCMC (3.05 s, T1 = 22 °C). Furthermore, from the simulated temperature contour map, it is clearly observed that the VBGC thermal pathways surrounding the PCMC significantly enhance the efficiency of heat conduction from the surface to the interior (Fig. 4f). As a result, when the temperature measurement point approaches steady-state (T1 ≈ T2 ≈ 39.8 °C), the thermal response times for VBGC/PCMC and pure PCMC are 0.4 s and 60 s, respectively (Fig. S7c and f, ESI†). This result conclusively illustrates that incorporating VBGC in the composite with enhanced thermal conductivity plays a crucial role in achieving a faster phase transition speed and shorter delay time compared to that of pure PCMC.
For phase-change materials, thermal effusivity 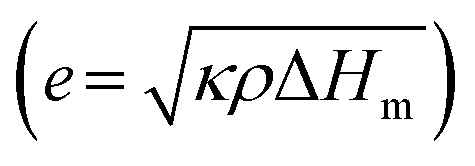 serves as a metric to assess the capacity for exchanging thermal energy with the surroundings, where κ, ρ, and ΔHm are the thermal conductivity, density and phase-change enthalpy, respectively. As the comparison shown in Fig. 4g and Table S4 (ESI†), based on the thermal conductivity of 103 W m−1 K−1, the VBGC/PCMC (≈29 vol%) exhibits the highest thermal effusivity when compared to currently reported various phase-change composites.8,18,19,28,30,35,37,40,47,51,56,58–62,64–66,68–77 In addition to intrinsic performance characteristics, we further investigated the cyclic stability of VBGC/PCMC. Fig. 4h and i illustrate the variations in thermal conductivity for VBGC/PCMC throughout the heating/cooling cycle and 3000 rapid thermal shocks, respectively. Notably, the thermal conductivity degradation is below 1.5%, indicating satisfactory long-term operational reliability. In Fig. 4j, during 20 endothermic/exothermic cycle tests, the fluctuation of phase transition enthalpy is only 2.4%, demonstrating reversible charging/discharging capacity for the composite for practical applications.
Thermal energy management of VBGC/PCMCs
Due to the combination of high thermal conductivity, competent thermal effusivity, and excellent stability, VBGC/PCMCs hold promising potential for management applications in advanced energy fields. In practical applications, apart from these intrinsic properties, it is also crucial to process composites customized for the operating conditions of the application device, including irregular interfaces, surface textures, or specific shapes. This application-oriented requirement poses significant challenges for the casting method that involves filling the graphene framework with phase-change matrices. However, it aligns well with the compression molding technique employed in producing VBGC/PCMCs. As proof of concept, we have selected three commonly encountered applications, including high-power device cooling, solar-thermal conversion, and battery thermal control design, for demonstration purposes. In the presentations of these applications, all referred VBGC/PCMCs correspond to the sample with a graphene content of ≈29 vol%.Initially, VBGC/PCMCs exhibit an anisotropic thermal conductivity, with the κpre up to 103 W m−1 K−1, which allows VBGC/PCMCs to serve as an effective heat spreader for cooling high-power electronic devices. As a demonstration in Fig. 5a–d and Fig. S8 (ESI†), a plate-shaped VBGC/PCMC was prepared and encapsulated within a light-emitting diode (LED) lamp. To facilitate the connection between the heat spreader and the irregular Al heat sink, a specially designed mold was used during the compressing process to achieve a compatible interface directly on the VBGC/PCMCs surface (Fig. 5b and c). As the assembled device shown in Fig. 5d, when the LED is activated, the heat generated is transmitted from the heater to the heat sink through the heat spreader, and the associated heater temperature (Theater) is gathered using a thermocouple. In addition, we carried out comparative performance tests using three other heat spreaders with identical shapes and specifications, including Al2O3 (≈ 28 W m−1 K−1), Si3N4 (≈ 65 W m−1 K−1), and AlN (≈ 181 W m−1 K−1).
 | ||
| Fig. 5 (a) Schematic illustrating the test platform for cooling LED using a heat spreader. (b)–(d) Optical images showing the heat spreader prepared using VBGC/PCMC. (e) Temperature evolution and (f) the heater temperature as a function of power density during the steady-state testing process. (g) Temperature evolution and (h) the heater temperature as a function of power density during the high-power transient thermal shock process. (i) Simulated temperature distribution and (j) the heater temperature versus the thermal conductivity of the heat spreader. (k) Thermal shock stability in cyclic heating/cooling tests using VBGC/PCMC as a heat spreader. | ||
In the actual testing process, we evaluated the heat dissipation performance of four heat spreaders under two conditions: “steady-state heating of the heater” and “high-power transient thermal shock”. The results for the former are illustrated in Fig. 5e and f, in which the heater operates continuously for 30 minutes at different power densities, ensuring that the heat dissipation process reaches a stable state. In Fig. 5f, the Theater under all heat spreader cases almost linearly increases with the elevation of power density. And the cooling efficiency of the four spreaders is consistent with their respective thermal conductivity rankings.
Fig. 5g and h display the heat response curves for the four spreaders under the high-power transient thermal shock (with the heater operating for 5s). Notably, when VBGC/PCMC is employed as the spreader, the Theater exhibits a trend that is distinctly different from the other three heat counterparts and the steady-state process (Fig. 5f). At low power densities (≤8 W cm−2), the Theater shows a linear increase; however, as the power density surpasses 16 W cm−2, the Theater elevation rate gradually diminishes. Even when the power density reaches 32 W cm−2, the cooling effect of the VBGC/PCMC heat spreader surpasses that of AlN, despite its lower thermal conductivity. We propose that the unusual heat dissipation behaviour of VBGC/PCMC primarily stems from its phase-change characteristics. Through its solid–liquid phase change capabilities, VBGC/PCMC rapidly absorbs the heat produced within a short duration during transient thermal shock processes, thereby effectively suppressing the sustained temperature rise of the heater. Without considering the phase-change process, we utilized finite element analysis to compute the correlation between the thermal conductivity of the heat spreader and its cooling efficiency (Fig. S9 and S10, ESI†). As shown in Fig. 5i and j, the combination of κpre at 103 W m−1 K−1 and phase-change capability results in VBGC/PCMC achieving a transient heat transfer efficiency comparable to an isotropic heat spreader with a thermal conductivity of 353 W m−1 K−1. This performance significantly surpasses AlN and approaches the effectiveness of copper. In Fig. 5k, we have also demonstrated that the phase-change heat transfer process of VBGC/PCMC exhibits excellent stability, as evidenced by a temperature difference consistently below 1 °C during 3000 thermal shock cycles. The performance of suppressing transient temperature rise through phase change proves highly valuable in protecting devices when subjected to surge current shocks, offering significant practical implications.
In addition to addressing transient thermal shocks in the heat dissipation process, VBGC/PCMC with a combination of high thermal conductivity and phase-change properties can be employed for solar-thermal conversion. In actual use, to maximize the conversion efficiency, the solar-thermal energy conversion materials not only require high thermal conductivity but also need to exhibit excellent light absorption capabilities for solar radiation. To achieve this goal, besides having high intrinsic absorbance for the materials, it is also possible to create specific surface textures on the side exposed to sunlight.19,78 Building upon this principle, as the structure and morphology illustrated in Fig. 6a, we have crafted pyramid-like textures on the surface of VBGC/PCMCs (P-VBGC/PCMCs) by designing corresponding mold (Fig. S11, ESI†). In Fig. 6b, the absorbance spectra reveal a light absorption of 0.98 in the 350–1850 nm wavelength range for the surface of P-VBGC/PCMCs, demonstrating a noteworthy enhancement compared to the absorbance of VBGC/PCMCs with a flat surface (F-VBGC/PCMCs).
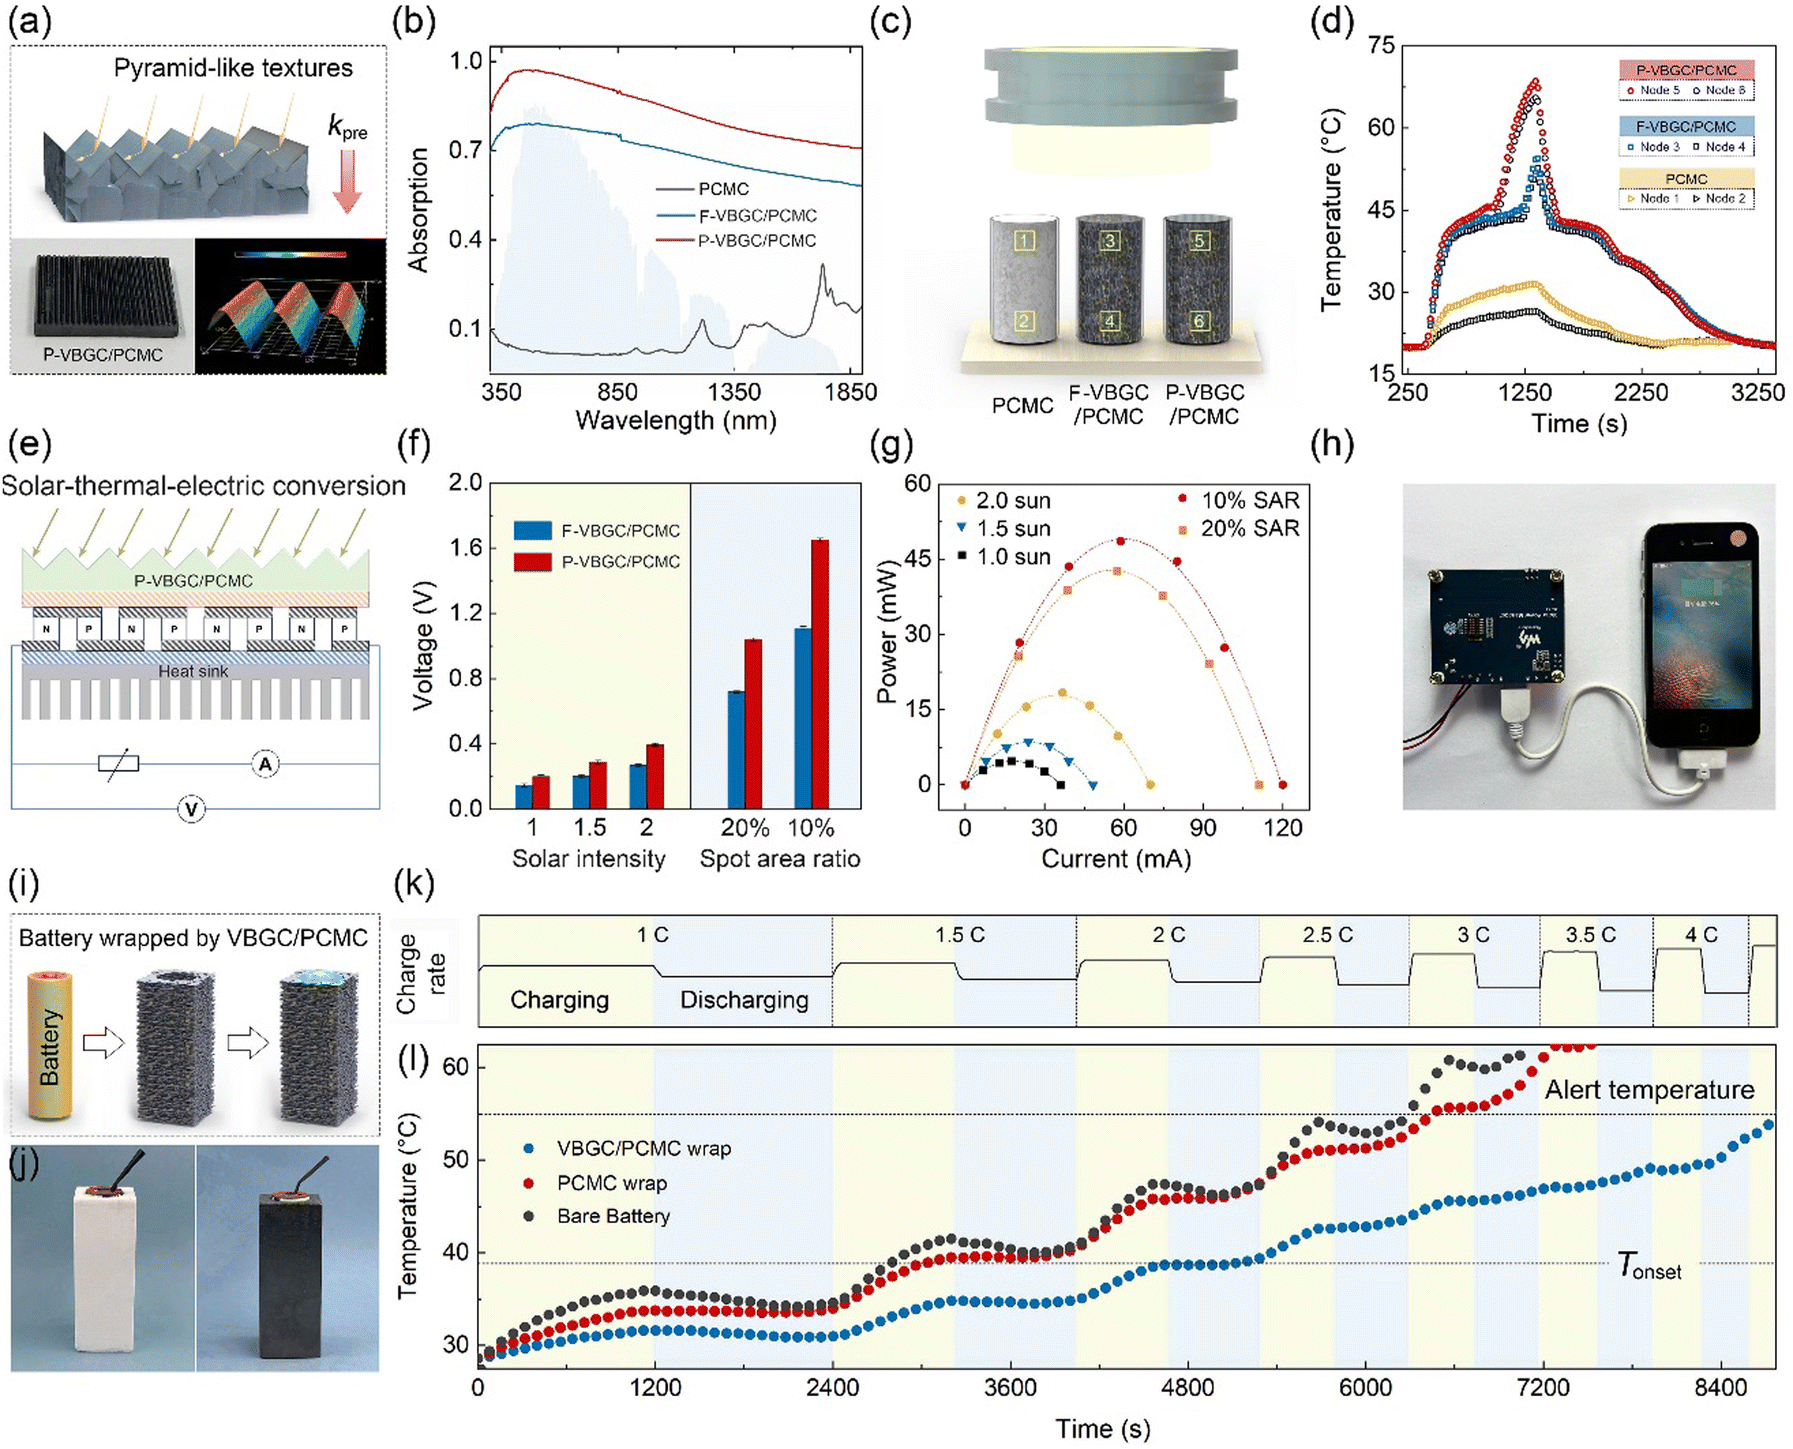 | ||
| Fig. 6 (a) Structure and morphology of P-VBGC/PCMCs. (b) Vis and near IR absorption spectra of PCMC, F-VBGC/PCMCs and P-VBGC/PCMCs. (c) Schematic illustrating the solar-thermal energy conversion measurement with the corresponding temperature evolution curves shown in (d). (e) Schematic illustrating the solar-thermal-electric energy conversion measurement with the corresponding open-circuit voltages shown in (f). (g) The power-current curves of the thermoelectric device. (h) Using a thermoelectric device to provide power for charging a mobile phone. (i) Schematic illustrating the preparation of battery warp using VBGC/PCMC, with the obtained sample showing (j). (k) Battery charge–discharge rate curve, with the corresponding battery temperature rise curve showing in (l). | ||
To confirm its practical applicability, we exposed P-VBGC/PCMCs, F-VBGC/PCMCs, and pure PCMC of identical dimensions to sunlight (Fig. 6c), analysing and contrasting their temperature elevation processes and phase-change behaviours. In Fig. 6d, under solar irradiation, the two VBGC/PCMCs exhibit a faster temperature rise rate and lower temperature differentials compared to pure PCMCs, highlighting the crucial role of the high thermal conductivity of phase-change materials in achieving outstanding photothermal conversion capability. When comparing P-VBGC/PCMCs and F-VBGC/PCMCs, it is observed that, although the two have the same thermal conductivity, the enhanced heat absorption ability of pyramid-like textures on the P-VBGC/PCMCs surface results in a higher surface temperature, facilitating a quicker phase change completion.
Based on this result, the combination of P-VBGC/PCMCs with semiconductor thermoelectric devices to achieve solar-thermal-electric conversion was demonstrated (Fig. 6e). As the results shown in Fig. 6f and Fig. S12 (ESI†), due to the improved photothermal conversion efficiency resulting from the pyramid surface, P-VBGC/PCMCs demonstrate open-circuit voltages higher than F-VBGC/PCMCs under different intensities of sunlight exposure. Specifically, under concentrated solar illumination with the spot area ratio (SAR) of 10%, the open-circuit voltage with the P-VBGC/PCMCs as the solar-thermal energy conversion materials reaches 1.6 V, significantly superior to the previously reported results.19,34,78–83Fig. 6g illustrates the actual output of the solar thermoelectric generator under load, with a maximum power of 50 mW. This power level enables the driving of various electronic devices (Fig. 6h and Fig. S13, ESI†), demonstrating practical applications of clean solar energy.
Due to the dual capabilities of phase-change heat absorption and transient heat transfer, VBGC/PCMCs can even be engineered into a thermal control component for lithium-ion batteries through appropriate design (Fig. 6i).84 Taking the 18650 battery as an example, we achieved the integrated molding of an individual cell thermal control wrap through customized mold design (Fig. S14, ESI†). As the prepared warp shown in Fig. 6j, the white and black wraps were prepared by pure PCMC and VBGC/PCMCs, respectively. By employing cycling and progressively increasing charge–discharge rate to induce battery heating (Fig. 6k), we observed that during the 2.5C discharge process of the bare battery, the temperature exceeded the standard cautionary threshold for regular usage (Fig. 6l). The pure PCMC wrap demonstrates a noticeable cooling effect at low charge–discharge rates, but its effectiveness diminishes at higher rates, potentially transitioning into a heat preservation effect. This outcome stems from the low thermal conductivity of pure PCMC, which makes it challenging to rapidly conduct the substantial heat generated during the high charge–discharge rates from the contact surface to the exterior of the warp, thereby impeding the overall phase transition. In contrast, despite VBGC/PCMCs having a lower phase-change enthalpy compared to pure PCMC, its high thermal conductivity enables the efficient transfer of heat from the battery to the entire warp. In turn, it allows the overall phase transition of the warp to mitigate the battery temperature rise, maintaining the battery temperature below the cautionary threshold even during a 4C discharge process. Naturally, the thermal control design utilizing VBGC/PCMC wrap can effectively extend the operational duration of the battery and guarantee its high operational performance.
Conclusion
In response to the challenge of the low thermal conductivity posed by organic phase-change materials that result in limited application, the VBGCs were synthesized as fillers to incorporate with PCMCs for developing phase-change composites based on compression molding technique. The VBGCs presented here consist of highly oriented graphene sheets bonded through vdW forces, which play a crucial role in diminishing the junction thermal resistance within the composites, leading to a substantial enhancement in nanoscale thermal conduction. The selection of PCMCs as the matrix not only prevents the molten phase-change material from infiltrating the overlapping gaps between adjacent graphene layers, ensuring high-performance stability, but also addresses the leakage issue commonly encountered in their practical applications. Finally, the utilization of compression molding, while achieving a highly oriented arrangement of graphene fillers, also provides the flexibility to customize various shapes and surface morphologies to meet the specific requirements of different application scenarios. By integrating the specifically designed filler and implementing the associated processes, the resultant VBGC/PCMCs combine superior thermal conductivity (103 W m−1 K−1), essential enthalpy values, competent strength, and ease of shaping. As a result, the VBGC/PCMC composites demonstrate exceptional thermal management efficiency in advanced energy domains such as photo-thermal-electric conversion, high-power device cooling, and new energy battery thermal control design.Experimental section
Materials
Graphene sheets were prepared by intercalating and exfoliating graphite, and provided by Ningbo Morsh Technology Co., Ltd (China). The porous polyurethane (PU) film was acquired from Suzhou Shutao Medical Supplies Co., Ltd in China. Urea, melamine, formaldehyde aqueous solution, and ethanol were procured from Sinopharm Chemical Reagent Co., Ltd. All chemicals employed in the study were of analytical reagent grade and were utilized without additional purification.Preparation of graphene clusters
First, we combined the conventional “dipping and drying” method with a continuous roll-to-roll process to immerse the porous PU film in a graphene/ethanol (10 mg mL−1) dispersion. During this process, due to the strong interaction between graphene sheets and PU, graphene sheets tend to adhere to the surface of the PU skeleton in a layer-by-layer stacking manner. After drying at 60 °C for 2 h, a graphene/PU composite film can be obtained. Subsequently, the as-prepared graphene/PU composite film underwent thermal annealing at 800 °C (1 hour) in a vacuum to eliminate the PU, followed by graphitization at 2850 °C (4 hours) in an argon atmosphere to achieve the graphene framework. Finally, to obtain powdered graphene clusters, a commercial crusher was utilized to crush the graphene framework at 2000 revolutions for 1 minute.Preparation of graphene PCMC
First, a specific proportion of urea, melamine, and formaldehyde aqueous solution (with a molar ratio of 1:2:8) is stirred in deionized water at 70 °C for 40 minutes to prepare a shell precursor solution. Then, an emulsifier (span-80 and SDS) and finely sliced paraffin wax are sequentially added to deionized water. This mixture is then uniformly emulsified at a speed of 800 rpm for 10 min, resulting in a homogeneous paraffin emulsion (PH = 3.5). The prepared shell precursor solution is meticulously blended into the paraffin emulsion, which is subjected to a continuous polymerization process at 70 °C for a duration of 180 min. The process concludes with the creation of a PCMC emulsion. Finally, the PCMC powder was successfully prepared by employing a method of deionized water washing and air drying.
Preparation of VBGC/PCMCs
Initially, a high-speed mixer (DAC 150.1 FVZ-K, FlackTek, Inc., Germany) was employed to blend the as-prepared VBGC and PCMC for 5 minutes at a rotational speed of 3500 rpm, yielding a homogeneous mixture of VBGCs and PCMCs. Then, we placed a measured quantity of the mixture into stainless steel molds and subjected it to compression molding to prepare VBGC/PCMCs. The samples for thermal conductivity measurements were prepared as discs under a pressure of 10 MPa, while other samples were fabricated using custom molds of different shapes under the same pressure.Characterizations
The morphology of VBGC and VBGC/PCMC composites was examined utilizing a scanning electron microscope (SEM, Regulus 8230, Hitachi, Japan) and X-ray computed tomography (CT, Xradia 610, Carl Zeiss, Germany). Transmission electron microscopy (TEM, Talos F200X, Thermo Fisher Scientific Inc., USA), Raman spectroscopy (Reflex Raman System, utilizing a laser wavelength of 532 nm), and X-ray diffraction (XRD, Advance D8, Bruker, Germany) employing Cu Kα radiation (λ = 1.5406 Å) were utilized to characterize the defects, crystallinity, and chemical composition of the VBGCs, respectively. The specific surface area of raw graphene sheets and VBGC was measured by a specific surface area adsorption instrument (ASAP2460, TA Instruments, USA). The thermal conductivity of the VBGC/PCMC composites can be determined through the equation λ = α × Cp × ρ. Here, thermal diffusivity (α) was measured using the Hyper Flash laser thermal conductivity meter (LFA467, NETZSCH, Germany), specific heat capacity (Cp) was assessed with a differential scanning calorimeter (DSC) (PYRIS Diamond™, PerkinElmer, USA), and density (ρ) was determined using the drainage method based on Archimedes’ principle. The phase change enthalpy and phase change temperature of VBGC/PCMC were measured by differential scanning calorimeter (DSC) (PYRIS Diamond™, PerkinElmer, USA). All infrared (IR) images presented in the results were captured using an infrared camera (Fluke, Ti400, USA).Author contributions
Liwen Sun and Yandong Wang contributed equally to this work for conceiving and designing the preliminary experiments. Wen Dai proposed the original concept, experimental approach, and contributed to writing and revising the manuscript throughout all stages. Chen Xue and Cheng-Te Lin supervised the project and conceptualized the research. Lu Chen provided the NEMD simulation and corresponding data analysis. Junfeng Ying and Qiuyu Li measured partial thermal properties. Li Fu and Qingwei Yan performed mainly characterizations of VBGC including Raman and XRD. Kai Wu provided the heat-transfer mechanism explanation of the VBGC/PCMCs. Jinhong Yu carried out the finite element analysis to compare the transient response rate of VBGC/PCMCs and dispersed GS/PCMCs. Nan Jiang and Kazuhito Nishimura provided some constructive writing thoughts of the manuscript and supervised this study. All authors participated in proofreading.Data availability
The data that support the findings of this study are available within the paper and its ESI,† or from the corresponding authors on request.Conflicts of interest
There are no conflicts to declare.Acknowledgements
The authors are grateful for the financial support by the National Key R&D Program of China (2022YFA1203100, 2022YFB3706602, 2021YFB3701801), the National Natural Science Foundation of China (52102055, 52272053, 52302120), Ningbo Key Scientific and Technological Project (2021Z120, 2021Z115, 2022Z084, 2022Z191), the Yongjiang Talent Introduction Programme of Ningbo (2021A-037-C, 2021A-108-G), the Youth Fund of Chinese Academy of Sciences (JCPYJ-22030), China Postdoctoral Science Foundation (2020M681965, 2022M713243), CAS Youth Innovation Promotion Association (2020301), Science and Technology Major Project of Ningbo (2021ZDYF020196, 2021ZDYF020198), the Project of Chinese Academy of Science (XDA22020602, ZDKYYQ2020001), and Ningbo 3315 Innovation Team (2019A-18-C).Notes and references
- G. G. D. Han, H. Li and J. C. Grossman, Nat. Commun., 2017, 8, 1446 CrossRef PubMed.
- Z. Wang, Z. Tong, Q. Ye, H. Hu, X. Nie, C. Yan, W. Shang, C. Song, J. Wu, J. Wang, H. Bao, P. Tao and T. Deng, Nat. Commun., 2017, 8, 1478 CrossRef PubMed.
- J. Hansson, T. M. J. Nilsson, L. Ye and J. Liu, Int. Mater. Rev., 2018, 63, 22–45 CrossRef CAS.
- K. Kant, A. Shukla and A. Sharma, Sol. Energy Mater. Sol. Cells, 2017, 172, 82–92 CrossRef CAS.
- P. Bose and V. A. Amirtham, Renewable Sustainable Energy Rev., 2016, 65, 81–100 CrossRef CAS.
- R. K. Sharma, P. Ganesan, V. V. Tyagi, H. S. C. Metselaar and S. C. Sandaran, Energy Convers. Manage., 2015, 95, 193–228 CrossRef CAS.
- W. Dai, L. Lv, T. Ma, X. Wang, J. Ying, Q. Yan, X. Tan, J. Gao, C. Xue, J. Yu, Y. Yao, Q. Wei, R. Sun, Y. Wang, T.-H. Liu, T. Chen, R. Xiang, N. Jiang, Q. Xue, C.-P. Wong, S. Maruyama and C.-T. Lin, Adv. Sci., 2021, 8, 2003734 CrossRef CAS PubMed.
- P. Min, J. Liu, X. Li, F. An, P. Liu, Y. Shen, N. Koratkar and Z.-Z. Yu, Adv. Funct. Mater., 2018, 28, 1805365 CrossRef.
- K. Yuan, J. Shi, W. Aftab, M. Qin, A. Usman, F. Zhou, Y. Lv, S. Gao and R. Zou, Adv. Funct. Mater., 2020, 30, 1904228 CrossRef CAS.
- A. A. Balandin, S. Ghosh, W. Bao, I. Calizo, D. Teweldebrhan, F. Miao and C. N. Lau, Nano Lett., 2008, 8, 902–907 CrossRef CAS PubMed.
- X. Xu, L. F. C. Pereira, Y. Wang, J. Wu, K. Zhang, X. Zhao, S. Bae, C. Tinh Bui, R. Xie, J. T. L. Thong, B. H. Hong, K. P. Loh, D. Donadio, B. Li and B. Özyilmaz, Nat. Commun., 2014, 5, 3689 CrossRef CAS PubMed.
- W. Dai, X.-J. Ren, Q. Yan, S. Wang, M. Yang, L. Lv, J. Ying, L. Chen, P. Tao, L. Sun, C. Xue, J. Yu, C. Song, K. Nishimura, N. Jiang and C.-T. Lin, Nano-Micro Lett., 2022, 15, 9 CrossRef PubMed.
- Z. Sun, S. Fang and Y. H. Hu, Chem. Rev., 2020, 120, 10336–10453 CrossRef CAS PubMed.
- P. Liu, X. Li, P. Min, X. Chang, C. Shu, Y. Ding and Z.-Z. Yu, Nano-Micro Lett., 2020, 13, 22 CrossRef PubMed.
- X.-H. Li, P. Liu, X. Li, F. An, P. Min, K.-N. Liao and Z.-Z. Yu, Carbon, 2018, 140, 624–633 CrossRef CAS.
- Q. Yan, J. Gao, D. Chen, P. Tao, L. Chen, J. Ying, X. Tan, L. Lv, W. Dai, F. E. Alam, J. Yu, Y. Wang, H. Li, C. Xue, K. Nishimura, S. Wu, N. Jiang and C.-T. Lin, Nanoscale, 2022, 14, 11171–11178 RSC.
- J. Ying, X. Tan, L. Lv, X. Wang, J. Gao, Q. Yan, H. Ma, K. Nishimura, H. Li, J. Yu, T.-H. Liu, R. Xiang, R. Sun, N. Jiang, C. Wong, S. Maruyama, C.-T. Lin and W. Dai, ACS Nano, 2021, 15, 12922–12934 CrossRef CAS PubMed.
- Y. Lin, Q. Kang, H. Wei, H. Bao, P. Jiang, Y.-W. Mai and X. Huang, Nano-Micro Lett., 2021, 13, 180 CrossRef CAS PubMed.
- H.-Y. Zhao, C. Shu, X. Wang, P. Min, C. Li, F.-L. Gao, X. Li and Z.-Z. Yu, Adv. Funct. Mater., 2023, 33, 2302527 CrossRef CAS.
- H. E. Ahmed, B. H. Salman, A. S. Kherbeet and M. I. Ahmed, Int. J. Heat Mass Transfer, 2018, 118, 129–153 CrossRef.
- N. H. Naqiuddin, L. H. Saw, M. C. Yew, F. Yusof, T. C. Ng and M. K. Yew, Renewable Sustainable Energy Rev., 2018, 82, 901–914 CrossRef.
- M. M. Umair, Y. Zhang, K. Iqbal, S. Zhang and B. Tang, Appl. Energy, 2019, 235, 846–873 CrossRef CAS.
- M. Li and B. Mu, Appl. Energy, 2019, 242, 695–715 CrossRef CAS.
- G. Xin, H. Sun, S. M. Scott, T. Yao, F. Lu, D. Shao, T. Hu, G. Wang, G. Ran and J. Lian, ACS Appl. Mater. Interfaces, 2014, 6, 15262–15271 CrossRef CAS PubMed.
- R. J. Warzoha and A. S. Fleischer, ACS Appl. Mater. Interfaces, 2014, 6, 12868–12876 CrossRef CAS PubMed.
- U. B. Shahid and A. Abdala, Energy Storage Mater., 2021, 34, 365 CrossRef.
- Q. Zhu, P. J. Ong, S. H. A. Goh, R. J. Yeo, S. Wang, Z. Liu and X. J. Loh, Nano Mater. Sci., 2023, 5, 247 CrossRef.
- S. Wu, T. Li, Z. Tong, J. Chao, T. Zhai, J. Xu, T. Yan, M. Wu, Z. Xu and H. Bao, Adv. Mater., 2019, 31, 1905099 CrossRef CAS PubMed.
- Z. Wu, C. Xu, C. Ma, Z. Liu, H.-M. Cheng and W. Ren, Adv. Mater., 2019, 31, 1900199 CrossRef PubMed.
- T. Li, M. Wu, S. Wu, S. Xiang, J. Xu, J. Chao, T. Yan, T. Deng and R. Wang, Nano Energy, 2021, 89, 106338 CrossRef CAS.
- H. Sun, X. Li, Y. Li, G. Chen, Z. Liu, F. E. Alam, D. Dai, L. Li, L. Tao, J.-B. Xu, Y. Fang, X. Li, P. Zhao, N. Jiang, D. Chen and C.-T. Lin, Chem. Mater., 2017, 29, 7808–7815 CrossRef CAS.
- Y. Agari and T. Uno, J. Appl. Polym. Sci., 1986, 32, 5705–5712 CrossRef CAS.
- M. Foygel, R. Morris, D. Anez, S. French and V. Sobolev, Phys. Rev. B: Condens. Matter Mater. Phys., 2005, 71, 104201 CrossRef.
- X. Zeng, Y. Yao, Z. Gong, F. Wang, R. Sun, J. Xu and C.-P. Wong, Small, 2015, 11, 6205–6213 CrossRef CAS PubMed.
- J. Yang, X. Li, S. Han, R. Yang, P. Min and Z.-Z. Yu, J. Mater. Chem. A, 2018, 6, 5880–5886 RSC.
- M. Qin, Y. Xu, R. Cao, W. Feng and L. Chen, Adv. Funct. Mater., 2018, 28, 1805053 CrossRef.
- J. Yang, G.-Q. Qi, Y. Liu, R.-Y. Bao, Z.-Y. Liu, W. Yang, B.-H. Xie and M.-B. Yang, Carbon, 2016, 100, 693–702 CrossRef CAS.
- G. Lian, C.-C. Tuan, L. Li, S. Jiao, Q. Wang, K.-S. Moon, D. Cui and C.-P. Wong, Chem. Mater., 2016, 28, 6096–6104 CrossRef CAS.
- J. Gong, Z. Liu, J. Yu, D. Dai, W. Dai, S. Du, C. Li, N. Jiang, Z. Zhan and C.-T. Lin, Composites, Part A, 2016, 87, 290–296 CrossRef CAS.
- J. Yang, X. Li, S. Han, Y. Zhang, P. Min, N. Koratkar and Z.-Z. Yu, J. Mater. Chem. A, 2016, 4, 18067–18074 RSC.
- H. S. Kim, H. S. Bae, J. Yu and S. Y. Kim, Sci. Rep., 2016, 6, 26825 CrossRef CAS PubMed.
- A. M. Marconnet, N. Yamamoto, M. A. Panzer, B. L. Wardle and K. E. Goodson, ACS Nano, 2011, 5, 4818–4825 CrossRef CAS PubMed.
- Z. Barani, A. Mohammadzadeh, A. Geremew, C.-Y. Huang, D. Coleman, L. Mangolini, F. Kargar and A. A. Balandin, Adv. Funct. Mater., 2020, 30, 1904008 CrossRef CAS.
- X. Shen, Z. Wang, Y. Wu, X. Liu, Y.-B. He, Q. Zheng, Q.-H. Yang, F. Kang and J.-K. Kim, Mater. Horiz., 2018, 5, 275–284 RSC.
- H. Hou, W. Dai, Q. Yan, L. Lv, F. E. Alam, M. Yang, Y. Yao, X. Zeng, J.-B. Xu, J. Yu, N. Jiang and C.-T. Lin, J. Mater. Chem. A, 2018, 6, 12091–12097 RSC.
- X. Shen, Z. Wang, Y. Wu, X. Liu, Y.-B. He and J.-K. Kim, Nano Lett., 2016, 16, 3585–3593 CrossRef CAS PubMed.
- I. Kholmanov, J. Kim, E. Ou, R. S. Ruoff and L. Shi, ACS Nano, 2015, 9, 11699–11707 CrossRef CAS PubMed.
- W. Dai, J. Yu, Y. Wang, Y. Song, F. E. Alam, K. Nishimura, C.-T. Lin and N. Jiang, J. Mater. Chem. A, 2015, 3, 4884–4891 RSC.
- H. Jung, S. Yu, N.-S. Bae, S. M. Cho, R. H. Kim, S. H. Cho, I. Hwang, B. Jeong, J. S. Ryu, J. Hwang, S. M. Hong, C. M. Koo and C. Park, ACS Appl. Mater. Interfaces, 2015, 7, 15256–15262 CrossRef CAS PubMed.
- M. Shtein, R. Nadiv, M. Buzaglo, K. Kahil and O. Regev, Chem. Mater., 2015, 27, 2100–2106 CrossRef CAS.
- H. Ji, D. P. Sellan, M. T. Pettes, X. Kong, J. Ji, L. Shi and R. S. Ruoff, Energy Environ. Sci., 2014, 7, 1185–1192 RSC.
- Q. Li, Y. Guo, W. Li, S. Qiu, C. Zhu, X. Wei, M. Chen, C. Liu, S. Liao, Y. Gong, A. K. Mishra and L. Liu, Chem. Mater., 2014, 26, 4459–4465 CrossRef CAS.
- K. M. F. Shahil and A. A. Balandin, Nano Lett., 2012, 12, 861–867 CrossRef CAS PubMed.
- A. Yu, P. Ramesh, X. Sun, E. Bekyarova, M. E. Itkis and R. C. Haddon, Adv. Mater., 2008, 20, 4740–4744 CrossRef CAS.
- S. Ganguli, A. K. Roy and D. P. Anderson, Carbon, 2008, 46, 806–817 CrossRef CAS.
- S. Wu, T. Li, M. Wu, J. Xu, J. Chao, Y. Hu, T. Yan, Q.-Y. Li and R. Wang, ACS Appl. Mater. Interfaces, 2021, 13, 19200–19210 CrossRef CAS PubMed.
- J. Huang, J. Su, M. Weng, L. Xiong, P. Wang, Y. Liu, X. Lin and Y. Min, Sol. Energy Mater. Sol. Cells, 2022, 245, 111872 CrossRef CAS.
- J. Deng, Y. Kou, H. Liu, M. Yang, K. Sun, R. Joshi and Q. Shi, ACS Appl. Mater. Interfaces, 2023, 6, 7457–7567 CAS.
- Q. Zhang and J. Liu, Sol. Energy Mater. Sol. Cells, 2018, 179, 217–222 CrossRef CAS.
- N. Sheng, R. Zhu, K. Dong, T. Nomura, C. Zhu, Y. Aoki, H. Habazaki and T. Akiyama, J. Mater. Chem. A, 2019, 7, 4934–4940 RSC.
- K. Yang, Z. Ling, X. Fang and Z. Zhang, J. Energy Chem., 2023, 66, 107486 Search PubMed.
- W. Aftab, A. Mahmood, W. Guo, M. Yousaf, H. Tabassum, X. Huang, Z. Liang, A. Cao and R. Zou, Energy Storage Mater., 2019, 20, 401–409 CrossRef.
- X. Chen, H. Gao, M. Yang, W. Dong, X. Huang, A. Li, C. Dong and G. Wang, Nano Energy, 2018, 18, 349–355 Search PubMed.
- H.-Y. Zhao, C. Shu, P. Min, C. Li, W. Deng, J. Yang, X. Li and Z.-Z. Yu, J. Mater. Chem. A, 2022, 10, 22488–22499 RSC.
- G. Liang, J. Zhang, S. An, J. Tang, S. Ju, S. Bai and D. Jiang, Carbon, 2021, 176, 11–20 CrossRef CAS.
- S. Wu, T. Li, M. Wu, J. Xu, Y. Hu, J. Chao, T. Yan and R. Wang, J. Mater. Chem. A, 2020, 8, 20011–20020 RSC.
- J. Gao, B. Zhou, C. Liu, C. He, Y. Feng and C. Liu, Chem. Eng. J., 2023, 475, 146087 CrossRef CAS.
- F. Xue, Y. Lu, X.-D. Qi, J.-H. Yang and Y. Wang, Chem. Eng. J., 2019, 365, 20–29 CrossRef CAS.
- J. Yang, G.-Q. Qi, R.-Y. Bao, K. Yi, M. Li, L. Peng, Z. Cai, M.-B. Yang, D. Wei and W. Yang, Energy Storage Mater., 2018, 13, 88–95 CrossRef.
- M. Wang, T. Zhang, D. Mao, Y. Yao, X. Zeng, L. Ren, Q. Cai, S. Mateti, L. H. Li, X. Zeng, G. Du, R. Sun, Y. Chen, J.-B. Xu and C.-P. Wong, ACS Nano, 2019, 13, 7402–7409 CrossRef CAS PubMed.
- J. Yang, E. Zhang, X. Li, Y. Zhang, J. Qu and Z.-Z. Yu, Carbon, 2016, 98, 50–57 CrossRef CAS.
- Y. Wei, J. Li, F. Sun, J. Wu and L. Zhao, Green Chem., 2018, 20, 1858–1865 RSC.
- J. Wang, W. Li and X. Zhang, J. Mater. Sci. Technol., 2023, 178, 179 CrossRef.
- J.-H. Jing, H.-Y. Wu, Y.-W. Shao, X.-D. Qi, J.-H. Yang and Y. Wang, ACS Appl. Mater. Interfaces, 2019, 11, 19252–19259 CrossRef CAS PubMed.
- P. Zhang, Y. Wang, Y. Qiu, H. Yan, Z. Wang and Q. Li, Appl. Energy, 2024, 358, 122546 CrossRef CAS.
- A. L. Cottrill, A. T. Liu, Y. Kunai, V. B. Koman, A. Kaplan, S. G. Mahajan, P. Liu, A. R. Toland and M. S. Strano, Nat. Commun., 2018, 9, 664 CrossRef PubMed.
- K. Yuan, J. Liu, X. Fang and Z. Zhang, J. Mater. Chem. A, 2018, 6, 4535–4543 RSC.
- S. Yang, Y. Zhang, J. Bai, Y. He, X. Zhao and J. Zhang, ACS Nano, 2022, 16, 15086–15099 CrossRef CAS PubMed.
- J. Li, B. Xia, X. Xiao, Z. Huang, J. Yin, Y. Jiang, S. Wang, H. Gao, Q. Shi, Y. Xie and J. Chen, ACS Nano, 2023, 17, 19232–19241 CrossRef CAS PubMed.
- J. Yang, L.-S. Tang, R.-Y. Bao, L. Bai, Z.-Y. Liu, W. Yang, B.-H. Xie and M.-B. Yang, Chem. Eng. J., 2017, 315, 481–490 CrossRef CAS.
- J. Yang, L.-S. Tang, L. Bai, R.-Y. Bao, Z. Liu, B.-H. Xie, M.-B. Yang and W. Yang, ACS Sustainable Chem. Eng., 2018, 6, 6761 CrossRef CAS.
- J. Yang, P. Yu, L.-S. Tang, R.-Y. Bao, Z.-Y. Liu, M.-B. Yang and W. Yang, Nanoscale, 2017, 9, 17704–17709 RSC.
- F. Xue, X.-Z. Jin, X. Xie, X.-D. Qi, J.-H. Yang and Y. Wang, Nanoscale, 2019, 11, 18691–18701 RSC.
- C. Guo, L. He, Y. Yao, W. Lin, Y. Zhang, Q. Zhang, K. Wu and Q. Fu, Nano-Micro Lett., 2022, 14, 202 CrossRef CAS PubMed.
Footnotes |
| † Electronic supplementary information (ESI) available: Analytical models; Fig. S1–S14; Tables S1–S5 and Sections S1 and S2. See DOI: https://doi.org/10.1039/d4mh00792a |
| ‡ These authors contributed equally to this work. |
| This journal is © The Royal Society of Chemistry 2024 |