
Anomalous thermal activation of green upconversion luminescence in Yb/Er/ZnGdO self-assembled microflowers for high-sensitivity temperature detection†
Wei
Zheng‡
a,
Aifeng
He‡
a,
Hong
Ma
a,
Jianhua
Chen
a,
Bo
Jing
a,
Yan
Li
 a,
Xiaogang
Yu
a,
Chunqiang
Cao
a and
Baoyu
Sun
*ab
a,
Xiaogang
Yu
a,
Chunqiang
Cao
a and
Baoyu
Sun
*ab
aKey Laboratory of Applied Physics and Chemistry, Shaanxi Applied Physics and Chemistry Research Institute, Xi’an, 710061, China
bState Key Laboratory for Mechanical Behavior of Materials, Xi’an Jiaotong University, Xi’an 710049, China. E-mail: baoyu.sun@xjtu.edu.cn
First published on 18th October 2023
Abstract
Non-contact optical temperature detection has shown a great promise in biological systems and microfluidics because of its outstanding spatial resolution, superior accuracy, and non-invasive nature. However, the thermal quenching of photoluminescence significantly hinders the practical applications of optical temperature probes. Herein, we report thermally enhanced green upconversion luminescence in Yb/Er/ZnGdO microflowers by a defect-assisted thermal distribution mechanism. A 1.6-fold enhancement in green emission was demonstrated as the temperature increased from 298 K to 558 K. Experimental results and dynamic analysis demonstrated that this behavior of thermally activating green upconversion luminescence originates from the emission loss compensation, which is attributed to thermally-induced energy transfer from defect levels to the green emitting level. In addition, the Yb/Er/ZnGdO microflowers can act as self-referenced radiometric optical thermometers. The ultrahigh absolute sensitivity of 1.61% K−1 and an excellent relative sensitivity of 15.5% K−1 based on the 4F9/2/2H11/2(2) level pair were synchronously achieved at room temperature. These findings provide a novel strategy for surmounting the thermal quenching luminescence, thereby greatly promoting the application of non-contact sensitive radiometric thermometers.
New conceptsThe conventional thermal quenching of luminescence greatly limits the applications of upconversion materials in temperature detection and inevitably degrades device performance. This limitation can be alleviated by minimizing the thermal quenching (TQ) of luminescence in upconversion luminescent materials. Previous studies have proposed several theories that focused on minimizing TQ in small-scale nanomaterials. However, effective mechanisms to clarify the thermal activation of luminescence in micromaterials are not clear. Herein, we propose a new “defect-assisted thermal distribution” mechanism for the thermal enhancement of green upconversion luminescence in the Yb3+/Er3+/ZnGdO microflowers. To the best of our knowledge, this is the first paper to experimentally demonstrate that defect-assisted thermal distribution can induce the thermally enhanced upconversion luminescence phenomenon. Experimental results and dynamic analyses indicated energy transfer from defects to 4S3/2(1)via thermal excitation and a quasi-thermal equilibrium, which contribute to the compensation of green emission losses caused by non-radiative transitions. Therefore, a 1.6-fold enhancement in green emission was demonstrated in parallel with prominent temperature sensing performance (Sa up to 15.5% K−1). These findings provide a new insight into surmounting the thermal quenching of luminescence, thereby greatly promoting the application of non-contact sensitive radiometric thermometers. |
1. Introduction
The technology of temperature measurement has been extensively integrated into industrial and scientific fields.1,2 Conventional thermometers, including thermocouples, thermistors, and pyrometers, are generally utilized to detect the temperature of an object from the direct heat transfer and thermal equilibrium between the sensor and the object.3,4 These contact temperature sensors are inappropriate for temperature measurements at scales below 10 μm,1,5 such as temperature mapping of microcircuits and intracellular temperature fluctuations, and are easily interfered by electromagnetic waves.6,7 These unavoidable disadvantages have encouraged the development of non-contact optical temperature sensors because of their unique advantages. The non-contact optical thermometry can realize temperature measurements under extreme environments through remote control, which is immune to electromagnetic interferences and dimensional limits.3,8–11Recently, lanthanide-doped (e.g., Er3+, Tm3+, and Ho3+) upconversion optical temperature sensing materials have attracted much attention because of their significant potential applications in non-contact optical temperature detection.12–15 Among the various pathways to the upconversion temperature sensing technique, the fluorescence intensity ratio (FIR) technique is a great research hotspot.16–18 Additionally, the FIR technique is independent of external interferences and spectral losses and possesses the advantages of rapid response and high spatial and temperature resolutions. Nevertheless, the emission loss of non-radiative transitions with increasing temperature, namely thermal quenching, seriously affects the luminescence efficiency and impedes the application of upconversion temperature sensors.19
Attempts have been made to minimize thermal quenching luminescence in lanthanide-doped upconversion nanoparticles (LUCNPs) by weakening phonon confinement and surface-related processes.20–23 In particular, it has been recently demonstrated that phonon-assisted energy transfer plays a positive role in surmounting thermal quenching in nanoparticles.20 Some missing low-energy phonon modes can recover via the weakening of phonon confinement with increasing temperature, promoting energy transfer between Yb3+ and Er3+. In addition, the alleviation of surface quenching by a heating mechanism has been illustrated for thermally enhanced luminescence of LUCNPs. The heating-induced luminescence enhancement occurs through eliminating the surface-absorbed water in small nanoparticles as the temperature increases.21,22 However, these mechanisms are currently limited to small-scale nanomaterials and are not suitable for large-scale materials, such as micromaterials.
In this work, a novel “defect-assisted thermal distribution” mechanism for the thermal enhancement of green upconversion luminescence is proposed in Yb3+/Er3+/ZnGdO microflowers. Experimental results and dynamic analysis indicated that energy transfer from the defect energy level to the 4S3/2(1) energy level occurred via thermal excitation and a quasi-thermal equilibrium, contributing to the compensation of green emission losses caused by non-radiative transitions. The green upconversion luminescence intensity was continuously improved as the temperature was elevated from 298 K to 558 K. The multiple temperature sensing performances were concurrently implemented in the Yb3+/Er3+/ZnGdO microflowers. Ultrahigh Sr, superb Sa, and excellent signals were simultaneously obtained based on the 4F9/2/2H11/2(2) level pair. This study may provide new understanding and perspectives for the thermal activation of luminescence in upconversion micromaterials.
2. Experimental section
2.1. Sample preparation
The Yb/Er/ZnGdO self-assembled microflowers were prepared by a coprecipitation method and a thermal treatment process. The raw materials including Zn(NO3)2·6H2O, Gd(NO3)3·6H2O, Yb(NO3)3·5H2O and Er(NO3)3·5H2O, NaOH, and citric acid were purchased from Sigma-Aldric and used without further purification. First, 0.8032 g of Gd(NO3)3·6H2O (1.78 mmol), 0.0898 g of Yb(NO3)3·5H2O (0.2 mmol) and 0.0088 g of Er(NO3)3·5H2O (0.02 mmol) were dissolved in 10 mL of ethanol (solution A). Then, 0.595 g of Zn(NO3)2·6H2O (2 mmol) and 0.3842 g of citric acid (2 mmol) were dissolved in 70 mL of aqueous solution (solution B). Next, solution A and solution B were mixed thoroughly under stirring. Then,10 mL and 30 mL of aqueous solution of NaOH (2 M) were added in turn and the reaction lasted for 30 min, respectively. Subsequently, a certain amount of citric acid (0 g, 2.3052 g, 2.8815 g, 3.4583 g and 4.0341 g, respectively) was added to the above mixed solution and stirred for 30 min. The white precursor was harvested by several rinse-centrifugation cycles with H2O and ethanol, and dried in air at 60 °C. The acquired precursor was annealed at 600 °C for 3 h, forming the Yb/Er/ZnGdO microflowers.2.2. Material characterizations
The morphologies and structures of the samples were examined by a Helios Nanolab 600i high-resolution field emission scanning electron microscope (SEM) and TecnaiG2F30 transmission electron microscope (TEM). The chemical composition of the samples was analyzed by X-ray photoelectron spectroscopy via a PHI 5700-ECSA system, and energy-dispersive X-ray spectroscopy (EDX) attached to the Tecnai G2F30 instrument. The crystal phases of the samples were analyzed by a Panalytical Empyrean powder X-ray diffractometer (XRD). Upconversion PL spectra were recorded using a Zolix-SBP300 grating spectrometer equipped with a CR131 photomultiplier tube. The 980 nm diode laser was used as a pump source, and a signal generator was used to convert a continuous 980 nm excitation source into a pulse excitation source. The temperature-dependent upconversion luminescence measurements were performed on a temperature controlling stage. The temperature was detected by a copper-constantan thermocouple and controlled by a proportional-integral derivative loop feedback temperature control system.3. Results and discussion
3.1. Structure and morphology characterization
The controllable synthesis of upconversion micromaterials with desirable size/morphology and crystal structure is of practical significance and has attracted much attention in recent years. Here, Yb/Er/Gd co-doped ZnO (Yb/Er/ZnGdO) self-assembled microflowers were synthesized via a coprecipitation method and subsequent thermal treatment, as illustrated in Scheme 1. In a typical synthetic process, the first step is the preparation of precursor microflowers via the coprecipitation method, in which the precursor morphology can be easily adjusted by changing the citric acid content. The next step is thermal treatment. After heat treatment, the –OH and –CO3 groups can be removed from the structure by thermal decomposition reaction, resulting in the formation of Yb/Er/ZnGdO microflowers. Under controllable synthesis conditions, the size/morphology and crystalline structure of the Yb/Er/ZnGdO microflowers also can be adjusted.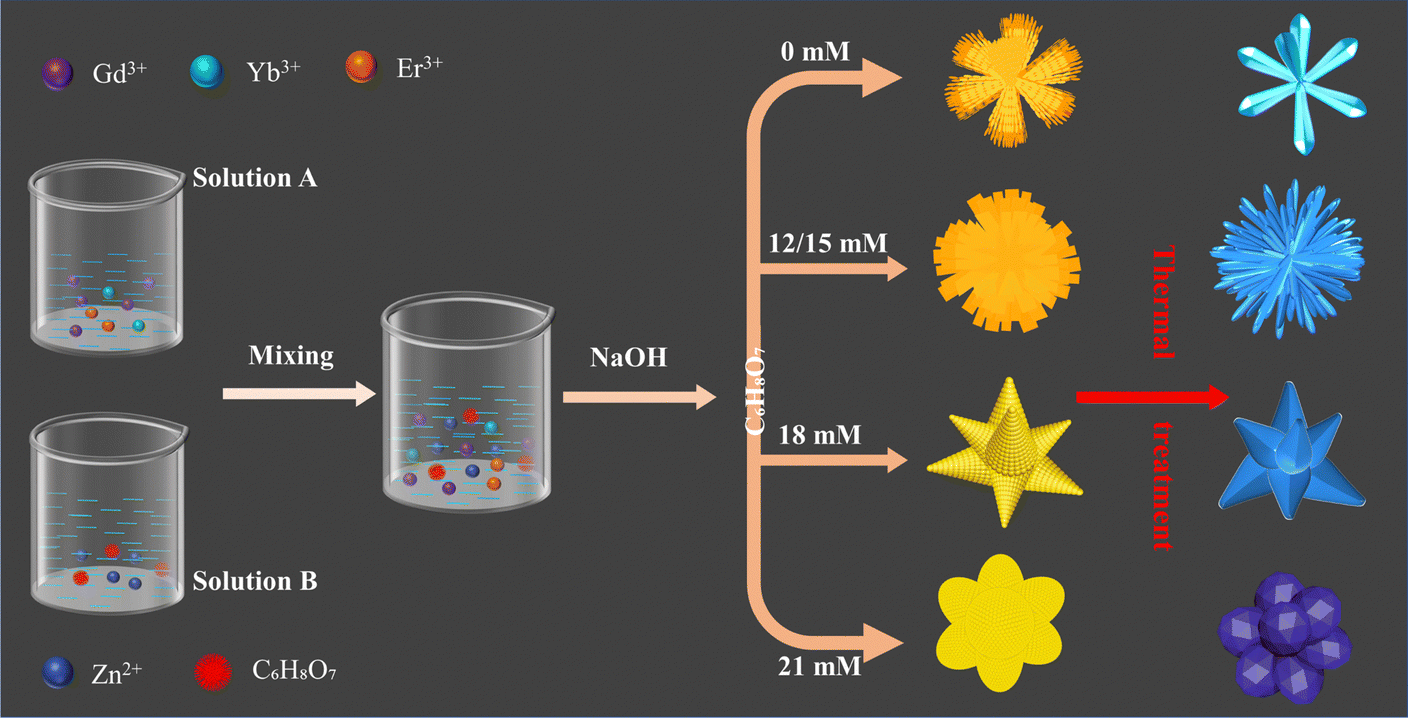 | ||
| Scheme 1 Schematic illustration of synthesis of Yb/Er/ZnGdO microflowers. | ||
To investigate the effects of synthesis conditions on the morphology of Yb/Er/ZnGdO microflowers, SEM and TEM studies were carried out. All precursors displayed the microflower morphology with uniform size distribution, as shown in Fig. 1(a)–(e) and Fig. S1 (ESI†). As the citric acid content increased, the morphology/size of the microflowers changed accordingly. After heat treatment, the microflower morphology of the Yb/Er/ZnGdO samples were well maintained (Fig. 1(f)–(g) and Fig. S2, ESI†). When the citric acid content increased from 0 mM to 18 mM, the average particle size of Yb/Er/ZnGdO microflowers firstly increased, then decreased, and reached the maximum of 2.08 μm at 12 mM (Fig. S3, ESI†). On further increasing the citric acid content, the microflower size slightly increased. This may be because the citric acid content affected the nucleation and growth process of the samples, resulting in different microflower morphologies/sizes under different citric acid concentrations. Thus, the controllable microflower morphology/size of the Yb/Er/ZnGdO sample was achieved by varying the content of citric acid. The microflower structures of the Yb/Er/ZnGdO samples (citric acid content 0 and 12 mM) were further elucidated by TEM, as displayed in Fig. 1(k) and (l). A high-resolution transmission electron microscope (HRTEM) image of Yb3+/Er3+ co-doped ZnGdO (citric acid 12 mM) is shown in Fig. 1(m), where clear lattice fringes with a spacing of 0.304 nm were indexed to the (110) of hexagonal ZnO. Obvious distortion of the lattice arrays was also observed from the HRTEM (Fig. 1(m)), illustrating the formation of defects induced by the substitution of Gd/Yb/Er for Zn atoms. The selected area electron diffraction (SAED) patterns proved the existence of polycrystalline ZnGdO nanocrystals (Fig. 1(n)). Scanning and transmission analytical electron microscopy (STEM-EDX) line scan results (Fig. 1(o) and (p)) demonstrated that the Zn, Gd, Yb, Er and O elements were homogeneously distributed in the microflowers, indicating the successful preparation of Yb/Er/ZnGdO particles.
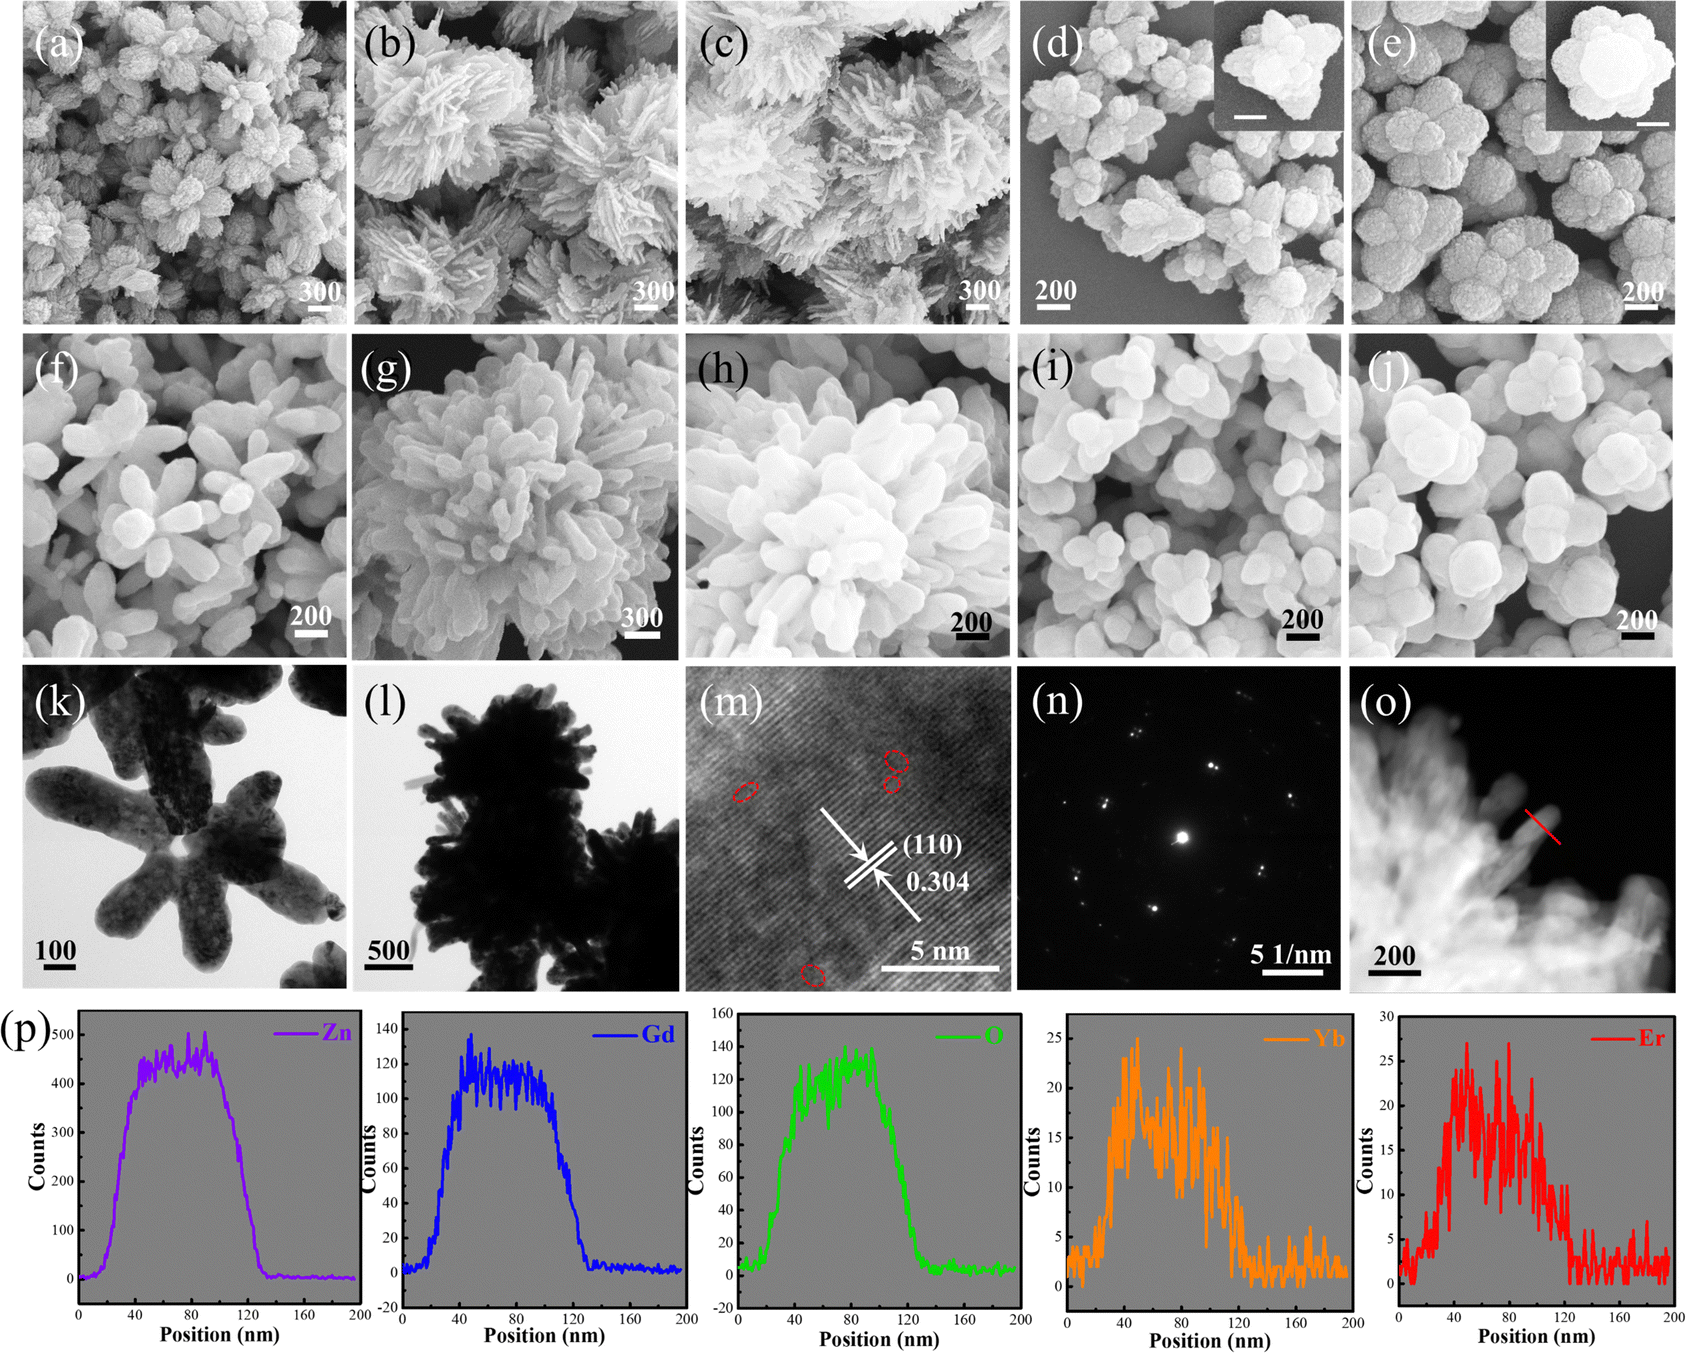 | ||
| Fig. 1 SEM images of precursor microflowers with different citric acid contents: (a) 0 mM, (b) 12 mM, (c) 15 mM, (d) 18 mM, and (e) 21 mM. SEM images of Yb/Er/ZnGdO microflowers with different citric acid contents: (f) 0 mM, (g) 12 mM, (h) 15 mM, (i) 18 mM, and (j) 21 mM. TEM images of Yb/Er/ZnGdO microflowers with a citric acid content of (k) 0 mM and (l) 12 mM. Yb/Er/ZnGdO microflowers with a citric acid content of 12 mM: (m) HRTEM image, (n) corresponding SAED pattern, (o) HAADF-STEM image, and (p) the corresponding EDS line scans. | ||
To evaluate the relationship between citric acid content, morphology, and crystal structure, X-ray powder diffraction (XRD) studies were conducted. The diffraction peaks were assigned to the JCPDS data (36-1451) and correlated with the hexagonal phase of ZnO (Fig. S4, ESI† and Fig. 2(f)). Fig. S4 and Table S1 (ESI†) indicate that the citric acid content has an important effect on the crystallinity of the sample. The variation trend of crystallinity with citric acid content is consistent with that of particle size with citric acid content. This may be because the large particle size is beneficial to the degree of long-range ordering of the sample, thus resulting in better crystallinity. Therefore, it was concluded that the citric acid content can greatly affect the morphology/size and crystallinity of the products. Besides, all of peak positions shifted slightly towards lower angles (Fig. S4, ESI†), which could be due to the increase in the lattice layer resulting from the successful substitution of Gd/Yb/Er ions into the ZnO matrix.24,25
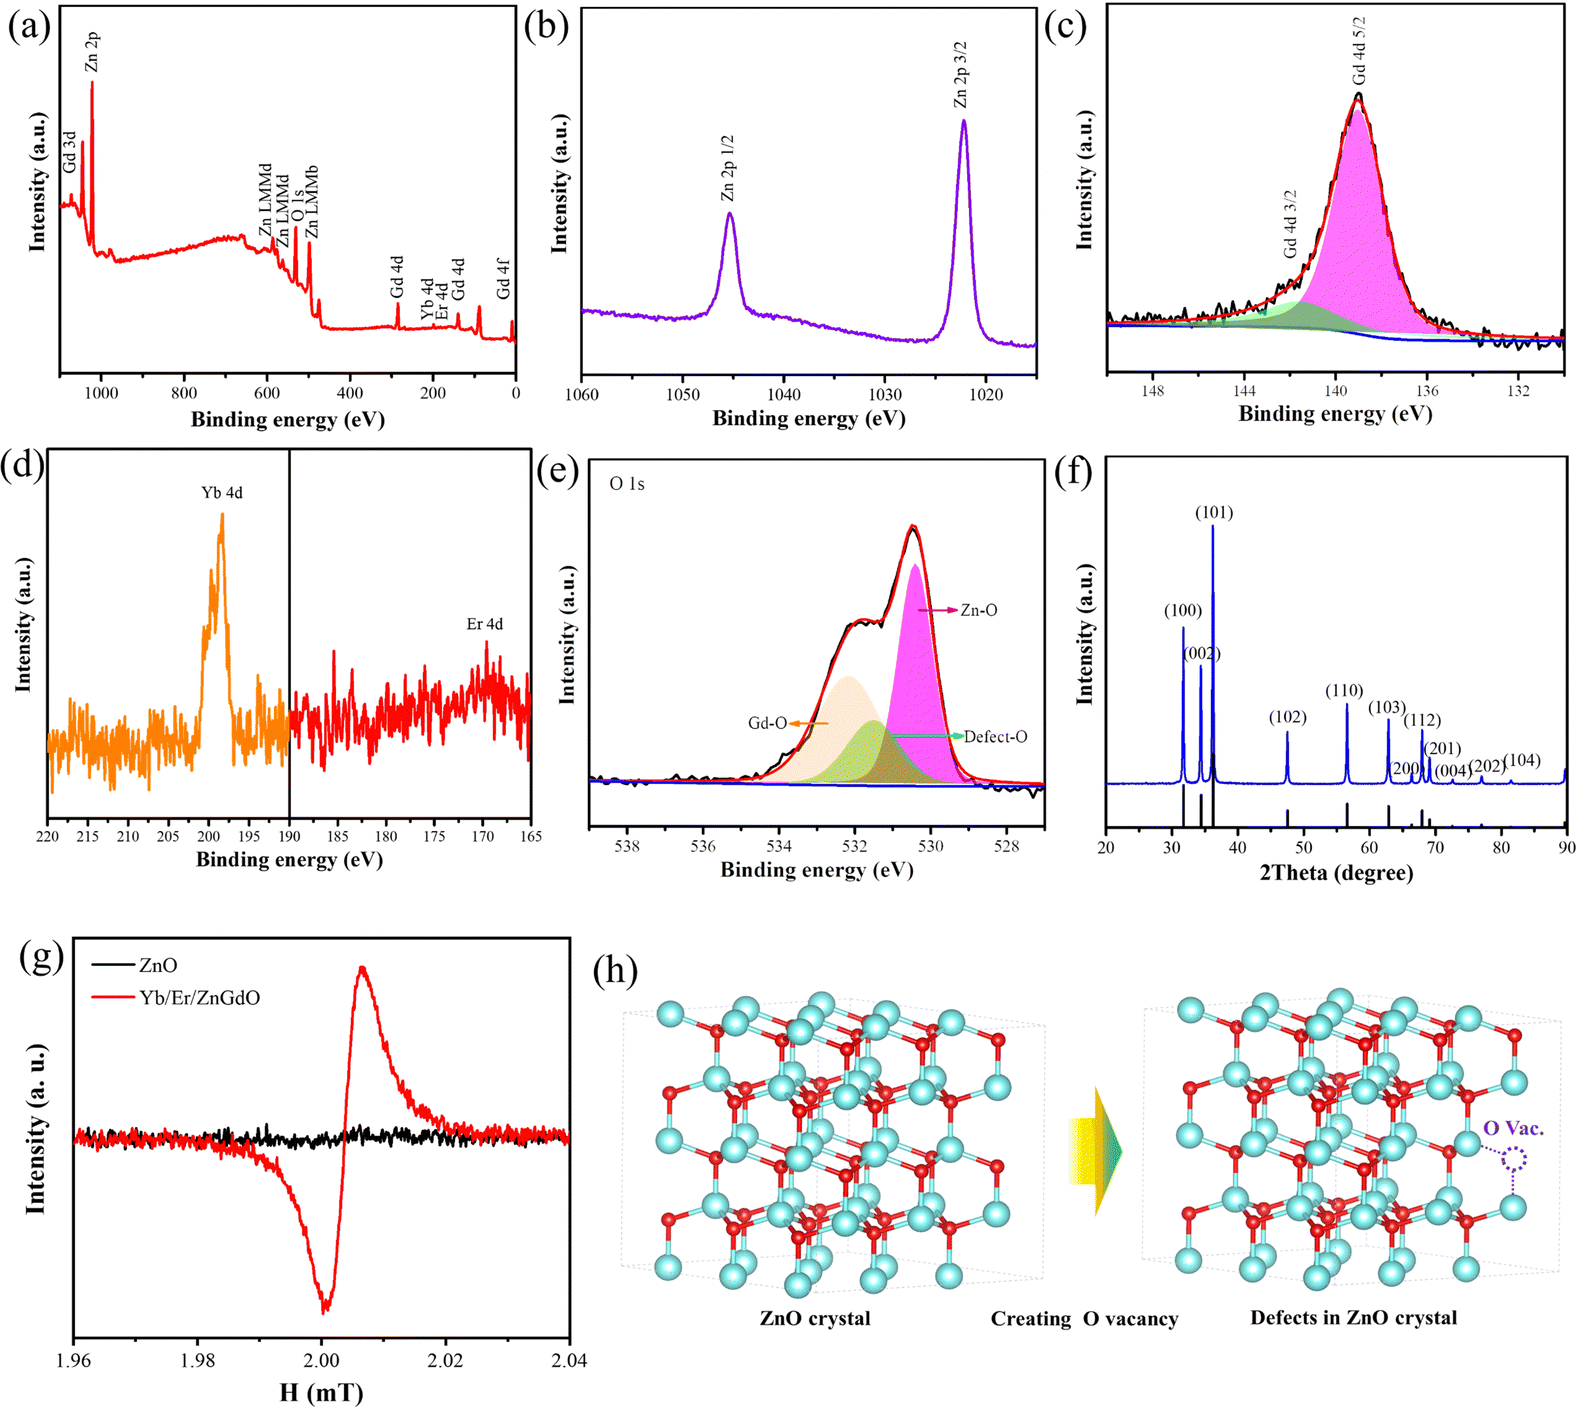 | ||
| Fig. 2 (a) XPS results of Yb/Er/ZnGdO particles with a citric acid content of 12 mM: survey spectra; high-resolution spectra of (b) Zn 2p, (c) Gd 4d, (d) Yb 4d and Er 4d, and (e) O 1s. (f) XRD patterns of Yb/Er/ZnGdO particles with a citric acid content of 12 mM. (g) EPR spectra. (h) The conversion process of the crystal structure-change from ZnO to defect-Yb/Er/Gd/ZnO. | ||
To further determine the chemical composition and states of Yb/Er/ZnGdO microflowers, X-ray photoelectron spectroscopy (XPS) was carried out. The chemical elements Zn Gd, Yb, Er and O could be detected in the survey spectrum (Fig. 2(a)). The Yb/Er/ZnGdO sample (citric acid 12 mM) showed typical peaks of Zn 2p3/2 and Zn 2p1/2 at binding energies of ∼1022.2 eV and ∼1045.2 4 eV, corresponding to the results of Zn2+ in the ZnO configuration (Fig. 2(b))26,27 In the Gd 4d spectra (Fig. 2(c)), two obvious peaks at 139.04 eV for Gd 4d5/2 and 141.66 eV for Gd 4d3/2 were demonstrated, verifying the presence of the Gd3+ oxidation state.28 The characteristic peaks at 198.3 and 169.6 eV were observed from the Fig. 2(d), which correspond to the binding energies of Yb 4d and Er 4d, respectively.29,30 The replacement of Zn by Gd/Yb/Er also generated oxygen vacancies in Yb/Er/ZnGdO samples to balance the electroneutrality of the crystal. The O 1s spectra could be divided into three peaks, as shown in Fig. 2(e). The peak at 530.1 eV is due to Zn–O and the peak at 531.4 eV is related to Gd–O.26,31,32 Besides, the XPS O 1s spectrum presented an obvious peak at the binding energy of ∼532.4 eV, illustrating the formation of oxygen vacancies. The existence of oxygen vacancies was also evidenced by EPR analysis (Fig. 2(g)); the signal at g = 2.003 originated from unpaired electrons trapped on surface oxygen vacancies (Fig. 2(h)).
3.2. Upconversion luminescence properties
The upconversion luminescence spectra of various Yb/Er/ZnGdO microflowers at different citric acid contents are shown in Fig. S5 (ESI†). Under 980 nm excitation, the upconversion nanoparticles exhibited typical green and red emission peaks of Er3+ due to the 2H11/2/4S3/2→ 4I15/2 and 4F9/2→ 4I15/2 transitions, respectively.33 Interestingly, an extra emission peak at 611 nm was observed, which could be due to the defect upconversion emission induced by hetero-valence doping.34–37 The possible upconversion mechanisms for Yb/Er/ZnGdO are presented via the simplified energy level diagram as displayed in Fig. S6 (ESI†). It should be noted that all products exhibited similar spectral shapes and emission bands, except for the difference in the emission intensity. As the content of citric acid increased from 0 to 18 mM, the upconversion emission intensity presented a trend of first increasing and then decreasing (Fig. S5b, ESI†). When the citric acid content was 12 mM, the upconversion luminescence intensity was the strongest. Further enhancing the citric acid content to 21 mM, the emission intensity slightly increased. The difference in upconversion emission intensities could be attributed to the combined roles of the crystal structure and morphology/size. Based on SEM and the corresponding particle size results of the as-prepared products at different citric acid contents, the change trend of particles size was found to be consistent with that of luminescence intensity when the citric acid content was elevated. According to the reported surface quenching mechanism, the size/morphology of the samples contributed to their surface area, directly influencing the density of surface defects and emission intensity.38 With increasing microflower size, the Er3+ ion concentration on the crystal surface was reduced significantly, leading to lower surface defects and stronger emission. Clearly, the morphology/size affected the upconversion luminescence via surface related processes.Apart from the morphology/size, the crystallinity of Yb/Er/ZnGdO is an important factor that affects the upconversion luminescence properties. Based on the XRD results, the changing trend of crystallinity with citric acid content is consistent with that of luminescence intensity with citric acid content. This result indicates that high crystallinity is favorable for the upconversion emission, consistent with the previous reports.39,40 Thus, the luminescence properties may be determined by the morphology/size and crystal structure.
3.3. Zero-thermal-quenching upconversion luminescence and temperature sensing performance
Fig. 3(a) and Fig. S7 (ESI†) show the temperature-dependent upconversion emission spectra for representative Yb/Er/ZnGdO microflowers with citric acid content of 12 mM in the temperature range from 298 K to 558 K. The green emission level of 2H11/2 split into 2H11/2(1) and 2H11/2(2) levels, and the 4S3/2 level split into 4S3/2(1) and 4S3/2(2) levels. Correspondingly, the upconversion emission peaks at 520 nm, 534 nm, 541 nm, and 552 nm were attributed to transitions from the 2H11/2(2) → 4I15/2, 2H11/2(1) → 4I15/2, 4S3/2(2) → 4I15/2, and 4S3/2(1) → 4I15/2, respectively. As the temperature was varied, the positions of the emission bands at 520 nm, 534 nm, 541 nm, and 552 nm hardly changed. Intriguingly, the green emission intensity obviously varied as the temperature increased, as shown in Fig. 3(a). Fig. 3(b) shows the variation in emission intensity of different green emission peaks along with temperature. The total green emission intensity increased with the increase in temperature (Fig. 3(c)), and a 1.6-fold improvement was achieved at 558 K. Bright green upconversion luminescence under different temperatures were clearly observed and the emission intensity was well maintained (as shown in Fig. 3(e)), which is greatly beneficial to practical applications. Under various pump powers, the green upconversion emission intensity also presented the same trends of enhancement as the temperature was elevated (Fig. 3(d)). This indicates that the thermally enhanced green upconversion luminescence is independent of pump power.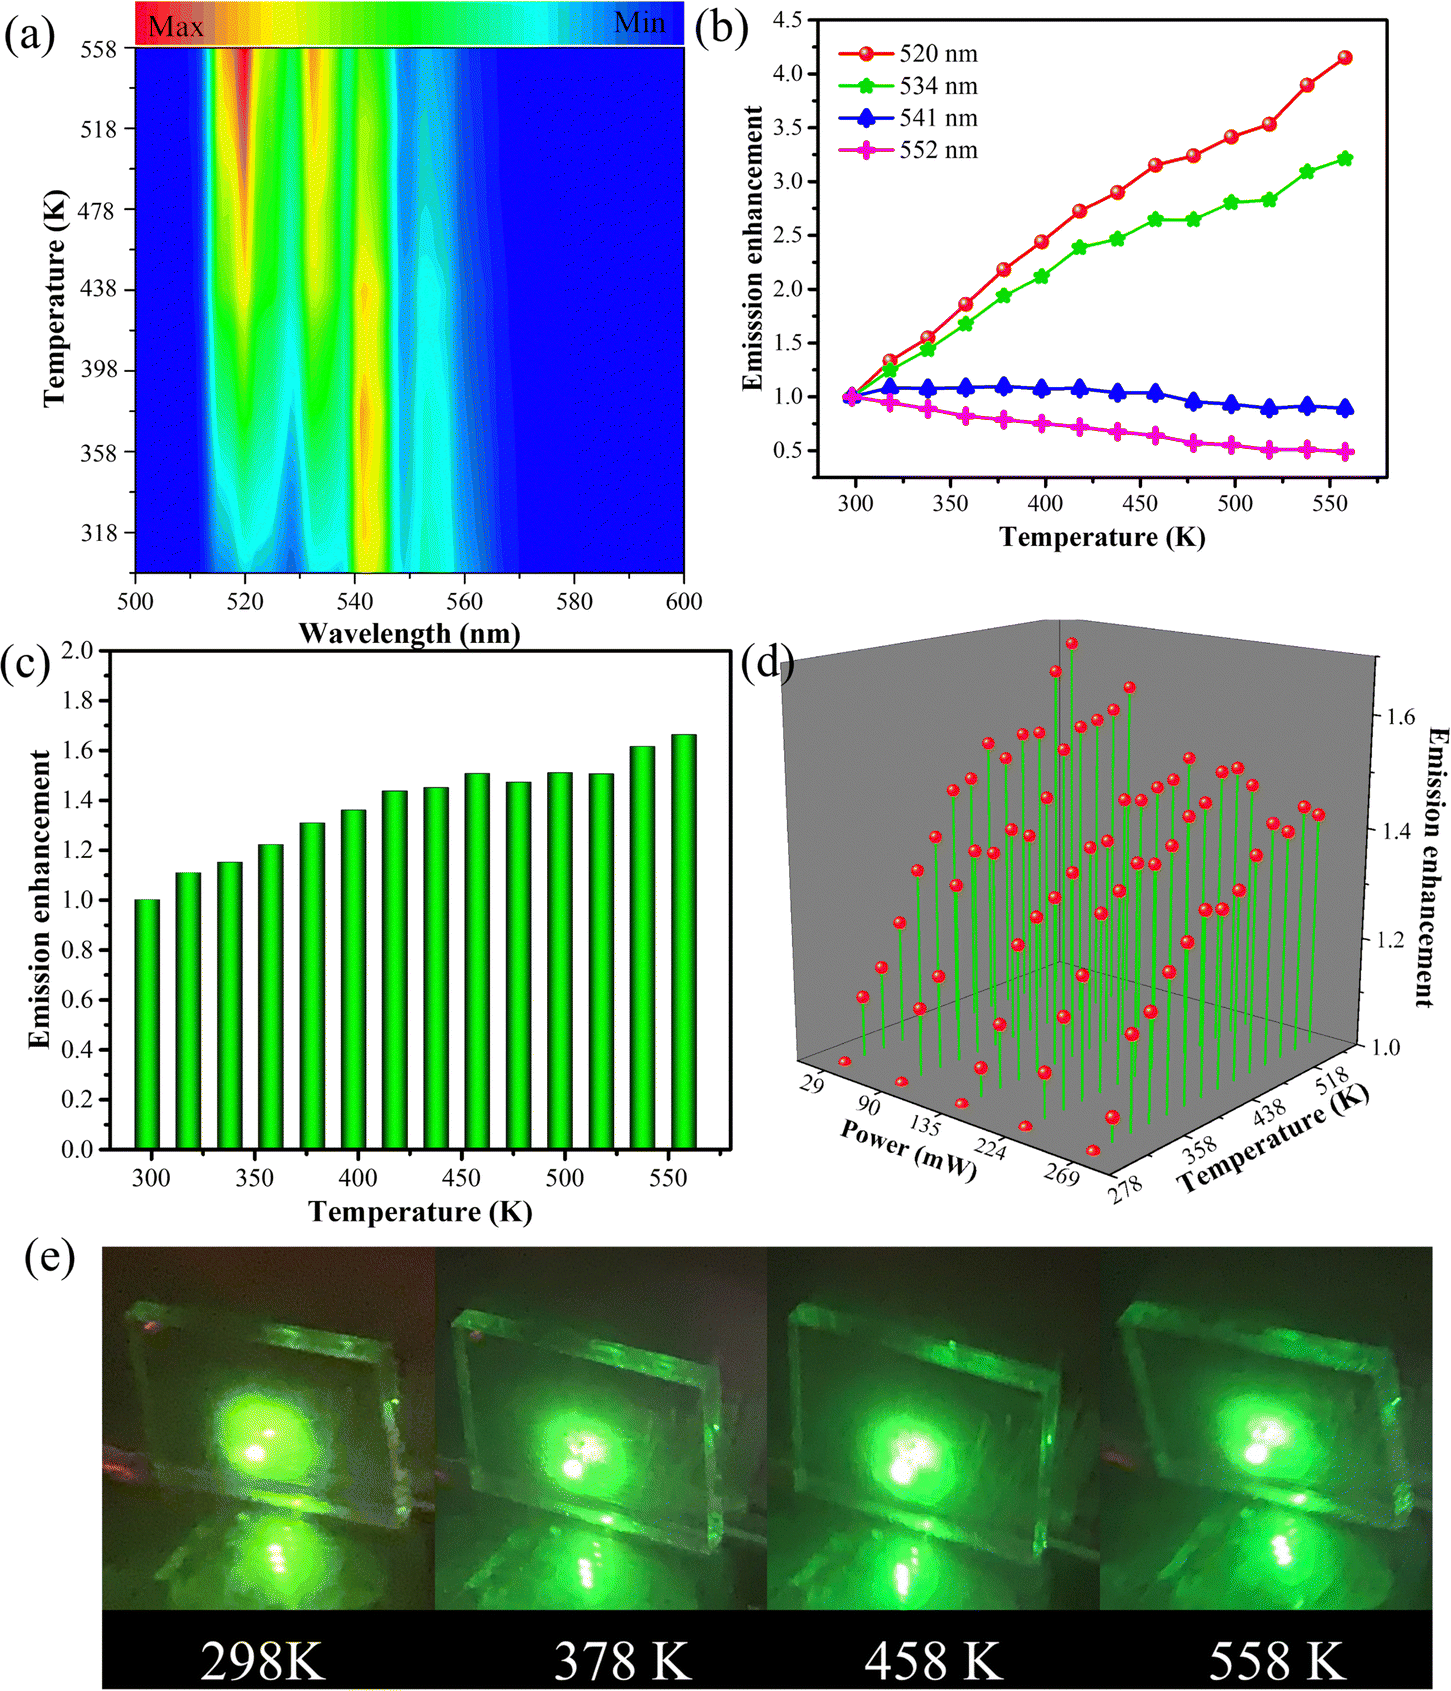 | ||
| Fig. 3 Temperature-dependent (a) upconversion luminescence mapping of Yb/Er/ZnGdO particles with a citric acid content of 12 mM and (b) emission intensity variation of different green emission peaks at 520 nm, 534 nm, 541 nm, and 552 nm. (c) Statistical diagram illustrating the improvements of green emissions under 29 mW. (d) Statistical diagram illustrating the improvements of green emissions under different pump powers. (e) Luminescence photographs under different temperatures. | ||
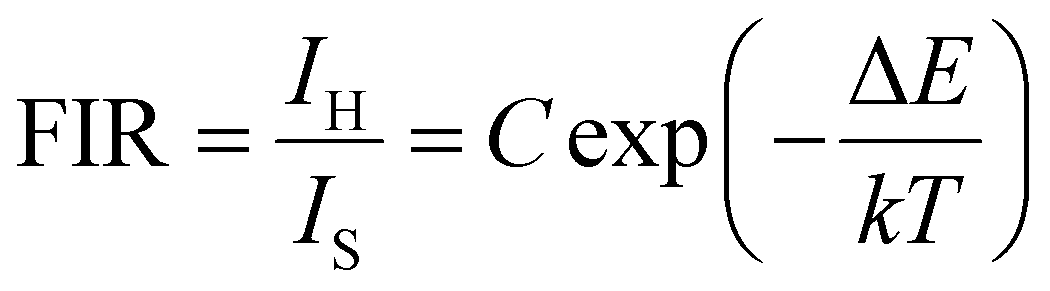
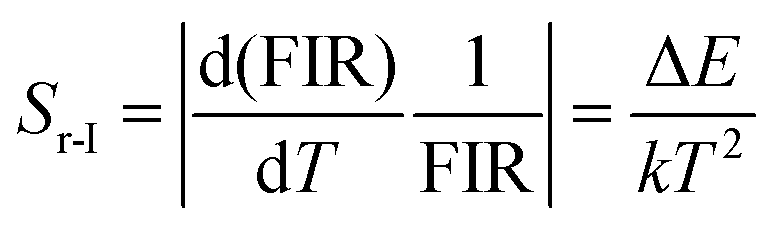
The thermal enhancement of green upconversion offers great opportunities for the practical application of optical thermometry based on the FIR technique. A radiometric thermometer was constructed based on the thermally coupled level pair 2H11/2(2)/4S3/2(1) for Yb/Er/ZnGdO microflowers. The energy space between the 2H11/2(2) and 4S3/2(1) levels was about 1115 cm−1 according to the upconversion luminescence spectra in Fig. S7 (ESI†), obeying the Boltzmann distribution law. Consequently, this energy gap makes the energy from the 4S3/2(1) level populate the 2H11/2(2) level with the increasing temperature via thermal excitation and a quasi-thermal equilibrium. Correspondingly, the FIR of 520 nm and 552 nm varied regularly as the temperature increased. The FIR between two thermally coupled levels can be expressed as equation (eqn (1)):41–43
 | (1) |
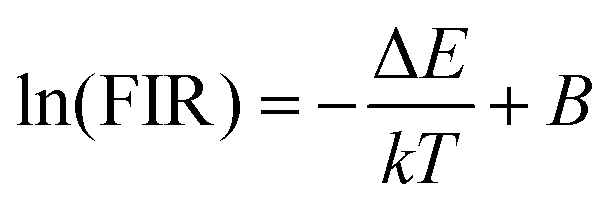
Eqn (1) can be converted to the following equation:
 | (2) |
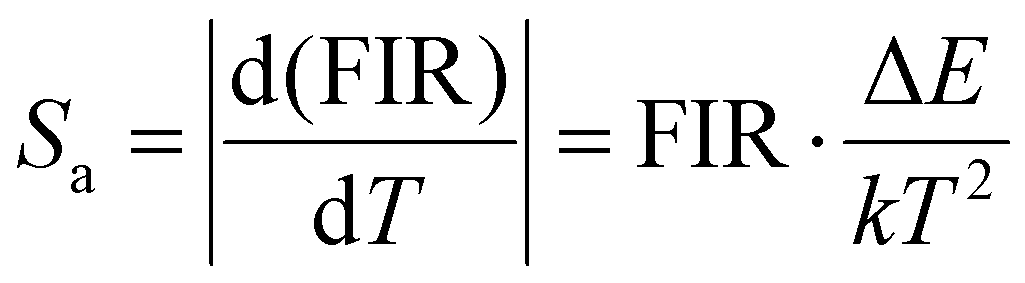
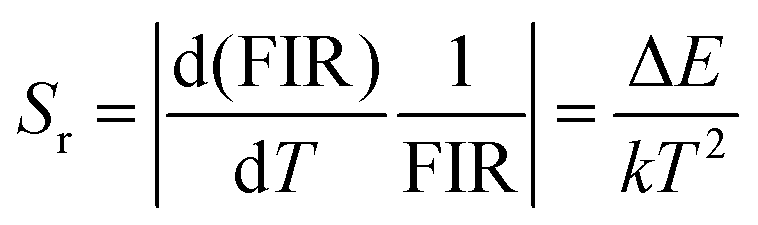
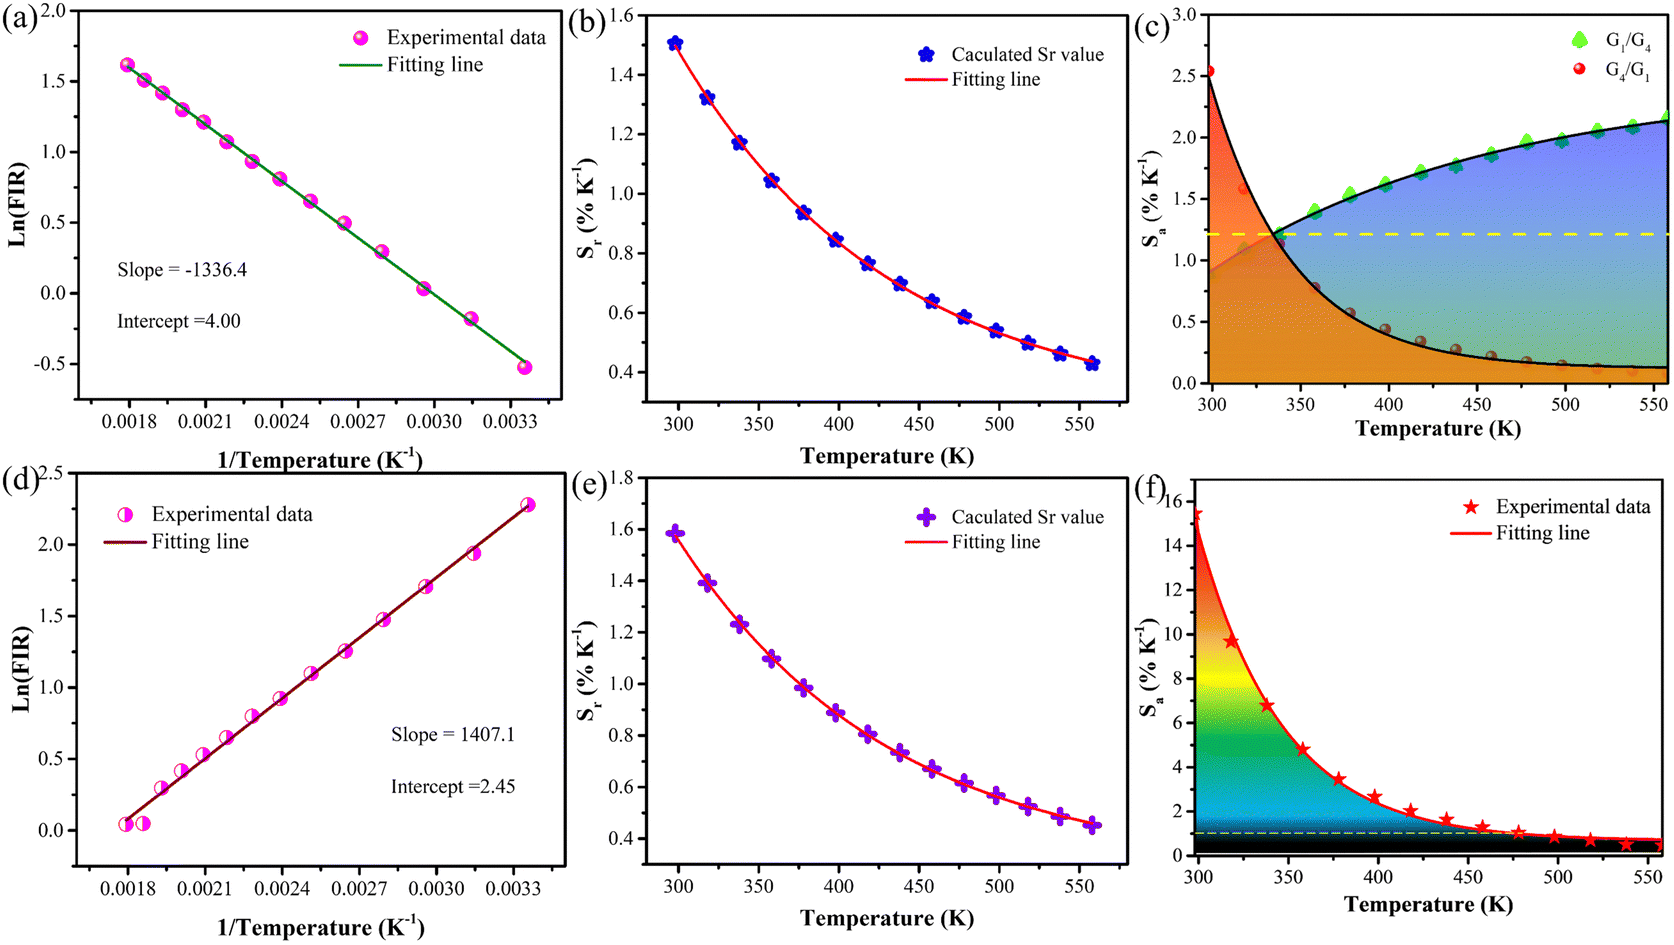
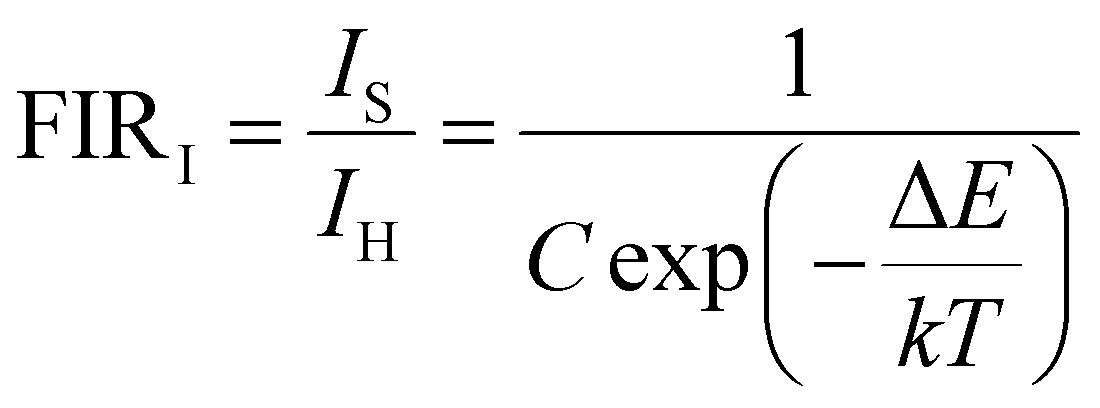
As displayed in Fig. 4(a), the Yb/Er/ZnGdO sample based on the TCL pair 2H211/2(2)/4S3/2(1) showed an excellent linear relationship between the ln(FIR) and 1/T in the temperature range 298–558 K, and the slope value (−ΔE/k) of 1336.4 was obtained. The temperature sensitivity, including absolute sensitivity (Sa) and relative sensitivity (Sr), are vital parameters for evaluating the capability of a thermometer.9Sa represents the change rate of FIR with response to the temperature variation, while Sr is defined as the relative change in FIR per degree of temperature change. The values of Sa-max and Sr-max represent the maximum ability of temperature sensitive performance and are usually used for comparing the temperature sensing performances of different materials.9 To better evaluate the temperature sensing performance, Sa and Sr are calculated by eqn (3) and (4).44
 | (3) |
 | (4) |
 | ||
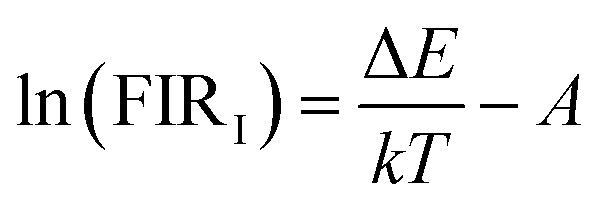
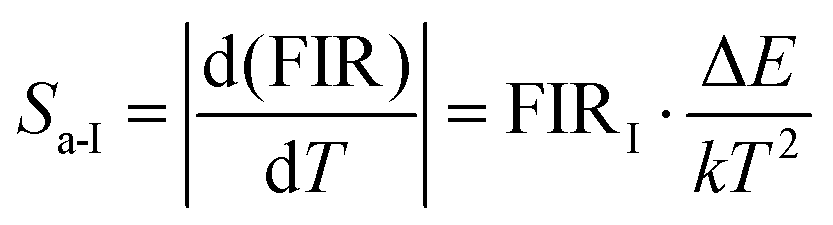
| Fig. 4 (a) Monolog plot of the FIR based on the sublevel TCL pair 2H211/2(2)/4S3/2(1)vs. the inverse absolute temperature. (b) Temperature-dependent Sr based on TCL pairs 2H211/2(2)/4S3/2(1). (c) Temperature-dependent Sa based on TCL pairs 2H11/2(2)/4S3/2(1) (G1/G4) and 4S3/2(1)/2H11/2(2) (G4/G1). (d) Monolog plot of the FIR based on the level pair 4F9/2/2H11/2(2)vs. the inverse absolute temperature. (e) Temperature-dependent Sr based on the level pair 4F9/2/2H11/2(2). (f) Temperature-dependent Sa based on the level pair 4F9/2/2H11/2(2). | ||
S r was calculated and the corresponding resultant curve is presented in Fig. 4(b); it is obvious that Sr is negatively correlated with temperature. At 298 K, the Sr based on the TCL pair of 2H211/2(2)/4S3/2(1) of the Yb/Er/ZnGdO sample reached the maximal value of about 1.51% K−1. In contrast, the Sa of the TCL pair 2H11/2(2)/4S3/2(1) of the Yb/Er/ZnGdO sample was enhanced with the continuous increase in temperature. When the temperature reached 558 K, Sa attained the maximal value of about 2.16% K−1. The primary performance parameters of the most representative luminescence thermometers are summarized in Table 1. The absolute sensitivity and relative sensitivity showed opposite trends with increasing temperature. To overcome this problem, the inverted FIR technique was utilized viaeqn (5) and (6).45
 | (5) |
 | (6) |
| Materials | Coupled pair | S r-max (%) | S a-max (%) | Δλ (nm) | T-range (K) | Ref. |
|---|---|---|---|---|---|---|
| YF3:Er3+ | 4F9/2–4S3/2 | 0.46 | 12.7 | 112 | 303–500 | 2 |
| NaBiF4:Yb,Er | 2H11/2–4S3/2 | — | 0.65 | 19 | 223–548 | 8 |
| Ba3Y4O9:Er3+/Yb3+ | 2H11/2–4S3/2 | 1.34 | 0.458 | 23 | 298–573 | 46 |
| NaBiF4:Er3+/Yb3+ | 2H11/2–4S3/2 | 1.24 | 0.57 | — | 303–483 | 47 |
| YF3:Yb3+,Er3+ | 2H11/2–4S3/2 | 1.20 | — | 20 | 295–478 | 48 |
| GdVO4:Er3+,Eu3+,Yb3+ | 2H11/2–4S3/2 | 1.11 | 0.85 | 31 | 307–473 | 49 |
| Bi2SiO5:Yb3+,Er3+ | 2H11/2–4S3/2 | 0.99 | 0.385 | 20 | 298–600 | 50 |
| La2Ti2O7:Er3+/Yb3+ | 2H11/2–4S3/2 | 0.36 | 0.57 | 24 | 333–553 | 51 |
| Cs2NaInCl6:Er3+/Yb3+ | 2H11/2–4S3/2 | 0.94 | — | 25 | 80–500 | 52 |
| ZnGdO:Yb3+,Er3+ | 4S3/2(1)–H11/2(2) | 1.51 | 2.54 | 32 | 298–558 | This work |
| ZnGdO:Yb3+,Er3+ | 4F9/2–2H11/2(2) | 1.61 | 15.5 | 149 | 298–558 | This work |
The corresponding Sa and Sr were obtained from eqn (7) and (8):48
 | (7) |
 | (8) |
The plot of ln(IS/IH) based on the 4S3/2(1)/2H11/2(2) level pair versus 1/T is displayed in Fig. S8 (ESI†). Note that the relative sensitivity did not change after inversing the FIR because the Sr is only related to the slope value (ΔE/k). The plot of the absolute sensitivity based on the TCL pair 4S3/2(1)/2H11/2(2) against temperature in Fig. 4(c) revealed that Sa improves along with the increase in temperature, and a maximum Sa of 2.54% K−1 was observed at 298 K, surmounting the contradiction between Sa and Sr of the traditional FIR technique.
The temperature sensing behavior of the non-thermal coupled level pair 4F9/2/2H11/2(2) was investigated due to its outstanding signal discriminability. As shown in Fig. S9 (ESI†), the green emission at 520 nm showed increased intensity as the temperature was enhanced, while the red emission at 669 nm dropped obviously. The FIR value of level pair 4F9/2/2H11/2(2) exhibited the same dependent relationship between temperature and the TCL pair. The ln(FIR) and 1/T plot gave a good linear fit (eqn (6)) in the temperature range from 298 K to 558 K, as presented in Fig. 4(d). The slope of the coupled pair 4F9/2/2H11/2(2) outperformed that in the TCL pair H11/2(2)/4S3/2(1). The Sa and Sr of coupled pair 4F9/2/2H11/2(2) were calculated using eqn (7) and (8). Fig. 4(e) displays the plot of the relative sensitivity of the coupled pair 4F9/2/2H11/2(2) and temperature. The Sr-max value of the level pair 4F9/2/2H11/2(2) was 1.61% K−1 at 298 K, which is better than the traditional upconversion thermometric materials mentioned in Table 1. Importantly, the Sa value-based coupled pair 4F9/2/2H11/2(2) was larger than 1.0% K over the 298–518 K range, and a maximum absolute sensitivity of 15.5% K was achieved at 298 K (Fig. 4(f)). This indicates that Yb/Er/ZnGdO microflowers are greatly promising for applications in temperature detection.
3.4. Mechanistic investigation of the zero-thermal-quenching green upconversion luminescence process
From the ESR, XPS and TEM results, as well as luminescence spectra (Fig. 6(a)), it can be inferred that interior defects of O vacancies induced by Ln3+ (Gd/Er/Yb) doping can result in the energy level observed at 611 nm. In view of the defect's emission, the thermally enhanced green emission phenomenon can be explained by the defect-assisted thermal distribution, as illustrated in Fig. 5. At room temperature, the electrons in the 4f ground state of Er3+ are excited into the 4I13/2 excitation states via energy transfer from Yb3+ to Er3+ and nonradiative relaxation processes, followed by energy transfer from Yb3+ to the defect level, and electrons are trapped by the defect energy, achieving orange emission. When the temperature increases, the energy is transferred from defect levels to the Er3+ 4S3/2(1) level, which leads to an increase in green emission to compensate for the emission loss because of nonradiative transitions at high temperatures. Since the compensated emission loss outbalances nonradiative transitions, thermally enhanced green emission can be realized.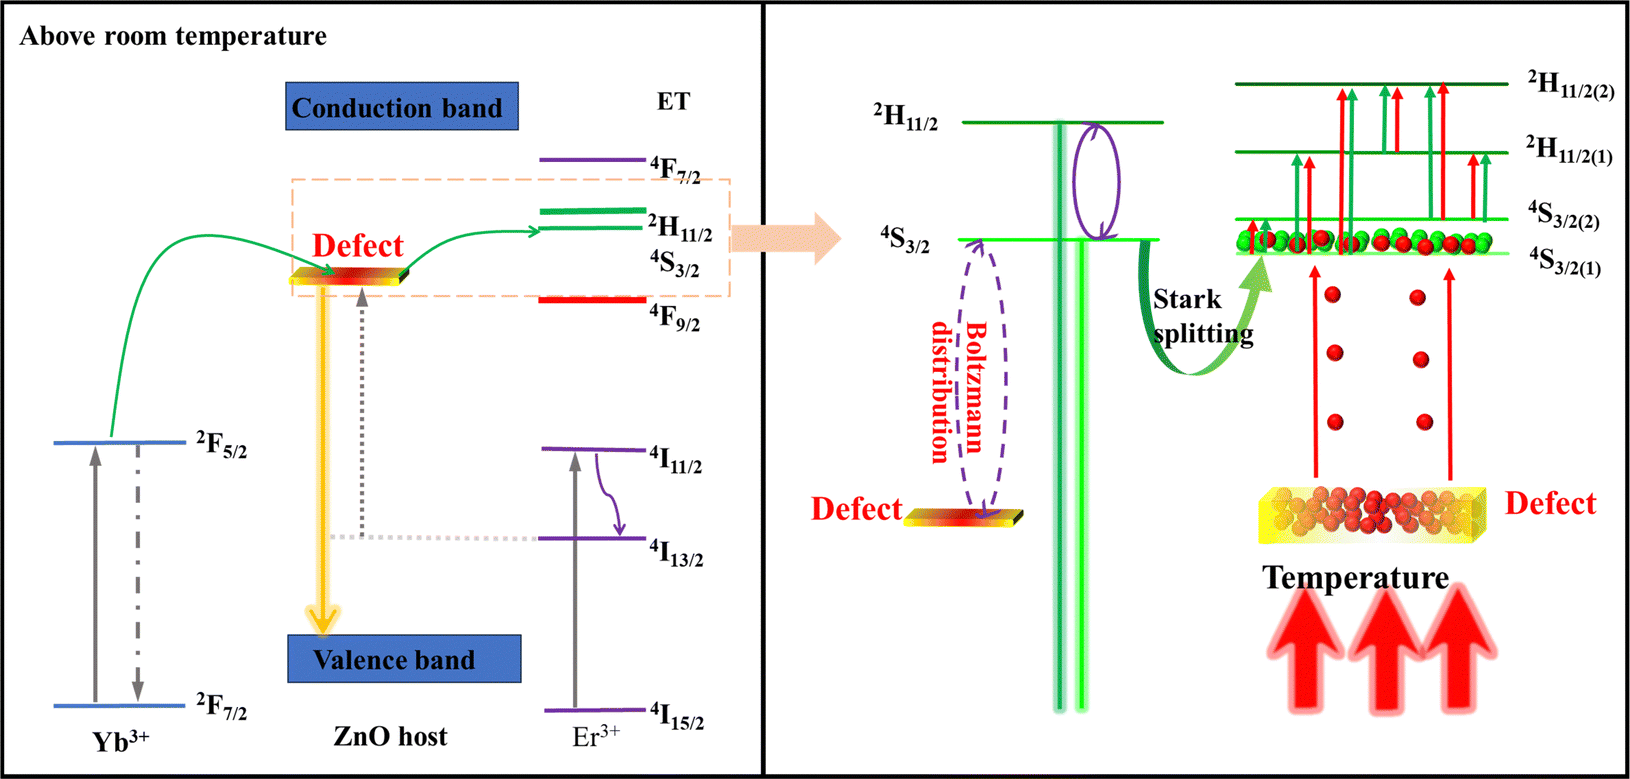 | ||
| Fig. 5 Schematic diagram of thermally activated green upconversion emission. | ||
To clarify the defect interaction via the relationship between temperature and green emitting levels, the variations in the emission intensity ratio of the green emission and defect with temperature were studied. The luminescence intensity ratio of green emission and defect emission with temperature was consistent with exponential fitting, same as the relationship between traditional thermally coupled energy pairs of Er3+ ions with temperature (Fig. 6(b)). Considering that the energy space of the defect energy level and 4S3/2(1) energy level is about 1749 cm−1, following the Boltzmann distribution, it can be supposed that the improvement in the emission intensity with increasing temperature is most likely due to the fact that the increment in the thermal energy is beneficial for efficient energy transfer from the defect energy level to the 4S3/2(1) energy level via the Boltzmann distribution.
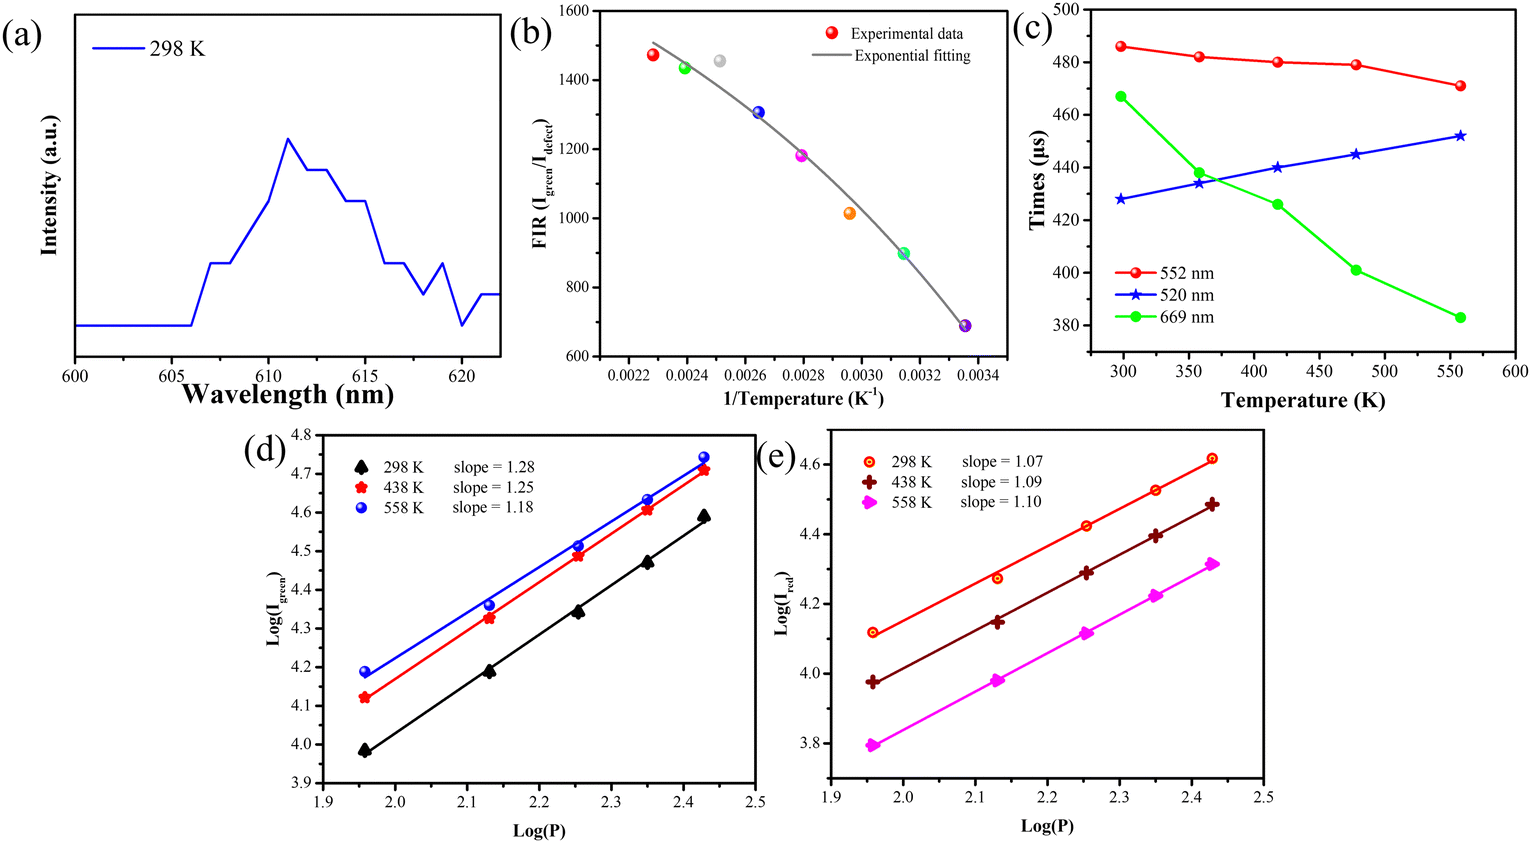 | ||
| Fig. 6 (a) Locally amplified upconversion luminescence spectra of defect levels. (b) Temperature-dependent FIR(Igreen/Idefect) value. (c) The Er3+ lifetime at 520 nm, 552 nm, and 669 nm versus temperature. (d) Power dependence of green emission in Yb/Er/ZnGdO particles with a citric acid content of 12 mM. (e) Power dependence of red emission in Yb/Er/ZnGdO particles with citric acid content 12 mM. | ||
To prove the thermally assisted energy transfer from the defect level to the 4S3/2(1) energy level via the Boltzmann distribution, the decay behaviors of Er3+ emissions at wavelengths 520 nm, 552 nm and 669 nm for Yb/Er/ZnGdO microflowers with citric acid content 12 mM were measured as shown in Fig. S10–S12 (ESI†). All the decay curves could be well fitted by a double-exponential function as follows:53
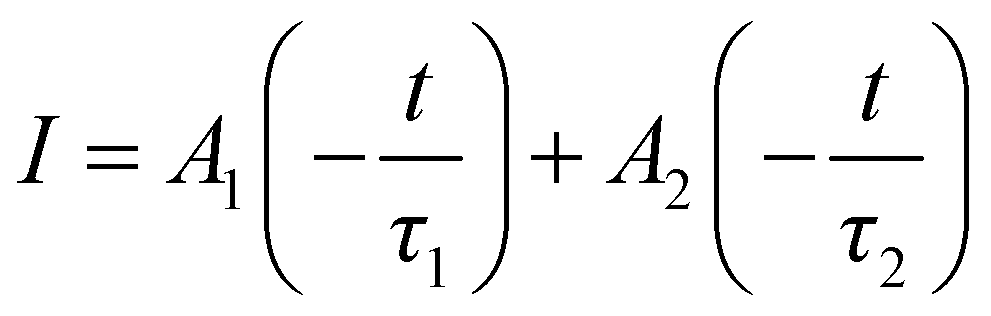 | (9) |
The fluorescence lifetimes are shown in Table S2 (ESI†). The fluorescence lifetime slightly shortened from 486 μs to 471 μs as the temperature increased from 298 K to 558 K in the case of the Er3+ emissions at 552 nm for the Yb/Er/ZnGdO microflowers with citric acid content of 12 mM. The lifetime at 520 nm gradually became longer from 428 μs to 452 μs with the increase of the temperature. In contrast, the lifetime at 669 nm significantly decreased from 467 μs to 383 μs as the temperature increased. Dynamic analysis showed that the variation tendency of the lifetime is coincident with that of the upconversion emission intensity. According to the report, temperature has an important impact on luminescence lifetimes due to the nonradiative relaxation process.54,55 In general, as the temperature rises, the nonradiative relaxation process increases, leading to the shortening of the lifetime. Compared to the significant change in lifetime at 669 nm with temperature, the lifetime at 552 nm was only slightly shortened. This is because of the energy transfer from the defects energy level to the 4S3/2(1) energy level via the Boltzmann distribution. The prolonged lifetime at 520 nm with temperature further proved that energy transfer occurred from the defect energy level to the 4S3/2(1) level and then from the 4S3/2(1) level to the 2H11/2 level via Boltzmann distribution. Thus, the thermally enhanced upconversion emission is due to the energy transfer process from the defect level to the 4S3/2(1) energy level.
To further support these arguments experimentally, the power-dependent upconversion process was investigated. It is worth mentioning that the photon number (n) of green emissions was reduced with the increment of temperature from 298 to 438 and 558 K, while the n value of red emission was elevated as the temperature increased (Fig. 6(d)). This may be because the defect-assisted thermal distribution increased energy transfer between the defect and the green luminescence level, and the enhanced upconversion process resulted in a decrease in the photon number of green emissions. For the red emission, the non-radiative radiation probability increased when the temperature was elevated from 298 K to 438 K and 558 K, leading to the improvement in the linear decay process and the corresponding increment in the n value of red emission.
4. Conclusions
The thermal activation of green upconversion luminescence was observed in lanthanide-doped ZnGdO microflowers. This phenomenon is ascribed to the compensation of emission losses through energy transfer from the defect energy level to the green luminescence level via thermal excitation and a quasi-thermal equilibrium. Outstanding multiple temperature sensing behavior was realized in Yb/Er/ZnGdO microflowers. Sa and Sr up to 1.61% K−1 and 15.5% K−1 were achieved by utilizing the coupled pair 4F9/2/2H11/2(2) in parallel with excellent signal discriminability. This thermally activated luminescence not only provides new insights but also pushes forward the application of nano-contact optical sensing materials in temperature detection and optoelectronic devices.Author contributions
Conceptualization: B. S., W. Z. and A. H.; data curation: W. Z., A. H., H. M. and B. S.; formal analysis: W. Z., A. H., J. C., and B. J.; funding acquisition: A. H. and B. S.; investigation: W. Z. and Y. L.; project administration: A. H. and B. S. resources: A. H. and B. S. software: W. Z., Y. L. and X. Y.; supervision: A. H. and B. S.; validation: A. H., C. C. and B. S. visualization: W. Z. and H. M. writing – original draft: W. Z., A. H., H. M. and B. S.; writing – review & editing: W. Z., A. H., H. M., B. J. and B. S.Conflicts of interest
The authors declare no conflict of interest.Acknowledgements
This work is supported by the China Postdoctoral Science Foundation (2023M732781).References
- C. D. S. Brites, P. P. Lima, N. J. O. Silva, A. Millan, V. S. Amaral, F. Palacio and L. D. Carlos, A Luminescent Molecular Thermometer for Long-term Absolute Temperature Measurements at the Nanoscale, Adv. Mater., 2010, 22, 4499–4504 CrossRef CAS PubMed.
- Z. Sun, M. Jia, Z. Fu, M. Zhang, H. Wang and Y. Xu, High-performance Disease Diagnosis Fluorescent Probe Based on New Type Structure YbF3: Er3+@SiO2@GQDs, Chem. Eng. J., 2020, 406, 126755 CrossRef.
- X. Wang, O. S. Wolfbeis and R. J. Meier, Luminescent Probes, and Sensors for Temperature, Chem. Soc. Rev., 2013, 42, 7834–7869 RSC.
- D. Chen, Z. Wan, Y. Zhou, X. Zhou, Y. Yu, J. Zhong, M. Ding and Z. Ji, Dual-phase Glass Ceramic: Structure, Dual-modal Luminescence, and Temperature Sensing Behaviors, ACS Appl. Mater. Interfaces, 2015, 7, 19484–19493 CrossRef CAS.
- C. D. S. Brites, S. Balabhadra and L. D. Carlos, Lanthanide-based Thermometers: At the Cutting-Edge of Luminescence Thermometry, Adv. Opt. Mater., 2018, 7, 1801239 CrossRef.
- P. R. N. Childs, J. R. Greenwood and C. A. Long, Review of Temperature Measurement, Rev. Sci. Instrum., 2000, 71, 2959–2978 CrossRef CAS.
- Y. S. Oh, J. H. Kim and Z. Xie, et al., Battery-free, Wireless Soft Sensors for Continuous Multi-Site Measurements of Pressure and Temperature from Patients at Risk for Pressure Injuries, Nat. Commun., 2021, 12, 5008 CrossRef CAS PubMed.
- R. An, Y. Liang and R. Deng, et al., Hollow Nanoparticles Synthesized via Ostwald Ripening and their Upconversion Luminescence-mediated Boltzmann Thermometry over a Wide Temperature Range, Light: Sci. Appl., 2022, 11, 217 CrossRef CAS PubMed.
- X. Cui, Y. Cheng and H. Lin, et al., Towards ultra-high Sensitive Colorimetric Nanothermometry: Constructing Thermal Coupling Channel for Electronically Independent Levels, Sens. Actuators, B, 2018, 256, 498–503 CrossRef CAS.
- A. A. Ansari, A. K. Parchur and M. K. Nazeeruddin, et al., Luminescent Lanthanide Nanocomposites in Thermometry: Chemistry of dopant Ions and Host Matrices, Coord. Chem. Rev., 2021, 444, 214040 CrossRef CAS.
- J. Zhou, B. Del Rosal and D. Jaque, et al., Advances and Challenges for Fluorescence Nanothermometry, Nat. Methods, 2020, 17, 967–980 CrossRef CAS PubMed.
- W. Zheng, B. Sun, Y. Li, T. Lei, R. Wang and J. Wu, Low Power High Purity Red Upconversion Emission and Multiple Temperature Sensing Behaviors in Yb3+,Er3+ Codoped Gd2O3 Porous Nanorods, ACS Sustainable Chem. Eng., 2020, 8, 9578–9588 CrossRef CAS.
- X. Zhu, W. Feng, J. Chang, Y. Tan, J. Li, M. Chen, Y. Sun and F. Li, Temperature-feedback Upconversion Nanocomposite for Accurate Photothermal Therapy at Facile Temperature, Nat. Commun., 2016, 7, 10437 CrossRef CAS PubMed.
- Y. Y. Tian, Y. Tian, P. Huang, L. Wang, Q. F. Shi and C. E. Cui, Effect of Yb3+ Concentration on Upconversion Luminescence and Temperature Sensing Behavior in Yb3+/Er3+ Co-doped YNbO4 Nanoparticles Prepared via Molten Salt Route, Chem. Eng. J., 2016, 297, 26–34 CrossRef CAS.
- B. Dong, B. Cao, Y. He, Z. Liu, Z. Li and Z. Feng, Temperature Sensing and in Vivo Imaging by Molybdenum Sensitized Visible Upconversion Luminescence of Rare-earth Oxides, Adv. Mater., 2012, 24, 1987–1993 CrossRef CAS PubMed.
- Y. Gao, F. Huang, H. Lin, J. Zhou, J. Xu and Y. Wang, A Novel Optical Thermometry Strategy Based on Diverse Thermal Response From two Intervalence Charge Transfer States, Adv. Funct. Mater., 2016, 26, 3139–3145 CrossRef CAS.
- H. Zou, X. Yang, B. Chen, Y. Du, B. Ren, X. Sun, X. Qiao, Q. Zhang and F. Wang, Thermal Enhancement of Upconversion by Negative Lattice Expansion in Orthorhombic Yb2W3O12, Angew. Chem., Int. Ed., 2019, 58, 17255–17259 CrossRef CAS PubMed.
- F. Vetrone, R. Naccache, A. Zamarron, A. J. de la Fuente, F. L. Sanz-Rodriguez, M. Maestro, E. Rodriguez, D. Jaque, J. Sole and J. Capobianco, Temperature Sensing using Fluorescent Nanothermometers, ACS Nano, 2010, 4, 3254–3258 CrossRef CAS.
- Y. H. Kim, P. Arunkumar, B. Y. Kim, S. Unithrattil, E. Kim, S. H. Moon, J. Y. Hyun, K. H. Kim, D. Lee and J. S. Lee, A Zero-thermal-quenching Phosphor, Nat. Mater., 2017, 16, 543–550 CrossRef CAS.
- D. Li, Q. Shao, Y. Dong and J. Jiang, Anomalous Temperature-Dependent Upconversion Luminescence of Small-sized NaYF4:Yb3+,Er3+ Nanoparticles, J. Phys. Chem. C, 2014, 118, 22807–22813 CrossRef CAS.
- Z. Wang, J. Christiansen, D. Wezendonk, X. Xie, M. A. van Huis and A. Meijerink, Thermal Enhancement and Quenching of Upconversion Emission in Nanocrystals, Nanoscale, 2019, 11, 12188–12197 RSC.
- Y. Hu, Q. Shao, P. Zhang, Y. Dong, F. Fang and J. Jiangtt, Mechanistic Investigations on the Dramatic Thermally-induced Luminescence Enhancement in Upconversion Nanocrystals, J. Phys. Chem. C, 2018, 122, 26142–26152 CrossRef CAS.
- J. Zhou, S. Wen, J. Liao, C. Clarke, S. A. Tawfik, W. Ren, C. Mi, F. Wang and D. Y. Jin, Activation of the Surface Dark-layer to Enhance Upconversion in a Thermal field, Nat. Photonics, 2018, 12, 154–158 CrossRef CAS.
- B. Sun, S. Lou, Z. Qian, P. Zuo, C. Du, Y. Ma, H. Huo, J. Xie, J. Wang and G. Yin, Pseudocapacitive Li+ Storage Boost Ultrahigh Rate Performance of Structure-Tailored CoFe2O4@Fe2O3 Hollow Spheres Triggered by Engineered Surface and Near-surface Reactions, Nano Energy, 2019, 66, 104179 CrossRef CAS.
- B. Sun, S. Lou, W. Zheng, Z. Qian, C. Cui, P. Zuo, C. Du, J. Xie, J. Wang and G. Yin, Synergistic Engineering of Defects and Architecture in Co3O4@C Nanosheets toward Li/Na Ion Batteries with Enhanced Pseudocapacitances, Nano Energy, 2020, 78, 105366 CrossRef CAS.
- L. Sun, Q. Shao, Y. Zhang, H. Jiang, S. Ge, S. Lou, J. Lin and J. Zhang, N self-doped ZnO Derived from Microwave Hydrothermal Synthesized Zeolitic Imidazolate Framework-8 Toward Enhanced Photocatalytic Degradation of Methylene Blue, J. Colloid Interface Sci., 2019, 565, 142–155 CrossRef.
- G. L. Kabongo, G. H. Mhlongo and B. M. Mothudi, et al., Structural, Photoluminescence and XPS Properties of Tm3+ Ions in ZnO Nanostructures, J. Lumin., 2017, 187, 141–153 CrossRef CAS.
- H. Ahmadian, F. Al Hessari and A. M. Arabi, Preparation and Characterization of Luminescent Nanostructured Gd2O3–Y2O3:Eu Synthesized by the Slution Combustion Process, Ceram. Int., 2019, 45, 18778–18787 CrossRef CAS.
- J. Reszczyńska, T. Grzyb, J. W. Sobczak, W. Lisowski, M. Gazda, B. Ohtani and A. Zaleska, Visible Light Activity of Rare Earth Metal Doped (Er3+, Yb3+ or Er3+/Yb3+) Titania Photocatalysts, Appl. Catal., B, 2015, 163, 40–49 CrossRef.
- M. Ding, D. Chen, S. Yin, Z. Ji, J. Zhong, Y. Ni, C. Lu and Z. Xu, Simultaneous Morphology Manipulation and Upconversion Luminescence Enhancement of β-NaYF4:Yb3+/Er3+ Microcrystals by Simply Tuning the KF Dosage, Sci. Rep., 2015, 5, 12745 CrossRef CAS.
- C. Yu, K. Yang, Y. Xie, Q. Fan, J. Yu, Q. Shu and C. Wang, Novel Hollow Pt–ZnO Nanocomposite Microspheres with Hierarchical Structure and Enhanced Photocatalytic Activity and Stability, Nanoscale, 2013, 5, 2142–2151 RSC.
- S. Majeed and S. A. Shivashankar, Rapid, Microwave-assisted Synthesis of Gd2O3 and Eu:Gd2O3 Nanocrystals: Characterization, Magnetic, Optical and Biological Studies, J. Mater. Chem. B, 2014, 2, 5585–5593 RSC.
- W. Zheng, B. Sun, Y. Li, R. Wang and Y. Xu, Multicolor Tunable Luminescence and Laser-Sensitization Induced Upconversion Enhancement in Ln-doped Gd2O3 Crystals for Anti-counterfeiting, Mater. Chem. Front., 2019, 3, 2403–2413 RSC.
- D. Chen, Y. Yu, F. Huang, P. Huang, A. Yang and Y. Wang, Modifying the Size and Shape of Monodisperse Bifunctional Alkaline-earth Fluoride Nanocrystals through Lanthanide Doping, J. Am. Chem. Soc., 2010, 132, 9976–9978 CrossRef CAS.
- F. Wang, Y. Han, C. Lim, Y. Lu, J. Wang, J. Xu, H. Chen, C. Zhang, M. Hong and X. Liu, Simultaneous Phase and Size Control of Upconversion Nanocrystals through Lanthanide Doping, Nature, 2010, 463, 1061–1065 CrossRef CAS.
- S. Erwin, L. Zu, M. I. Haftel, A. L. Efros, T. A. Kennedy and D. J. Norris, Doping Semiconductor Nanocrystals, Nature, 2005, 436, 91–94 CrossRef CAS.
- X. Jiao, Z. Chen, X. Li, Y. Sun, S. Gao, W. Yan, C. Wang, Q. Zhang, Y. Lin, Y. Luo and Y. Xie, Defect-Mediated Electron-hole Separation in One-unit-cell ZnIn2S4 Layers for Boosted Solar-driven CO2 Reduction, J. Am. Chem. Soc., 2017, 139, 7586–7594 CrossRef CAS.
- F. Wang, J. Wang and X. Liu, Direct Evidence of a Surface Quenching Effect on Size-dependent Luminescence of Upconversion Nanoparticles, Angew. Chem., Int. Ed., 2010, 49, 7456–7460 CrossRef CAS.
- M. Wu, G. Guan and B. Yao, et al., Upconversion luminescence of Gd2O3: Ln3+ Nanorods for White Emission and Cellular Imaging via Surface Charging and Crystallinity Control, ACS Appl. Nano Mater., 2019, 2, 1421–1430 CrossRef CAS.
- C. Zhao, X. Kong and X. Liu, et al., Li+ Ion Doping: An Approach for Improving the Crystallinity and Upconversion Emissions of NaYF4: Yb3+, Tm3+ Nanoparticles, Nanoscale, 2013, 5, 8084–8089 RSC.
- H. Suo, C. Guo, Z. Yang, S. Zhou, C. Duan and M. Yin, Thermometric and Optical Heating Bi-Functional Properties of Upconversion Phosphor Ba5Gd8Zn4O21:Yb3+/Tm3+, J. Mater. Chem. C, 2015, 3, 7379–7385 RSC.
- H. Zheng, B. Chen, H. Yu, X. P. Li, J. Zhang, J. Sun, L. Tong, Z. Wu, H. Zhong, R. Hua and H. Xia, Rod-shaped NaY(MoO4)2:Sm3+/Yb3+ Nanoheaters for Photothermal Conversion: Influence of Doping Concentration and Excitation Power Density, Sens. Actuators, B, 2016, 234, 286–293 CrossRef CAS.
- H. Zheng, B. Chen, H. Yu, J. Zhang, J. Sun, X. Li, M. Sun, B. Tian, S. Fu, H. Zhong, B. Dong, R. Hua and H. Xia, Microwave Assisted Hydrothermal Synthesis and Temperature Sensing Application of Er3+/Yb3+ doped NaY(WO4)2 Microstructures, J. Colloid Interface Sci., 2014, 420, 27–34 CrossRef CAS PubMed.
- L. Luo, W. Ran, P. Du, W. Li and D. Wang, Photocatalytic and Thermometric Characteristics of Er3+-activated Bi5IO7 Upconverting Microparticles, Adv. Mater. Interfaces, 2020, 7, 1902208 CrossRef CAS.
- Y. Wu, S. Xu, Z. Xiao, F. Lai, J. Huang, J. Fu, X. Ye and W. You, A Universal Strategy to Enhance the Absolute Sensitivity for Temperature Detection in Bright Er3+/Yb3+ doped Double Perovskite Gd2ZnTiO6 Phosphors, Mater. Chem. Front., 2020, 4, 1182–1191 RSC.
- S. Liu, H. Ming, J. Cui, S. Liu, W. You, X. Ye, Y. Yang, H. Nie and R. Wang, Color-tunable Upconversion Luminescence and Multiple Temperature Sensing and Optical Heating Properties of Ba3Y4O9:Er3+/Yb3+ Phosphors, J. Phys. Chem. C, 2018, 122, 16289–16303 CrossRef CAS.
- P. Du, L. Luo, X. Huang and J. Yu, Ultrafast Synthesis of Bifunctional Er3+/Yb3+-codoped NaBiF4 Upconverting Nanoparticles for Nanothermometer and Optical Heater, J. Colloid Interface Sci., 2018, 514, 172–181 CrossRef CAS.
- S. Goderski, M. Runowski, P. Wony, V. Lavin and S. Lis, Lanthanide Upconverted Luminescence for Simultaneous Contactless Optical Thermometry and Manometry-Sensing under Extreme Conditions of Pressure and Temperature, ACS Appl. Mater. Interfaces, 2020, 12, 40475–40485 CrossRef CAS.
- T. V. Gavrilovic, D. J. Jovanovic, V. Lojpur and M. D. Dramicanin, Multifunctional Eu3+- and Er3+/Yb3+-Doped GdVO4 Nanoparticles Synthesized by Reverse Micelle Method, Sci. Rep., 2014, 4, 4209 CrossRef.
- D. Chen, L. Zhang, Y. Liang, W. Wang, S. Yan, J. Bi and K. Sun, Yolk–shell Structured Bi2SiO5:Yb3+,Ln3+ (Ln = Er, Ho, Tm) Upconversion Nanophosphors for Optical Thermometry and Solid-state Lighting, CrystEngComm, 2020, 22, 4438–4448 RSC.
- Y. Liu, G. Bai, E. Pan, Y. Hua, L. Chen and S. Xu, Upconversion Fluorescence Property of Er3+/Yb3+ codoped Lanthanum Titanate Microcrystals for Optical Thermometry, J. Alloys Compd., 2020, 822, 153449 CrossRef CAS.
- Z. Rao, Z. Li and X. Zhao, et al., Targeted High-precision Up-converting Thermometer Platform over Multiple Temperature Zones with Er3+, Mater. Horiz., 2023, 10, 1816–1824 RSC.
- J. Qiao, L. Ning and M. S. Molokeev, et al., Eu2+ site preferences in the mixed cation K2BaCa(PO4)2 and thermally stable luminescence, J. Am. Chem. Soc., 2018, 140, 9730–9736 CrossRef CAS PubMed.
- P. Haro-González, L. Martínez-Maestro and I. R. Martín, et al., High-Sensitivity Fluorescence Lifetime Thermal Sensing Based on CdTe Quantum Dots, Small, 2012, 8(17), 2652–2658 CrossRef.
- K. Okabe, N. Inada and C. Gota, et al., Intracellular temperature mapping with a fluorescent polymeric thermometer and fluorescence lifetime imaging microscopy, Nat. Commun., 2012, 3, 705 CrossRef.
Footnotes |
| † Electronic supplementary information (ESI) available. See DOI: https://doi.org/10.1039/d3mh01360j |
| ‡ Equally contributed. |
| This journal is © The Royal Society of Chemistry 2024 |