DOI:
10.1039/D3MD00483J
(Research Article)
RSC Med. Chem., 2024,
15, 127-138
Development of pharmacophore models for AcrB protein and the identification of potential adjuvant candidates for overcoming efflux-mediated colistin resistance†
Received
11th September 2023
, Accepted 26th October 2023
First published on 28th October 2023
Abstract
Growing multi-drug resistance (MDR) among ESKAPE pathogens is a huge challenge. Increased resistance to last-resort antibiotics, like colistin, has further aggravated this. Efflux is identified as a major route of colistin resistance. So, finding an FDA-approved efflux inhibitor for potential application as an adjuvant to colistin was the primary objective of this study. E. coli-AcrB pump inhibitors and substrates were used to develop and validate the pharmacophoric model. Drugs confirming this pharmacophore were subjected to molecular docking to identify hits for the AcrB binding pocket. The efflux inhibition potential of the top hit was validated through the in vitro evaluation of the minimum inhibitory concentration (MIC) in combination with colistin. The checkerboard assay was done to demonstrate synergism, which was further corroborated by the Time-kill assay. Ten common pharmacophore hypotheses were successfully generated using substrate/inhibitors. Following enrichment analysis, AHHNR.100 was identified as the top-ranked hypothesis, and 207 unique compounds were found to conform to this hypothesis. The multi-step docking of these compounds against the AcrB protein revealed argatroban as the top non-antibiotic hit. This significantly inhibited the efflux activity of colistin-resistant clinical isolates K. pneumoniae (n = 1) and M. morganii (n = 2). Further, their combination with colistin enhanced the susceptibility of these isolates, and the effect was found to be synergistic. Accordingly, the time-kill assay of this combination showed 8-log and 2-log reductions against K. pneumoniae and M. morganii, respectively. In conclusion, this study found argatroban as a bacterial efflux inhibitor that can be potentially used to overcome efflux-mediated resistance.
1. Introduction
WHO has announced antimicrobial resistance (AMR) as one of the top 10 global public health threats faced by humanity. Colistin has been considered the last-resort antibiotic, especially for life-threatening infections caused by carbapenem-resistant Enterobacteriaceae. However, resistance to colistin has been increasingly reported in recent years.1,2 Due to the lack of any immediate alternative, it is prudent to explore approaches to increase the sensitivity of pathogens to colistin. A greater understanding of the basis of AMR is necessary to develop approaches to increase the sensitivity of pathogens to colistin. Several mechanisms have been proposed for this. Chromosomal alterations of various two-component systems (TCSs), such as PmrAB, PhoPQ, CrrAB, and the modulator of PmrAB and PhoPQ TCS, known as MgrB, have been reported to induce resistance to colistin. Additionally, mutations in genes involved in the synthesis of lipopolysaccharides (LPS) and plasmid-mediated MCR genes,3,4 as well as capsule formation, have been reported to mediate resistance to colistin.5 Extrusion through efflux pump is a common defense mechanism of host cells. Pathogens also use this mechanism to resist colistin.4,6 This mechanism is particularly relevant in Gram-negative bacteria, which utilize AcrAB-TolC efflux pumps to expel antimicrobial compounds from cells.7 The AcrB protein is a clinically significant efflux pump that extrudes various structurally diverse antibiotics. Although other efflux pumps also exist in bacteria, the AcrAB-TolC system is prevalent in more than 80% of clinical isolates of Enterobacteriaceae, making it one of the most prevalent efflux pump systems in these organisms.8 Moreover, due to the highly conserved nature of AcrB and extensive studies on the AcrAB-TolC pump system, it is a promising target for developing efflux pump inhibitors (EPIs). Thus, developing EPIs could be a promising approach to increase the sensitivity of pathogens to colistin.9
Klebsiella pneumoniae and Morganella morganii are two pathogenic bacteria with significant clinical importance and are listed in the WHO priority pathogen list. K. pneumoniae is a Gram-negative, non-motile, encapsulated bacterium. Although it is commonly found in the human gastrointestinal tract microbiota, it can cause severe infections, such as pneumonia, urinary tract infections, and sepsis.10 Similarly, M. morganii is a Gram-negative bacterium and a natural inhabitant of the human intestinal tract, which can also cause various infections, including urinary tract infections, septicemia, and wound infections.11 The epidemiology of these bacteria is complex, as they are found in various environments, including hospitals, long-term care facilities, and the community. Infection risk factors include age, underlying medical conditions, and exposure to specific medical procedures or devices, such as catheters or ventilators.12 Moreover, certain strains of K. pneumoniae and M. morganii are associated with outbreaks and hospital-acquired infections, highlighting the need for effective infection treatment measures.11,13 The emergence of colistin-resistant strains of K. pneumoniae and M. morganii has become a significant public health concern worldwide,12,14 and there is an unmet need to increase their sensitivity to colistin.
Considering the possible involvement of the AcrB efflux transporter in the resistance of K. pneumoniae and M. morganii to colistin,15 this study was undertaken to identify an FDA-approved efflux inhibitor through a ligand-based pharmacophore approach. This was further validated in vitro.
2. Materials and methods
2.1 Materials
Cation-adjusted Mueller–Hinton broth (CaMHB), Luria-Bertani agar (LBA), Luria-Bertani broth (LB), tryptic soy agar (TSA), EtBr (ethidium bromide), TTC (triphenyl tetrazolium chloride), NaCl (sodium chloride), and dimethyl sulfoxide (DMSO) were procured from HiMedia (India). Carbonyl cyanide m-chlorophenylhydrazine (CCCP), colistin sulfate, and argatroban were procured from Sigma-Aldrich Chemical Co. (India).
2.2 Selection of structurally diverse substrates of efflux pumps
The FDA-approved compounds were prepared by a ligand-based pharmacophoric approach to identify an inhibitor of the AcrB efflux pump that could be used as an adjuvant to enhance susceptibility to colistin. It is recognized that there needs to be more experimentally validated EPIs for AcrB-K. pneumoniae or AcrB-M. morganii, While conversely, greater numbers of EPIs have been experimentally validated against AcrB-E. coli.7,16–18 As there is a high sequence similarity of AcrB-E. coli with AcrB-K. pneumoniae (91%) and AcrB-M. morganii (80.42%), and E. coli is a model pathogen,19 AcrB-E. coli (PDB ID: 4DX5) was used in the study. The predominant efflux pump of E. coli and K. pneumoniae is the tripartite efflux system AcrA-AcrB-TolC of the RND family.20 The inner membrane component AcrB is the major site for substrate recognition and energy transduction of the entire tripartite system.16 Data on E. coli-AcrB pump inhibitors and substrates were collected from a literature survey, including their minimum inhibitory concentration (MIC) data. The MIC of the inhibitors were converted into pMICs using the following formula.
pMIC = −log![[thin space (1/6-em)]](https://www.rsc.org/images/entities/char_2009.gif) (MIC) (MIC) |
The 2D molecular structures of these substrates/inhibitors were retrieved from the PubChem database, and the geometry in 3D space was optimized using the LigPrep module of Schrödinger's Maestro suite.21
2.3 FDA-approved drugs dataset
The FDA-approved drugs from different databases, like the Zinc,22 Superdrug,23 Sweetlead,24 and ChemSpider25 databases, were merged to remove redundancies. The 3D structures generated using the Maestro version 10.2 (Schrödinger)26 were optimized using the LigPrep module (v3.4, Schrödinger 2015-2).21 Partial atomic charges were ascribed, and possible ionization states were generated at a pH of 7.0 using the OPLS_2005 force field for optimization and production of low-energy conformers of the ligands.27 Energy minimization was performed for every ligand till it reached a root mean square deviation (RMSD) cutoff of 0.01 Å. Following LigPrep, the compounds were converted into a phase dataset format for input for pharmacophore-based virtual screening.28,29
2.4 Ligand-based pharmacophore modeling
2.4.1 Active ligand dataset preparation.
The Phase (v4.3, Schrödinger 2015-2) module was used for the generation of the pharmacophore and 3D quantitative structure–activity relationship (QSAR) models of the efflux protein inhibitors (EPIs).29 Active compounds were cleaned, and different conformations of compounds were generated. Activity thresholds were calculated according to the pMIC value. A value of >0.1 pMIC was considered active, and values less than this were considered moderately active.
2.4.2 Creating sites and finding a common pharmacophore hypothesis.
The sites were assigned containing a hydrogen bond acceptor (A), hydrogen bond donor (D), hydrophobic group (H), negatively ionizable (N), positively ionizable (P), and aromatic ring (R).29 The program aligned the molecules based on the assigned sites, and different hypotheses were generated according to the maximum and minimum match sites.29
2.4.3 Hypothesis scoring, QSAR modeling, and validation.
Five sites were found to be typical for all the selected compounds in the generated hypotheses. Using partial least square (PLS) regression statistics and keeping the grid spacing of 1 Å, 3D QSAR models were generated. Six PLS factors were included in model development, as a steady increase in the statistical significance and predictivity was observed to up to six PLS factors.
QSAR modeling was done by developing activity/property predictors, which were as follows: correlation coefficient (R2), stability, Q2, RMSE, standard deviation, Pearson, and P-value. A total of 10 common pharmacophore hypotheses were successfully generated and scored against the observed and predicted activity of the 32 training molecules. All the hypotheses were ranked according to their survival score, starting from the highest to the lowest. The decoy data set of 32 active compounds was generated through the DUD.E database30 consisting of 50 decoys for each compound to validate these hypotheses. Finally, the hypotheses were validated against active molecules and decoy data sets.
2.4.4 3D-QSAR model-based virtual screening.
Hypothesis AHHNR.100 was selected based on the survival score for the pharmacophore-based virtual screening (VS).31 The hits were evaluated based on the enrichment factor, yield of actives, specificity, sensitivity, and the area under the curve (ROC-AUC). Approved drugs that matched the pharmacophoric features of the 3D-QSAR model were used for the multi-step VS against the AcrB protein.
2.5 Molecular docking and high-throughput virtual screening
For evaluation of the ligand interaction into the AcrB binding pocket, molecular docking was carried out using the Schrödinger suite.32 The critical residues of the deep binding and proximal pockets were identified in the target (PDB ID: 4DX5). The grid was generated within a 15 Å radius using them as central residues. The hit compounds from VS were screened against the AcrB protein. The docking score was used to rank the ligands. The top 20% hits in this screening were further refined through standard precision (SP) docking. This was again enriched by subjecting the top 50% of hits to extra precision (XP) docking.33
2.6 Sample collection and species identification
Twenty-three non-duplicate clinical isolates from various sources, including urine, vaginal, urethral, sputum, wound, blood, and pus, were aseptically obtained from the Microbiology Department of AMRI hospital, IMS-SUM Hospital and AIIMS, Bhubaneswar, India, over 3 months. Species identification and antibiogram analysis of the isolates were performed using the automated VITEK2 system.34 The antibiogram results were interpreted based on the guidelines of Clinical and Laboratory Standards Institute (CLSI),35 and isolates with an MDR resistance profile against multiple classes of antibiotics, including polycationic peptide antimicrobial (colistin), were selected for further studies.
Further, to confirm the species of the collected isolates, the 16S rRNA genes were amplified, sequenced, and aligned against the reference 16S rRNA database using BLAST. Rapid one-step extraction (ROSE) was used to extract genomic DNA from the selected isolates.36 The OD260/280 ratio with values of 1.8–2.0 was used to test the purity and concentration of the extracted DNA. The 16S rRNA genes were amplified using universal primers (27F 5′-AGAGTTTGATCCTGGCTCAG-3′; 1492R 5′-GGTTACCTTGTTACGACTT-3′) and subjected to Sanger-di-deoxy sequencing. The sequences were aligned against NCBI's reference RNA database using BLAST (v2.2.27+; options: E value 0.01, Per. identity 97%). The best alignments, i.e., the ones with the highest score, were chosen, and the corresponding ones were considered species, wherever the alignment identity was ≥95%.
2.7 Minimum inhibitory concentration (MIC) determination
The MICs for colistin, CCCP (carbonyl cyanide m-chlorophenyl hydrazone), and the top hit (argatroban) against the selected isolates were determined by the broth microdilution (BMD) method as per the CLSI guidelines.37 The concentration ranges for colistin, CCCP, and the test drug (argatroban) were 1024–2 μg mL−1, 80–1 μg mL−1 and 1024–2 μg mL−1, respectively. A volume of 50 μL of cation-adjusted Muller–Hinton broth (CAMHB) was poured into each well. The wells were inoculated with 100 μL of the bacterial suspension at 5 × 10⁵ CFU mL−1. The positive and negative controls contained 100 μL of culture with the medium and the medium only, respectively. The microdilution plates were then incubated at 37 °C for 16–18 h and then visually examined using 2,3,5-triphenyl tetrazolium chloride (TTC) solution and interpreted as per the CLSI breakpoint criterion. The minimum enhancing concentration (MEC) to reduce the MIC of colistin by 4-fold was used to evaluate the synergistic effect of the test drug (argatroban) and colistin combination against colistin-resistant MDR isolates.
Moreover, we also explored the effect of CCCP on the MIC of colistin. In that case, ¼ MIC of CCCP was added to the bacterial suspension containing colistin concentrations ranging from 1024 to 0.125 μg mL−1. The bacterial suspension with colistin and without CCCP was taken as the control. Bacterial growth was visualized by adding TTC solution and interpreted as per the CLSI breakpoint criterion.37,38 After adding CCCP, the resulting MIC fold changes were calculated as the ratio of the CCCP-free antibiotic's MIC level to that of the CCCP-added antibiotic.
2.8 Assessment of the efflux activity
To assess the phenotypically active efflux activity of the selected colistin-resistant MDR isolates, the ethidium bromide (EtBr)–agar cartwheel method was implemented. For the comparative assessment of the active efflux activity, the K. pneumoniae (ATCC 13882; https://www.atcc.org/products/13882) strain and previously reported efflux-mediated colistin-resistant XDR K. pneumoniae SDL79 strain developed by our team39 were taken as the negative and positive control, respectively. An EtBr stock solution was prepared in distilled water, and stored at 4 °C while protected from light. Colistin MDR bacterial isolates were grown in Luria–Bertani broth. The turbidity of the cultures was adjusted to 0.5 McFarland standards so that the optical density was comparable to the density of a bacterial suspension having 1.5 × 10⁸ colony-forming units (CFU mL−1). Tryptic soya agar (TSA) nutrient media containing plates with EtBr of concentrations of 2.5 mg L−1 were prepared and protected from light. The plates were then divided into as many as 6 sectors by radial lines (cartwheel pattern). For each isolate, including the positive control, three Eppendorf tubes of cultures were prepared to have ‘no drug’ (control), CCCP, and argatroban. As per the MIC of CCCP and argatroban against each isolate except the negative control, a concentration of ¼ MIC was added to the cultures. All the tubes were incubated for 30 min in a shaking incubator at 37 °C. The cultures were swabbed on EtBr–agar plates starting from the center of the plate and spreading toward the edges. The swabbed EtBr–agar plates were then incubated at 37 °C for 18 h and examined under a gel-imaging system (BIO-RAD's Gel Doc XR+ System). The average fluorescence intensity of the swabbed area was observed and compared between the controls and test strains using open-source ImageJ software.40 Student's t-test was used to test the statistical significance of the average fluorescence intensity of each swab area.
2.9 Determination of the antimicrobial susceptibilities via checkerboard assay
The checkerboard technique was performed in triplicate using colistin–argatroban combinations for all the strains. Concentration ranges of 512 μg mL−1 (1/2 × MIC) to 1 μg mL−1 (1/1024 × MIC) for colistin, and 256 μg mL−1 (1/2 × MIC) to 2 μg mL−1 (1/256 × MIC) for argatroban were prepared in 96-well microtiter plates (Thermo Scientific™) using cation-supplemented Mueller–Hinton broth (CAMHB). The concentration ranges were prepared in separate plates and then joined into a single plate to have different combinations of antibiotics in each well. The bacterial inoculum was adjusted to ~5 × 10⁵ to 6 × 10⁵ CFU mL−1 using Mueller–Hinton broth and distributed in all the wells. Two wells were reserved for the positive and negative controls, respectively, in each plate. After incubation at 37 °C for 24 h, the fractional inhibitory concentration (FIC) index was calculated using the formula:
| ∑FIC = FICA + FICB = CA/MICA + CB/MICB |
Where MICA and MICB represent the individual MICs of drugs A and B, respectively, and CA and CB indicate the concentrations of the drugs in combination in the wells corresponding to a specific MIC. The sum of FICI was then interpreted as follows: synergy if FIC ≤ 0.5, additive effect if 0.5 < FIC ≤ 2, indifference if 2 < FIC ≤ 4, and antagonism if FIC > 4.41
2.10 Time-kill assay
The time-kill assay of colistin (Col) in combination with argatroban (Arg) was performed against three isolates: (A) UK48, (B) UM573, and (C) UM869 at ¼MIC. Bacterium growth without any compounds (untreated) was taken as the control. Different concentrations of colistin and argatroban were chosen according to the checkerboard evaluation method as a synergistic combination. The drugs were prepared in 2-fold serial dilutions and added in combination or alone to log-phase bacterial culture suspensions containing ∼5 × 10⁶ CFU mL−1 in CAMHB and incubated at 37 °C. After incubation times of 0, 4, 8, 12, and 24 h, 10 μL of bacterial suspension was added to 990 μL of 0.7% NaCl, and then 1 μL of bacterial suspension from NaCl was again added to 999 μL of 0.7% NaCl solution. By this dilution, we achieved a 106 times dilution of the culture. After dilution, 100 μL aliquots were smeared on Mueller–Hinton agar plates and incubated at 37 °C overnight. Then, the colony number was counted on each plate. All the experiments were repeated three times and the average (mean) was calculated. The synergistic activity was confirmed as a ≥2-log10 decrease in CFU counts at 24 h of the combination compared to counts with the antibiotic alone, in addition to a ≥2-log10 decrease compared to the count at 0 h.42,43 Similarly, ≥3-log10 CFU mL−1 reduction showed bactericidal activity compared to the initial inoculums after 24 h.44,45
3. Results and discussion
3.1 Training data preparation
An adequate structural diversity and population of inhibitors/ligands are critical to developing a ligand-based pharmacophore.46 Although these are not quantitatively defined, a training set of about 30 ligands is considered healthy for developing a pharmacophore model.47 Unfortunately, very few EPIs were available in the literature for AcrB-K. pneumoniae or AcrB-M. morganii. Relatively higher numbers (inhibitors) of EPIs were reported for AcrB-E. coli. This had high sequence similarity (91%) with AcrB-K. pneumoniae. Besides, it showed an 80.42% similarity with AcrB-M. morganii. Considering these issues and the fact that E. coli is a model pathogen, its AcrB structure (PDB Id: 4DX5) was used in this study. Data on a total of 32 compounds were collected from the literature along with their in vitro activity in terms of MICs against E. coli as AcrB efflux pump inhibitors/substrates (Table 1).
Table 1 Experimental MICs of collected efflux pump substrates/inhibitors in PubChem CID and the references
| Compounds |
PubChem ID |
MIC (μg mL−1) |
MIC (μM mL−1) |
pMIC (μM mL−1) |
Ref. |
| Aminoquinoline |
11379 |
14.42 |
0.1 |
1 |
48
|
| Amitriptyline |
2160 |
444 |
1.6 |
−0.2 |
49
|
| Ampicillin |
6249 |
39 |
0.11 |
0.95 |
50
|
| Artesunate |
6917864 |
4096 |
10.66 |
−1.03 |
51, 52 |
| Azlocillin |
6479523 |
44 |
0.1 |
1.02 |
50
|
| Chlorpromazine |
2726 |
256 |
0.8 |
0.1 |
49
|
| Cloxacillin |
6098 |
295 |
0.68 |
0.17 |
50
|
| Daidzein |
5281708 |
16 |
0.06 |
1.2 |
53
|
| Dicloxacillin |
18381 |
560 |
1.19 |
−0.08 |
50
|
| Dihydroartemisinin |
3000518 |
1024 |
3.6 |
−0.56 |
51, 54 |
| Enpiroline |
3033333 |
20.22 |
0.05 |
1.3 |
48
|
| Erythromycin |
12560 |
367 |
0.5 |
0.3 |
55
|
| Ethidium |
3624 |
512 |
1.63 |
−0.21 |
56
|
| Geraniol |
637566 |
64 |
0.41 |
0.38 |
57
|
| Linezolid |
441401 |
512 |
1.52 |
−0.18 |
58
|
| Mangiferin |
5281647 |
512 |
1.21 |
−0.08 |
59
|
| MBX2319 |
86281621 |
4.05 |
0.01 |
2.11 |
60
|
| Mezlocillin |
656511 |
30 |
0.06 |
1.26 |
50
|
| Nafcillin |
8982 |
16 |
0.04 |
1.41 |
61
|
| Nitrocefin |
6436140 |
1.9 |
0 |
2.43 |
62
|
| NMP |
7573 |
400 |
1.77 |
−0.25 |
58
|
| Nordihydroguaiaretic acid |
4534 |
512 |
1.69 |
−0.23 |
59
|
| Oxacillin |
6196 |
1024 |
2.55 |
−0.41 |
62
|
| Penicillin V |
6869 |
178 |
0.51 |
0.29 |
50
|
| Phthalanilide |
85459 |
64 |
0.2 |
0.69 |
48
|
| Pimozide |
16362 |
92.31 |
0.2 |
0.7 |
63
|
| Piperacillin |
43672 |
46 |
0.09 |
1.05 |
50
|
| Plumbagin |
10205 |
128 |
0.68 |
0.17 |
59
|
| Quercetin |
5280343 |
1024 |
3.39 |
−0.53 |
59
|
| Sertraline |
68617 |
32 |
0.1 |
0.98 |
64
|
| Shikonin |
479503 |
256 |
0.89 |
0.05 |
59
|
| Ursolic acid |
64945 |
50 |
0.11 |
0.96 |
20
|
3.2 FDA-approved drugs dataset
A total number of 20462 FDA-approved drugs and investigational compounds were collected from different databases, like ZINC,22 SuperDrug,23 SWEETLEAD,24 and ChemSpider.25 The compounds were merged to remove redundancies, and 6566 were retained as unique compounds. The non-redundant dataset was prepared by LigPrep, which generated 14064 stereoisomers for 6566 unique compounds.
3.3 Ligand-based virtual screening (LBVS)
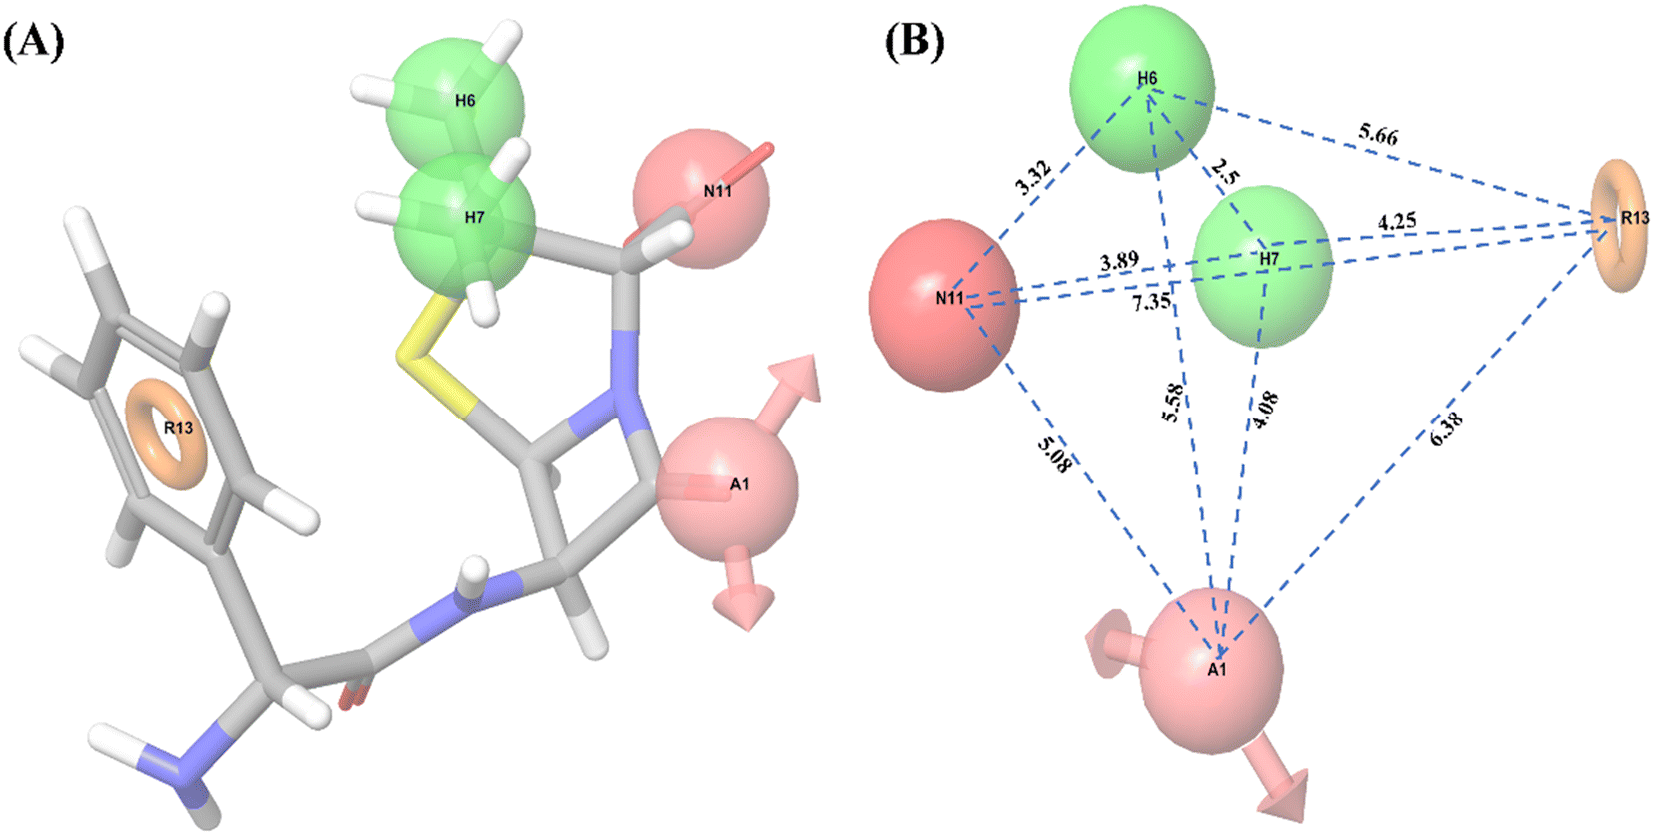
Ligand-based pharmacophore modeling is widely used to identify standard features of active compounds that can be used as pharmacophore models to screen and identify new active compounds.46,65 Thus, a pharmacophore model was developed and validated in this work. With all 32 compounds, 10 common hypotheses were generated. The top-ranked hypothesis (AHHNR.100) based on survival score (Table 2) was selected for generating the 3D-QSAR model (Fig. 1). The correlation coefficient (R2 = 0.8766), cross-validated correlation coefficient (Q2 = 0.3237), and Fisher ratio (F = 92.3) scores were calculated using a set of 32 compounds (Table 3) and suggested the statistical significance of the 3D-QSAR model.66 In subsequent enrichment analysis using a decoy of 32 compounds (50 decoys for each active compound), the false-positive rate (FP = 1 − Specificity) was plotted as a function of the valid positive rate (TP = Sensitivity) (Fig. S1†). The area under the accumulation curve was found to be 0.99. This suggested that the hypothesis could identify the true positives in the presence of false-positives (decoys).
Table 2 Various scores of selected hypotheses
| Hypothesis |
Survival |
Survival-inactive |
Post hoc
|
Site |
Vector |
Volume |
Selectivity |
Matches |
Energy |
Activity |
Inactive |
| AHHNR.100 |
6.569 |
5.801 |
3.445 |
0.82 |
0.934 |
0.688 |
2.175 |
8 |
0 |
0.952 |
0.767 |
| ADHHR.307 |
6.018 |
5.183 |
3.079 |
0.64 |
0.848 |
0.59 |
1.795 |
9 |
3.437 |
0.294 |
0.834 |
| AAANR.19 |
6.109 |
5.153 |
3.038 |
0.51 |
0.909 |
0.615 |
2.122 |
8 |
1.521 |
0.952 |
0.956 |
| AHHNR.804 |
6.416 |
5.672 |
3.374 |
0.74 |
0.917 |
0.717 |
2.093 |
8 |
1.999 |
1.021 |
0.744 |
| ADHNR.161 |
6.285 |
5.548 |
3.256 |
0.77 |
0.832 |
0.65 |
2.08 |
8 |
1.999 |
1.021 |
0.737 |
| AHHNR.46 |
6.559 |
5.662 |
3.459 |
0.83 |
0.935 |
0.693 |
2.151 |
8 |
0 |
0.952 |
0.898 |
| AADHR.150 |
5.676 |
4.668 |
3.005 |
0.56 |
0.894 |
0.553 |
1.527 |
9 |
1.521 |
0.952 |
1.008 |
| AAHHR.596 |
6.026 |
5.122 |
3.336 |
0.76 |
0.897 |
0.684 |
1.741 |
8 |
0 |
1.021 |
0.904 |
| AAANR.52 |
6.202 |
5.311 |
3.147 |
0.61 |
0.869 |
0.67 |
2.106 |
8 |
7.822 |
1.021 |
0.89 |
| AHHHR.438 |
6.153 |
5.385 |
3.348 |
0.71 |
0.927 |
0.711 |
1.857 |
8 |
2.118 |
0.952 |
0.768 |
 |
| | Fig. 1 Common pharmacophore model. (A) 3D-QSAR model of hypothesis AHHNR.100, (B) distance (Å) between the pharmacophore of the 3D-QSAR model; where A1: hydrogen accepter in light pink color with the arrow, H6 and H7: hydrophobics in green color, N11: negatively charged ion in dark pink color, R13: aromatic ring in orange color. | |
Table 3 Statistical analysis of the generated 3D-QSAR model for the respective hypothesis
| ID |
SD |
R-Squared |
F
|
P
|
Stability |
RMSE |
Q-Squared |
Pearson–R |
| AHHNR.100 |
0.2635 |
0.8766 |
92.3 |
2.85 × 10⁷ |
0.1936 |
0.9437 |
0.3237 |
0.7906 |
| ADHHR.307 |
0.31 |
0.8463 |
77.1 |
4.56 × 10⁷ |
0.375 |
0.9378 |
0.1491 |
0.3924 |
| AAANR.19 |
0.3466 |
0.8449 |
59.9 |
8.92 × 10⁶ |
0.0809 |
0.9435 |
0.0722 |
0.3009 |
| AHHNR.804 |
0.3031 |
0.8421 |
64 |
3.77 × 10⁶ |
0.0266 |
0.9969 |
0.1536 |
0.4531 |
| ADHNR.161 |
0.3288 |
0.8379 |
56.8 |
1.14 × 10⁵ |
0.3003 |
0.9386 |
0.2283 |
0.5537 |
| AHHNR.46 |
0.3087 |
0.8326 |
69.6 |
8.37 × 10⁷ |
0.0534 |
0.9918 |
0.1623 |
0.4076 |
| AADHR.150 |
0.3355 |
0.8246 |
65.8 |
1.16 × 10⁶ |
0.1104 |
0.9421 |
0.0749 |
0.2809 |
| AAHHR.596 |
0.3222 |
0.8245 |
75.2 |
1.92 × 10⁷ |
0.3952 |
0.9815 |
0.0057 |
0.2825 |
| AAANR.52 |
0.3773 |
0.8161 |
48.8 |
2.31 × 10⁵ |
0.3554 |
0.918 |
0.1217 |
0.3509 |
| AHHHR.438 |
0.328 |
0.815 |
52.9 |
9.85 × 10⁶ |
0.0863 |
0.9859 |
0.1722 |
0.489 |
Following this, the library of FDA-approved drugs/investigational compounds was screened against hypothesis AHHNR.100 to identify 927 stereoisomers for 207 unique compounds having desirable pharmacophoric features of the inhibitors. Subsequently, these compounds were subjected to multi-step virtual screening against the Ec_AcrB protein using the glide docking module of the Maestro suite. The active site residues of Ec_AcrB, i.e., SER48, THR85, THR87, GLN151, SER155, ASN274, ALA279, ALA286, SER287, GLY288, PHE610, ALA611, VAL612, PHE615, ARG620, and PHE 628, were selected for grid generation. The top-ranked 30% hits were further subjected to standard precision docking. The top-ranked 20% hits of this screening were further used for extra precision docking (XP). The top 5 compounds were selected (Table 4) for further analysis. Since antibiotics are well-known substrates of efflux pumps, they were excluded from the hits for further evaluation. Argatroban and enalapril were the only non-antibiotics that showed high affinity for the target. However, enalapril is a known substrate of a multi-drug-resistant efflux pump,67 and in our preliminary study, it failed to inhibit efflux activity. Hence, only argatroban was considered for further validation. Besides, based on the molecular docking, argatroban showed (Fig. 2) strong interactions (−9.80 kcal mol−1 binding energy) with the residues in the distal pocket of AcrB involving two hydrogen bonds (SER 133 & SER 134) and one pI–pI interaction (PHE 628 residue).
Table 4 Extra precision (XP) docking score (kcal mol−1) of docked compounds with AcrB
| Compounds |
Antibiotic/Non-antibiotics |
Docking score (kcal mol−1) |
Ligand efficiency |
| Minocycline |
Antibiotic |
−10.07 |
−3.27 |
| Argatroban |
Non-antibiotic |
−9.80 |
−3.57 |
| Levofloxacin |
Antibiotic |
−9.80 |
−2.65 |
| Meropenem |
Antibiotic |
−9.29 |
−2.79 |
| Enalapril |
Non-antibiotic |
−9.17 |
−2.94 |
| Ramatroban |
Antibiotic |
−9.15 |
−3.16 |
| Spirapril |
Non-antibiotic |
−8.49 |
−3.65 |
| Linezolid |
Antibiotic |
−8.46 |
−2.83 |
| Cefalexin |
Antibiotic |
−8.31 |
−2.88 |
| Ceforanide |
Antibiotic |
−8.23 |
−4.25 |
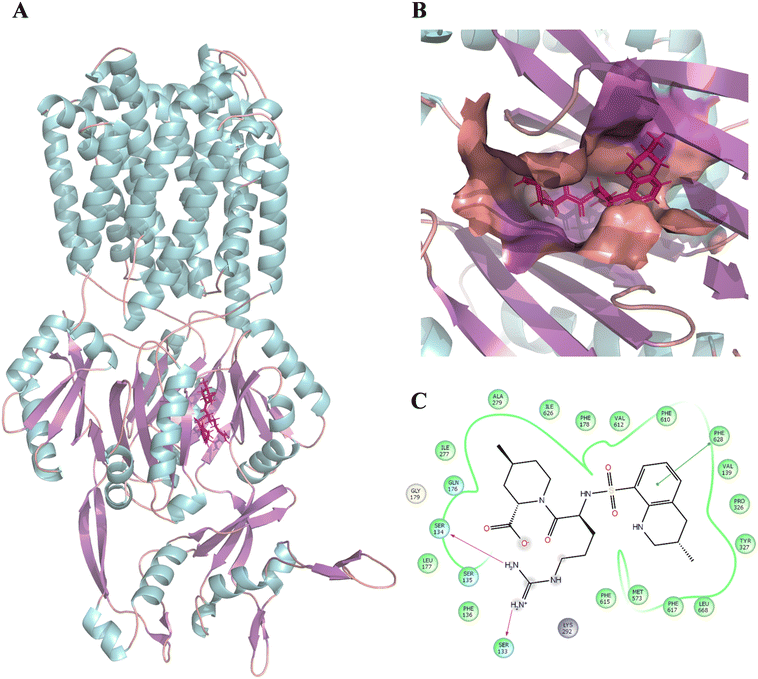 |
| | Fig. 2 Binding position and interaction of argatroban with AcrB (PDB: 4DX5). (A) Binding position of argatroban within the distal pocket of E. coli-AcrB. (B) Zoomed-in view of the binding position of argatroban within the distal pocket. (C) 2D interactions of argatroban with key residues of the distal pocket. The color of the helix, sheet, and loops structures of the protein are represented by cyan, violet, and orange, respectively. The ligand is shown in licorice and colored deep pink. | |
3.4
In vitro assay (identification and antibiogram test)
Bacterial identification and antibiotic susceptibility testing of the collected isolates using the automated VITEK 2 system revealed three colistin-resistant MDR (Table S1†) isolates. Further, to confirm the species of the isolates at the genotypic level, the isolates were subjected to 16S rRNA amplification and sequencing. While the K. pneumoniae (UK48) isolate remained consistent with the VITEK 2 result, the E. coli isolates (UM869 and UM573) were reidentified as Morganella morganii species from 16S rRNA alignment. The 16S rRNA sequencing data of M. morganii (UM573), M. morganii (UM869), and K. pneumoniae UK48 were submitted to NCBI's Nucleotide database under the accession numbers ON533445 (https://www.ncbi.nlm.nih.gov/nuccore/ON533445), ON533444 (https://www.ncbi.nlm.nih.gov/nuccore/ON533444), and OQ914367 (https://www.ncbi.nlm.nih.gov/nuccore/OQ914367) respectively.
3.5 Minimum inhibitory concentration (MIC) determination assay
The MICs of colistin, CCCP, and argatroban for all three isolates were determined using the BMD method. The MICs of colistin, CCCP, and argatroban for all three isolates were ≥1024, 5–20, and ≥512 μg mL−1, respectively (Table 5). The effect of the efflux pump inhibitor CCCP on the MIC of colistin was also investigated. The addition of CCCP induced a significant change in the MIC of colistin in all the strains, resulting in an MIC fold change of 1024, supporting the efflux pump mechanism of resistance. This agreed with the well-known properties of CCCP as an EPI that reduces the MICs of antibiotics.68,69 Interestingly, it also reduced the MICs against M. morganii, which is known to be intrinsically resistant to colistin.12,70 While CCCP alone showed an MIC of 20 μg mL−1 against M. morganii, when combined with colistin, the MIC was reduced to 0.125–0.25 μg mL−1. Thus, there seemed to be an undiscovered mechanism by which CCCP increased the susceptibility to colistin (Table 5). A higher MIC for argatroban (≥1024 μg mL−1) corroborated its non-antimicrobial properties.
Table 5 MIC of three compounds against three isolates, MIC of colistin in the presence of ½MIC of CCCP for three isolates, and synergistic effect of combinations (checkerboard assay) with FICI values
| Isolates |
MIC in alone |
MIC of Col the presence of ½MIC of CCCP |
MIC of Col and Arg in combinationa |
| Col |
CCCP |
Arg |
Col |
Arg |
FICI |
|
Col: colistin; CCCP: carbonyl cyanide m-chlorophenyl hydrazone; Agr: argatroban; MIC: minimum inhibitory concentration; FICI: fractional inhibitory concentration index.
|
| UK48 |
1024 |
5 |
≥512 |
0.25 |
256 |
64 |
0.125 |
| UM869 |
≥1024 |
20 |
≥512 |
0.125 |
256 |
128 |
0.325 |
| UM573 |
≥1024 |
20 |
≥512 |
0.25 |
256 |
128 |
0.325 |
3.6 Assessment of the efflux activity and inhibition
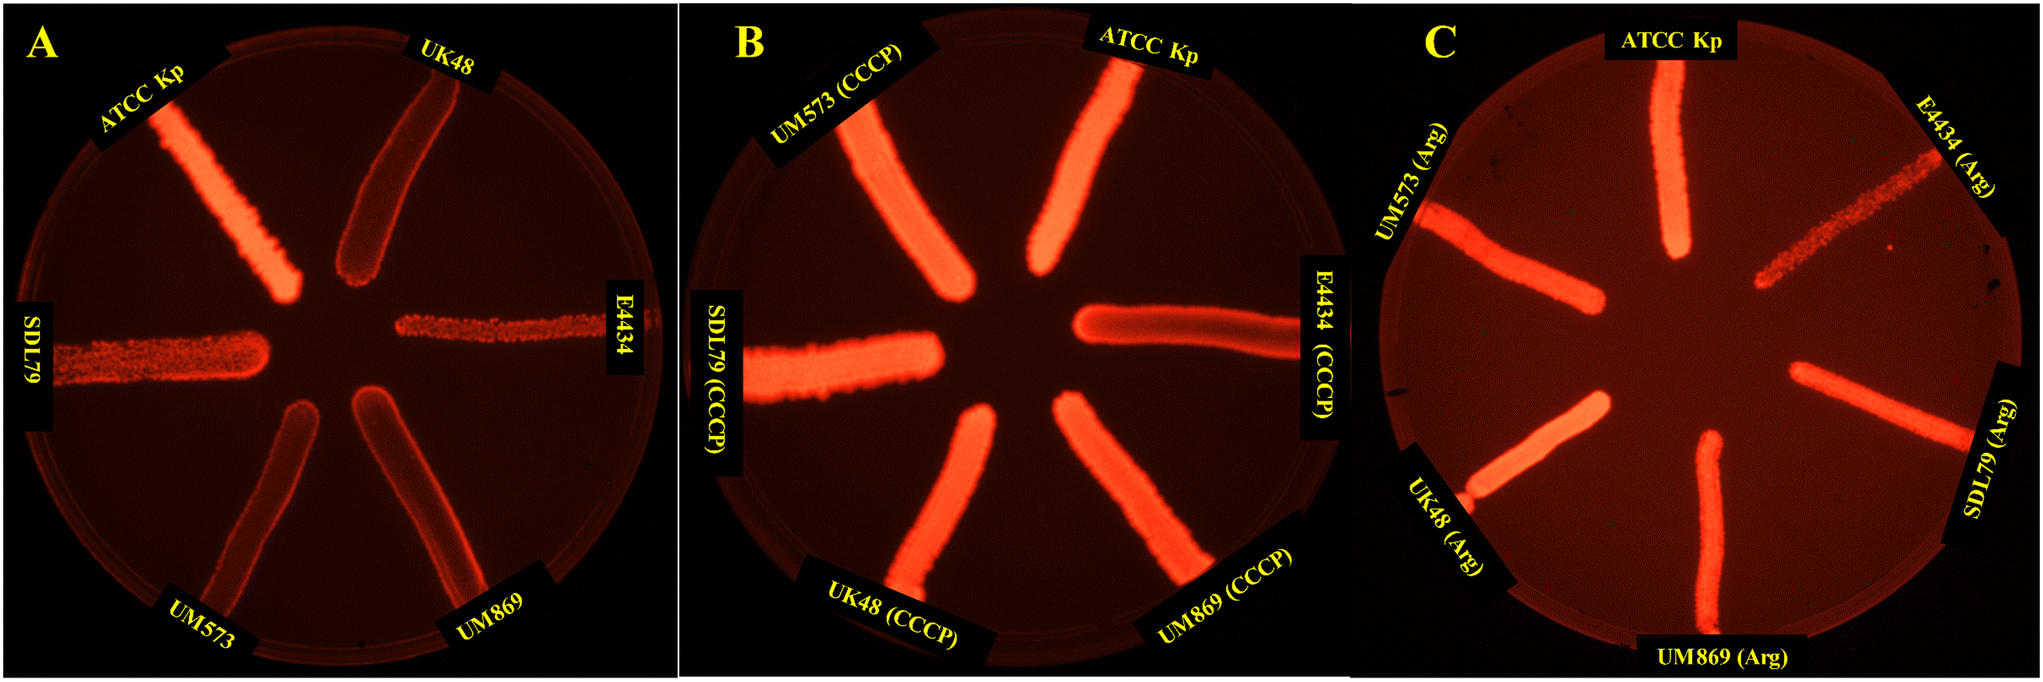
The EtBr cartwheel assay is a commonly used method for assessing efflux activity in bacteria.71 In this assay, bacteria are grown in the presence of the fluorescent dye ethidium bromide (EtBr) at various concentrations, and the level of fluorescence is measured under UV light. Bacteria with high efflux activity are expected to pump out EtBr and thus show lower fluorescence levels than bacteria with low efflux activity. Thus, the presence of efflux activity was investigated following the protocols of the EtBr cartwheel assay.71 The mean fluorescence intensity of the three isolates was found to be significantly (P < 0.001) lower compared to the control (K. pneumoniae ATCC13882), indicating the higher efflux activity in these strains (Fig. 3). Whereas the addition of CCCP (Fig. 3B) and argatroban (Fig. 3C) with a concentration of ¼MIC to the bacterial suspension for half an hour at 37 °C displayed a significant increase in the mean fluorescence intensity, suggesting a significant decrease in efflux activity. This suggests that argatroban could behave as a potential efflux pump inhibitor.
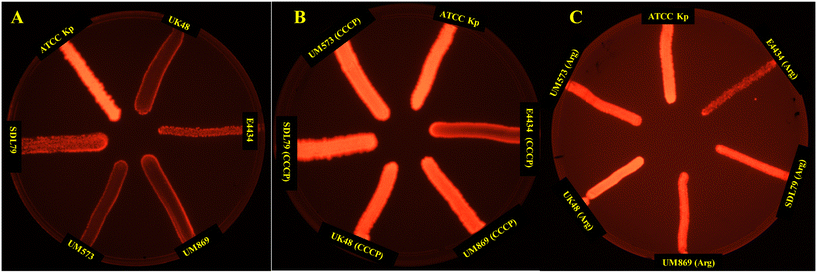 |
| | Fig. 3 EtBr cartwheel assay of the active efflux pump activity in the colistin-resistant MDR isolates. (A) Control (no drug stress), (B) under the stress of CCCP, (C) under the stress of argatroban. EtBr cartwheel images show the efflux activity in terms of the fluorescence intensity. Isolates with inhibited efflux activity show high fluorescence intensity. | |
3.7 Checkerboard analysis of the combination
The checkerboard assay is used to evaluate the effect of two antimicrobial agents when combined.72 The combination of colistin and argatroban was tested in checkerboard assays against the three bacterial isolates. The results showed that the MIC values of colistin decreased by ≥4-fold when combined with argatroban. The FIC value has been widely used to define the combinatorial effects of drugs, and a value <0.5 is considered synergistic.73 Thus, the combination of argatroban with colistin demonstrated synergistic activity against the K. pneumoniae strain (FIC = 0.125) and the M. morganii strains (FIC = 0.325), as shown in Table 5. These findings suggest that the isolates regained colistin susceptibility in the presence of argatroban. This could be partly attributed to argatroban's ability to inhibit colistin's efflux. Interestingly, argatroban also increased the susceptibility of M. morganii, which is intrinsically resistant to colistin.4 Thus, any complementary effects beyond efflux inhibitions cannot be ruled out for argatroban. However, this requires further investigation.
3.8 Time-kill analysis
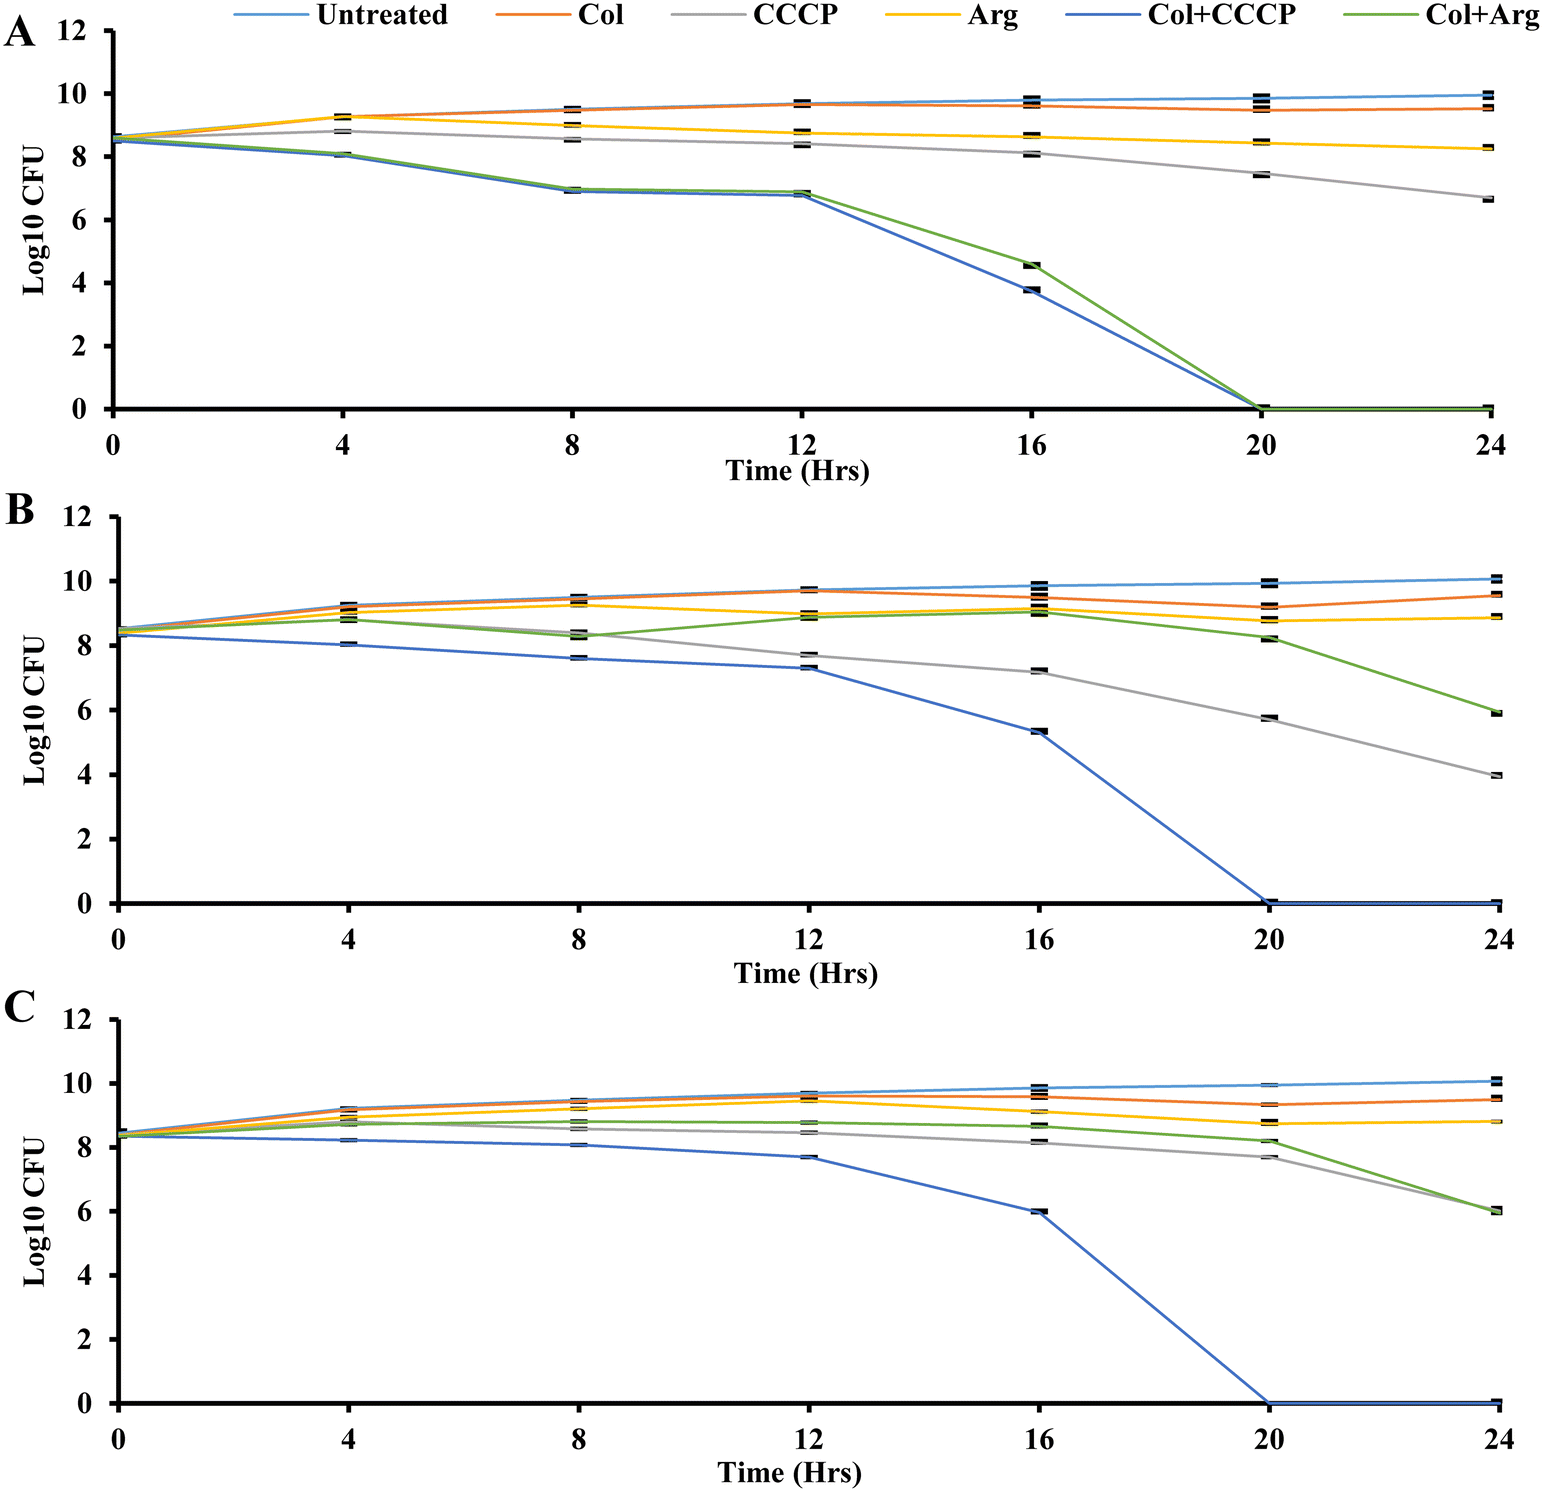
The time-kill assay measures the bactericidal or bacteriostatic activity of an antimicrobial agent or combination over a specific period.74 Bactericidal activity is characterized by a more than 3log10-fold reduction in colony-forming units, indicating a 99.9% killing of the initial bacterial inoculum.75 Time-kill analysis allows for evaluating an antimicrobial agent's impact on bacterial growth at different concentrations throughout the growth stages, providing insights into its efficacy over time.75 Time-kill assays were conducted here to investigate the time-dependent effects using three bacterial isolates (K. pneumoniae UK48, and M. morganii UM573 and UM869), as shown in Fig. 4. Six different conditions were compared for each isolate, including the control (only isolate), colistin, CCCP, argatroban, colistin + CCCP, and colistin + argatroban. A one-quarter concentration of MIC was used for the time-kill assay, as outlined in Table 5. As expected, the treatment with colistin did not show any reduction in bacterial CFU in the three isolates (Fig. 4). Also, argatroban alone did not affect the bacterial CFU. CCCP alone showed a bacteriostatic effect against all the strains, which agreed with its low MIC. The combination of CCCP with colistin showed bactericidal activity against all the strains with 8-log reductions in 20 h (Fig. 4). While the combination of argatroban and colistin showed 2-log reductions against UM869 and UM573, about an 8-log reduction was observed in the CFU of UK48 within 20 h (Fig. 4). The relatively less-fold reduction in the cases of UM869 and UM573 could be explained by the fact that these two strains are intrinsically resistant to colistin.4 With its known antimicrobial properties, CCCP was able to ensure a higher reduction of CFU when combined with colistin against these strains. However, argatroban did not have antimicrobial potency and showed only a 2-log reduction in combination with colistin. Nonetheless, the reduction was significant as 99% of the CFU were abrogated in 24 h. This could be partly explained by the fact that both these strains also efflux out colistin, and argatroban was found to inhibit this process leading to improved susceptibility. The higher susceptibility of UK48 to the combination of colistin–argatroban and the ability of argatroban to inhibit efflux activity indicated that the resistance of UK48 to colistin was partly due to efflux-mediated resistance. It also showed the potential of argatroban as an adjuvant to overcome the efflux-mediated resistance of K. pneumoniae.
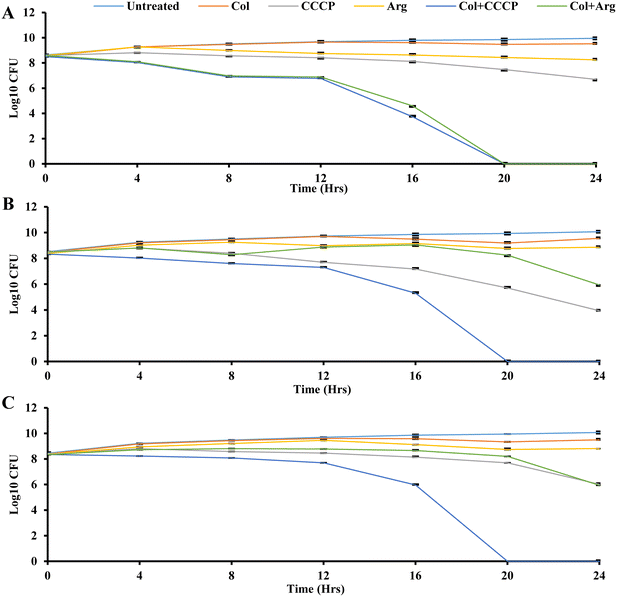 |
| | Fig. 4 Time-kill assay of colistin (Col) in combination with argatroban (Arg) against three isolates: (A) UK48, (B) UM573, and (C) UM869 at ¼MIC. Bacterium growth without any compounds (untreated) was taken as the control (purple), colistin alone is shown in brown color, CCCP control in pink color, argatroban alone in yellow color, colistin in combination with CCCP in blue color, colistin in combination with argatroban in green color. The confidence interval of the error bar was predicted by Student's t-test. | |
Argatroban is an anticoagulant that was first licensed in 2000 by the FDA for prophylaxis or the treatment of thrombosis in patients with heparin-induced thrombocytopenia, and it is well tolerated.76 Besides, it has been reported with anti-fibrotic, anti-inflammatory,77 and antiviral properties.78 Based on these properties, it has been proposed as a potential therapeutic strategy for COVID-19.79 However, there is no clinical evidence supporting this, and it is yet to be clinically repurposed. Nonetheless, the present study shows its potential as an adjuvant to colistin. The elimination of the half-life of argatroban (40–50 minutes)80 and that of colistin (2–3 h) suggest their potential compatibility for further application.81 Moreover, like colistin, argatroban is given parenterally. Although this indicates their suitability for co-administration, further pharmacokinetic and pharmacodynamic interaction studies are necessary to validate this.
Conclusion
The in silico analysis in this study suggests the ability of argatroban to bind strongly to efflux targets. However, further investigations are necessary to validate this mechanism. Nonetheless, the in vitro analysis suggests its ability to inhibit efflux pump and increase the susceptibility of colistin to resistant K. pneumoniae and M. morganii synergistically. Thus, this study identified argatroban, a non-antibiotic compound, as a potential adjuvant to colistin for overcoming K. pneumoniae and M. morganii resistance. This can encourage further research to validate the application.
Author contributions
B. B. Subudhi, E. Subudhi and D. U. Behera conceived the idea, designed the experiments, and analyzed the results; B. B. Subudhi and E. Subudhi contributed reagents; D. U. Behera, M. Gaur and M. Sahoo carried out the experiments; M. Gaur and M. Sahoo carried out visualization of the data; D. U. Behera, M. Gaur, M. Sahoo, E. Subudhi and B. B. Subudhi wrote and edited the manuscript. E. Subudhi and B. B. Subudhi reviewed the manuscript. All the authors approved the final manuscript.
Conflicts of interest
The authors declare that they have no known competing financial interests or personal relationships that could have appeared to influence the work reported in this paper.
Acknowledgements
This work was supported by Indian Council of Medical Research, India through grant no. AMR/DHR/GIA/4/ECD-II-2020. M. Gaur was supported by fellowship from the Department of Biotechnology (DBT), Ministry of Science and Technology, New Delhi, India (Grant Id: BT/INF/22/SP45078/2022). We gratefully acknowledge the infrastructure facility provided by Siksha ‘O’ Anusandhan (Deemed to be University), Bhubaneswar.
References
- M. A. E. G. El-Sayed Ahmed, L. L. Zhong, C. Shen, Y. Yang, Y. Doi and G. B. Tian, Emerging Microbes Infect., 2020, 9, 868–885 CrossRef CAS.
- J. Sharma, D. Sharma, A. Singh and K. Sunita, Can. J. Infect. Dis. Med. Microbiol., 2022, 2022, 4315030 Search PubMed.
- P. K. Nirwan, N. Chatterjee, R. Panwar, M. Dudeja and N. Jaggi, J. Antibiot., 2021, 74, 450–457 CrossRef CAS PubMed.
- S. A. Baron and J. M. Rolain, J. Antimicrob. Chemother., 2018, 73, 1862–1871 CrossRef CAS PubMed.
- S. S. Mohapatra, S. K. Dwibedy and I. Padhy, J. Biosci., 2021, 46, 85 CrossRef CAS PubMed.
- S. K. Singh, M. Mishra, M. Sahoo, S. Patole and H. Mohapatra, Microb. Pathog., 2017, 102, 109–112 CrossRef CAS PubMed.
- R. Alenazy, Biology, 2022, 11, 1328 CrossRef CAS PubMed.
- E. Armengol, O. Domenech, E. Fusté, I. Pérez-Guillén, J. H. Borrell, J. M. Sierra and M. Vinas, Infect. Drug Resist., 2019, 12, 2031–2038 CrossRef CAS.
- X.-Z. Li, P. Plésiat and H. Nikaido, Clin. Microbiol. Rev., 2015, 28, 337–418 CrossRef PubMed.
- A. Reza, J. M. Sutton and K. M. Rahman, Antibiotics, 2019, 8, 229 CrossRef CAS PubMed.
- N. Singla, N. Kaistha, N. Gulati and J. Chander, Indian J. Crit. Care Med., 2010, 14, 154–155 CrossRef.
- H. Liu, J. Zhu, Q. Hu and X. Rao, Int. J. Infect. Dis., 2016, 50, 10–17 CrossRef.
- M. Tumbarello, P. Viale, C. Viscoli, E. M. Trecarichi, F. Tumietto, A. Marchese, T. Spanu, S. Ambretti, F. Ginocchio, F. Cristini, A. R. Losito, S. Tedeschi, R. Cauda and M. Bassetti, Clin. Infect. Dis., 2012, 55, 943–950 CrossRef CAS.
- M. K. Paczosa and J. Mecsas, Microbiol. Mol. Biol. Rev., 2016, 80, 629–661 CrossRef CAS.
- A. O. Olaitan, S. Morand and J. M. Rolain, Front. Microbiol., 2014, 5, 1–18 Search PubMed.
- J. Sun, Z. Deng and A. Yan, Biochem. Biophys. Res. Commun., 2014, 453, 254–267 CrossRef CAS PubMed.
- C. Plé, H. K. Tam, A. Vieira Da Cruz, N. Compagne, J. C. Jiménez-Castellanos, R. T. Müller, E. Pradel, W. E. Foong, G. Malloci, A. Ballée, M. A. Kirchner, P. Moshfegh, A. Herledan, A. Herrmann, B. Deprez, N. Willand, A. V. Vargiu, K. M. Pos, M. Flipo and R. C. Hartkoorn, Nat. Commun., 2022, 13, 115 CrossRef.
- H. Sjuts, A. V. Vargiu, S. M. Kwasny, S. T. Nguyen, H.-S. Kim, X. Ding, A. R. Ornik, P. Ruggerone, T. L. Bowlin, H. Nikaido, K. M. Pos and T. J. Opperman, Proc. Natl. Acad. Sci. U. S. A., 2016, 113, 3509–3514 CrossRef CAS.
- T. Teelucksingh, L. K. Thompson and G. Cox, J. Bacteriol., 2020, 202(22) DOI:10.1128/JB.00367-20.
- V. Shriram, T. Khare, R. Bhagwat, R. Shukla and V. Kumar, Front. Microbiol., 2018, 9, 2990, DOI:10.3389/fmicb.2018.02990.
-
Schrödinger, Schrödinger Release 2015-2, 2015 Search PubMed.
- J. J. Irwin and B. K. Shoichet, J. Chem. Inf. Model., 2005, 45, 177–182 CrossRef CAS.
- A. Goede, M. Dunkel, N. Mester, C. Frommel and R. Preissner, Bioinformatics, 2005, 21, 1751–1753 CrossRef CAS PubMed.
- P. A. Novick, O. F. Ortiz, J. Poelman, A. Y. Abdulhay and V. S. Pande, PLoS One, 2013, 8(11) DOI:10.1371/journal.pone.0079568.
- M. Ayers, Reference Reviews, 2012, 26(7), 45–46 CrossRef.
-
J. A. Bell, Y. Cao, J. R. Gunn, T. Day, E. Gallicchio, Z. Zhou, R. Levy and R. Farid, in International Tables for Crystallography, Vol. F, ed. E. Arnold, D. M. Himmel and M. G. Rossmann, John Wiley & Sons, Chichester, 2012, pp. 534–538 Search PubMed.
- D. Shivakumar, J. Williams, Y. Wu, W. Damm, J. Shelley and W. Sherman, J. Chem. Theory Comput., 2010, 6, 1509–1519 CrossRef CAS.
- D. Horvath, Methods Mol. Biol., 2011, 672, 261–298 CrossRef CAS PubMed.
- S. L. Dixon, A. M. Smondyrev, E. H. Knoll, S. N. Rao, D. E. Shaw and R. A. Friesner, J. Comput.-Aided Mol. Des., 2006, 20, 647–671 CrossRef CAS PubMed.
- M. M. Mysinger, M. Carchia, J. J. Irwin and B. K. Shoichet, J. Med. Chem., 2012, 55, 6582–6594 CrossRef CAS PubMed.
- T. Seidel, G. Ibis, F. Bendix and G. Wolber, Drug Discovery Today: Technol., 2010, 7, e221–e228 CrossRef CAS.
- B. Ramachandran, S. Kesavan and T. Rajkumar, Bioinformation, 2016, 12, 62–68 CrossRef.
- K. D. Singh and K. Muthusamy, Acta Pharmacol. Sin., 2013, 34, 1592–1606 CrossRef CAS.
- M. Ligozzi, C. Bernini, M. G. Bonora, M. de Fatima, J. Zuliani and R. Fontana, J. Clin. Microbiol., 2002, 40, 1681–1686 CrossRef CAS PubMed.
-
Performance Standards for Antimicrobial Susceptibility Testing, Clinical and Laboratory Standards Institute, Guideline M100, 28th edn, https://clsi.org/media/1930/m100ed28_sample.pdf (accessed September 2022) Search PubMed.
- R. K. Sahoo, A. Das, M. Gaur, A. Pattanayak, S. Sahoo, N. K. Debata, P. K. S. M. Rahman and E. Subudhi, Pathog. Global Health, 2019, 113, 315–321 CrossRef CAS PubMed.
-
CLSI, CLSI M100-ED29: 2021 Performance Standards for Antimicrobial Susceptibility Testing, 30th edn, 2020, vol. 40 Search PubMed.
- M. P. Weinstein and J. S. Lewis, J. Clin. Microbiol., 2020, 58(3) DOI:10.1128/JCM.01864-19.
- S. Dey, M. Gaur, R. K. Sahoo, A. Das, B. Jain, S. Pati and E. Subudhi, J. Global Antimicrob. Resist., 2020, 22, 54–56 CrossRef.
- C. A. Schneider, W. S. Rasband and K. W. Eliceiri, Nat. Methods, 2012, 9, 671–675 CrossRef CAS PubMed.
- F. C. Odds, J. Antimicrob. Chemother., 2003, 52, 1 CrossRef CAS PubMed.
- R. L. White, D. S. Burgess, M. Manduru and J. A. Bosso, Antimicrob. Agents Chemother., 1996, 40, 1914–1918 CrossRef CAS PubMed.
- D. U. Behera, S. Dixit, M. Gaur, R. Mishra, R. K. Sahoo, M. Sahoo, B. K. Behera, B. B. Subudhi, S. S. Bharat and E. Subudhi, Genes, 2023, 14, 1279 CrossRef CAS PubMed.
- G. V. Doern, Expert Rev. Anti-infect. Ther., 2006, 4, 821–835 CrossRef CAS.
- S. Foerster, M. Unemo, L. J. Hathaway, N. Low and C. L. Althaus, BMC Microbiol., 2016, 16, 216 CrossRef PubMed.
- A. Vuorinen, R. Engeli, A. Meyer, F. Bachmann, U. J. Griesser, D. Schuster and A. Odermatt, J. Med. Chem., 2014, 57, 5995–6007 CrossRef CAS PubMed.
- S. Sakkiah, V. Arullaperumal, S. Hwang and K. W. Lee, J. Enzyme Inhib. Med. Chem., 2014, 29, 69–80 CrossRef CAS PubMed.
- N. Abdali, J. M. Parks, K. M. Haynes, J. L. Chaney, A. T. Green, D. Wolloscheck, J. K. Walker, V. V. Rybenkov, J. Baudry, J. C. Smith and H. I. Zgurskaya, ACS Infect. Dis., 2017, 3, 89–98 CrossRef CAS PubMed.
- E. M. Grimsey, C. Fais, R. L. Marshall, V. Ricci, M. L. Ciusa, J. W. Stone, A. Ivens, G. Malloci, P. Ruggerone, A. V. Vargiu and L. J. V. Piddock, MBio, 2020, 11(3) DOI:10.1128/mBio.00465-20.
- S. P. Lim and H. Nikaido, Antimicrob. Agents Chemother., 2010, 54, 1800–1806 CrossRef CAS PubMed.
- C. Wu, J. Liu, X. Pan, W. Xian, B. Li, W. Peng, J. Wang, D. Yang and H. Zhou, Molecules, 2013, 18, 6866–6882 CrossRef CAS PubMed.
- B. Li, Q. Yao, X.-C. Pan, N. Wang, R. Zhang, J. Li, G. Ding, X. Liu, C. Wu, D. Ran, J. Zheng and H. Zhou, J. Antimicrob. Chemother., 2011, 66, 769–777 CrossRef CAS PubMed.
- V. Aparna, K. Dineshkumar, N. Mohanalakshmi, D. Velmurugan and W. Hopper, PLoS One, 2014, 9, e101840 CrossRef PubMed.
- Y. Song, R. Qin, X. Pan, Q. Ouyang, T. Liu, Z. Zhai, Y. Chen, B. Li and H. Zhou, Int. J. Mol. Sci., 2016, 17, 1934 CrossRef.
- A. Ababou and V. Koronakis, PLoS One, 2016, 11, e0159154 CrossRef PubMed.
- E. W. Yu, J. R. Aires and H. Nikaido, J. Bacteriol., 2003, 185, 5657–5664 CrossRef CAS PubMed.
- V. Lorenzi, A. Muselli, A. F. Bernardini, L. Berti, J.-M. Pagès, L. Amaral and J.-M. Bolla, Antimicrob. Agents Chemother., 2009, 53, 2209–2211 CrossRef CAS PubMed.
- W. V. Kern, P. Steinke, A. Schumacher, S. Schuster, H. von Baum and J. A. Bohnert, J. Antimicrob. Chemother., 2006, 57, 339–343 CrossRef CAS PubMed.
- T. Ohene-Agyei, R. Mowla, T. Rahman and H. Venter, Microbiology, 2014, 3, 885–896 CAS.
- T. J. Opperman, S. M. Kwasny, H. S. Kim, S. T. Nguyen, C. Houseweart, S. D'Souza, G. C. Walker, N. P. Peet, H. Nikaido and T. L. Bowlin, Antimicrob. Agents Chemother., 2014, 58, 722–733 CrossRef PubMed.
- S. Yamasaki, S. Nagasawa, A. Fukushima, M. Hayashi-Nishino and K. Nishino, J. Antimicrob. Chemother., 2013, 68, 1066–1070 CrossRef CAS PubMed.
- K. Nagano and H. Nikaido, Proc. Natl. Acad. Sci. U. S. A., 2009, 106, 5854–5858 CrossRef CAS PubMed.
- J. A. Bohnert, S. Schuster and W. V. Kern, Open Microbiol. J., 2013, 7, 83–86 CrossRef CAS PubMed.
- L. Li, S. Kromann, J. E. Olsen, S. W. Svenningsen and R. H. Olsen, J. Antibiot., 2017, 70, 944–953 CrossRef CAS PubMed.
- X. Qing, X. Y. Lee, J. De Raeymaeker, J. R. Tame, K. Y. Zhang, M. De Maeyer and A. R. Voet, J. Recept., Ligand Channel Res., 2014, 7, 81–92 Search PubMed.
- S. Mirzaei, R. Ghodsi, F. Hadizadeh and A. Sahebkar, BioMed Res. Int., 2021, 2021, 6480804 Search PubMed.
- B. C. Ferslew, K. Köck, A. S. Bridges and K. L. R. Brouwer, Drug Metab. Dispos., 2014, 42, 1567–1574 CrossRef PubMed.
- L. Rodrigues, T. Parish, M. Balganesh and J. A. Ainsa, Drug Discovery Today, 2017, 22, 592–599 CrossRef CAS PubMed.
- L. Rindi, Int. J. Mol. Sci., 2020, 21, 1–13 Search PubMed.
- I. Stock and B. Wiedemann, Diagn. Microbiol. Infect. Dis., 1998, 30, 153–165 CrossRef CAS.
- M. Martins, M. P. McCusker, M. Viveiros, I. Couto, S. Fanning, J.-M. Pagès and L. Amaral, Open Microbiol. J., 2013, 7, 72–82 CrossRef CAS PubMed.
- T. Brennan-Krohn and J. E. Kirby, J. Visualized Exp., 2019, 146 DOI:10.3791/58636.
-
Z. Aumeeruddy-Elalfi, A. Gurib-Fakim and M. F. Mahomoodally, in Antibiotic Resistance: Mechanisms and New Antimicrobial Approaches, Elsevier, 2016, pp. 271–289 Search PubMed.
- C. Jacqueline, J. Caillon, V. Le Mabecque, A. F. Miègeville, P. Y. Donnio, D. Bugnon and G. Potel, J. Antimicrob. Chemother., 2003, 51, 857–864 CrossRef CAS PubMed.
- ASTM, Annu. Book ASTM Stand., 2008, 03, 1–5 Search PubMed.
- S. Dhillon, Am. J. Cardiovasc. Drugs, 2009, 9, 261–282 CrossRef CAS PubMed.
- Y. Bulani and S. S. Sharma, Cardiovasc. Drugs Ther., 2017, 31, 255–267 CrossRef CAS PubMed.
- B. V. Lê, M. Jandrot-Perrus, C. Couture, L. Checkmahomed, M. C. Venable, M. È. Hamelin and G. Boivin, J. Gen. Virol., 2018, 99, 1367–1380 CrossRef.
- K. F. Aliter and R. A. Al-Horani, Cardiovasc. Drugs Ther., 2021, 35, 195–203 CrossRef CAS PubMed.
- A. Koster, K. G. Fischer, S. Harder and F. Mertzlufft, Biol.: Targets Ther., 2007, 1, 105–112 CAS.
- A. S. Michalopoulos and M. E. Falagas, Ann. Intensive Care, 2011, 1, 30 CrossRef PubMed.
|
| This journal is © The Royal Society of Chemistry 2024 |
Click here to see how this site uses Cookies. View our privacy policy here. 
 Open Access Article
 This Open Access Article is licensed under a Creative Commons Attribution-Non Commercial 3.0 Unported Licence
 a,
Mahendra
Gaur
a,
Mahendra
Gaur