 Open Access Article
Creative Commons Attribution 3.0 Unported Licence
Recycling waste aluminium foil to bio-acceptable nano photocatalysts [aluminium oxide (Al2O3) & aluminium oxyhydroxide (AlOOH)]; dye degradation as proof-of-concept†
Bunty
Sharma‡
a,
Arshdeep
Sahi‡
b,
Jaspreet
Dhau
a,
Ajeet
Kaushik
 c,
Rajeev
Kumar
*b and
Ganga Ram
Chaudhary
 *de
*de
aResearch and Development, Molekule Inc., Lakeland, Florida, USA
bDepartment of Environment Studies, Panjab University, Chandigarh, 160014, India. E-mail: rajeev@pu.ac.in
cNanoBioTech Laboratory, Department of Environmental Engineering, Florida Polytechnic University, Lakeland, FL, USA
dDepartment of Chemistry and Center for Advance Study in Chemistry, Chandigarh, India
eSophisticated Analytical Instrumentation Laboratory (SAIF)/Central Instrumentation Laboratory (CIL), Panjab University, Chandigarh, 160014, India. E-mail: grc22@pu.ac.in
First published on 12th September 2024
Abstract
The surge in the world's population resulting from urbanization and industrialization has led to a significant uptick in water and soil pollution. Aligned with the United Nations’ sustainable development goals, investigating innovative methods for repurposing waste into beneficial materials and effective catalysts that are compatible with ecosystems and capable of efficiently decomposing dyes is earnestly recommended. Additionally, in alignment with the objectives of a sustainable society, this study serves as a prototype for repurposing discarded aluminium foil—an everyday single-use material contributing to landfill accumulation—into aluminium oxide (Al2O3) and aluminium oxyhydroxide (AlOOH) nanocatalysts, intended for efficient photodegradation applications. Al2O3 and AlOOH nanosystems were synthesized using a well-optimized chemistry route. The developed nanosystems were characterized using FTIR, EDX mapping, XRD, FE-SEM, and TGA/DTA that found the bonds, composition, structure, morphology of the particles, and thermal stability, respectively. These particles were used for the degradation of cationic methylene blue (MB) dye in neutral (pH 7), basic (pH 9), and acidic (pH 5) mediums. Liquid chromatography mass spectrometry (LC-MS) was performed to check the MB intermediate product formation on photodegradation. The findings suggest that exposing cationic MB to light in neutral pH conditions with Al2O3 is highly effective, with a dye degradation rate of 99.29%. Exposing MB to the dark in neutral conditions with AlOOH is the least effective, with a dye degradation rate of 6.64%. As the pH is made more acidic and/or basic, the effectiveness of Al2O3 and AlOOH also slightly changes. The outcomes related to reusability and toxicity studies also proved the acceptability of the developed systems. Degradation using both compounds led to more germination when compared to MB, and both compounds showed outstanding reusability. The research emphasizes the importance of sustainable materials synthesis and offers valuable insights for the development of efficient photocatalysts tailored for specific environmental conditions in the context of dye degradation.
1. Introduction
Over the past century, the global population has surged from 2.2 billion individuals to 7.9 billion, showing an exponential growth trend due to technological advancement and industrialization. Consequently, this expansion has led to the generation of new pollution sources, including solid waste pollution in water. The interconnection between population growth and pollution is clear in the widespread increase in single-use products and other disposable packaging materials. The global pandemic has further propelled industrial demand for single-use materials. Since the COVID-19 pandemic (2020), single-use food packaging containers and wrappers have drastically increased.1,2 As the demand for these products rises, environmental degradation caused by the production of raw materials and the disposal of old materials also escalates. One such waste-generating, single-use pollutant is aluminium foil, whose development is intricately linked with industrialization and a rise in food production. Aluminium foil is an integral part of the packaging industry, including food preparation and several other industrial applications; nevertheless, aluminium disposal poses a significant threat to the environment.3 Since the lockdown in 2020, there has been a 54% increase in food wrapper use globally.1,2 Aluminium pollution stems from the widespread improper disposal of aluminium-based materials and is linked to natural and anthropogenic sources. If aluminium is disposed of incorrectly, it creates environmental degradation regardless of whether it decomposes or not. If the foil decomposes or breaks down, it will introduce new chemical compounds to the environment, causing environmental pollution. However, if the foil does not break down, it further causes solid waste pollution in waterways and other ecosystems. These anthropogenic sources have a considerable impact on environmental and human health.When aluminium foil is correctly disposed of, it ends up in landfills, incinerators, or recycling plants. However, the foil has a long decomposition cycle, causing it to persist in municipal solid waste facilities for extended periods.4 The incineration of foil causes increased air pollution and further causes soil and water pollution.5 Aluminium in landfills poses equally threatening environmental problems by generating unwanted heat from chemical reactions during decomposition, producing liquid leachate, and releasing gases such as hydrogen, hydrogen sulfide, carbon monoxide, and ammonia, all of which have considerable impacts on human health.5,6 Trends indicate an increase in diseases such as Alzheimer's disease, autism, epilepsy, and other neurological diseases associated with these pollutants.7 Aluminium is also difficult to recycle, as the foil that is finally brought to recycling facilities is generally torn and wrinkled or contaminated with food debris. Compromised foil cannot be recycled. Solid aluminium waste is a concern for municipal solid waste facilities and environmental health and safety management due to its persistent nature. However, if waste foil is treated to remove contaminants, then it can be used to synthesize aluminium particles that can be used multifariously in dye degradation, absorption, dye binding, as desiccating agents, in drug delivery, for antimicrobial potential, and as photocatalysts in waterways.8–10 It has been reported that various metal oxides and nanocomposites have been prepared and used for sensing, energy storage and the removal of pollutants in water.11–13 Studies have shown promising results for Al2O3 and AlOOH particles in the degradation of organic pollutants for the treatment of contaminated water.14 Specifically, many photodegradation reactions have been performed using Al2O3 as a photocatalyst. A recently published review article meticulously scrutinises recent developments in Al2O3-based materials, highlighting their efficacy in organic dye adsorption and degradation.15 For example, Anna et al. used these particles as a photocatalyst for the degradation of methylene blue (MB) under sunlight.16 In another study, the photocatalytic properties of Al2O3 were explored to degrade ciprofloxacin in wastewater.17 Zang et al. investigated AlOOH as a photocatalyst for the degradation of tetracycline hydrochloride.18
These aluminium particles are significant in building a sustainable future as population growth and pollution continue to threaten global water supplies. Industrialization further causes a massive influx of dyes and other synthetic chemicals into our waterways; globally, there are about 60![[thin space (1/6-em)]](https://www.rsc.org/images/entities/char_2009.gif) 000 tons of waste dye that is released into the environment per year.19,20 The textile industry is largely responsible for this pollution; however, the removal of dye from wastewater is an incredibly strenuous and expensive process. Methylene blue is a vibrantly colored, cationic dye that is commonly used in many industries, such as textiles, pharmaceuticals, and microbiology (for cell staining).11,16 The versatility of this dye lies in its ability to solubilize in a variety of solvents, such as water, ethanol, and acetic acid.16,21 This dye is very harmful to marine life as well as humans in higher concentrations.21 Anaerobic reduction, microfiltration, membrane filtration, and other techniques have been employed to try to degrade MB dye.22–24 So far, it has been proved that adsorption is an effective technique for removing the dye from polluted water.22
000 tons of waste dye that is released into the environment per year.19,20 The textile industry is largely responsible for this pollution; however, the removal of dye from wastewater is an incredibly strenuous and expensive process. Methylene blue is a vibrantly colored, cationic dye that is commonly used in many industries, such as textiles, pharmaceuticals, and microbiology (for cell staining).11,16 The versatility of this dye lies in its ability to solubilize in a variety of solvents, such as water, ethanol, and acetic acid.16,21 This dye is very harmful to marine life as well as humans in higher concentrations.21 Anaerobic reduction, microfiltration, membrane filtration, and other techniques have been employed to try to degrade MB dye.22–24 So far, it has been proved that adsorption is an effective technique for removing the dye from polluted water.22
Based on the approach of recycling waste to wealth, this research for the first time focuses on the remediation of water containing MB dye by degrading it using photocatalytic particles that were prepared from waste aluminium foil. Synthesized aluminium oxide (Al2O3) and aluminium oxyhydroxide (AlOOH) nanocatalysts were fabricated and characterized using Fourier transform infrared spectroscopy (FTIR), energy-dispersive X-ray spectroscopy (EDX) mapping, X-ray diffraction (XRD), field emission scanning electron microscopy (FE-SEM), UV-vis diffuse reflectance spectroscopy (UV-DRS), and thermogravimetric analysis/differential scanning calorimetry (TGA/DSC).
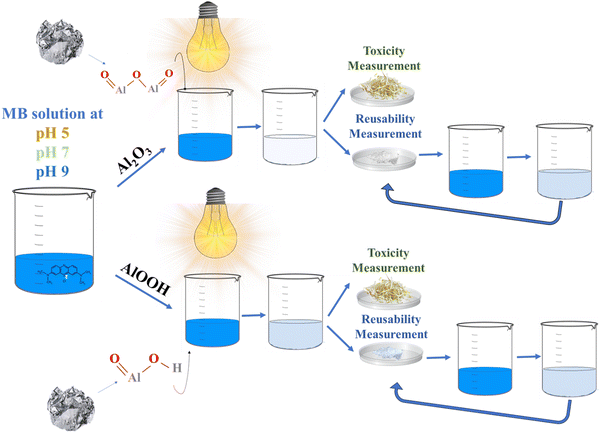
These particles were further used for the degradation of cationic MB in neutral, basic, and acidic pH mediums. The particles were checked for reusability and toxicity assessment. This research addresses multiple goals simultaneously: a reduction in foil solid waste and the production of aluminium particles for water pollution removal. Additionally, because the dye is decomposed via visible light, sunlight can be used for the pigment degradation; thus, no additional energy source is required. Scheme 1 shows a graphical representation of this work.
2. Experimental details and procedure
2.1. Materials
Aluminium foil was collected from lab waste sites at Panjab University, Chandigarh. Hydrochloric acid (HCl) and sodium hydroxide (NaOH) pellets were procured from ThermoFisher; sodium carbonate anhydrous LR (Na2CO3) was bought from Rasayan Laboratories. All chemicals were used in their original state without any later modification or purification. All experiments were conducted at room temperature in double-distilled water (ddH2O). A methylene blue (MB) dye was procured from Sigma-Aldrich. For toxicity assessment, locally sourced (Chandigarh) mung seeds were used.2.2. Experimental procedure
![[thin space (1/6-em)]](https://www.rsc.org/images/entities/char_2009.gif) :
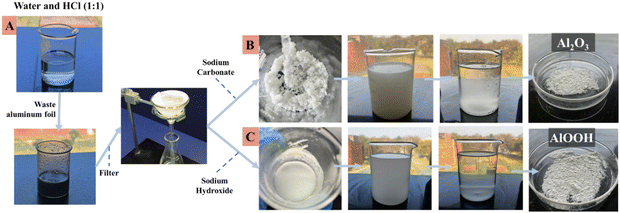
:![[thin space (1/6-em)]](https://www.rsc.org/images/entities/char_2009.gif) 1 solution of 23 mL of HCl and 23 mL of ddH2O. This forms an aluminium chloride (AlCl3) solution. Once all the foil was completely dissolved into the HCl, the AlCl3 solution was double filtered into a separate beaker to remove any remaining impurities. This solution was divided into two parts; each half was used to synthesize Al2O3 and AlOOH, respectively.
1 solution of 23 mL of HCl and 23 mL of ddH2O. This forms an aluminium chloride (AlCl3) solution. Once all the foil was completely dissolved into the HCl, the AlCl3 solution was double filtered into a separate beaker to remove any remaining impurities. This solution was divided into two parts; each half was used to synthesize Al2O3 and AlOOH, respectively.
Al2O3 was synthesized by adding excess Na2CO3 into one of the two halves of the filtered solution until a gelatinous product was formed. This product was transferred into a large beaker, washed with excess ddH2O, decanted, and washed again. The decantation and washing were repeated twice. The remaining water was disposed of after the second decantation, and the solid precipitate was dried in an oven at 45 °C for 24 hours and stored in a desiccator to remove any moisture content.
AlOOH was synthesized by adding excess NaOH into the second half of the filtered solution until a gelatinous product formed. This product was transferred into a large beaker, washed with excess ddH2O, decanted, and washed again. The decantation and washing were repeated twice. The remaining water was disposed of after the second decantation, and the solid precipitate was dried in an oven at 45 °C for 24 hours.25Fig. 1 shows the overall step-by-step synthesis procedure from waste aluminium foil.
 | (1) |
The formation of methylene blue intermediates after photocatalytic degradation was analysed using a mass spectrometer (Waters Corporation, U.K., Model: Alliance 2795,Q-TOF Micromass Mass spectrometer).
The following equation was used to determine the germination index (Gi):
 | (2) |
3. Result and discussion
3.1. Synthesis and characterization
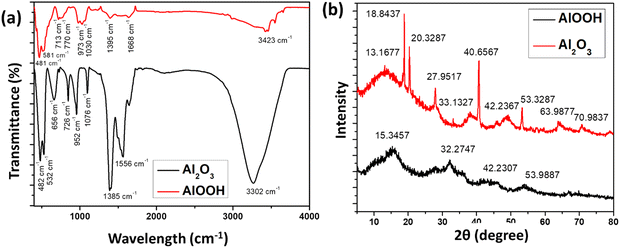
FTIR and XRD were used to characterize the prepared particles. Fig. 2(a) presents the contrast between the FTIR spectrum of the synthesized Al2O3 (black) and AlOOH (red). Both samples showed peaks in the fingerprint region that can be attributed to bending and stretching vibrations, which are characteristics shared by organic compounds. Impurities in the waste aluminium foil that was used for the synthesis may be responsible for the presence of organic compounds.27 Peaks seen for Al2O3 at 482, 532, 952, and 1385 cm−1 are the bending and stretching of the Al–O interactions.27,28 For AlOOH, these peaks were seen at 481, 581, 713, 973, and 1395 cm−1. In addition to representing the Al–O interactions, peaks at lower wavelengths also signify a pseudo-boehmite structure. Specifically, this incomplete crystalline boehmite structure is seen in both molecules and contains aluminium-based matrix materials.29,30 A band in Al2O3 is also observed at 656 cm−1, which is correlated with the Al–O–Al interactions within the molecule.27 The peaks in Al2O3 at 1556 cm−1 and in AlOOH at 1668 cm−1 can be attributed to a cis-double bond in the molecule.27 Bands are also seen at 726 cm−1, which are correlated with the tetrahedral structures found in Al2O3.26 The broad peaks seen in samples around 3302 cm−1 (Al2O3) and 3423 cm−1 (AlOOH) represent the vibration of the Al–O–H bonds in the sample.31XRD is used to interpret the structures of atoms found inside a sample and can determine whether a sample is crystalline or amorphous. The XRD results in Fig. 2(b) were produced by Al2O3 and AlOOH. For Al2O3, peaks were observed at 2θ = 13.17°, 18.84°, 20.33°, 27.95°, 33.13°, 40.66°, 49.24°, 53.33°, 63.99°, and 70.98°. These results were comparable with the XRD results for pure Al2O3 given in the JCPDS.32 It can be inferred that peaks 2θ = 27.95°, 49.24°, 53.33°, and 63.99° are caused by the presence of NaCl. These NaCl peaks are further confirmed in the literature.33 It can also be inferred that the peaks at 2θ = 27.95°, 40.66°, 49.24°, and 70.98° are caused by the presence of Al2O3. A sharp peak implies that the cell arrangement of the sample is crystalline.32,34 Peaks for AlOOH were observed at 2θ = 15.35°, 32.27°, 43.23°, and 53.99°. Saravanan et al. (2023) found the XRD pattern for AlOOH at 2θ = 27.4°, 38.3°, 48.8° and 64.9°.25,35 The broad width of the peaks suggests that AlOOH consists of nanocrystals; however, the peaks are not sharp suggesting that the molecule consists of an orthorhombic structure.25,36 The peaks observed in the AlOOH are in correspondence with the literature, but some negative shift in the 2θ was found. This may be due to the NaCl present in the sample.
The absorbances of Al2O3 (10 mg in 2 mL) and AlOOH (10 mg in 2 mL) in water were also recorded using UV-vis spectrophotometry, as can be seen in Fig. S1 (ESI†). It was observed that the absorption peaks of Al2O3 and AlOOH in ddH2O match the literature results.37,38 The band gaps of the Al2O3 and AlOOH samples were calculated by performing a UV-vis DRS study. It is reported that the band gap changes with the crystalline nature of Al2O3 and can be modulated when combined with other materials; however, if the calcination process is not complete, the surface hydroxyl groups can reduce the band gap, allowing it to act as a photocatalyst.39–41 Edalati et al. reduced the Al2O3 band gap to less than 3 eV using a high pressure torsion (HPT) method.42
Kusuma et al. explored the photocatalytic properties of Al2O3 where Al2O3 nanoparticles exhibited an energy band gap of 4.46 eV; these particles were used for MB degradation.43 Additionally, Nduni et al. reported that Al2O3 particles prepared using a green approach from waste aluminium foil have a band gap of 5.25 eV.27 It is evident that Al2O3 and AlOOH can degrade dye in the presence of light; however, they are unable to perform this function in the dark. This suggests that these compounds can act as photocatalysts. To further support these findings, the band gap energy was determined using a Tauc plot.38 Fig. S2 (ESI†) depicts (αhν)2vs. energy (eV) for Al2O3 and AlOOH. It was determined that Al2O3 has a band gap of 4.29 eV and AlOOH has a band gap of 5.50 eV. The band gap of Al2O3 at 4.29 eV proves that this particle possibly has a photocatalytic nature.
The TGA results for Al2O3 and AlOOH can be seen in Fig. S3(a) and (b) (ESI†). A multi-step decomposition for both particles is observed. In Al2O3 (Fig. S3(a), ESI†), there is a 38.16% (2.15 mg) initial loss in weight (up to 100 °C), indicating dehydration. Then, there is a 20.13% loss in mass (1.14 mg) around 300 °C indicating decomposition. The decomposition that has occurred at this temperature matched the results observed by Gondal et al.44 In total, there was about a 70.97% loss in mass when the temperature reached 900 °C. AlOOH (Fig. S3(b), ESI†) also follows a similar multistep decomposition. Initially, 22.29% of the total mass was lost between 50 and 100 °C, suggesting dehydration. Then, around 250–300 °C, there was an 11.77% mass loss due to decomposition. There was a 52.633% mass loss when the temperature reached 900 °C.
The heat flow in the Al2O3 sample was detected using DSC measurement. Endothermic dips are seen at 100 °C and 300 °C, which is the same temperature range at which decomposition occurs. This implies that the sample is melting at these temperatures. DSC peaks are seen at 200 °C and 700 °C suggesting some crystallization in the sample. The heat flow in the AlOOH sample was also detected using DSC measurement. Endothermic dips are seen around 50–100 °C and 250–300 °C, which is the same temperature range at which decomposition occurs. This implies that the sample is melting at these temperatures. A DSC peak is seen at 275 °C revealing some crystallization in the sample.
The FE-SEM results in Fig. 3 confirm the surface morphology of the particles. It was observed that Al2O3 has a jagged and rough surface that consists of different size pores, as can be seen in Fig. 3(a) and (b). The surface of this particle is more heterogeneous and larger than the that of the AlOOH particle. The AlOOH particle has a much smaller surface area than Al2O3 (Fig. 3(c) and (d)). These nanoparticles also contain various-sized cavities and pores, making the particle look slightly rugged.
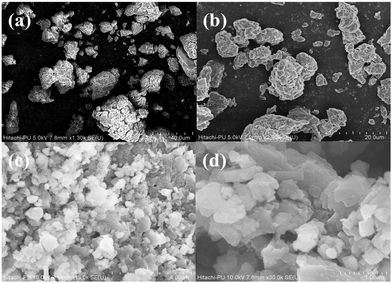 | ||
| Fig. 3 FE-SEM of Al2O3 (a) and (b) particles at scales of 40.0 μm and 20.0 μm, respectively. FESEM of AlOOH (c) and (d) particles at scales of 4.0 μm and 1.0 μm, respectively. | ||
The results for the mapping and EDX of Al2O3 and AlOOH are presented in Fig. 4. The elements that were observed in the mapping of Al2O3 mainly consist of Al and O atoms (Fig. 4(a)–(c)). There is a smaller amount of Na and Cl atoms, which can be attributed to the HCl in the synthesis of the particles (Fig. 4(d)). These can be constituted as impurities in the sample. The elements that were observed in the mapping and EDX of AlOOH also mainly consist of Al and O with a much smaller amount of Cl and Na (Fig. 4(e)–(h)). Overall, the mapping verifies that Al and O atoms are distributed homogeneously on the surface of both particles. The gold (Au) present in the EDX mapping is due to the Au coating that was applied to Al2O3 and AlOOH during the FESEM process.
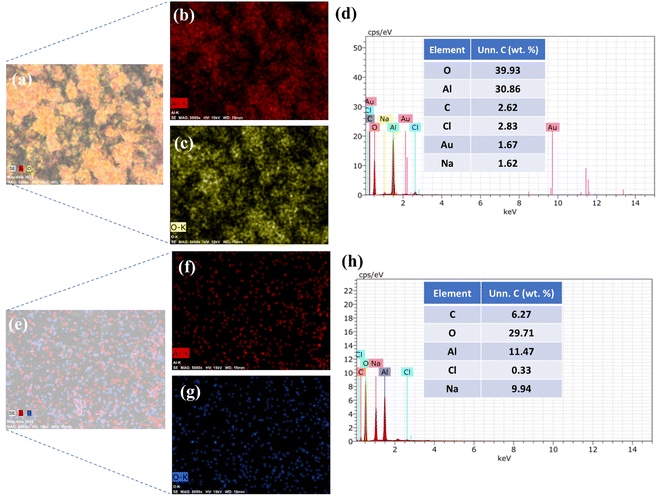 | ||
| Fig. 4 Mapping of Al2O3 (a)–(c) and EDX of Al2O3 (d). Mapping of AlOOH (e)–(g) and EDX of AlOOH (h). | ||
The zeta-sizer results are presented in Table 1 and Fig. S4–S6 (ESI†). The hydrodynamic diameter and polydispersity index of the synthesized Al2O3 and AlOOH were calculated at pH 5, 7 and 9. This study shows that at pH 5, Al2O3 particles have a hydrodynamic diameter of around 3257 nm, which decreases with pH change to 1133 nm and 856.9 nm at pH 7 and 9, respectively. For AlOOH particles, the hydrodynamic diameter also changes with the change in pH value. Overall, the PDI values for Al2O3 and AlOOH particles are still less than 52%. The zeta-potential value for Al2O3 was 11 mV at 5 pH, and by changing the pH to 7 and 9, the zeta potential changed to −15.7 mV and −26.9 mV, respectively. At pH 5 for AlOOH, the zeta potential was −20.7 mV, and it changed to 4.3 mV and −17.0 mV at pH 7 and 9, respectively.
| pH | Sample | Hydrodynamic diameter (Dh) (nm) | Polydispersity index (PDI) (%) | Zeta potential (mV) |
|---|---|---|---|---|
| 5 | Al2O3 | 3257 | 47.8 | 11 |
| AlOOH | 1803.4 | 37.0 | −20.7 | |
| 7 | Al2O3 | 1133 | 52.6 | −15.7 |
| AlOOH | 3513 | 38.9 | 4.3 | |
| 9 | Al2O3 | 856.9 | 31.4 | −26.9 |
| AlOOH | 806.5 | 8.8 | −17.0 |
3.2. Degradation of dye under pH 7, pH 9, and pH 5
Fig. 5 shows a comprehensive analysis of the degradation of MB under different conditions using Al2O3 and AlOOH as catalysts, in the dark and under visible light at pH 7. Fig. 5(a) depicts the MB solution with Al2O3 in the dark observed for 240 minutes. This reaction was performed at pH 7. Initially, the concentration of the solution decreased, followed by stabilization. Fig. 5(b) depicts the MB solution with AlOOH in the dark observed for 240 minutes at pH 7. Like Al2O3, the concentration of the solution initially decreased and stabilized.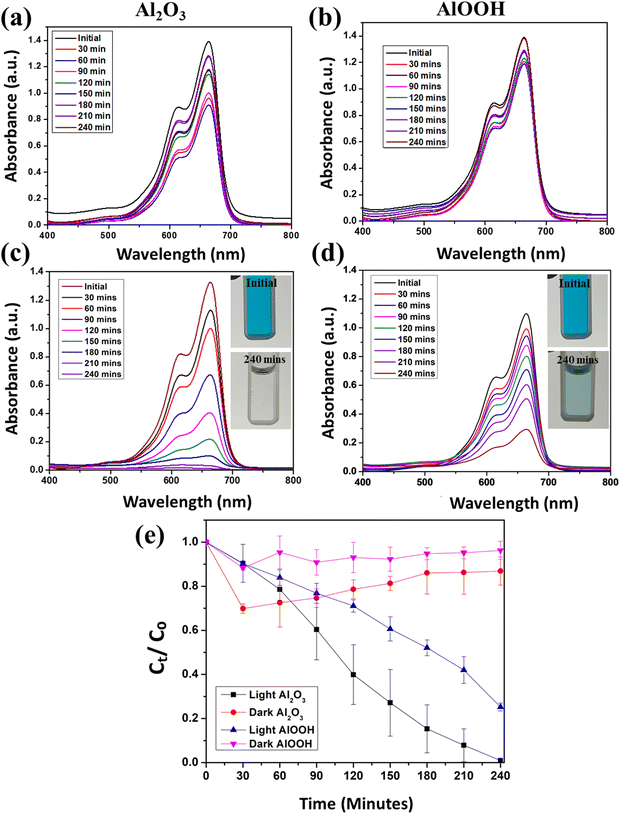 | ||
| Fig. 5 UV-vis spectra of MB with Al2O3 (a) and AlOOH (b) in the dark and Al2O3 (c) and AlOOH (d) in the light at pH 7. Average degradation efficiency over time at pH 7 (e). | ||
The range of concentration decrease was significantly greater with Al2O3 compared to AlOOH in the absence of light, which also signifies the adsorption of dye on the particles in the dark. Fig. 5(c) depicts the MB solution with Al2O3 in visible light observed for 240 minutes at pH 7. The concentration of the solution steadily decreased for 240 minutes, and it eventually became clear. This demonstrates the photocatalytic degradation of MB under visible light by Al2O3. Fig. 5(d) depicts the MB solution with AlOOH in visible light observed for 240 minutes, at pH 7. The concentration of the solution steadily decreased for 240 minutes. Fig. 5(e) shows the time-dependent concentration decrease in dye degradation with irradiation time.
When the reactions were performed in the dark under neutral pH conditions, there was a 17.60% and 6.64% degradation in the MB solution with Al2O3 and AlOOH, respectively. In contrast, when the reactions were performed in visible light, under neutral conditions, a 99.29% degradation in the MB solution with Al2O3 and a 75.98% degradation in the MB solution with AlOOH were observed. Under dark conditions, the concentration initially dropped within the first 30–60 minutes before slowly becoming constant. This can be attributed to the first adsorption of the MB into the particles, which was then released back into the solution, causing the concentration to slightly fluctuate. The degradation efficiency of MB (Ct/C0) vs. time can also be seen in Fig. 5(e), which is the average of trial 1 and trial 2. This indicates that AlOOH also facilitates the photocatalytic degradation of MB under visible light, although possibly less efficiently than Al2O3. The same experiment was performed at pH 9, and accordingly, Fig. 6(a) represents the MB solution with Al2O3 in the dark observed for 240 minutes. The concentration of this solution drastically decreased for 60 minutes and stabilized with some inconsistencies. Fig. 6(b) shows the MB solution with AlOOH in the dark observed for 240 minutes at pH 9. The concentration of this solution drastically decreased for 90 minutes, after which it again became stable with slight oscillation.
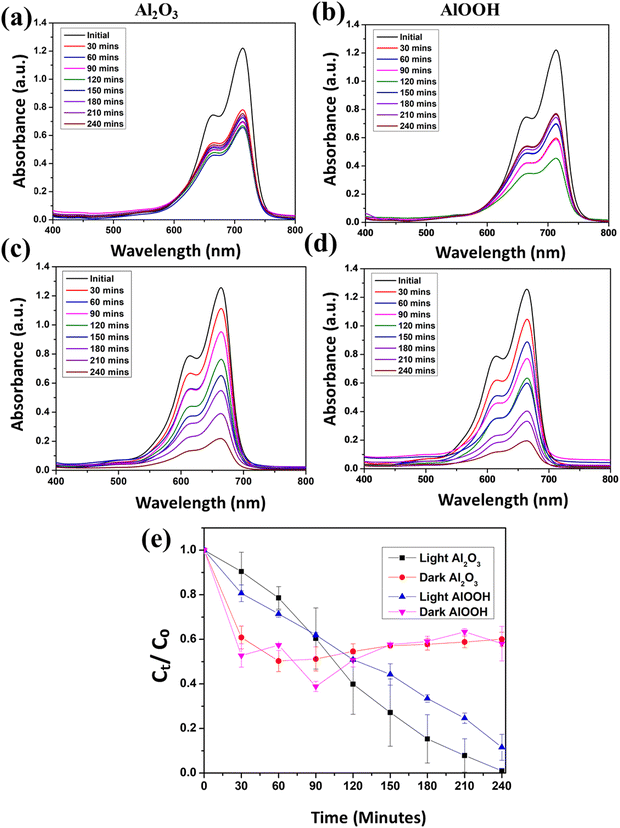 | ||
| Fig. 6 UV-vis spectra of MB with Al2O3 (a) and AlOOH (b) in the dark and Al2O3 (c) and AlOOH (d) in the light at pH 9. Average degradation efficiency over time at pH 9 (e). | ||
Fig. 6(c) depicts the MB solution with Al2O3 in visible light observed for 240 minutes at pH 9. The concentration of the solution consistently decreased for 240 minutes, until it reached 0.21 a.u. Fig. 6(d) represents the MB solution with AlOOH in visible light observed for 240 minutes at pH 9. The concentration of the solution consistently decreased for 240 minutes, until it reached 0.18 a.u.
When the reactions were performed in the dark, under basic conditions, there was a 37.88% degradation in the MB solution with Al2O3 and a 37.70% degradation in the MB solution with AlOOH. Despite their similar degradation efficiencies, AlOOH initially adsorbed MB more effectively than Al2O3 under basic conditions in the dark. There was a larger range of adsorption in AlOOH than in Al2O3 in the dark. When the reactions were performed in visible light, under basic conditions, there was an 82.77% degradation in the MB solution with Al2O3 and an 84.58% degradation in the MB solution with AlOOH. Under dark conditions, the concentration was seen to drastically drop within 60–90 minutes before showing slight inconstancies with slight upward and downward variations. The degradation efficiency of MB vs. time can also be seen in Fig. 6(e), which is the average of the two trials. It was observed that under basic conditions in the dark, AlOOH adsorbs MB more effectively than Al2O3. After the initial concentration change in MB, the concentrations of both solutions stabilize with slight variations.
Another experiment was conducted to evaluate the photocatalytic efficiency of the catalysts under acidic conditions. This reaction was performed at pH 5. Fig. 7(a) and (b) represent the MB solution with Al2O3 and AlOOH, respectively, in the dark observed for 240 minutes. The concentration of the dye decreased for 30–60 minutes, but overall, the concentration of MB remained consistent throughout the 240 minutes. Fig. 7(c) and (d) depict the MB solution with Al2O3 and AlOOH, respectively, in visible light observed for 240 minutes. With both particles, the concentration of MB consistently decreased for 240 minutes, until it reached a clear solution.
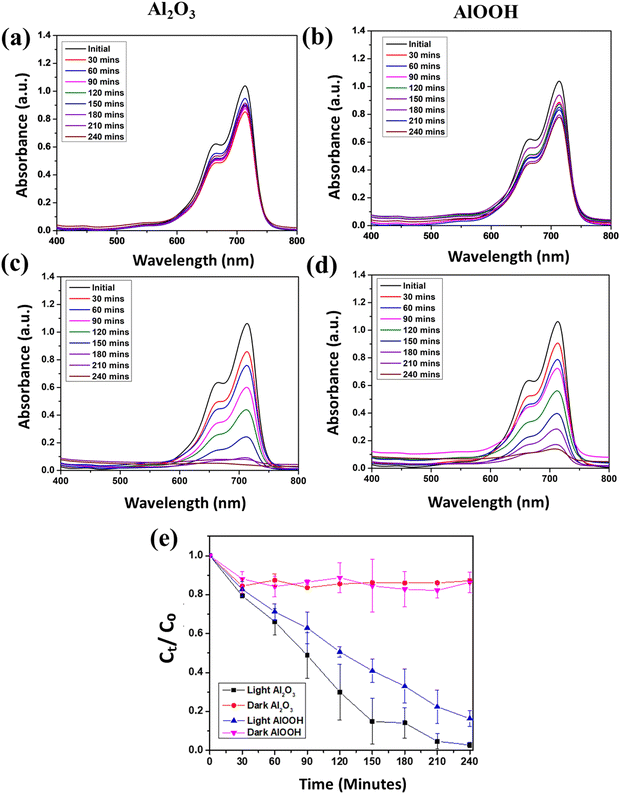 | ||
| Fig. 7 UV-vis spectra of MB with Al2O3 (a) and AlOOH (b) in the dark and Al2O3 (c) and AlOOH (d) in the light at pH 5. Average degradation efficiency over time at pH 5 (e). | ||
When the reactions were performed in the dark, under acidic conditions, a 12.34% degradation in the MB solution with Al2O3 was observed. There was a 33.22% degradation in the MB solution with AlOOH. AlOOH and Al2O3 were equally effective at adsorbing MB in the dark. When this reaction was performed in visible light, there was a 97.88% degradation in the MB solution with Al2O3 and an 86.67% degradation in the MB solution with AlOOH. The dye was consistently degraded in visible light with Al2O3 and AlOOH. The graph in Fig. 7(e) depicts the averages of the pairs of trials that were performed during the degradation reactions of MB. It is observed that Al2O3 and AlOOH show similar patterns in acidic conditions. Under light, Al2O3 and AlOOH are consistently decreasing; however, Al2O3 is still more effective than AlOOH.
Overall, it can be observed that the MB solution was degraded most efficiently under neutral conditions with visible light with Al2O3, while it was degraded least efficiently under neutral conditions in the dark with AlOOH (Table 2). The range between the highest and lowest degradation efficiencies under all conditions is 92.65%. Specifically, under neutral conditions, Al2O3 performed better than AlOOH in the dark and in the light. There was significantly more degradation in the light than in the dark. This proves that the dye is primarily adsorbed in the dark but degraded in the light. Al2O3 and AlOOH performed better in the dark after the pH was increased from neutral to alkaline (7 to 9). However, in the light at pH 9, the efficiency of Al2O3 decreased while the efficiency of AlOOH increased by 8.59%. At pH 9, AlOOH is proven to be a more effective photocatalyst than when used at pH 7. In the dark at pH 5, AlOOH was significantly more effective (20.88% more effective) at degrading MB compared to Al2O3. However, in the light under acidic conditions, Al2O3 was 11.21% more effective than AlOOH at degrading MB.
| pH 5 | pH 7 | pH 9 | ||||
|---|---|---|---|---|---|---|
| Al2O3 (%) | AlOOH (%) | Al2O3 (%) | AlOOH (%) | Al2O3 (%) | AlOOH (%) | |
| Dark | 12.34 | 33.22 | 17.60 | 6.64 | 37.88 | 37.70 |
| Light | 97.88 | 86.67 | 99.29 | 75.99 | 82.77 | 84.58 |
When only the dark conditions are considered at all pH values, it is observed that Al2O3 is least effective at pH 5 and most effective at pH 9 and AlOOH is least effective at pH 7 and most effective at pH 9. The range between the highest and lowest degradation efficiencies in the dark under all pH values is 31.24%. When only visible light conditions are considered at all pH values, it is observed that Al2O3 is consistently more effective than AlOOH for the photocatalytic degradation of MB. At pH 7, Al2O3 is the most effective, while AlOOH is the least effective. Nevertheless, it was discovered that the efficiency of AlOOH was improved by increasing and decreasing the pH. The range between the highest and lowest degradation efficiencies in visible light under all pH values is 23.30% (Table 2).
In order to determine the kinetics of dye degradation, first-order kinetics were applied: ln(Ct/C0) = −kt, where Ct and C0 are the final concentration at that particular point of time (min) and the initial concentration of the MB dye, respectively, and k is the rate constant. Fig. S7–S9 (ESI†) depict plots of ln(Ct/C0) vs. time (min) intervals, showing a linear correlation obtained by plotting the degradation of MB and suggesting that the removal of MB dye using Al2O3 and AlOOH followed pseudo-first-order kinetics.
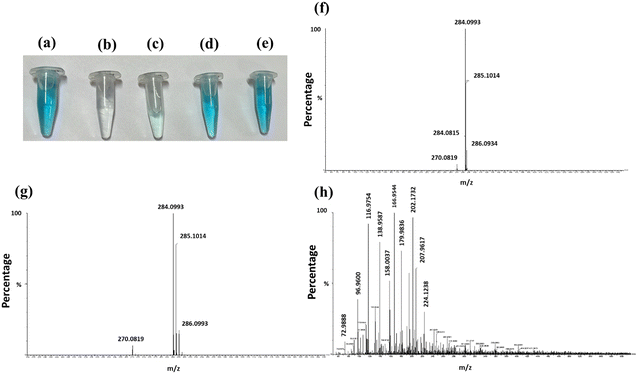
Fig. 8(a)–(e) illustrate the behavior of the MB solution in dark and light, with and without photocatalysts. The initial MB solution is shown in Fig. 8(a). After 240 minutes of light exposure, the solution becomes colorless in the presence of Al2O3 and AlOOH (Fig. 8(b) and (c)). Conversely, under dark conditions, the solution remains colored with Al2O3 and AlOOH (Fig. 8(d) and (e)). This picture clearly shows the effect of the catalyst in the absence and presence of light, which also confirmed that in the presence of light photodegradation occurred.
To further check the formation of intermediates after the effective photocatalytic activity of Al2O3, a liquid chromatography–mass spectrometry (LC–MS) test was performed on the initial MB, MB with Al2O3 in the dark and MB with Al2O3 under light after 240 min. Fig. 8(f)–(h) show the full-range mass scan graph of pure MB without treatment, MB with Al2O3 in the dark and in the presence of light, respectively. Pure and MB with Al2O3 under dark conditions showed very similar results with peaks seen at approximately 270, 284 (largest peak), 285 and 286 m/z. The maximum percentage peak at m/z = 284 corresponds to the M+ molecular ion of methylene blue that matches the reported literature value of the MB base peak value.45 The identical results for pure and MB with Al2O3 under dark conditions further showed that no photocatalytic intermediate products were formed. Conversely, when the experiment was performed in the light, the following peaks were observed: 72.93, 72.98, 88.98, 89.9, 96.96, 97.96, 112.95, 116.97, 130.00, 138.95, 158.00, 166.95, 179.98, 202.17, 207.98, 224.12, 241.92, 254.92, 267.94, and 281.89 m/z with about 14 more distinguishable peaks. The significant increase in the number of peaks indicates that new products were formed as a result of the photodegradation of the original MB with Al2O3. Peaks seen at different m/z are consistent with the possible mass spectra obtained for MB after degradation45 (Fig. 8).
The presence of only three peaks in the initial LC-MS graphs indicates the primary molecular components of the sample. The lack of change in this sample after allowing the catalyst to interact with MB in the dark for 240 min suggests that the parent compound has not changed. However, when the sample was tested after exposure to light for 240 min, the appearance of different peak suggests that the original molecules have likely fragmented into smaller pieces, each with a different mass-to-charge ratio, leading to new peaks45,46 (Fig. 8).
To further prove the photodegradation process of Al2O3, an experiment was also performed at a higher concentration of MB: 20 ppm. The results of the experiment in the dark and in the light are presented in Fig. S10 (ESI†). The results show that MB continues to degrade under light with Al2O3.
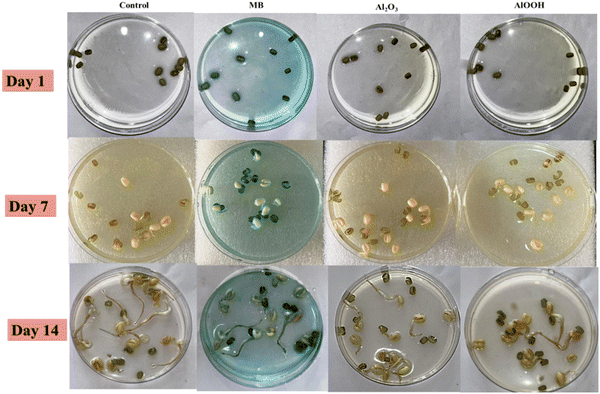
For the toxicity analysis, the mung seeds were incubated at room temperature for 14 days in the dark.47 After incubation, the number of seeds that germinated (G) and the root length (L) were measured for seeds in each condition: ddH2O, 5 ppm MB, treated Al2O3 water, and treated AlOOH water. The MB solution was treated (under visible light) with Al2O3 and AlOOH in water in bulk reactions, proving that these particles can operate in larger-scale reactions.
From the results of the toxicity assessment, it was concluded that ddH2O produced the most germinated seeds followed by Al2O3, AlOOH, and MB (Table 3 and Fig. 9). However, despite having more germinated seeds, the germination index for AlOOH was lower than that of MB, as the seeds in MB solution grew longer. This increased the overall germination index.
| Sample | #G | L (cm) | G i |
|---|---|---|---|
| Control | 18 | 76.25 | 100 |
| MB | 14 | 36.75 | 37.48634 |
| Al2O3 | 18 | 34 | 44.59016 |
| AlOOH | 15 | 25.251 | 27.59563 |
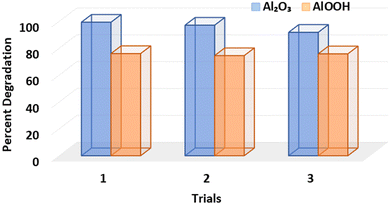
Excellent results were seen in Al2O3 and AlOOH particles when tested for reusability. This assessment was performed under visible light conditions at pH 7. As can be seen in the initial graphs (Fig. 5), Al2O3 was able to degrade 99.29% of the MB dye; in the second cycle, the degradation efficiency was 97.09%; and in the third cycle, the degradation efficiency was 91.79%. The degradation of AlOOH followed a similar pattern (Fig. 5), indicating a 75.99% degradation under light conditions. The second and third cycles then show a 74.47% and 75.78% degradation of MB, respectively (Fig. 10).
A comparative study was used to assess the degradation efficiency of various metal oxide nanoparticles in different dyes. Dyes including malachite green, brilliant crystal, and methylene blue were examined.15 The findings of this comparison revealed that the synthesized Al2O3 exhibited the comparable effectiveness in degrading the MB dye.
Table 4 provides a comprehensive summary of Al2O3 and other metal oxides prepared by various methods that have been used for photocatalytic degradation under different light sources. As shown in the Table 4, the MB degradation efficiencies are comparable with the irradiation times in many studies. However, some results differ from the findings of this paper due to variations in the synthesis processes and the use of different light sources, such as sunlight and UV illumination. Unlike previous studies where Al2O3 was prepared electrochemically48 or from aluminium salts like aluminium nitrate and sodium hydroxide,49 our novel study uses waste aluminium foil for a green synthesis of the particles. The Al2O3 and AlOOH synthesized in this manner can serve not only as photocatalysts but also in various other industries and processes.
| Metal oxide NPs | Photocatalyst amount | Concentration of dye | Dye | Degradation time (min) (light source) | Degradation percent (%) | Ref. |
|---|---|---|---|---|---|---|
| Al2O3 prepared by sol–gel method | 10 mg | 0.01 mM of MB | MB | 240 (sunlight) | sol–gel-Al2O3: 85.0% | 14 |
| γ-Al2O3 prepared by precipitation method | γ-Al2O3: 91.6% | |||||
| Al2O3 | 100 mg | 1.5 × 10⁻⁵ mol L−1 | malachite green | 360 (sunlight) | 45% | 49 |
| γ-Al2O3 NPs | 60 mg | 20 ppm | MB | 60 (UV light) | 96.4% | 48 |
| N-ZnO | 50 mg | 100 mL of MB 20 mg L−1 | MB | 80 (solar-simulated light) | 95.3% | 50 |
| MnFe2O4 | 30 mg | 10 ppm | MB | 290 (UV light) | 97% | 51 |
| Al2O3/SiO2 | 300 mg | — | malachite green | 300 (sunlight) | 85% | 52 |
| Al2O3/Fe2O3 | 200 mg | 100 mL of MB solution (25 mg L−1) | MB | 90 (visible light) | 75.1% | 53 |
| Biosynthesized ZnO | 20 mg | 2.0 × 10⁻⁵ M | MB | 420 (visible light) | 98% | 54 |
| AlOOH | 50 mg | 5 ppm | MB | 240 (visible light) | 75.99% | Current |
| Al2O3 | 50 mg | 5 ppm | MB | 240 (visible light) | 99.29% | Current |
4. Conclusions
This study successfully demonstrated that compromised foil can be reused to synthesize Al2O3 and AlOOH particles that are effective photocatalysts for dye degradation. This comprehensive research analyzed the particle structure, shape, bonds, composition, thermal stability, degradation efficiency, toxicity, and reusability. The particles were observed under neutral, basic, and acidic conditions. The results convey that the MB degradation was most efficient in light for any pH considered. The experiments further revealed that in the light, the highest efficiency was observed when using Al2O3 under neutral conditions, achieving a degradation efficiency of 99.29%. Additionally, the highest efficiency was achieved in the light with AlOOH under acidic conditions, with a degradation efficiency of 86.67%. It was also observed that the pH conditions affect the degradation of the dye solution in the light and dark. Moreover, it was observed that in the dark, the absorbance of the dye decreased initially and stabilized while there was a constant decrease in the absorbance of the dye in the light. This proved that MB dye is primarily absorbed in the dark but degraded in the light. The toxicity results further revealed that control, Al2O3, AlOOH, and MB produced the most germinated seeds. The germination indexes of the solutions were observed in the following order: control, Al2O3, MB, and AlOOH. The toxicity assessment also proved that these particles could degrade MB in bulk reactions. Both particles also showed remarkable recyclability for at least three cycles.Data availability
Data supporting this study are included within the article and/or ESI.†Conflicts of interest
There are no conflicts to declare.Acknowledgements
G. R. Chaudhary is also thankful to Department of Science and Technology (DST)-Water Technologies Cell for Project No. WTC/OWUIS-2021/TS-04 (G). B. Sharma is thankful to DST Inspire SRF (IF170098) and the Commonwealth Scholarship Commission (CSC) (INCN-2019-409). All authors are thankful to SAIF/CIL, Panjab University, for providing characterization facilities.References
- W. L. Filho, A. L. Salvia, A. Minhas, A. Paço and C. Dias-Ferreira, Sci. Total Environ., 2021, 770, 145257 Search PubMed.
- D. Winton, L. Marazzi and S. Loiselle, Sci. Total Environ., 2022, 820, 153229 Search PubMed.
- G. L. Robertson, Introduction to food packaging, Elsevier, 2019 Search PubMed.
- L. Mahmudah and S. R. Juliastuti, IOP Conf. Ser.: Mater. Sci. Eng., 2023, 1239, 012011 CrossRef.
- N. A. Ghulam, M. N. Abbas and D. E. Sachit, Int. J. Innov. Sci. Res. Technol., 2019, 4, 326–331 Search PubMed.
- G. V. Calder and T. D. Stark, Pract. Period. Hazard., Toxic. Radioact. Waste Manage., 2010, 14(4), 258–265 CrossRef CAS.
- M. Mold, C. Linhart, J. Gómez-Ramírez, A. Villegas-Lanau and C. Exley, J. Alzheimer's Dis., 2020, 76(3), 725–732 Search PubMed.
- E. P. Meshcheryakov, S. I. Reshetnikov, M. P. Sandu, A. S. Knyazev and I. A. Kurzina, Appl. Sci., 2021, 11(6), 2457 CrossRef CAS.
- A. Mukherjee, I. Mohammed, Tc Prathna and N. Chandrasekaran, Sci. Against Microb. Pathog.: Commun. Curr. Res. Technol. Adv., 2011, 1, 245–251 Search PubMed.
- V. S. Saji, T. Kumeria, K. Gulati, M. Prideaux, S. Rahman, M. Alsawat, A. Santos, G. J. Atkinsb and D. Losic, J. Mater. Chem. B, 2015, 3(42), 8376–8388 Search PubMed.
- U. Chakraborty, G. Kaur, H.-G. Rubahn, A. Kaushik, G. R. Chaudhary and Y. K. Mishra, Prog. Mater. Sci., 2023, 139, 101169 CrossRef CAS.
- (a) A. Singh, J. Dhau, R. Kumar, R. Badru, P. Singh, Y. Kumar Mishra and A. Kaushik, Prog. Mater. Sci., 2024, 144, 101289 CrossRef CAS; (b) N. G. Macedo, J. C. Alvim, L. C. Soares, L. S. da Costa, M. T. Galante, V. S. Lima and C. Longo, Mater. Adv., 2024, 5, 4541–4562 RSC.
- N. Tyagi, G. Sharma, D. Kumar, P. P. Neelratan, D. Sharma, M. Khanuja, M. K. Singh, V. Singh, A. Kaushik and S. K. Sharma, Coord. Chem. Rev., 2023, 496, 215394 CrossRef CAS.
- N. O. Eddy, R. A. Ukpe, R. Garg, R. Garg, A. Odiongenyi, P. Ameh, I. N. Akpet and S. E. Udo, Clean Technol. Environ. Policy, 2023, 1–32 Search PubMed.
- F. I. Sangor and M. A. Al-Ghouti, Case Stud. Chem. Environ. Eng., 2023, 8, 100394 CrossRef CAS.
- K. K. Anna, N. K. R. Bogireddy, V. Agarwal and R. R. Bon, Mater. Lett., 2022, 317, 132085 CrossRef.
- A. U. Ezeibe, E. C. Nleonu, C. C. Onyemenonu, N. Arrousse and C. C. Nzebunachi, Saudi J. Eng. Technol., 2022, 7, 132–136 CrossRef.
- S. Zhang, I. Khan, X. Qin, K. Qi, Y. Liu and S. Bai, Front. Chem., 2020, 8, 117 CrossRef CAS PubMed.
- Q. Liu, IOP Conf. Ser.: Mater. Sci. Eng., 2020, 514, 052001 CrossRef.
- A. M. Chauhan, A. B. Sharma, R. Kumar, G. R. Chaudhary, A. A. Hassan and S. Kumar, Environ. Res., 2019, 168, 85–95 CrossRef PubMed.
- S. Mondal, Env. Eng. Sci., 2008, 25, 295–308 CrossRef.
- H. Zou, W. Ma and Y. Wang, Arch. Environ. Prot, 2015, 41, 33–39 Search PubMed.
- R. J. Ganaie, S. Rafiq and A. Sharma, IOP Conf. Ser.: Mater. Sci. Eng., 2023, 1110, 4–9 Search PubMed.
- F. M. D. Chequer, G. A. R. de Oliveira, E. R. A. Ferraz, J. C. Cardoso, M. V. B. Zanoni and D. P. de Oliveira, Eco-Friendly Text. Dyeing Finish., 2013, 6, 151–176 Search PubMed.
- K. Saravanan, B. Shanthi, C. Ravichandran, B. Venkatachalapathy, K. I. Sathiyanarayanan, S. Rajendran, N. S. Karthikeyan and R. Suresh, Environ. Res., 2023, 218, 114985 CrossRef CAS PubMed.
- A. Mitelut and M. E. Popa, Roman. Biotechnol. Lett., 2011, 16(1), 121–129 CAS.
- M. N. Nduni, A. M. Osano and B. Chaka, Clean. Eng. Technol., 2021, 3, 100108 CrossRef.
- R. R. Toledo, V. R. Santoyo, D. M. Sánchez and M. Martínez, N. Sci., 2018, 10, 1217 Search PubMed.
- C. Yua, Z. Li, L. Zhou and G. Ju, Materials, 2022, 15(6), 2169 CrossRef PubMed.
- Y. Yang, Y. Xu, B. Han, B. Xu, X. Liu and Z. Yan, J. Colloid Interface Sci., 2022, 469, 1–7 CrossRef PubMed.
- M. A. Ates, V. Demir, Z. Arslan, J. Daniels, I. O. Farah and C. Bogatu, Environ. Toxicol., 2013, 30(1), 109–118 CrossRef PubMed.
- S. Pakrashi, S. Dalai, A. Humayun, S. Chakravarty, N. Chandrasekaran and A. Mukherjee, PLoS One, 2015, 8(9), 74003 CrossRef PubMed.
- N. Bao, X. Miao, X. Hu, Q. Zhang, X. Jie and X. Zheng, Catalysis, 2017, 7, 117 Search PubMed.
- S. A. Ansari and Q. Husain, J. Mol. Catal. B: Enzym., 2011, 70(3–4), 119–126 CrossRef CAS.
- T.-Z. Ren, Z.-Y. Yuan and B.-L. Su, Langmuir, 2004, 20(4), 1531–1534 CrossRef CAS PubMed.
- A. Baccarella, R. Garrard, M. Beauvais, U. Bednarksi, S. Fischer, A. Abeykoon, K. Chapman, B. Phillips, J. Parise and J. Simonson, J. Solid State Chem., 2021, 301, 1 CrossRef.
- S. I. Al-nassar, K. M. Adel and Z. F. Mahdi, Manuf. Sci. Technol., 2015, 3(4), 79 Search PubMed.
- X. Zhou, J. Zhang, Y. Ma, H. Tian, a L. Que Wang and L. J. Q. Cu, RSC Adv., 2017, 7, 4907 Search PubMed.
- E. O. Filatova and A. S. Konashuk, J. Phys. Chem. C, 2015, 119(35), 20755–20761 CrossRef CAS.
- F. Tzompantzi, Y. Piña, A. Mantilla, O. A. Martínez, F. G. Hernández, X. Bokhimi and A. Barrera, Catal. Today, 2014, 220–222, 49–55 CrossRef CAS.
- X. Yan, K. Yuan, N. Lu, H. Xu, S. Zhang, N. Takeuchi, H. Kobayashi and R. Li, Appl. Catal., B, 2017, 218(5), 20–31 CrossRef CAS.
- K. Edalati, I. Fujita, S. Takechi, Y. Nakashima, K. Kumano, H. R. Khosroshahi, M. Arita, M. Watanabe, X. Sauvage, T. Akbay, T. Ishihara, M. Fuji and Z. Horita, Scr. Mater., 2019, 173, 120–124 CrossRef CAS.
- K. B. Kusuma, M. Manju, C. R. Ravikumar, H. P. Nagaswarupa, M. A. S. Amulya, M. R. Anilkumar, B. Avinash, K. Gurushantha and N. Ravikantha, Sensors Int., 2020, 1, 100039 CrossRef.
- M. A. Gondal, T. A. Fasasi, A. Mekki and T. A. Saleh, Nanosci. Nanotechnol. Lett., 2016, 8(1), 17–25 Search PubMed.
- J. M. Small and H. Hintelmann, Anal. Bioanal. Chem., 2007, 387, 2881–2886 CrossRef CAS PubMed.
- P. Jia, H. Tan, K. Liu and W. Gao, Mater. Res. Bull., 2018, 102, 45–50 CrossRef CAS.
- M. Chauhan, B. Sharm, R. Kumar, G. R. Chaudhary, A. A. Hassan and S. Kumar, Environ. Res., 2019, 168, 85–95 CrossRef CAS PubMed.
- K. B. Kusuma, M. Manju, C. R. Ravikumar, H. P. Nagaswarupa, M. A. S. Amulya, M. R. Anilkumar, B. Avinash, K. Gurushantha and N. Ravikantha, Sensors Int., 2020, 1, 100039 CrossRef.
- D. Pathania, R. Katwal and H. Kaur, Int. J. Miner., Metall. Mater., 2016, 23, 358–371 CrossRef CAS.
- L. Sun, Q. Shao, Y. Zhang, H. Jiang, S. Ge, S. Lou, J. Lin, J. Zhang, S. Wu, M. Dong and Z. Guo, J. Colloid Interface Sci., 2020, 565, 142–155 CrossRef CAS PubMed.
- B. Mandal, J. Panda, P. K. Paul, R. Sarkar and B. Tudu, Vacuum, 2020, 173, 109150 CrossRef CAS.
- T. Ali, C. P. Mahesh, M. Sharon and M. Sharon, Int. J. Eng. Sci. Res. Technol., 2018, 7, 603–608 CAS.
- H. Hassena, Mod. Chem. Appl., 2016, 4, 3–7 Search PubMed.
- F. H. Abdullah, N. H. H. Abu Bakar and M. Abu Bakar, Optik, 2020, 206, 164279 CrossRef CAS.
Footnotes |
| † Electronic supplementary information (ESI) available. See DOI: https://doi.org/10.1039/d4ma00717d |
| ‡ Both have contributed equally. |
| This journal is © The Royal Society of Chemistry 2024 |

