 Open Access Article
First-principles study of stability and electronic properties of B2 X–Ru alloys for high-temperature structural applications
B. O.
Mnisi
*a,
E. M.
Benecha
b and
M. M.
Tibane
a
aDepartment of Physics, University of South Africa, Johannesburg, 1709, South Africa
bCenter for Augmented Intelligence and Data Science (CAIDS), University of South Africa, Johannesburg, 1709, South Africa. E-mail: bhila.oliver00@gmail.com
First published on 20th May 2024
Abstract
We use first-principles density functional theory calculations to study the properties of X–Ru alloys (X = Sc, Ti, V, Cr, Mn, Fe, Co, Ni, Cu, and Zn) in the B2 crystallographic phase for high-temperature structural applications. Specifically, we study their structural, mechanical, phonon and electronic properties and assess their applicability in high-temperature environments. All the X–Ru alloys show good mechanical stability with Sc–Ru, Ti–Ru, V–Ru, and Mn–Ru being highly ductile and relatively hard. Furthermore, these specific alloys have negative heat of formation, indicating that they are thermodynamically stable, and hence making experimental synthesis plausible. Phonon dispersion analysis of these alloys also shows dynamic stability. Their band structures and density of states reveal a metallic nature with dominant covalent bonds. These results make Sc–Ru, Ti–Ru, V–Ru, and Mn–Ru alloys suitable candidates for next-generation high-temperature structural applications.
1. Introduction
There have been intense research efforts in the exploration and advancement of high-temperature intermetallic materials over the past fifteen years,1 necessitated by the increasing temperature requirements for components in advanced aerospace and nuclear systems. At present, the dominant materials utilized in high-temperature structural applications are based on nickel, primarily due to their outstanding high-temperature, physical, and mechanical properties.2,3 However, advancement in the utilization of NBSAs is restricted in next-generation applications, owing to the relatively low melting point of nickel (1543 °C). Therefore, there is a need to search for alternative materials to address the temperature and materials limitations of NBSAs. In this context, various metallic systems, including nitrides, refractory metals (RMs), and the platinum group of metals (PGMs), have been suggested as feasible alternatives.Refractory metals (RM) such as molybdenum, niobium, tantalum, and tungsten face significant challenges with oxidation when exposed to air at elevated temperatures (around 500 °C).4 Moreover, the strength-to-weight ratio of titanium alloys tends to decline with temperature increase, while the practical applications of magnesium alloys at high temperatures are hindered by their limited mechanical properties, including inadequate strength, susceptibility to internal fatigue, and poor resistance to creep.5 Recent studies have explored intermetallic alloys of magnesium with elements like lanthanum, neodymium, and samarium across various crystallographic phases such as D0c, A15, and L12, employing ab initio density functional theory calculations.6,7 Notably, data on the heat of formation suggest thermodynamic stability across all these phases. Furthermore, these alloys exhibit mechanical stability, albeit with exceptions in the L12 and A15 phases.
The utilization of platinum group metals (PGMs) like platinum, ruthenium, osmium, rhodium, palladium, and iridium has also been explored for high-temperature structural applications.6–9 Although their chemical characteristics are akin to those of nickel-based super-alloys (NBSAs),10 certain PGMs possess inherent brittleness and encounter obstacles associated with weight and cost. Previously, Raub et al.11 and Greenfield et al.12 confirmed the presence of three intermetallic compounds—Cr4Ru, Cr3Ru, and Cr2Ru (σ phase)—in the Cr–Ru binary phase diagram,13 as well as the terminal solution phases of BCC (Cr) and HCP (Ru), using metallography, X-ray diffraction (XRD), and microhardness assessment techniques. Notably, Nishihara et al.13 experimentally synthesized an A15 Cr3Ru alloy using the arc-melting technique through the annealing of the alloy at 800 °C and consequently, a lot of research efforts have been focused on Ru-based alloys.
Tibane et al.14 explored the phase stability of Cr3A and A3Cr (A = Pt, Ru) across different crystallographic phases, including D0c, D0c’ tP16, A15, B2, and L12. Their findings revealed that PtCr3 in the L12 phase has the most stable configuration. Although other structures were deemed unstable in this study, there is a possibility of stabilization through doping. This finding has led to numerous research efforts being directed towards the examination of Ru-based intermetallic alloys,14–17 particularly incorporating transition metal atoms. Utilization of transition metals is motivated by their ability to form alloys with relatively higher melting points and low densities18 compared to main group metals.19 Furthermore, these elements are known to improve thermodynamic stability16 and increase room-temperature ductility in various materials.20 Recently, we studied16 A15 Cr3Ru and Ru3Cr alloys doped with 3d and 4d transition metals (Mn, Mo, Pt, Pd, Fe, Co, Re and Zr) using first-principles density functional theory, in which it was established that doping leads to thermodynamic stability. Furthermore, we investigated A15 X–Ru (X = Sc, Ti, V, Cr, Mn, Fe, Co, Ni, Cu and Zn),21 and it was found that most of these alloys have favorable heats of formation, which may lead to their experimental realization, amongst other attractive mechanical properties.
While the Ru-based transition metal alloys can possibly crystallize in various crystallographic phases, including D0c, tP16, A15, B2, and L12, only their properties in A15,16,17,21 D0c22 and tP1623,24 have been explored so far. Therefore, there is a need to understand their behavior across all known stable phases to discover novel materials for high-temperature structural applications.
In this study, we report on the properties of B2 X–Ru (X = Sc, Ti, V, Cr, Mn, Fe, Co, Ni, Cu and Zn) alloys. Although data on these material systems in the B2 phase is limited in the literature, previous studies have shown that the two-phase BCC + B2 microstructure possesses microstructural similarities to γ−γ′ Ni-based super-alloys.25–33 Moreover, a comprehensive investigation by Chauhan et al.34 into the properties of nitrides of transition metals (TMs) belonging to the 4B group (TiN, ZrN, and HfN) in both the initial NaCl-B1 and the high-pressure CsCl-B2 phases indicates that these materials maintain mechanical stability in both the B1 and B2 phases under standard conditions and elevated pressures. In the current study, we specifically study the thermodynamic, mechanical and dynamical stabilities as well as the electronic properties of B2 X–Ru (X = Sc, Ti, V, Cr, Mn, Fe, Co, Ni, Cu and Zn) alloys under zero-pressure conditions. Our findings indicate that Sc–Ru, Ti–Ru, V–Ru, and Mn–Ru are both thermodynamically and dynamically stable with interesting structural, mechanical, and electronic properties, which makes them suitable materials for high-temperature structural applications such as in the aerospace and engineering industries.
2. Computational details
First-principles density functional theory (DFT)35 was used to analyze the stability and electronic properties of binary X–Ru compounds in the B2 phase (Fig. 1) using the Cambridge serial total energy package (CASTEP) code.36 The Perdew–Burke–Ernzerhof (PBE)37 generalized gradient approximation incorporating the Hubbard parameter “U” (GGA+U were U = 2.5 eV) was used to represent the electronic exchange functional. The core and valence interactions were represented by the ultra-soft pseudopotentials,38 with a plane wave cut-off energy of 800 eV.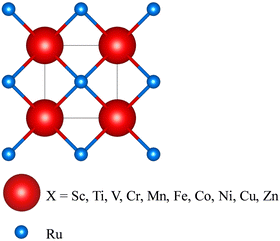 | ||
| Fig. 1 Schematic 3D diagram of the X–Ru primitive cell in the B2 CsCl phase. The red and blue spheres represent X and Ru atoms. This structure is modelled using VESTA software.39 | ||
The properties of the X–Ru (X = Sc, Ti, V, Cr, Mn, Fe, Co, Ni, Cu and Zn) alloys were modelled from the respective unit cells (Fig. 1), with the Monkhorst–Pack40k-point sampling of 15 × 15 × 15. To ensure the accuracy of the results, the convergence criteria on energy, force, atomic displacement, and stress of 5.0 × 10⁻⁶ eV per atom, 0.01 eV Å−1, 0.0005 Å, and 0.02 GPa were utilized, respectively. Similarly, to ensure an accurate representation of the magnetic properties of these systems, the smearing width was adjusted to 0.001 eV.
3. Results and discussion
3.1 Structural properties and thermodynamic stability
The B2 phase is an ordered bcc structure composed of two simple cubic interpenetrating sublattices (Fig. 1), and can be represented stoichiometrically by 50![[thin space (1/6-em)]](https://www.rsc.org/images/entities/char_2009.gif) :
:![[thin space (1/6-em)]](https://www.rsc.org/images/entities/char_2009.gif) 50 atomic distributions. According to Fig. 1, the Ru atoms occupy bcc sites with coordinates 3f (0.5, 0.5, 0.5), while the X atoms occupy corner-site 3g with fractional coordinates (0, 0, 0).
50 atomic distributions. According to Fig. 1, the Ru atoms occupy bcc sites with coordinates 3f (0.5, 0.5, 0.5), while the X atoms occupy corner-site 3g with fractional coordinates (0, 0, 0).
Table 1 illustrates the lattice constants, equilibrium volume, bond length, heat of formation and magnetic moments of X–Ru (X = Sc, Ti, V, Cr, Mn, Fe, Co, Ni, Cu, and Zn) computed at zero pressure, while Fig. 2 summarizes the trends in the lattice parameters, bond length (X–Ru) and magnetic moments across the 3d-transition metal (X) series. It is noted that the lattice constants of the stable Sc–Ru, Ti–Ru and V–Ru alloys are inversely related to the magnetic moment. On the other hand, there is a direct relationship between the lattice parameters and bond length across the series. Additionally, in late 3d-element alloys (Fe–Ru, Co–Ru, Ni–Ru, and Cu–Ru), the magnetic moment increases proportionally with increasing lattice parameters and bond lengths. This can be attributed to the crystal strain associated with the atomic radii of the 3d-elements relative to that of Ru and the nature of the 3d-orbitals.
| X–Ru | a (Å) | V 0 (Å3) | Bond-length X–Ru (Å) | ΔHf (eV per atom) | Magnetic moments (μB per atom) |
|---|---|---|---|---|---|
| Sc | 3.23 | 33.92 | 2.80 | −0.53 | 0.00 |
| Ti | 3.08 | 29.43 | 2.67 | −0.77 | 0.01 |
| V | 3.05 | 28.40 | 2.64 | −0.43 | 0.58 |
| Cr | 3.09 | 29.56 | 2.68 | 0.194 | 1.30 |
| 2.9923 | 0.18723 | ||||
| 0.13 [https://www.materialproject.org] | |||||
| Mn | 3.08 | 29.13 | 2.67 | −1.12 | 1.74 |
| Fe | 2.99 | 26.75 | 2.59 | 0.10 | 2.02 |
| Co | 3.01 | 27.19 | 2.60 | 0.21 | 2.05 |
| Ni | 2.91 | 24.66 | 2.52 | 0.84 | 0.00 |
| Cu | 2.98 | 26.49 | 2.58 | 0.51 | 0.79 |
| Zn | 3.01 | 27.31 | 2.61 | 0.03 | 0.56 |
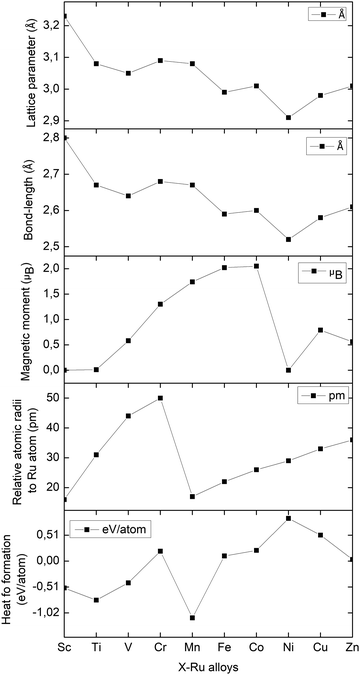 | ||
| Fig. 2 The lattice parameters (Å), bond lengths (Å), magnetic moments (μB), relative atomic radii (pm), and heats of formation (eV per atom) of the X–Ru alloys in the B2-phase. | ||
The heat of formation (ΔHf) represents the energy required for the formation or breaking of chemical bonds and serves as a measure to assess the potential stability of an alloy. The heat of formation is expressed as in eqn (1):
 | (1) |
3.2 Mechanical properties
The mechanical behavior of a solid is determined by its elastic properties. In this study, we specifically use independent elastic constants Cij to describe the mechanical resistance in X–Ru alloys when external stresses are applied. The calculated elastic constants are then used to analyze the mechanical properties of the alloys in terms of the bulk modulus, shear modulus, Young's modulus, bulk to shear ratio, Poisson's ratio, Vickers hardness, anisotropic factors and melting temperatures. These parameters are crucial for evaluating materials for use in high-temperature structural applications.It is commonly known that cubic structures have three independent elastic constants, respectively, because of their symmetry (C11, C12 and C44). The Born–Huang conditions, which must be met for cubic compounds to be mechanically stable, include the following requirements,43,44 as shown in eqn (2)
| C44 > 0; C11 > C12; C11 + 2C12 > 0 | (2) |
A cubic crystal has three independent elastic constants, C11, C12 and C44, which are attributed to the symmetry of the crystals. Table 2 lists the calculated elastic constants of the transition metal X–Ru alloys. It should be noted that all transition metal X–Ru alloys satisfy the mechanical stability criteria of eqn (2).
| X–Ru | C 11 | C 12 | C 44 | MS | ζ | B (GPa) | G (GPa) | E (GPa) | B H/GH | υ | H V | T m (K) | A U |
|---|---|---|---|---|---|---|---|---|---|---|---|---|---|
| Sc | 215.75 | 88.79 | 52.87 | S | 0.55 | 131.11 | 56.89 | 149.10 | 2.30 | 0.31 | 6.22 | 1828.08 | 0.04 |
| Ti | 407.17 | 111.58 | 94.80 | S | 0.42 | 210.11 | 113.34 | 288.19 | 1.85 | 0.27 | 12.99 | 2959.37 | 0.24 |
| V | 263.18 | 118.91 | 103.38 | S | 0.58 | 167.00 | 89.50 | 227.80 | 1.87 | 0.27 | 10.91 | 2108.40 | 0.16 |
| Cr | 139.02 | 127.84 | 105.09 | S | 0.95 | 131.57 | 39.12 | 106.78 | 3.36 | 0.36 | 3.10 | 1374.61 | 20.2 |
| Mn | 213.27 | 127.04 | 128.38 | S | 0.70 | 155.79 | 82.98 | 211.40 | 1.88 | 0.27 | 10.26 | 1813.43 | 1.58 |
| Fe | 298.43 | 152.60 | 93.07 | S | 0.63 | 201.21 | 84.41 | 222.15 | 2.38 | 0.32 | 7.92 | 2316.72 | 0.07 |
| Co | 238.14 | 170.32 | 123.69 | S | 0.80 | 192.93 | 73.92 | 196.66 | 2.61 | 0.33 | 6.50 | 1960.41 | 2.3 |
| Ni | 228.02 | 286.46 | 194.17 | S | 1.16 | 266.98 | 5.24 | 15.61 | 50.95 | 0.49 | 0.034 | 1900.60 | −10.6 |
| Cu | 173.16 | 197.49 | 105.83 | S | 1.10 | 189.38 | 10.94 | 32.20 | 17.31 | 0.47 | 0.20 | 1576.38 | −13.0 |
| Zn | 216.06 | 171.43 | 109.60 | S | 0.86 | 186.31 | 58.71 | 159.39 | 3.17 | 0.36 | 4.42 | 1829.91 | 3.74 |
The stability of an alloy can be described by the Klein parameter ζ under bond stretching and bond bending. The Klein parameter was calculated using eqn (3):
 | (3) |
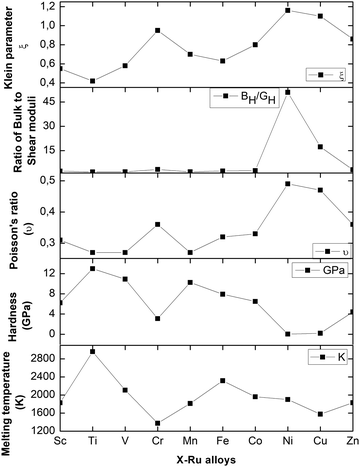
The range of values for the Klein parameter ζ is between 0 and 1. Also, the lower and upper limits of ζ = 0 and ζ = 1 indicate the contributions of bond bending and bond stretching. As a result, when ζ is close to 0, bond stretching predominates under stress, and when ζ is close to 1, bond bending predominates. The Klein parameter (ζ) for B2 X–Ru alloys ranges from 0.42 to 1.16. It is clear that bond bending dominates the mechanical strength in all X–Ru alloys because their ζ values are close to or equal to one.
 | (4) |
 | (5) |
 | (6) |
 | (7) |
 | (8) |
| HV = 0.92K1.137G0.708 | (9) |
| HV = 2(K2G)0.585 − 3 | (10) |
To better understand the mechanical characteristics of transition metal X–Ru alloys, it is necessary to investigate the polycrystalline elastic moduli, namely the shear modulus G, bulk modulus B, and Young's modulus E mentioned in Section 2. Table 2 presents the computed values for the bulk-to-shear modulus ratio (GH/BH), Poisson's ratio (υ), Young's modulus (E), Vickers hardness (HV), and shear modulus B (GPa) for X–Ru compounds. Among all other transition metal alloys, Ni–Ru exhibits the highest bulk modulus BH at 266.98 GPa. As the bulk modulus reflects the resistance to volume change,54 Ni–Ru also demonstrates the greatest resistance to volume change. Conversely, in Table 2, it is observed that Ni–Ru has a lower GH at 5.24 GPa, while Ti–Ru possesses a higher shear modulus GH at 113.34 GPa.
The concepts of the shear modulus and a material's resistance to plastic deformation are closely interrelated.55 When there is greater resistance to reversible deformation under shear stress, the shear modulus is higher. Consequently, both Ti–Ru and Ni–Ru compounds exhibit heightened resistance to plastic deformation compared to other compounds, both strong and weak. The stiffness of a solid is quantified by its Young's modulus (EH),56 and, as per our findings in Table 2, Ti–Ru stands out as the stiffest material with the highest value at 288.19 GPa.
To characterize the mechanical properties of the X–Ru materials, we employed Pugh's ratio (k = BH/GH)57 and Poisson's ratio (υ),58 which are crucial factors in determining a material's ductility. Ductile properties are exhibited when a material has k > 1.75 and (υ) > 0.25; otherwise, it behaves in a brittle manner. Notably, all X–Ru alloys demonstrate ductile properties, as indicated in Table 2, making them suitable for high-temperature applications. The assessment of elastic constants provides insights into various macroscopic characteristics of materials, including hardness, which is a crucial factor in determining a material's suitability for coating. Table 2 lists the calculated hardness values for the X–Ru transition metal alloys. Remarkably, Ti–Ru, V–Ru, and Mn–Ru exhibit the highest Vickers hardness values of 12.99 GPa, 10.91 GPa, and 10.26 GPa, respectively. These values are comparable to borides, such as MoAlB (12.71 GPa).59
 | (12) |
The calculated melting temperatures are listed in Table 2. Notably, it was observed that the melting temperatures for all X–Ru alloys surpassed that of the commonly used Ni3Al (1691 K),9 except for Cr–Ru and Cu–Ru. This indicates that these alloys, characterized by higher melting temperatures, are potential candidates for applications in high-temperature structural environments, particularly in the hot-section components of turbine engines. The relationship between the melting temperature, Klein parameter, ratio of bulk to shear, Poisson's ratio, and hardness is summarized in Fig. 3.
 | (13) |
Isotropic materials exhibit an anisotropic factor of AU = 1, while any value greater or less than one indicates anisotropy. Table 2 lists the calculated universal anisotropies for the X–Ru alloys. The anisotropy index for all alloys falls within the range of −13.0 to 20.2. It is evident that the anisotropic factor for all X–Ru alloys is consistently greater or less than one, signifying the alloys' inherent anisotropy.
In Fig. 4, we present the direction-dependent Young's modulus, linear compressibility, shear modulus, and Poisson's ratio in three dimensions using ELATE software.65 The minimum and maximum values for each parameter are indicated by green and blue colors, respectively. An isotropic material has a spherical shape, and any deviation from this shape signifies anisotropy. Linear compressibility tends to be isotropic, whereas Young's modulus, shear modulus and Poisson's ratio exhibit anisotropic characteristics. This observation is in agreement with the anisotropic values presented in Table 3. Moreover, the predicted maximum and minimum values are presented in Table 3.
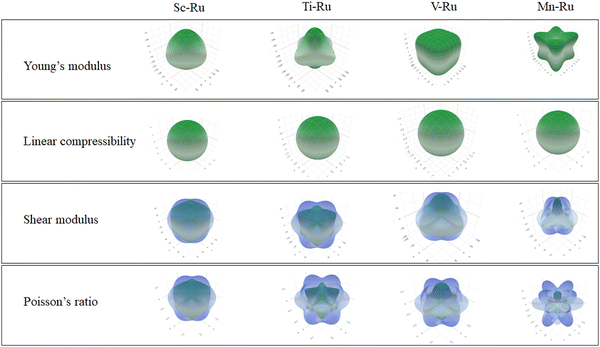 | ||
| Fig. 4 The direction-dependent Young's modulus, shear modulus and Poisson's ratio for X–Ru (X = Sc, Ti, V, Cr, Mn, Fe, Co, Ni, Cu and Zn) in the B2-phase. | ||
| Sc–Ru | Young's modulus | Linear compressibility | Shear modulus | Poisson's ratio | ||||
|---|---|---|---|---|---|---|---|---|
| E min | E max | β min | β max | G min | G max | U min | U min | |
| 139.82 | 163.98 | 2.54 | 2.54 | 52.87 | 63.48 | 0.26 | 0.37 | |
| A U | 1.173 | 1.000 | 1.201 | 1.4446 | ||||
| Ti–Ru | Young's modulus | Linear compressibility | Shear modulus | Poisson's ratio | ||||
|---|---|---|---|---|---|---|---|---|
| E min | E max | β min | β max | G min | G max | U min | U min | |
| 247.22 | 359.17 | 1.59 | 1.59 | 94.80 | 147.79 | 0.16 | 0.41 | |
| A U | 1.453 | 1.000 | 1.559 | 2.5788 | ||||
| V–Ru | Young's modulus | Linear compressibility | Shear modulus | Poisson's ratio | ||||
|---|---|---|---|---|---|---|---|---|
| E min | E max | β min | β max | G min | G max | U min | U min | |
| 189.17 | 257.09 | 1.996 | 1.996 | 72.12 | 103.38 | 0.14 | 0.39 | |
| A U | 1.359 | 1.000 | 1.433 | 2.7525 | ||||
| Mn–Ru | Young's modulus | Linear compressibility | Shear modulus | Poisson's ratio | ||||
|---|---|---|---|---|---|---|---|---|
| E min | E max | β min | β max | G min | G max | U min | U min | |
| 118.42 | 302.14 | 2.14 | 2.14 | 43.12 | 128.38 | −0.15 | 0.69 | |
| A U | 2.551 | 1.000 | 2.978 | Infinite | ||||
3.3 Phonon dispersion curves
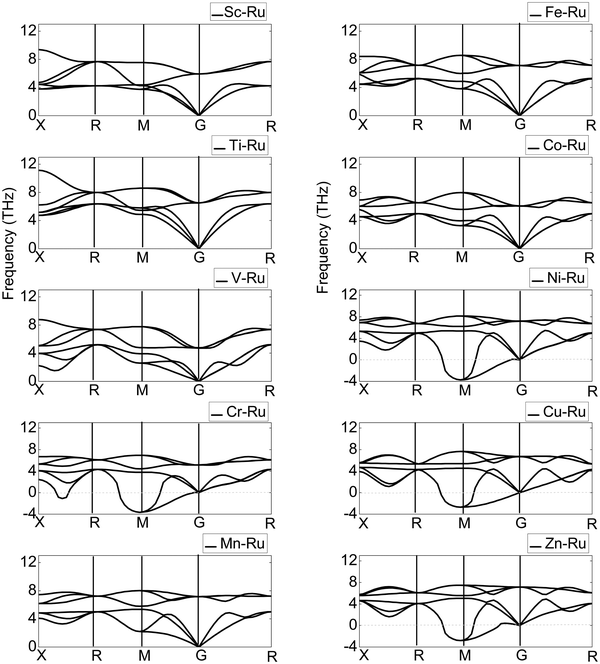
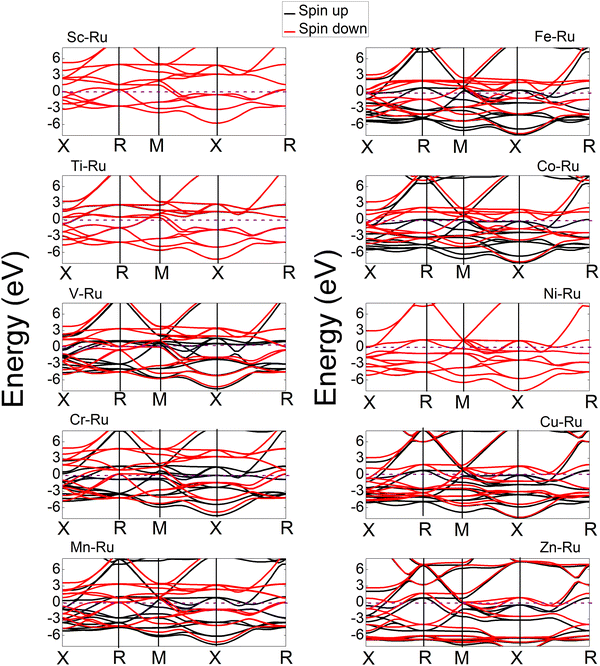
The phonon dispersion spectrum (PDS) and phonon density of states (PDOS) have an impact on a variety of dynamical properties of materials, either directly or indirectly.66 A phonon algorithm has been used in conjunction with the finite displacement approach for phonon calculations.67–70 This approach is crucial for treating each X–Ru unit cell as a single supercell that is 4.0 in cut-off radius and 4 times larger than the present cell. Furthermore, a separation of 0.04 per Å was established for each component.As a technique for measuring the dynamic lattice stability and instability, phase transition and vibrational contributions to heat conduction, thermal expansion, Helmholtz free energy, and heat capacity in materials, the PDOS has gained prominence.71 Additionally, the phonon properties are directly connected to the PDOS through the electron–phonon interactions. The optical phonons of a material regulate several optical properties. The phonon dispersion curves of the X–Ru (X = Sc, Ti, V, Cr, Mn, Fe, Co, Ni, Cu and Zn) alloys are shown along the highest-symmetry points of the Brillouin zone (BZ), as illustrated in Fig. 5. The phonon dispersion curves are used to study the dynamic stability of X–Ru alloys in the B2-phase. Any compound with positive phonon frequencies across the whole BZ is dynamically stable, whereas negative phonon frequencies indicate dynamic instability. B2 X–Ru (X = Sc, Ti, V, Mn, Fe, and Co) alloys do not have negative phonon frequencies and are thus dynamically stable, whereas Cu–Ru, Zn–Ru, Cr–Ru, and Ni–Ru alloys are dynamically unstable. This instability arises from phonon softening around the transverse acoustic branch at M points, resulting in negative phonon energies. It is worth noting that this phenomenon (phonon softening) is more pronounced in the Ni–Ru and Cr–Ru alloys. This observation aligns with previous theoretical data on materials in the B2 phase.72
3.4 Electronic and magnetic properties
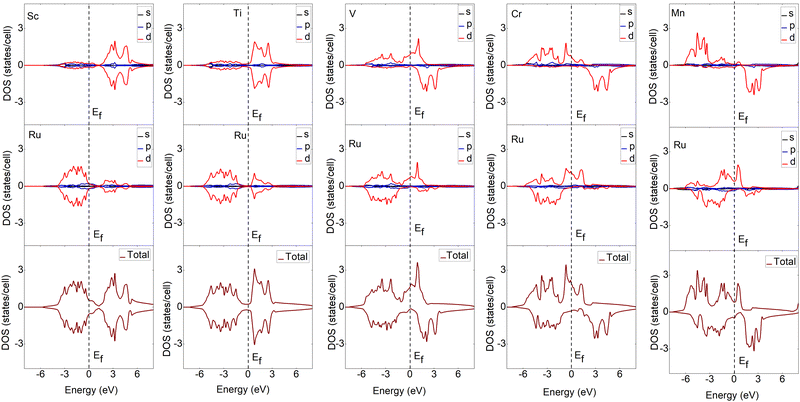
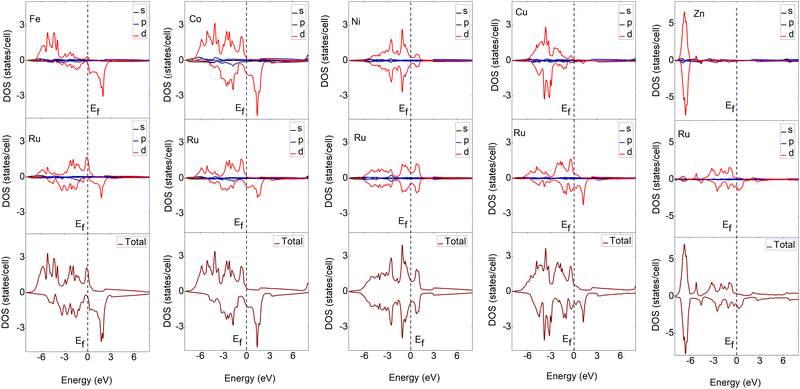
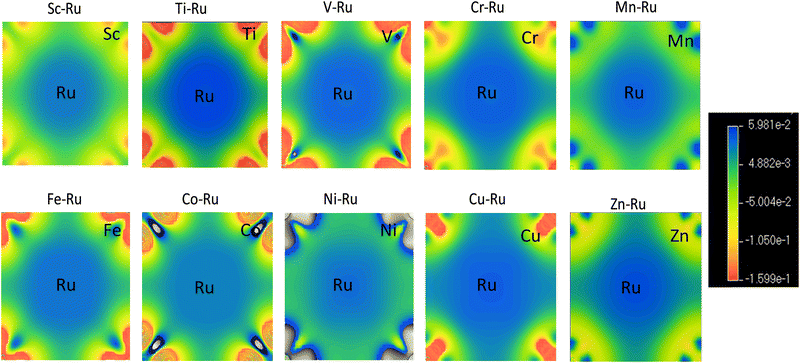
To understand the bonding characteristics of X–Ru (X = Sc, Ti, V, Cr, Mn, Fe, Co, Ni, Cu, and Zn) in the B2-phase, we investigated their electronic and magnetic properties. Table 1 presents the magnetic moments of the B2 X–Ru alloys. Notably, Co–Ru (2.05μB), Fe–Ru (2.02μB), Mn–Ru (1.74μB) and Cr–Ru (1.30) exhibit the highest magnetic moments. Additionally, as depicted in Fig. 6 and 7, the up- and down-spin states in Sc–Ru, Ti–Ru, and Ni–Ru are symmetric, leading to the cancellation of magnetic moments. This symmetry between the up- and down-spin states cancels the magnetic moments associated with electron spin, providing justification for the calculated zero or negligible magnetic moments in these alloys (Table 1). Conversely, alloys involving X–Ru (X = V, Cr, Mn, Fe, Co, Cu, and Zn) exhibit asymmetric spin-up and -down PDOS resulting in non-zero magnetic moments.The electronic properties play an important role in elucidating and establishing connections between a material's structural stability and magnetic moments.73 In Fig. 6–8 shows the band structures, total density of states (TDOS), and partial density of states (PDOS) for X–Ru (X = Sc, Ti, V, Cr, Mn, Fe, Co, Ni, Cu, and Zn) in the B2-phase. Notably, an electronic overlap between the valence and conduction bands around the Fermi energy level of X–Ru was observed, indicating the metallic behavior of these alloys. These observations align with conclusions drawn from previous theoretical studies.74–76
The total density of states (TDOS) analysis for the X–Ru (X = Sc, Ti, V, Cr, Mn, Fe, Co, Ni, Cu, and Zn) alloys in the B2-phase reveals metallic conductivity, evident from the pronounced electronic overlap between the valence and conduction regions (Fig. 6 and 7). In addition, there is significant hybridization between the X-3d orbital and Ru-4d-orbital (with the s and p-orbitals from each case making a minimal contribution), indicating metallic bonding. To further understand the individual atomic contributions to the TDOS, we computed the partial density of states (PDOS) for the B2 X–Ru alloys. Notably, the X-3d states significantly contribute to the TDOS around the Fermi energy level compared to the Ru-4d states. Moreover, a combination of the X-2p and Ru-2p states dominates the energy range from approximately 10 eV to 30 eV. The dominance of the X-3d states not only plays a crucial role in the conductivity of X–Ru alloys but also influences their chemical and mechanical stability. This observation aligns consistently with the previous theoretical data.77
4. Conclusions
We studied the structural, mechanical, phonon and electronic properties of B2 X–Ru (X = Sc, Ti, V, Cr, Mn, Fe, Co, Ni, Cu and Zn) alloys using first-principles DFT calculations. All the X–Ru alloys show good mechanical stability with Sc–Ru, Ti–Ru, V–Ru, and Mn–Ru being highly ductile and relatively hard. The calculated melting temperatures of Sc–Ru, Ti–Ru, V–Ru, and Mn–Ru alloys surpassed those of the commonly utilized Ni3Al alloy. Moreover, these particular alloys exhibit a negative heat of formation, signifying their thermodynamic stability and, thus, feasible experimental synthesis. The analysis of phonon dispersion in these alloys demonstrates dynamic stability, with the metallic character dominated by covalent bonds. These findings indicated that Sc–Ru, Ti–Ru, V–Ru, and Mn–Ru alloys are promising materials for high-temperature structural applications. The findings of this study present novel results on the properties of B2 X–Ru alloys, making them a potential material for next-generation high-temperature structural applications.Data availability
The data sets generated and/or analyzed in this study are available from the corresponding author on reasonable request.Author contributions
B. O. Mnisi: conceptualization, methodology, validation, investigation, writing – original draft, project administration, and writing – review & editing. Benecha E. M: supervision, writing – review & editing and resources. Tibane M. M: supervision, writing – review & editing, and resources.Conflicts of interest
The authors declare that they have no known competing financial interests or personal relationships that could have appeared to influence.Acknowledgements
All computations were conducted at the University of South Africa (UNISA) using their high-performance computing facilities. Gratitude is extended to UNISA for providing financial support through master's and doctoral bursaries.References
-
M. Yamaguchi, H. Inui and K. Ito, High-Temperature Structural Intermetallics, Wiley, New York, 1987, vol. 8 Search PubMed
.
-
C. T. Sims, N. S. Stoloff and W. C. Hagel, Super-alloys II, Wiley, New York, 1987 Search PubMed
.
- I. S. Kim, B. G. Choi, H. U. Hong, J. Do and C. Y. Jo, Influence of thermal exposure on the microstructural evolution and mechanical properties of a wrought Ni-base super-alloy, Mater. Sci. Eng. A, 2014, 593, 55–63 CrossRef CAS
.
- B. P. Bewlay, M. R. Jackson, J.-C. Zhao, P. R. Subramanian, M. G. Mendiratta and J. J. Lewandowski, Ultrahigh-temperature Nb-silicide-based composites, MRS Bull., 2003, 28, 646–653 CrossRef CAS
.
- C. J. Bettles and M. A. Gibson, Microstructural Design for Enhanced Elevated Temperature Properties in Sand-Castable Magnesium Alloys, Adv. Eng. Mater., 2003, 5, 859–865 CrossRef
.
- L. A. Cornish, R. Süss, A. Watson and S. N. Prins, Building a database for the prediction of phases in Pt-based super-alloys, Platinum Met. Rev., 2006, 91–102 Search PubMed
.
- J. K. Odusote, L. A. Cornish and J. M. Papo, High Temperature Oxidation of Pt-Al-Cr-Ru Alloy: Scale Morphology and Adherence, Metallogr., Microstruct., Anal., 2012, 1, 142–149, DOI:10.1007/s13632-012-0024-x
.
- L. A. Cornish, R. Suss, R. Volkl, M. Wenderoth, S. Vorberg, B. Fischer, U. Glatzel, A. Douglas, L. H. Chown and T. Murakumo, Overview of the development of new Pt-based alloys for high temperature application in aggressive environments, J. South. Afr. Inst. Min. Metall., 2007, 107, 697–712 CAS
.
- A. I. Popoola and J. E. Lowther, Computational Study of Platinum Group Super-alloys, Int. J. Mod. Phys. B, 2014, 28, 1450066 CrossRef
.
- D. C. Harris and L. J. Cabri, Nomenclature of platinum-group-element alloys: review and revision, Can. Mineral., 1991, 29, 231–237 CAS
.
- E. Raub and W. Mahler, Alloys of chromium with platinum, iridium, rhodium, and ruthenium, Z. Metallkd., 1955, 46, 210–215 CAS
.
- P. Greenfield and P. A. Beck, Intermediate phases in binary systems of certain transition elements, JOM, 1956, 8, 265–276 CrossRef CAS
.
- Y. Nishihara, Y. Yamaguchi, M. Tokumoto, K. Takeda and K. Fukamichi, Superconductivity and magnetism of bcc Cr-Ru alloys, Phys. Rev. B, 1986, 34(5), 3446 CrossRef CAS PubMed
.
- M. M. Tibane, Phase stability study of Pt-Cr and Ru-Cr binary alloys, Doctoral dissertation, University of Limpopo (Turfloop Campus), 2011 Search PubMed.
- C. P. Wang, H. Ren, H. Liu, L. L. Li, S. Y. Yang, J. J. Han, Y. Lu, Y. H. Guo, Y. X. Huang and X. J. Liu, Experimental investigation and thermodynamic assessment of phase equilibria in the Cr-Re-Ru ternary system, CALPHAD, 2021, 74, 102289, DOI:10.1016/j.calphad.2021.102289
.
- B. O. Mnisi, E. M. Benecha, H. R. Chauke, P. E. Ngoepe and M. M. Tibane, Effect of transition metal doping on Cr–Ru alloys using first principles approach, Bull. Mater. Sci., 2020, 43, 1–9 CrossRef
.
- Z. Zhu, Y. J. Zhang, Y. Li, Q. Li, W. Duan and H. H. Wen, Comparative studies on superconductivity in Cr3Ru compounds with bcc and A15 structures, J. Phys.: Condens. Matter, 2022, 34, 475602, DOI:10.1088/1361-648X/ac9501
.
- K. Miwa and A. Fukumoto, First-principles study on (formula presented) transition-metal dihydrides, Phys. Rev. B: Condens. Matter Mater. Phys., 2002, 65, 1–7, DOI:10.1103/PhysRevB.65.155114
.
- W. Takahara, Melting points and chemical bonding properties of 3d transition metal elements, IOP Conf. Ser.: Mater. Sci. Eng., 2014, 61, 012029, DOI:10.1088/1757-899X/61/1/012029
.
- P. La, Y. Wei, R. Lv, Y. Zhao and Y. Yang, Effect of Mn element on microstructure and mechanical properties of bulk nanocrystalline Fe3Al based materials prepared by aluminothermic reaction, Mater. Sci. Eng. A, 2010, 527, 2313–2319, DOI:10.1016/j.msea.2009.12.043
.
-
B. O. Mnisi, E. M. Benecha and M. M. Tibane, Computational Study of A15 Ru-Based Alloys for High-Temperature Structural Applications, 2021 Search PubMed
.
- B. O. Mnisi, E. Benecha and M. Tibane, Investigation of the thermodynamic, structural, electronic, mechanical and phonon properties of D0c Ru-based intermetallic alloys: An ab-initio Study, Mater. Res. Express, 2024, 11, 046506, DOI:10.1088/2053-1591/ad3a40
.
-
M. M. Tibane, Phase stability study of Pt-Cr and Ru-Cr binary alloys, PhD thesis, University of Limpopo, 2011 Search PubMed
.
- B. O. Mnisi, M. Evans Benecha and M. Meriam Tibane, First-Principles Study on Thermodynamic, Structural, Mechanical, Electronic, and Phonon Properties of tP16 Ru-Based Alloys, Alloys, 2024, 3, 126–139, DOI:10.3390/alloys3020007
.
- E. A. Lass, On the Thermodynamics and Phase Transformation Pathways in BCC-B2 Refractory Compositionally Complex Super-alloys, Metall. Mater. Trans. A, 2022, 53, 4481–4498, DOI:10.1007/s11661-022-06844-6
.
- O. N. Senkov, S. V. Senkova and C. Woodward, Effect of aluminum on the microstructure and properties of two refractory high-entropy alloys, Acta Mater., 2014, 68, 214–228 CrossRef CAS
.
- J.-P. Couzinié, O. N. Senkov, D. B. Miracle and G. Dirras, Comprehensive data compilation on the mechanical properties of refractory high-entropy alloys, Data Brief, 2018, 21, 1622–1641 CrossRef PubMed
.
- S. Laube, S. Schellert, A. Srinivasan Tirunilai, D. Schliephake, B. Gorr, H. J. Christ, A. Kauffmann and M. Heilmaier, Microstructure tailoring of Al-containing compositionally complex alloys by controlling the sequence of precipitation and ordering, Acta Mater., 2021, 218, 117217, DOI:10.1016/j.actamat.2021.117217
.
- C. Frey, R. Silverstein and T. M. Pollock, A high stability B2-containing refractory multi-principal element alloy, Acta Mater., 2022, 229, 117767, DOI:10.1016/j.actamat.2022.117767
.
- T. E. Whitfield, E. J. Pickering, L. R. Owen, O. N. Senkov, D. B. Miracle, H. J. Stone and N. G. Jones, An assessment of the thermal stability of refractory high entropy super-alloys, J. Alloys Compd., 2021, 857, 157583, DOI:10.1016/j.jallcom.2020.157583
.
- E. A. Lass, On the Thermodynamics and Phase Transformation Pathways in BCC-B2 Refractory Compositionally Complex Super-alloys, Metall. Mater. Trans A, 2022, 53, 4481–4498, DOI:10.1007/s11661-022-06844-6
.
- D. B. Miracle, M. H. Tsai, O. N. Senkov, V. Soni and R. Banerjee, Refractory high entropy super-alloys (RSAs, Scr. Mater., 2020, 187, 445–452, DOI:10.1016/j.scriptamat.2020.06.048
.
- O. N. Senkov, S. Gorsse and D. B. Miracle, High temperature strength of refractory complex concentrated alloys, Acta Mater., 2019, 175, 394–405, DOI:10.1016/j.actamat.2019.06.032
.
- M. Chauhan and D. C. Gupta, Structural, electronic, mechanical and thermo-physical properties of TMN (TM = Ti, Zr and Hf) under high pressures: A first-principle study, Int. J. Refract. Met. Hard Mater., 2014, 42, 77–90, DOI:10.1016/j.ijrmhm.2013.08.006
.
- P. Hohenberg and W. Kohn, Inhomogeneous electron gas, Phys. Rev. [Sect.] B, 1964, 136, 864 CrossRef
.
- M. D. Segall, P. J. D. Lindan, M. J. Al Probert, C. J. Pickard, P. J. Hasnip, S. J. Clark and M. C. Payne, First-principles simulation: ideas, illustrations and the CASTEP code, J. Phys.: Condens. Matter, 2002, 14, 2717 CrossRef CAS
.
- J. P. Perdew, K. Burke and M. Ernzerhof, Generalized gradient approximation made simple, Phys. Rev. Lett., 1996, 77, 3865 CrossRef CAS
.
- D. Vanderbilt, Soft self-consistent pseudopotentials in a generalized eigenvalue formalism, Phys. Rev. B: Condens. Matter Mater. Phys., 1990, 41, 7892 CrossRef
.
- K. Momma and F. Izumi, VESTA 3 for three-dimensional visualization of crystal, volumetric and morphology data, J. Appl. Crystallogr., 2011, 44, 1272–1276 CrossRef CAS
.
- H. J. Monkhorst and J. D. Pack, Special points for Brillouin-zone integrations, Phys. Rev. B: Solid State, 1976, 13, 5188 CrossRef
.
- S. Kamran, K. Chen and L. Chen, Ab initio examination of ductility features of fcc metals, Phys. Rev. B: Condens. Matter Mater. Phys., 2009, 79, 024106, DOI:10.1103/PhysRevB.79.024106
.
- R. Mahlangu, M. J. Phasha, H. R. Chauke and P. E. Ngoepe, Structural, elastic and electronic properties of equiatomic PtTi as potential high-temperature shape memory alloy, Intermetallics, 2013, 33, 27–32, DOI:10.1016/j.intermet.2012.09.021
.
-
M. Born, On the stability of crystal lattices. I, Mathematical Proceedings of the Cambridge Philosophical Society, Cambridge University Press, 1940, pp. 160–172 Search PubMed
.
-
M. Born and K. Huang, Theory of Crystal Lattices, Clarendon, ( 1956) Search PubMed
.
-
W. Voigt, Lehrbuch der kristallphysik, Teubner, Leipzig, 1928 Search PubMed
.
- A. Reuss, Calculation of the flow limits of mixed crystals on the basis of the plasticity of monocrystals, Z. Angew. Math. Mech, 1929, 9, 49–58 CrossRef CAS
.
- R. Hill, The elastic behaviour of a crystalline aggregate, Proc. Phys. Soc., London, Sect. A, 1952, 65, 349 CrossRef
.
- P. Ravindran, L. Fast, P. A. Korzhavyi, B. Johansson, J. Wills and O. Eriksson, Density functional theory for calculation of elastic properties of orthorhombic crystals: Application to TiSi 2, J. Appl. Phys., 1998, 84, 4891–4904 CrossRef CAS
.
- Y. Tian, B. Xu and Z. Zhao, Microscopic theory of hardness and design of novel superhard crystals, Int. J. Refract. Met. Hard Mater., 2012, 33, 93–106 CrossRef CAS
.
- X.-Q. Chen, H. Niu, D. Li and Y. Li, Modeling hardness of polycrystalline materials and bulk metallic glasses, Intermetallics, 2011, 19, 1275–1281 CrossRef CAS
.
- M. Al-Fahdi, A. Rodriguez, T. Ouyang and M. Hu, High-throughput computation of new carbon allotropes with diverse hybridization and ultrahigh hardness, Crystals, 2021, 11, 783 CrossRef CAS
.
- P. Wang, R. Kumar, E. M. Sankaran, X. Qi, X. Zhang, D. Popov, A. L. Cornelius, B. Li, Y. Zhao and L. Wang, Vanadium Diboride (VB2) Synthesized at High Pressure: Elastic, Mechanical, Electronic, and Magnetic Properties and Thermal Stability, Inorg. Chem., 2018, 57, 1096–1105, DOI:10.1021/acs.inorgchem.7b02550
.
- V. Dovale-Farelo, P. Tavadze, L. Lang, A. Bautista-Hernandez and A. H. Romero, Vickers hardness prediction from machine learning methods, Sci. Rep., 2022, 12, 22475, DOI:10.1038/s41598-022-26729-3
.
- S. F. Pugh, XCII. Relations between the elastic moduli and the plastic properties of polycrystalline pure metals, London, Edinburgh, Dublin, Philos. Mag. J. Sci., 1954, 45, 823–843 CAS
.
- W.-C. Hu, Y. Liu, D.-J. Li, X.-Q. Zeng and C.-S. Xu, First-principles study of structural and electronic properties of C14-type Laves phase Al2Zr and Al2Hf, Comput. Mater. Sci., 2014, 83, 27–34 CrossRef CAS
.
-
A. D. McNaught and A. D. McNaught, Compendium of chemical terminology, Blackwell Science, Oxford, 1997 Search PubMed
.
- S. F. Pugh, XCII. Relations between the elastic moduli and the plastic properties of polycrystalline pure metals, London, Edinburgh Dublin Philos. Mag. J. Sci., 1954, 45, 823–843 CrossRef CAS
.
-
I. N. Frantsevich, F. F. Voronov and S. A. Bokuta, in Elastic Constants and Elastic Moduli of Metals and Insulators, ed. I. N. Frantsevich, Google Scholar, Naukova Dumka, Kiev, 1983, pp. 60–180 Search PubMed
.
- X. Li, H. Cui and R. Zhang, First-principles study of the electronic and optical properties of a new metallic MoAlB, Sci. Rep., 2016, 6, 1–10 CrossRef CAS
.
-
P. A. Isaac, Computational Study of Noble Metal
Alloys, 2009 Search PubMed
.
- D. J. Skinner and M. Zedalis, Elastic modulus versus melting temperature in aluminum based intermetallics, Scr. Metall., 1988, 22, 1783–1785 CrossRef CAS
.
- M. Blackman, On the calculation of characteristic temperatures from the Elastic constants, London, Edinburgh Dublin Philos. Mag. J. Sci., 1951, 42, 1441–1442 CrossRef CAS
.
- M. E. Fine, L. D. Brown and H. L. Marcus, Elastic constants versus melting temperature in metals, Scr. Metall., 1984, 18, 951–956 CrossRef CAS
.
- V. Tvergaard and J. W. Hutchinson, Microcracking in ceramics induced by thermal expansion or elastic anisotropy, J. Am. Ceram. Soc., 1988, 71, 157–166 CrossRef CAS
.
- R. Gaillac, P. Pullumbi and F. X. Coudert, ELATE: An open-source online application for analysis and visualization of elastic tensors, J. Phys. Condensed Matter, 2016, 28, 275201, DOI:10.1088/0953-8984/28/27/275201
.
- C. D. Gelatt Jr, A. R. Williams and V. L. Moruzzi, Theory of bonding of transition metals to nontransition metals, Phys. Rev. B: Condens. Matter Mater. Phys., 1983, 27, 2005 CrossRef
.
- S. Chen and Y. Pan, Noble metal interlayer-doping enhances the catalytic activity of 2H–MoS2 from first-principles investigations, Int. J. Hydrogen Energy, 2021, 46, 21040–21049 CrossRef CAS
.
- Y. Pan and E. Yu, First-principles investigation of electronic and optical properties of H-doped FeS2, Int. J. Energy Res., 2021, 45, 11284–11293 CrossRef CAS
.
- S. Chen and Y. Pan, Influence of Group III and IV Elements on the Hydrogen Evolution Reaction of MoS2 Disulfide, J. Phys. Chem. C, 2021, 194, 110586 Search PubMed
.
- N. Zhu, Y. Guo, X. Zhang and F. Wang, The elastic anisotropy, electronic and thermodynamic properties of TM5Si4 (TM = Sc, Y, Ti, Zr and Hf) silicides from first-principles calculations, Vacuum, 2021, 194, 110586 CrossRef CAS
.
- Y. Yun, D. Legut and P. M. Oppeneer, Phonon spectrum, thermal expansion and heat capacity of UO2 from first-principles, J. Nucl. Mater., 2012, 426, 109–114 CrossRef CAS
.
- S. Ono and D. Kobayashi, Role of the M point phonons for the dynamical stability of B2 compounds, Sci. Rep., 2022, 12, 7258, DOI:10.1038/s41598-022-10658-2
.
- J. Bai, J. M. Raulot, Y. D. Zhang, C. Esling, X. Zhao and L. Zuo, Crystallographic, magnetic, and electronic structures of ferromagnetic shape memory alloys Ni 2 XGa (X = Mn, Fe, Co) from first-principles calculations, J. Appl. Phys., 2011, 109, 14908 CrossRef
.
- M. G. Brik and C.-G. Ma, First-principles studies of the electronic and elastic properties of metal nitrides XN (X = Sc, Ti, V, Cr, Zr, Nb), Comput. Mater. Sci., 2012, 51, 380–388 CrossRef CAS
.
- B. O. Mnisi, E. M. Benecha and M. M. Tibane, Density functional theory studies of structural, electronic and optical properties of cubic 3d-transition metal nitrides, Intermetallics, 2021, 137, 107272 CrossRef CAS
.
- B. O. Mnisi, Density functional theory study of electronic and optical properties of ScN nitride in NaCl-B1, CsCl-B2, ZB-B3 and NiAs-B8 phases, Bull. Mater. Sci., 2022, 45, 1–9 CrossRef
.
- M. I. Naher, F. Parvin, A. K. M. A. Islam and S. H. Naqib, Physical properties of niobium-based intermetallics (Nb3 B; B = Os, Pt, Au): a DFT-based ab-initio study, Eur. Phys. J. B, 2018, 91, 289, DOI:10.1140/epjb/e2018-90388-9
.
- A. T. A. Meenaatci, R. Rajeswarapalanichamy and K. Iyakutti, Pressure induced phase transition of ZrN and HfN: a first principles study, J. At. Mol. Sci., 2013, 4, 321–335 Search PubMed
.
- B. O. Mnisi, Ab initio study of phase stability and optical properties of TiN and VN nitrides in different phases, Solid State Commun., 2024, 377, 115390, DOI:10.1016/j.ssc.2023.115390
.
| This journal is © The Royal Society of Chemistry 2024 |

