 Open Access Article
A novel NIR fluorescent probe for in situ visualizing Fe(II) and its application in drug-induced liver/kidney injury†
Hanyue
Xiang
a,
Yanjie
Song
a,
Yilin
Wang
b,
Wenzhuo
Fu
c and
Nao
Xiao
 *a
*a
aBeijing Area Major Laboratory of Peptide and Small Molecular Drugs, Engineering Research Center of Endogenous Prophylactic of Ministry of Education of China, School of Pharmaceutical Sciences, Capital Medical University, Beijing 100069, China. E-mail: xiaonao@ccmu.edu.cn
bSchool of Basic Medical Sciences, Capital Medical University, Beijing 100069, China
cCore Facilities Center, Capital Medical University, Beijing 100069, China
First published on 29th May 2024
Abstract
Fe2+ has high redox activity and participates in many important physiological processes in vivo, playing a crucial role in the living system. An excessive iron content can lead to oxidative stress and cell damage, leading to the occurrence of many diseases. Therefore, it is necessary to establish an effective method to detect unstable iron(II) ions (Fe2+). In this work, a novel NIR fluorescent probe MDJ-O for Fe2+ based on the N-oxide structure was explored. The probe can monitor Fe2+ based on the ICT mechanism. In the PBS buffer solution containing 1 mM CTAB, MDJ-O showed a rapid response toward Fe2+ in 5 min with a fluorescence enhancement of 49-fold (λex/λem = 535/720 nm). The sensitivity of MDJ-O for Fe2+ was brilliant, and the detection limit was as low as 3.09 μM. Notably, MDJ-O was successfully utilized for living cell imaging and in vivo imaging of zebrafish and mice. In addition, MDJ-O was successfully used for monitoring the level changes of Fe2+ in the liver and kidney injuries induced by acetaminophen (APAP), achieving the visualization of the injury. This work is of great significance for the study of drug-induced liver and kidney injury and other iron-related diseases.
Introduction
Iron is the most plentiful transition metal element on Earth, and is utilized to maintain normal vital activities. Iron is closely related to human life and plays an important biological role. Labile iron with weak protein binding ability aggregates in the labile iron pool (LIP), exhibiting high redox activity.1–6 In the microenvironment of cells, intracellular Fe3+ can be reduced to Fe2+ by ascorbic acid and reduced glutathione (GSH).7,8 To maintain the ordinary function of cells in the organism, Fe2+ and Fe3+ need to be in equilibrium. Unstable Fe2+ can participate in the Fenton reaction to generate a hydroxyl radical (one of the reactive oxygen species (ROS)) which can cause serious oxidative damage to cells.9–14 Iron deficiency can result in anemia, kidney damage, diabetes, etc.15–18 On the other hand, excessive iron may lead to various diseases, such as Parkinson's disease, Alzheimer's disease, cardiovascular disease, cancer, etc.19–21 Iron overload is also associated with liver and kidney injury.22,23 For instance, acetaminophen (APAP), also known as paracetamol, is one of the most commonly used antipyretic and analgesic drugs. Excessive intake of APAP can induce severe liver and kidney toxicity, which can lead to acute liver failure (ALF) and acute kidney injury (AKI).24,25 Although the molecular mechanism of liver and kidney toxicity induced by APAP is complicated, a few studies have revealed that the toxicity is associated with the increased Fe2+ level in the liver and kidney injury disease models.26–29 Therefore, the establishment of an effective real-time detection method for biological Fe2+ ions is of great significance for further study of its physiological and pathological effects.Up to now, some fluorescent probes have been developed as favorable tools for biosensing and imaging Fe2+ levels with significant advantages such as low cost, easy operation, and good selectivity.30–36 However, the number of fluorescent probes used for detecting Fe2+ is still limited. There are mainly two kinds of Fe2+ fluorescent probes available, one is chelation-based probes and the other is reactivity-based probes (Scheme S1, ESI†).37,38 Reaction-based Fe2+ fluorescent probes overcame some limitations of traditional chelating Fe2+ fluorescent probes, such as weak binding to Fe2+, low selectivity, and poor in vivo imaging effect.39,40 Due to the strong paramagnetic properties of iron ions, they have a strong fluorescence quenching ability. The “ON–OFF” response mode is susceptible to interference from complex biological systems and has poor sensitivity, which is not conducive to accurate identification and detection of Fe2+. In contrast, a turn-on fluorescent probe can avoid the aforementioned limitations. In 2013, Nagasawa et al. developed the first fluorescent probe containing an N-oxide structure for Fe2+ with turn-on fluorescence in living cells.41N-oxide-based fluorescent probes can quickly capture the changes in the Fe2+ level in both in vivo and in vitro, which has greatly attracted the attention of many researchers. In the past decade, some researchers have introduced the N-oxide structure as the recognition site for Fe2+ into different kinds of fluorophores and applied them to the detection of Fe2+ (Table S4, ESI†). Near-infrared (NIR) fluorescent probes have been applied in the field of bioanalysis, owing to the great advantages of a good tissue penetration depth and non-invasive detection in vivo.42,43 Therefore, the development of novel fluorescent probes toward Fe2+ with good water solubility, high selectivity, rapid response, and near-infrared fluorescence characteristics has been a research hotspot.
Here, we developed a novel NIR fluorescent probe MDJ-O containing an N-oxide structure on the julolidine moiety. The probe emitted NIR fluorescence when reacting with Fe2+. MDJ-O could effectively detect Fe2+ in nearly 100% aqueous solution, living cells, zebrafish, and mice. After Fe2+ mediated deoxidation of the N-oxide structure, intramolecular charge transfer (ICT) was enhanced, and about 49-fold increase of the NIR fluorescence emission (λem = 720 nm) was observed. The probe displayed brilliant selectivity and sensitivity toward Fe2+, and could achieve a specific fluorescence turn-on response towards Fe2+ within 5 min. Imaging experiments showed that MDJ-O had low cytotoxicity and good biocompatibility, and could be used to image endogenous and exogenous Fe2+ in cells, zebrafish, and mice. In addition, probe MDJ-O was successfully utilized to visualize Fe2+ in mice with APAP-induced liver and kidney injury. This is of great significance for further exploring the occurrence and development process of liver and kidney injury.
Experimental section
Synthesis and characterization
All experiments were performed in compliance with the relevant laws and institutional guidelines, and were approved by the ethical committee at Capital Medical University.
Results and discussion
Design and synthesis of probe MDJ-O
In this work, a novel NIR Fe2+ fluorescent probe MDJ-O based on the julolidine moiety was designed and synthesized. The probe was easily synthesized in only two steps, and the pure products MDJ and MDJ-O were obtained by just washing without purification by column chromatography. MDJ was synthesized by the Knoevenagel condensation reaction of 1 and 2,3,6,7-tetrahydro-1H,5H-benzo[ij]quinolizine-9-carboxaldehyde (Scheme 1A). The hyperoxide reagent m-CPBA was used to oxidize the tertiary amine of MDJ to the N-oxide structure on MDJ-O (Scheme 1B). According to the literature, MDJ-O is the first NIR fluorescent probe toward Fe2+ based on the structure of julolidine. The structures of MDJ and MDJ-O were characterized by 1H NMR, 13C NMR, and ESI-MS (Fig. S4–S10, ESI†). The structure of MDJ (C25H27N3) was further confirmed by X-ray single-crystal analysis (Fig. S7, ESI†). All the important crystallographic data (CCDC 2339716†) and refinement parameters are given in Tables S1–S3 (ESI†). MDJ was a monoclinic crystal system, and it could be known from Table S1 and Fig. S7 (ESI†). In fact, the single bond in the MDJ structure could rotate to produce two isomers, MDJ and MDJ′ (Fig. S7, ESI†). According to the X-ray crystal structure of MDJ, it should exist in the MDJ structure rather than the MDJ′ structure.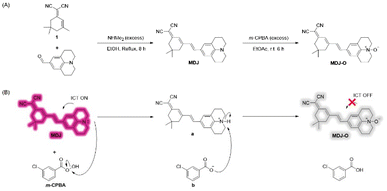 | ||
| Scheme 1 (A) Synthetic route of probe MDJ-O. (B) Proposed synthesis mechanism of probe MDJ-O using m-CPBA. | ||
Spectral response of probe MDJ-O towards Fe2+
To understand the fluorescence response of MDJ-O toward Fe2+ in different solvents, Fe2+ was added to different solvents containing MDJ-O. As shown in figures (Fig. S12 and S13, ESI†), the fluorescence intensities of MDJ-O towards Fe2+ in organic solution were generally higher than that in aqueous solution. This may be due to the fact that MDJ-O was more soluble in the organic phase. It was worth noting that the fluorescence intensity of the solution was obviously increased after adding CTAB to the PBS buffer solution. CTAB as a cationic surfactant is composed of a hydrophilic quaternary ammonium salt and a hydrophobic non-polar hydrocarbon chain. CTAB could form stable micelles by self-assembly in water.44–46 The enhanced fluorescence intensity of an aqueous solution containing CTAB might contribute to the formation of micelles. CTAB encapsulated MDJ-O into hydrophobic cavities to form micelles (Scheme 2), which increased the solubility of MDJ-O in aqueous systems and promoted its response to Fe2+ in an aqueous environment (Fig. S14, ESI†). As shown in Fig. S15 (ESI†), the fluorescence intensities increased with the increase in CTAB concentration, indicating that the fluorescence intensity was concentration-dependent on CTAB. A hypothesis had been proposed that the increase of CTAB concentration expanded the size of the hydrophobic cavity, weakened the collision between fluorescent particles, reduced the non-radiative transition of molecules, increased the fluorescence efficiency, and thus increased the fluorescence intensity. In addition, as the concentration of CTAB increased, more probe molecules could be encapsulated in the micelles. This process promoted the solubility of the probes in aqueous solution, resulting in a high reaction probability of MDJ-O towards Fe2+ and fluorescence enhancement. To understand the properties of the micelles, the particle size of the micelles in PBS buffer was measured using the dynamic light scattering (DLS) method. DLS test results showed that the particle size of the MDJ-O was about 200 nm, and the particle size was expanded to about 900 nm after adding Fe2+ to the MDJ-O solution (Fig. S16, ESI†). This may be due to the reaction of MDJ-O with Fe2+ to yield MDJ. The molecule MDJ is more hydrophobic than MDJ-O, and it could be easily wrapped in the hydrophobic cavity. As the number of molecules entering the hydrophobic cavity increased, the micelle size also increased.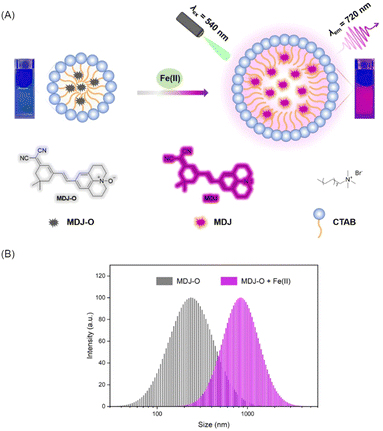 | ||
| Scheme 2 (A) Response mechanism of MDJ-O towards labile Fe2+ in PBS buffer solution. (B) The size distribution of MDJ-O (10 μM) dispersed in PBS buffer solution with or without adding Fe2+ (100 μM). | ||
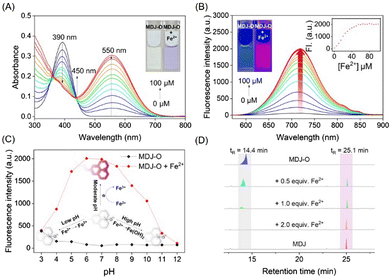
As shown in the UV-vis absorption spectrum (Fig. 1A), the maximum absorption peak of MDJ-O (10 μM) at 390 nm in PBS buffer solution. After the addition of Fe2+ (100 μM), the maximum absorption peak was redshifted to 550 nm, and the color of the solution changed from light yellow to purple. In addition, the fluorescence excitation and emission spectra of MDJ and MDJ-O + Fe2+ were recorded (Fig. S17, ESI†). The excitation wavelengths of MDJ and MDJ-O + Fe2+ were similar, and the emission wavelengths were the same, indicating that MDJ-O reacted with Fe2+ to generate MDJ. Upon excitation at 540 nm, MDJ-O did not emit fluorescence. After treatment with Fe2+ (100 μM), the fluorescence intensity significantly increased at 720 nm (Fig. S18, ESI†). The above results indicated that Fe2+ mediated the deoxidation of MDJ-O, releasing the fluorophore MDJ and exhibiting an “OFF–ON” fluorescence response, and proved that MDJ-O could effectively detect Fe2+.
To further study the stability of MDJ-O and MDJ-O towards Fe2+, the fluorescence intensities of both systems were monitored in real-time for 2 h. The dynamic analysis results indicated that the probe MDJ-O solution had a low and stable fluorescence intensity at 720 nm. When Fe2+ (100 μM) was added to the MDJ-O solution, the fluorescence intensity of the solution increased rapidly. It reached a plateau in 5 min, completing the recognition of Fe2+ and enhancing the fluorescence intensity 49-fold (Fig. S19, ESI†). MDJ-O had a rapid response to Fe2+, which was faster than most of the reported N-oxide-based probes. This feature illustrated that MDJ-O had obvious advantages in the detection of Fe2+.
To investigate the response-ability of probe MDJ-O to Fe2+, UV-vis titration and fluorescence titration experiments were carried out. As shown in Fig. 1A, new absorption peaks at 550 nm increased significantly after the continuous addition of Fe2+ (0–100 μM) to PBS buffer solution containing probe MDJ-O (10 μM). The absorption peaks at 390 nm gradually decreased upon increasing the concentration of Fe2+ ions, and a distinct isosbestic point appeared at 430 nm. This indicated that MDJ-O reacted with Fe2+ to form the new substance MDJ. The new absorption peak of MDJ-O + Fe2+ at 550 nm was consistent with the absorption wavelength of MDJ, which further indicated that MDJ-O reacted with Fe2+ to form MDJ. As shown in Fig. 1B, with the increase of Fe2+ concentration (0–100 μM), the fluorescence intensity at 720 nm gradually increased. The observed color of the solution changed from light yellow to bright purple by irradiation with an ultraviolet lamp (λex = 365 nm). The fluorescence intensity of probe MDJ-O (10 μM) at 720 nm displayed a good linear relationship with the concentration of Fe2+ (0–35 μM) (Fig. S20, ESI†). The limit of detection (LOD) of MDJ-O for Fe2+ was calculated to be 3.06 μM. From the above results, it could be concluded that probe MDJ-O had high sensitivity to Fe2+ and could meet the detection requirements for Fe2+ in biological systems and environmental samples.
pH response of MDJ-O towards Fe2+
To investigate the applicability of probe MDJ-Oin vivo, a pH-dependent assay of the probe was performed. The fluorescence emission intensities of MDJ-O and MDJ-O towards Fe2+ were performed in PBS buffer solution. As shown in Fig. 1C, the fluorescence of MDJ-O at 720 nm did not change obviously with the change of pH value, indicating that probe MDJ-O had good stability and was unaffected by the change of pH (3–12). After adding Fe2+ (100 μM) to probe MDJ-O (10 μM), the probe showed a significant fluorescence enhancement response in the pH range 4–9 (Fig. 1C). Under the conditions of strong acid and strong base, the fluorescence enhancement amplitude was small, and even tended to the fluorescence intensity of MDJ-O. This may be because Fe2+ was relatively stable and not easily converted to Fe3+ under strongly acidic conditions, which leads to the Fe2+ being unable to provide electrons and hard to react with MDJ-O to release MDJ. In the presence of a strong base, Fe2+ was more likely to react with OH− to form an Fe(OH)2 precipitate, which reduced the reaction chance of MDJ-O with Fe2+, making redox reactions hard to occur, resulting in a poor fluorescence response. In summary, MDJ-O revealed a significant fluorescence response towards Fe2+ within the physiological pH range, which was suitable for the detection of Fe2+ in complex physiological environments.Selective testing of MDJ-O for Fe2+
To explore the specific detection ability of probe MDJ-O towards Fe2+, different cations, anions, amino acids, and bioactive analytes were used to evaluate the selectivity of probe MDJ-O. After adding the analytes, only the absorption peaks of MDJ-O can be observed in the UV-vis absorption spectra. After Fe2+ was added to the solution containing MDJ-O, a new absorption peak appeared at 550 nm (Fig. 2A). In the bright field, the color of the sample solution changed from light yellow to purple, which could be easily identified by the naked eye, indicating that the probe molecule can directly detect Fe2+ by the colorimetric method. According to the fluorescence spectra, no obvious fluorescence response at 720 nm was observed after mixing the probe with other analytes. In striking contrast, a significant fluorescence enhancement was detected with the solution containing MDJ-O (10 μM) and Fe2+ (100 μM) (Fig. S21, ESI†). As shown in the inset of Fig. 2B, only the probe solution towards Fe2+ emitted strong fluorescence under the excitation light of 540 nm. The experimental results showed that the probe had brilliant selectivity and could only detect Fe2+, but not other analytes.To further demonstrate the high specificity of probe MDJ-O towards Fe2+, competitive experiments were conducted to investigate the anti-interference ability of MDJ-O in PBS buffer solution. The addition of 100 μM interfering analytes to the solution containing the probe alone did not induce an obvious fluorescence change. After adding Fe2+ (100 μM) to the aforementioned solutions, the fluorescence intensities increased significantly (Fig. S22, ESI†). Among them, the fluorescence enhancement effect was disturbed by Cu2+, which may be attributed to the paramagnetism of Cu2+. To sum up, the detection of Fe2+ by probe MDJ-O was free from the interference of most analytes, showing high selectivity and strong anti-interference ability in aqueous solution.
Response mechanism of MDJ-O to Fe2+
The response mechanism of MDJ-O to Fe2+ was preliminarily explained by the experiments of UV-vis titration and fluorescence titration. To further verify the response mechanism of MDJ-O towards Fe2+, ESI-MS and HPLC were used to further explore the response mechanism. After mixing MDJ-O with Fe2+ in the methanol solution, the peak of MDJ-O at 386.22 m/z and the peak of the deoxidation product MDJ at 370.19 m/z were detected in the mass spectrum (Fig. S11, ESI†). This result indicated that in the presence of Fe2+, MDJ-O was deoxidized to form the parent fluorophore MDJ. As shown in the HPLC results (Fig. 1D), the retention time of MDJ-O was 14.4 min and that of MDJ was 25.1 min. After the reaction of MDJ-O with 0.5, 1, 2, and 5 equivalents of Fe2+, the peak intensities at 14.4 min gradually decreased with the increase of the Fe2+ content, and the peak intensities at 25.1 min gradually increased. When 2 equivalents of Fe2+ were added to the solution containing MDJ, only the peak of MDJ was visible. These results further elucidated that the MDJ-O could be converted to MDJ by reacting with Fe2+.To further confirm the theoretical mechanism of the MDJ-O response to Fe2+, DFT calculations were performed using the Gaussian 16 program.47,48 Geometry optimization was completed at the B3LYP-D3BJ/TZVP level, in combination with the SMD implicit solvation model to take account of the solvation effect of DMSO. Fig. 3 shows the electrostatic potential mapped molecular surfaces of MDJ-O/MDJ. The lowest occupied molecular orbital (LUMO) of MDJ-O is mainly distributed on the dinitrilyl isophorone moiety, and the highest occupied molecular orbital (HOMO) is distributed on the N–O site of the julolidine moiety. It is clearly shown that the distribution of the HOMO and LUMO on MDJ-O exhibits significant spatial separation, leading to a potential PET quenching pathway of its fluorescence. After MDJ-O reacted with Fe2+, MDJ was released and the HOMO was transferred to the whole skeleton of the fluorophore. The PET process was inhibited, resulting in enhanced fluorescence. The ΔE values of MDJ-O and MDJ were 2.73 eV and 2.33 eV, respectively. The energy gap of MDJ is smaller than that of MDJ-O, which is consistent with the redshift phenomenon of the emission and absorption wavelengths of MDJ compared with that of MDJ-O.
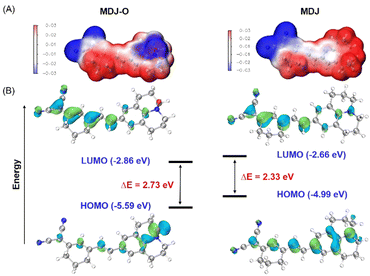 | ||
| Fig. 3 (A) The molecular surface electrostatic potentials of MDJ-O and MDJ were depicted using the VMD program. (B) Frontier orbitals and orbital energies of the structures of MDJ-O and MDJ. | ||
Imaging of Fe2+ in living cells
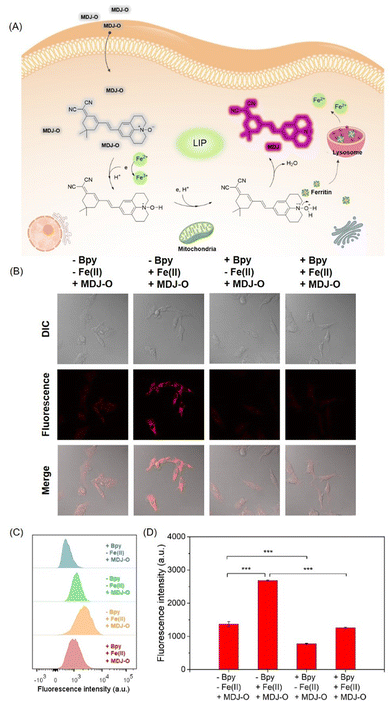
Based on the excellent optical properties of MDJ-O in aqueous solution, the potential application of MDJ-O for the detection of Fe2+ in living cells was explored. The cytotoxicity of the probe in HepG2 cells was first evaluated by the MTT assay prior to the cell imaging experiments. As shown in Fig. S23 (ESI†), more than 90% of survival rates were found after the HepG2 cells were treated with MDJ-O (10–30 μM) for 24 h. This result suggested that MDJ-O exhibited low cytotoxicity to HepG2 cells and could be further applied to monitor Fe2+ in living HepG2 cells. Subsequently, the detection of Fe2+ with MDJ-O in living cells was performed by laser confocal microscopy. As shown in Fig. 4B, only a weak fluorescence signal was observed after the cells were treated with MDJ-O (10 μM) for 30 min. In the MDJ-O + Fe2+ group, significant fluorescence could be monitored after the cells were loaded with MDJ-O (10 μM) and Fe2+ (100 μM) in sequence. The result apparently showed that MDJ-O can utilize fluorescence imaging to demonstrate exogenous Fe2+ levels of cells. To further verify that the fluorescence enhancement was mediated by Fe2+, the Fe2+ chelating agent 2,2′-bipyridine (Bpy) was used to chelate Fe2+ in cells. After the cells were treated with Bpy (1 mM), the cells containing only MDJ-O showed weak fluorescence. When the cells containing MDJ-O and Fe2+ were pretreated with Bpy (1 mM), the fluorescence intensity in cells was significantly decreased (Fig. S24, ESI†). These experimental studies further confirmed that MDJ-O could detect both endogenous and exogenous Fe2+ in living cells by turn-on fluorescence. To study the stability of MDJ-O in living cells, photostability experiments were carried out. Red fluorescence was released after the recognition of Fe2+ by MDJ-O, and the fluorescence signal did not fade significantly within 1 h. The results showed that MDJ-O had good stability and strong anti-quenching ability in living cells (Fig. S25, ESI†). In addition, the subcellular localization of the obtained fluorescence was investigated. The fluorescence generated by MDJ-O upon treatment with Fe2+ had poor overlap with mitochondrial dyes (Fig. S26, ESI†), and the Pearson correlation coefficient was 0.55. To our delight, there was good overlap between the fluorescence generated by “MDJ-O + Fe2+” and LysoTracker (Fig. S27, ESI†), the Pearson correlation coefficient was 0.87. This phenomenon indicated that a higher level of Fe2+ exists in lysosomes and probe MDJ-O can effectively monitor it.Detection of intracellular Fe2+ by flow cytometry
In order to quantitatively analyze the intracellular fluorescence intensity, flow cytometry analysis experiments were conducted. As shown in Fig. 4C, the flow cytometry results of the four groups of cells are represented by a green peak surface, orange peak surface, blue peak surface, and red peak surface, respectively. Among them, the intracellular fluorescence signal of the MDJ-O + Fe2+ group was higher than that of the other groups. After being treated with Bpy (1 mM, 1 h), the fluorescence signal of the MDJ-O + Fe2+ group shifted from the high signal region to the low signal region, indicating that Bpy could chelate exogenous Fe2+. These results also reflect that probe MDJ-O can detect exogenous Fe2+ ions in cells. The fluorescence signal in the Bpy + MDJ-O group was lower than that in the MDJ-O group, indicating that probe MDJ-O could monitor endogenous Fe2+. The above results demonstrated that MDJ-O can detect endogenous and exogenous Fe2+ ions in cells by brilliant sensitivity (Fig. 4C and D).In vivo and tissue imaging
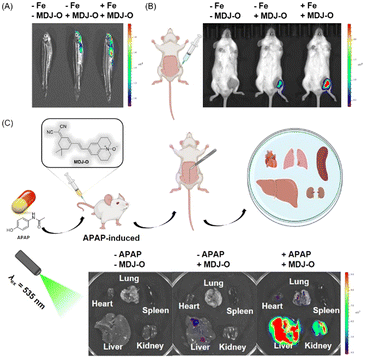
Based on the excellent imaging performance of probe MDJ-O in HepG2 cells, the potential ability of probe MDJ-O to image Fe2+in vivo was further explored. Adult zebrafish was selected as one of the animal models in this study, this is mainly due to the high proportion of homologous genes between zebrafish and humans.49,50 As illustrated in Fig. 5A, there was no fluorescence in the control group, while weak fluorescence could be observed when zebrafish were cultured with MDJ-O (10 μM) alone. This phenomenon indicated that MDJ-O processes the turn-on fluorescence response to endogenous Fe2+ in zebrafish. After the zebrafish were cultured with Fe2+ (100 μM) for 30 min and then treated with MDJ-O (10 μM) for another 30 min, strong fluorescence in the gill and abdomen of zebrafish could be observed. Moreover, with an increase of the Fe2+ concentration (0, 10, 20, and 50 μM), the fluorescence intensities in zebrafish gradually increased, exhibiting a concentration-dependent relationship (Fig. S28, ESI†). The above results illustrated that MDJ-O could easily enter the zebrafish and detect Fe2+ in the living zebrafish.As shown in Fig. 5B, the mice had no fluorescence background interference. When MDJ-O (100 μM, 100 μL) was injected into the right leg muscle of a living mouse, a certain fluorescence signal was observed just for 5 min in the right leg of the mice under 535 nm light irradiation. This phenomenon suggested that MDJ-O could detect endogenous Fe2+ in living mice. After in situ intramuscular injection of MDJ-O (100 μM, 100 μL) followed by FeSO4 (1 mM, 100 μL) to the right leg of mice, the fluorescence signal was significantly enhanced. This phenomenon revealed that probe MDJ-O could recognize exogenous Fe2+ in mice. In conclusion, MDJ-O could realize the visualization of Fe2+ in mice and could be used as a valuable NIR fluorescent probe for rapid imaging of endogenous and exogenous Fe2+in vivo.
Imaging of Fe2+ in APAP-induced liver and kidney injury
Drug-induced liver and kidney injury are the main reason for acute liver and kidney injury, which seriously threaten human health and has attracted extensive attention from many researchers and clinicians. The damage process is often associated with the increased Fe2+ level in the internal liver and kidneys. Therefore, monitoring of Fe2+ in the liver and kidney tissues is of great significance. Here, a liver and kidney injured mouse model was introduced by tail vein injection of APAP (300 mg kg−1, 300 μL) to the mouse. As displayed in Fig. 5C, the fluorescence intensities of the liver and kidney treated with APAP were significantly enhanced, while the fluorescence of other organs was weak. After sequential injection of Bpy, APAP, and MDJ-Ovia the tail vein, the fluorescence intensities of the liver and kidney were decreased (Fig. S29, ESI†). This phenomenon illustrated that the enhancement of the fluorescence intensity was closely related to the increase of the Fe2+ level. As displayed in Fig. S30 (ESI†), only the liver treated with MDJ-O had weak fluorescence, which might be due to the ethanol solvent that dissolved the probe and damaged the liver. To verify that APAP indeed induced liver and kidney injury in mice, tissue slice scanning experiments were performed (Fig. S30 and S31, ESI†). As shown in Fig. S30 (ESI†), the hematoxylin and eosin (HE) stained liver and kidney sections exhibited significant degeneration, while the liver and kidney sections of normal mice did not show obvious damage. The above results indicated that the liver and kidney were damaged after APAP treatment. According to the literature, there were no studies on the simultaneous monitoring of liver and kidney damage through fluorescence imaging of changes in Fe2+. The above data implied that probe MDJ-O had potential to visualize APAP-induced liver and kidney injury. The probe has the potential to become a useful tool for the diagnosis and evaluation of drug-induced liver and kidney injury.Conclusions
In conclusion, a novel NIR fluorescent probe MDJ-O was designed and synthesized. An N-oxide structure as the reaction site for Fe2+ was introduced to MDJ-O. This probe can monitor Fe2+ in nearly 100% aqueous systems. When the probe was deoxidized by Fe2+, NIR fluorescence (λem = 720 nm) was turned on, and the color of the solution changed from colorless to purple, enabling both colorimetric and fluorescence detection of Fe2+ by MDJ-O. The response mechanism of MDJ-O towards Fe2+ has been confirmed using absorption spectroscopy, emission spectroscopy, ESI-MS analysis, HPLC study, and DFT calculations. The optical evaluation showed that the detection limit of MDJ-O for Fe2+ is as low as 3.09 × 10⁻⁶ M. In addition, MDJ-O has excellent selectivity and a rapid response for Fe2+. This probe can realize the detection of Fe2+ in a wide pH range (4–11). Hypotoxic MDJ-O has strong penetrability and a high signal-to-noise ratio in cells and in vivo. The NIR probe MDJ-O has been successfully applied to the fluorescence imaging of Fe2+ in living cells, zebrafish, and mice. Notably, MDJ-O was utilized to visualize Fe2+ in an APAP-induced liver and kidney injury model. This is of great significance for further understanding the mechanism of drug-induced liver and kidney injury. These results indicated that MDJ-O has great potential in detecting Fe2+.Author contributions
Hanyue Xiang: synthesis and characterization of compounds, data curation, formal analysis, validation, and writing – original draft. Yanjie Song: investigation, data curation, and formal analysis. Yilin Wang: investigation, data curation, and formal analysis. Wenzhuo Fu: investigation and resources. Nao Xiao: supervision, project administration, fund acquisition, concept formation, and writing – review and editing.Conflicts of interest
There are no conflicts to declare.Acknowledgements
This work was supported by the Scientific Research Cultivating Fund of Capital Medical University, China (PYZ21023) and the Open Fund of the Key Laboratory of Analytical Chemistry for Living Biosystems, Chinese Academy of Sciences, China (ACL202201).Notes and references
- J. C. Yang, Q. M. Li, Y. Feng and Y. H. Zeng, Int. J. Mol. Sci., 2023, 24, 6891 CrossRef CAS PubMed.
- A. D. Read, R. E. T. Bentley, S. L. Archer and K. J. Dunham-Snary, Redox Biol., 2021, 47, 102164 CrossRef CAS PubMed.
- P. T. Morraja, G. Rique-Pujol, C. Muller-Sanchez, M. Reina, O. M. Martinez-Estrada and F. X. Soriano, Int. J. Mol. Sci., 2023, 24, 922 CrossRef PubMed.
- X. Chen, C. H. Yu, R. Kang, G. Kroemer and D. L. Tang, Cell Death Differ., 2021, 28, 1135–1148 CrossRef CAS PubMed.
- D. G. Liang, A. M. Minikes and X. J. Jiang, Mol. Cell, 2022, 82, 2215–2227 CrossRef CAS PubMed.
- X. J. Jiang, B. R. Stockwell and M. Conrad, Nat. Rev. Mol. Cell Biol., 2021, 22, 266–282 CrossRef PubMed.
- Z. Zhao, Free Radical Biol. Med., 2023, 208, 510–515 CrossRef CAS PubMed.
- R. Hider, M. V. Aviles, Y. L. Chen and G. O. Latunde-Dada, Int. J. Mol. Sci., 2021, 22, 1278 CrossRef CAS PubMed.
- Y. Song, M. Ismail, Q. Shan, J. Zhao, Y. Zhu, L. Zhang, Y. Du and L. Ling, Nanoscale, 2021, 13, 20170–20185 RSC.
- Q. Q. Xu, X. L. Cheng, B. Y. Zhang, F. Zhang, X. Wang, S. S. Li and Y. X. Zhang, Anal. Chim. Acta, 2022, 1232, 340472 CrossRef CAS PubMed.
- Q. W. Pan, F. Lin, R. Q. Liu, Y. L. Li, X. Y. Zhang, R. Luo, L. L. Cai, Y. Liu, W. G. Deng and L. R. He, Chem. Eng. J., 2023, 466, 142962 CrossRef CAS.
- H. Shi, L. Jin, J. Li, K. Liang, X. Li, Z. Ye, X. Zhu, J. M. Oliveira, R. L. Reis, Z. Mao and M. Wu, J. Mater. Chem. B, 2022, 10, 6351–6359 RSC.
- M. Baruah, A. Jana, M. Ali, K. Mapa and A. Samanta, J. Mater. Chem. B, 2022, 10, 2230–2237 RSC.
- T. Wang, J. Zhang, H. Zhang, W. Bai, J. Dong, Z. Yang, P. Yang, Z. Gu, Y. Li, X. Chen and Y. Xu, J. Mater. Chem. B, 2022, 10, 7875–7883 RSC.
- S. D. Wang, Z. J. Liu, J. F. Geng, L. G. Li and X. J. Feng, Biomed. Pharmacother., 2022, 153, 113374 CrossRef CAS PubMed.
- X. Chen, R. Kang, G. Kroemer and D. L. Tang, Nat. Rev. Clin. Oncol., 2021, 18, 280–296 CrossRef CAS PubMed.
- L. Zhao, X. X. Zhou, F. Xie, L. Zhang, H. Y. Yan, J. Huang, C. Zhang, F. F. Zhou, J. Chen and L. Zhang, Cancer Commun., 2022, 42, 88–116 CrossRef PubMed.
- X. Chen, R. Kang, G. Kroemer and D. L. Tang, J. Exp. Med., 2021, 218, e20210518 CrossRef CAS PubMed.
- L. X. Li, F. F. Guo, H. Liu and T. Zeng, Cell. Mol. Life Sci., 2022, 79, 201 CrossRef CAS PubMed.
- J. Y. Chen, X. P. Li, C. D. Ge, J. X. Min and F. D. Wang, Cell Death Differ., 2022, 29, 467–480 CrossRef CAS PubMed.
- Y. Qin, T. Guo, Z. Wang and Y. Zhao, J. Mater. Chem. B, 2021, 9, 4793–4803 RSC.
- C. Bunchorntavakul and K. R. Reddy, Clin. Liver Dis., 2018, 22, 325–346 CrossRef PubMed.
- C. Liu, X. Li, M. Gao, Y. Dong and Z. Chen, JHEP Rep., 2023, 5, 100766 CrossRef PubMed.
- J. Y. Akakpo, A. Ramachandran, H. Orhan, S. C. Curry, B. H. Rumack and H. Jaeschke, Toxicol. Appl. Pharmacol., 2020, 409, 115317 CrossRef CAS PubMed.
- X. Zeng, J. Chen, S. Yu, Z. Liu and M. Ma, J. Lumin., 2022, 25, 119069 CrossRef.
- L. Wu, J. Liu, X. Tian, R. R. Groleau, S. D. Bull, P. Li, B. Tang and T. D. James, Chem. Sci., 2021, 12, 3921–3928 RSC.
- S. Feng, J. Zheng, J. Zhang, Z. Gui and G. Feng, Sens. Actuators, B, 2022, 371, 132512 CrossRef CAS.
- L. Wu, Q. Ding, X. Wang, P. Li, N. Fan, Y. Zhou, L. Tong, W. Zhang, W. Zhang and B. Tang, Anal. Chem., 2020, 92, 1245–1251 CrossRef CAS PubMed.
- R. Troìa, M. Gruarin, C. Grisetti, F. Serafini, L. Magna, E. Monari, M. Giunti and F. Dondi, J. Vet. Intern. Med., 2018, 32, 1372–1382 CrossRef PubMed.
- F. Y. Liu, X. Y. Zhu, Y. Wang, Q. Y. Yi, C. X. Pu, Y. Luo, J. Y. Wang and M. Wang, Sens. Actuators, B, 2023, 374, 132840 CrossRef CAS.
- J. J. Yang, M. T. Fan, Y. Sun, M. Y. Zhang, Y. T. Xue, D. Z. Zhang, T. Wang and X. Y. Cui, Sens. Actuators, B, 2020, 307, 127652 CrossRef.
- Y. Y. Liu, S. Naha, N. Thirumalaivasan, S. Velmathi and S. P. Wu, Sens. Actuators, B, 2018, 277, 673–678 CrossRef CAS.
- Y. Hu, L. M. Lu, S. M. Guo, X. L. Wu, J. Y. Zhang, C. S. Zhou, H. Y. Fu and Y. B. She, Sens. Actuators, B, 2023, 382, 133534 CrossRef CAS.
- Q. Chen, X. F. Zhang, T. Wang, X. Q. Cao and S. L. Shen, Anal. Chim. Acta, 2022, 1231, 340443 CrossRef CAS PubMed.
- X. Z. Wei, T. Zhu, Y. S. Ma, J. Y. Sun, G. X. Zheng, T. B. Ma, X. F. Yang, Z. L. Song, Y. F. Lv and J. Zhang, Sens. Actuators, B, 2023, 380, 133392 CrossRef CAS.
- Q. Lin, C. S. Li, L. J. Wang, H. M. Cai, L. P. Tang and Y. Q. Gu, Sens. Actuators, B, 2022, 371, 32521 Search PubMed.
- L. N. Guo, X. C. Chen, R. J. Xie, L. M. Han and N. Zhu, J. Mol. Struct., 2023, 1275, 134615 CrossRef CAS.
- M. Das, V. K. Madduluri, V. Jaswal and M. Sarkar, J. Photochem. Photobiol., A, 2022, 429, 113896 CrossRef CAS.
- R. Kakiuchi, T. Hirayama, D. Yanagisawa, I. Tooyama and H. Nagasawa, Org. Biomol. Chem., 2020, 18, 5843–5849 RSC.
- C. H. Cai, H. L. Wang and R. J. Man, Spectrochim. Acta, Part A, 2021, 255, 119729 CrossRef CAS PubMed.
- T. Hirayama, K. Okuda and H. Nagasawa, Chem. Sci., 2013, 4, 1250 RSC.
- R. Roy, A. Khan, T. Dutta and A. L. Koner, J. Mater. Chem. B, 2022, 10, 5352–5363 RSC.
- L. Kong, W. Lu, X. Cao, Y. Wei, J. Sun and Y. Wang, J. Mater. Chem. B, 2022, 10, 7924–7954 RSC.
- C. Shao, Y. Liu, Z. Chen, H. Zhu, J. Zhao and Y. Qian, Cell Chem. Biol., 2022, 29, 43–56 CrossRef CAS PubMed.
- T. Qian, X. Zhao, T. Jia, S. Si, Z. Xu, B. Liu, H. Xu and C. Zhao, Spectrochim. Acta, Part A, 2022, 280, 121517 CrossRef PubMed.
- H. Zhou, J. Tang, L. Sun, J. Zhang, B. Chen, J. Kan, W. Zhang, J. Zhang and J. Zhou, Sens. Actuators, B, 2019, 278, 64–72 CrossRef CAS.
- A. V. Marenich, C. J. Cramer and D. G. Truhlar, J. Phys. Chem. B, 2009, 113, 6378–6396 CrossRef CAS PubMed.
- S. Grimme, J. Antony, S. Ehrlich and H. Krieg, J. Chem. Phys., 2010, 132, 154104 CrossRef PubMed.
- M. P. Almeida, J. M. Welker, S. Siddiqui, J. Luiken, S. C. Ekker, S. C. Ekker, K. J. Clark, J. J. Essner and M. McGrail, Nature, 2021, 11, 1732 CAS.
- S. Feng, J. Zheng, J. Zhang, Z. Gui and G. Feng, Sens. Actuators, B, 2022, 371, 132512 CrossRef CAS.
Footnote |
| † Electronic supplementary information (ESI) available. CCDC 2339716. For ESI and crystallographic data in CIF or other electronic format see DOI: https://doi.org/10.1039/d4ma00361f |
| This journal is © The Royal Society of Chemistry 2024 |

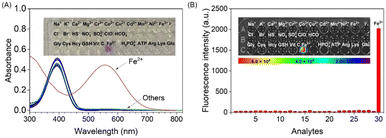
![[thin space (1/6-em)]](https://www.rsc.org/images/entities/char_2009.gif) μM) towards various analytes (100 μM). Inset: The photograph of free MDJ-O and MDJ-O upon adding various analytes under 561 nm light irradiation.
μM) towards various analytes (100 μM). Inset: The photograph of free MDJ-O and MDJ-O upon adding various analytes under 561 nm light irradiation.