 Open Access Article
Creative Commons Attribution 3.0 Unported Licence
Low-energy and solventless manufacturing of epoxy/expanded graphite bipolar plates
Jordy
Santana-Villamar
 a,
Miguel
Carrasco-Cordero
a,
Jose
Suarez-Loor
a,
Mayken
Espinoza-Andaluz
*ab and
Andres F.
Rigail-Cedeño
a,
Miguel
Carrasco-Cordero
a,
Jose
Suarez-Loor
a,
Mayken
Espinoza-Andaluz
*ab and
Andres F.
Rigail-Cedeño
 *acd
*acd
aFacultad de Ingeniería en Mecánica y Ciencias de la Producción, Escuela Superior Politécnica del Litoral, ESPOL, Campus Gustavo Galindo Km. 30.5 Vía Perimetral, Guayaquil 090902, Ecuador. E-mail: masespin@espol.edu.ec; arigail@espol.edu.ec
bCentro de Energías Renovables y Alternativas, Escuela Superior Politécnica del Litoral, ESPOL, Campus Gustavo Galindo Km. 30.5 Vía Perimetral, Guayaquil 090902, Ecuador
cLaboratorio de Procesamiento de Plásticos, Escuela Superior Politécnica del Litoral, ESPOL, Campus Gustavo Galindo Km. 30.5 Vía Perimetral, Guayaquil 090902, Ecuador
dCentro de Investigación y Desarrrollo en Nanotecnología, Escuela Superior Politécnica del Litoral, ESPOL, Campus Gustavo Galindo, Km. 30.5 Vía Perimetral, Guayaquil, 090902, Ecuador
First published on 14th August 2024
Abstract
Bipolar plates (BPs) based on a polymer matrix and carbon materials have lately been considered potential alternatives in fabricating polymer electrolyte fuel cell (PEFC) components. For widespread market adoption, utilizing minimal energy in the synthesis process and abstaining from harmful solvents is crucial. This study proposes an efficient, solventless method to address these limitations, emphasizing low-viscosity epoxy resin and high-expansion ratio graphite as critical parameters to fabricate highly conductive composites suitable for bipolar plate applications. To achieve this, high-quality expanded graphite (EG) was prepared using microwave heating, oxygen removal, and sieving for particle size control. The EG was then mixed with a commercial DGEBA-based resin in proportions of 40, 50, and 60 wt%, hot-molded at 110 °C with 4500 psi for 10 min, followed by post-curing at 130 °C, for an additional 10 minutes. The resulting composites were characterized using X-ray diffraction (XRD), scanning electron microscopy (SEM), flexural strength testing, and in-plane electrical conductivity measurements. The properties obtained were compared with the requirements set by the U.S. Department of Energy (DOE). XRD and SEM revealed an amorphous, highly porous EG filler with limited dispersion, particularly at high EG concentrations, 60 wt%. Despite this, a remarkable electrical conductivity of 177.99 S cm−1 was achieved at 60 wt% EG, without using any solvent or secondary filler, and most of the composites surpassed DOE's flexural strength requirement, 25 MPa. This methodology demonstrates a solventless approach for producing high-performance BPs composites that meet or exceed DOE's electrical and mechanical property requirements for PEFC applications.
1. Introduction
Population growth and technological development have led to a rapidly growing energy demand, which mainly depends on fossil fuels. However, this energy source is limited and has severe environmental impacts (EI). To further reduce or eliminate EI, total reliance on renewable energy sources requires the development of efficient energy conversion and storage devices.1 Utilizing hydrogen as an energy carrier for sustainable energy is seen as one of the most promising alternatives for energy storage. This energy carrier can be used in polymer electrolyte fuel cells (PEFCs) to generate clean electricity through electrochemical reactions. PEFC technology is continuously developing, especially for stationary and transport applications.2,3 Nevertheless, some barriers must be overcome before PEFCs can be widely adopted in markets.4Bipolar plates (BPs) are essential components of PEFC that conduct electrical current and provide mechanical support to the cell. Therefore, BPs must meet specific manufacturing requirements established by the U.S. Department of Energy (DOE) to work efficiently. The most critical requirements for bipolar plate manufacturing are electrical conductivity greater than 100 S cm−1 and flexural strength above 25 MPa.5 Graphite is the usual material used to fabricate bipolar plates to meet these requirements since it provides excellent conductivity partially. However, it presents a high level of brittleness, resulting in oversized, heavy, and breakable bipolar plates. Consequently, metals and composite materials are alternatives to regular graphite bipolar plates.6 Composite materials are preferred owing to the corrosion drawbacks and high-priced coating of metallic plates.
Thermosetting and thermoplastic composites incorporating carbon-based fillers are investigated for developing enhanced bipolar plates. Thermosetting, like epoxy resins, provides advantages such as low material cost, robust mechanical strength, corrosion resistance, and good manufacturability compared to thermoplastic.7 Nevertheless, achieving high electrical conductivity remains a significant challenge for these composites. To overcome this challenge, various carbon-based secondary fillers, such as carbon black (CB),8,9 multi-walled carbon nanotubes (MWNTs),10,11 carbon fiber (CF),12,13 and graphene14,15 have been employed. Secondary filler utilization has led to notable improvements in mechanical and electrical properties, providing strong support for its use.16 However, the extent of enhancement depends on the optimization of the synthesis process of the epoxy/resin matrix, ensuring minimal energy consumption during synthesis and abstaining from using harmful solvents in the filler dispersion. It includes comprehensively knowing the effect of crucial processing conditions and materials settings, focusing on the DOE requirements for the bipolar plates production.
Good mixing and dispersion of fillers are principal considerations in synthesizing composite materials.17 Furthermore, the resin type is crucial in achieving a uniform mixture. Depending on its viscosity level, it facilitates seamless blending between the polymeric matrix and carbon fillers, resulting in samples with high mechanical stability.18,19 On the other hand, the degree of expansion of carbon fillers and particle size also strongly influence the conductive paths in the composite matrix. Better distribution and occupation of the matrix spaces led to more efficient electrically conductive pathways, thereby achieving higher electrical conductivities.20–22 Our previous study23 demonstrated favorable results in terms of electrical conductivity using an epoxy resin commercially named Epon 828, with a viscosity of 110–150 P at 25 °C. However, it presented some challenges in achieving outstanding electrical conductivity, likely due to the difficult mixing and dispersion of the high-viscosity resin with the carbon fillers. In the same study, a graphite-intercalated compound (GIC) grade 3538 with a low expansion ratio of 60![[thin space (1/6-em)]](https://www.rsc.org/images/entities/char_2009.gif) :
:![[thin space (1/6-em)]](https://www.rsc.org/images/entities/char_2009.gif) 1 was employed, which could have resulted in a deficit of conductive paths. Another research focused on enhancing epoxy resin composites with carbon materials derived from pyrolysis of waste tires, offering a sustainable approach to waste management. Specifically, nanocarbon black is obtained from waste tires via pyrolysis. The study revealed that adding 5 wt% carbon black significantly improved the mechanical properties, such as tensile strength and hardness, compared to pure resin.24 Another study investigated a new composite material made from chicken feathers, recycled crumb rubber (carbon residuum), and epoxy resin.25
1 was employed, which could have resulted in a deficit of conductive paths. Another research focused on enhancing epoxy resin composites with carbon materials derived from pyrolysis of waste tires, offering a sustainable approach to waste management. Specifically, nanocarbon black is obtained from waste tires via pyrolysis. The study revealed that adding 5 wt% carbon black significantly improved the mechanical properties, such as tensile strength and hardness, compared to pure resin.24 Another study investigated a new composite material made from chicken feathers, recycled crumb rubber (carbon residuum), and epoxy resin.25
While previous studies have explored various carbon materials and epoxy resins for bipolar plate composites,26,27 this work presents a novel approach by optimizing the primary matrix (epoxy-graphite) to improve electrical and mechanical properties significantly. This optimization reduces energy consumption during processing and eliminates harmful solvents. Our approach utilizes a low-viscosity resin and a high-expansion intercalated graphite compound to manufacture composites that exceed the Department of Energy (DOE) standards for conductivity and mechanical strength. This is achieved by comprehensively analyzing the resulting microstructure, bonding, thermal behavior, flexural strength, and electrical conductivity.
2. Materials and methods
2.1 Materials
A bisphenol A diglycidyl ether (DGEBA) epoxy resin, commercially identified as 635 thin epoxy resin, was used for the polymeric matrix. It was obtained from U.S. Composites Inc. (West Palm Beach, FL) with a low viscosity of 600 cP at 25 °C. The curing agent was a polyoxypropylene triamine named EPIKURE 3233, supplied by Hexion Inc. and it had an amine hydrogen equivalent weight (AHEW) of 81 g eq−1. The primary filler was a graphite intercalated compound (GIC) 1395 provided by Asbury Carbons (Asbury, NJ) with a high-expansion ratio of 230![[thin space (1/6-em)]](https://www.rsc.org/images/entities/char_2009.gif) :
:![[thin space (1/6-em)]](https://www.rsc.org/images/entities/char_2009.gif) 1 and a nominal particle size above 180 μm. Finally, GIC 3538 was provided by the same company and included in this study to compare the morphology after expansion. It had a particle size smaller than 75 μm with an expansion ratio of 60
1 and a nominal particle size above 180 μm. Finally, GIC 3538 was provided by the same company and included in this study to compare the morphology after expansion. It had a particle size smaller than 75 μm with an expansion ratio of 60![[thin space (1/6-em)]](https://www.rsc.org/images/entities/char_2009.gif) :
:![[thin space (1/6-em)]](https://www.rsc.org/images/entities/char_2009.gif) 1. For the present study, secondary fillers are not considered because the main objective of this work was the optimization of the epoxy/graphite primary matrix.
1. For the present study, secondary fillers are not considered because the main objective of this work was the optimization of the epoxy/graphite primary matrix.
2.2 Equipments used for sample preparation
The graphite intercalated compound (GIC) was expanded using a conventional microwave oven (750 W). A Flackteck DAC 400.1 FVZ speed mixer was used to blend the materials of the compound. The final mixture was cured in an aluminum mold using the hot-pressing method, employing a hydraulic press with a maximum pressure of 700 bars.2.3 Expanded graphite preparation
The expanded graphite preparation process can be divided into microwave expansion, sieving, and heat treatment. Initially, a 1 mm thick layer of GIC weighing approximately 2 g was placed in a Pyrex container and then introduced into a microwave oven at 750 W for 45 seconds. This method of distributing the GIC on the container improves radiation incidence on the samples and ensures the effective harvesting of expanded graphite. Next, the expanded graphite produced was sieved, and only particles above 212 μm were selected, as larger particle sizes improve electrical conductivities, as reported in the literature.17 Lastly, the sieved EG was subjected to heat treatment at 350 °C for 30 minutes in a resistance furnace to remove residual oxygen, which can diminish the degree of homogenization in the mixture with the resin, affecting the electrical properties of the composites.232.4 Epoxy matrix preparation
The polymer matrix was prepared by mixing the 635 epoxy resin with the curing agent EPIKURE 3233 in a ratio of 43![[thin space (1/6-em)]](https://www.rsc.org/images/entities/char_2009.gif) :
:![[thin space (1/6-em)]](https://www.rsc.org/images/entities/char_2009.gif) 100, i.e., with 43 parts of curing agent per 100 parts of epoxy resin. This ratio was chosen due to the similarity in the chemical composition between the 635 thin epoxy resin and the EPON 828.17 Then, the precursors were mixed at 1750 rpm in the speed mixer machine for 1 minute to ensure homogeneity in the matrix.
100, i.e., with 43 parts of curing agent per 100 parts of epoxy resin. This ratio was chosen due to the similarity in the chemical composition between the 635 thin epoxy resin and the EPON 828.17 Then, the precursors were mixed at 1750 rpm in the speed mixer machine for 1 minute to ensure homogeneity in the matrix.
2.5 Composite preparation
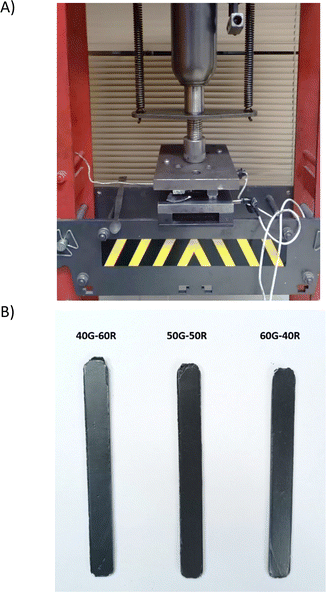
The expanded graphite (EG) was dispersed in the polymer matrix using the speed mixer at 1750 rpm in four intervals of 2 minutes each, with a 1-minute rest between steps. The epoxy/resin compositions used in the present study are summarized in Table 1. These configurations were established to determine the best proportion that maximizes electrical and mechanical properties. On the other hand, previous studies have indicated that the glass transition temperature of the current epoxy resin is approximately 100 °C.28 Furthermore, published research has demonstrated that a curing temperature of 110 °C for 10 minutes effectively promotes the formation of a well-established network between the epoxy resin and curing agent.17,23,29 Building on these findings, we selected a curing temperature of 110 °C for our study. A post-curing step at 130 °C was implemented for 10 minutes to ensure thorough curing and optimize material properties. Subsequently, the final mixture was poured into the mold cavity, and pressure accessories were covered with non-stick aluminum foil. An Anti-rust Mold Release Agent, OMYA MPP-12, was applied to this aluminum cover to facilitate sample removal after pressing. A pressure of 4500 psi was maintained during both the curing and post-curing stages. Finally, Fig. 1 depicts the real-time fabrication of the composites, while Fig. 2 provides a flow diagram summarizing the sample processing methodology.| Nomenclature | Expanded graphite (wt%) | Epoxy resin (wt%) |
|---|---|---|
| 40G-60R | 40 | 60 |
| 50G-50R | 50 | 50 |
| 60G-40R | 60 | 40 |
3. Characterization and measurements
3.1 Scanning electron microscopy (SEM)
Micrographs of the GICs microstructure and the composites’ fracture surface were obtained using a FEI Inspect S50 scanning electron microscope. The imaging was performed under low vacuum conditions with a pressure of 20 Pa, an acceleration voltage range of 10–12.5 kV, and a spot size range of 3.5–4.5. Samples were prepared by coating with a gold palladium thin layer of Quorum Emitech. Images were captured across a magnification range of 500× to 5000×.3.2 X-Ray diffraction (XRD)
The diffractograms of conductive carbon materials were obtained using a Philips PANalytical X’Pert PRO X-ray diffractometer (Panalytical Ltd, Eindhoven, The Netherlands) with Co Kα radiation operated at 45 kV and 30 mA. Before analysis, samples were finely ground and packed into standard sample holders. The diffractometer was equipped with a 1/8′′ divergent slit and 1/16′′ anti-scatter slit to minimize background noise. The scanning range was set from 2° to 90° (2theta) with a step size of 0.05° and a scanning time of 20 s per step.3.3 Flexural strength
A flexural strength test was performed according to ASTM D790-17 in three-point mode to measure the mechanical resistance of the synthesized samples. The tests were conducted using a Shimadzu AGS 10 N load frame at a 1 mm s−1 speed at room temperature. The span length was set to a 1![[thin space (1/6-em)]](https://www.rsc.org/images/entities/char_2009.gif) :
:![[thin space (1/6-em)]](https://www.rsc.org/images/entities/char_2009.gif) 16 ratio relative to the thickness. Samples were prepared with dimensions of 125 mm in length, 12.7 mm in width, and 4 mm in thickness. Data were collected and analyzed using Trapezium software.
16 ratio relative to the thickness. Samples were prepared with dimensions of 125 mm in length, 12.7 mm in width, and 4 mm in thickness. Data were collected and analyzed using Trapezium software.
3.4 In-plane electrical conductivity
The samples’ in-plane electrical conductivity (σ) was indirectly determined by measuring their resistance (R) using the OMICROM MODEL CPC 100 in units of ohms Ω. Resistance measurements were taken at room temperature and averaged over three readings to ensure accuracy. Then, the value of σ was calculated using eqn (1), where l, t, and w represent the sample's length, thickness, and width in meters, respectively. | (1) |
4. Results and discussion
4.1 Scanning electron microscope (SEM) analysis
Fig. 3a shows the initial form of the compressed irregular-shaped sp2 hybridized carbon layer of GIC 1395. Upon microwave heating, GICs adopted a vermicular shape with spacings created by the gaseous decomposition of intercalating agents connected by edges and weak van der Waals forces.30Fig. 3b illustrates expanded GIC 1395, and Fig. 3c depicts expanded GIC 3538. Their differences lie in the pore's morphology and the final product's size, probably due to GIC 1395 having broader interlayer spaces that produce longer graphite strips. These characteristics may be attributed to an increased gas release31 caused by the larger size of the GIC 1395 flakes. Ultimately, this phenomenon could benefit the wetting behavior and subsequent homogeneity of the base epoxy resin and the conductive filler.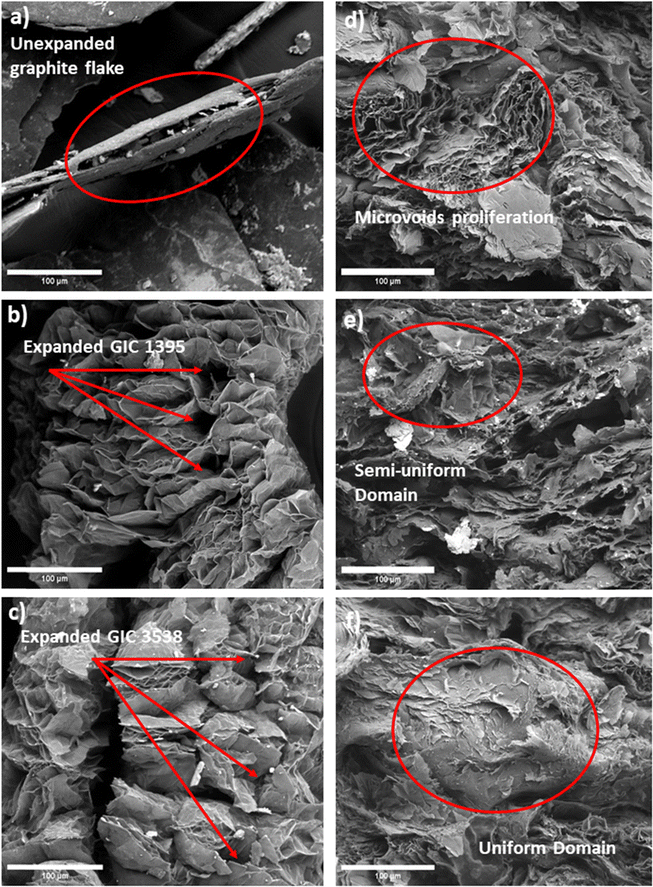 | ||
| Fig. 3 Micrographs of (a) GIC 1395, (b) expanded 1395, (c) expanded GIC 3538, (d) composite 60G-40R, (e) composite 50G-50R, and (f) composite 60R-40G. 1000×. | ||
On the other hand, Fig. 3d corresponds to the microstructure of the transverse section of 60 wt% expanded graphite and 40 wt% epoxy resin composites, revealing agglomerates of intact graphite layers uncovered with the epoxy resin, creating discontinuities or microvoids in the composite. This elucidates that the dispersion on expanded graphite within the epoxy matrix was challenging to reach using 60 wt%. The observed microvoids could affect the mechanical properties. In contrast, Fig. 3e depicts the composite synthesized with 50 wt% epoxy resin and 50 wt% expanded graphite, exhibiting fewer non-wet expanded graphite regions than the previous sample. It shows a semi-uniform domain in comparison. Fig. 3f is associated with the composite with 60 wt% epoxy resin and 40 wt% carbon filler, indicating a substantial improvement in the wetting behavior of the components that results in a more homogeneous microstructure. Thus, based on observations, despite the current fillers and their greater particle size and expansion ratio, higher percentages of expanded GIC alter the homogeneity of composites. This phenomenon occurs due to graphite agglomeration regardless of the low-viscosity polymer matrix.
4.2 X-Ray diffraction (XRD) analysis
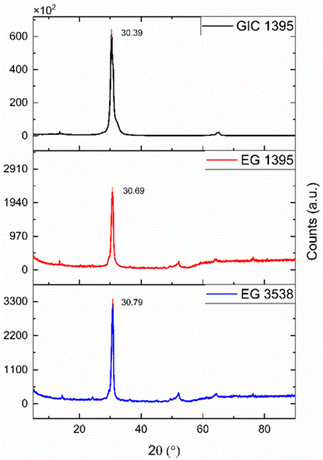
Fig. 4 shows a significant peak at 30.39°, associated with the 002-graphite characteristic plane representing the reflection perpendicular to the c-axis.32 Moreover, there is no significant difference between the angles mentioned and those belonging to the EGs; however, the intensity of the 002 signal decreases abruptly in both cases. The downsizing of the crystalline phase causes the peak height reduction to a greater degree of exfoliation31 or other possible defects. In this sense, EG 1395 yielded more porous and amorphous material than EG 3538. The amorphization of graphite materials coincides with the SEM micrographs, and it might represent an improvement in the electrical conductivity of the composites because of the formation of a more layered and graphene-like structure.334.3 Electrical conductivity
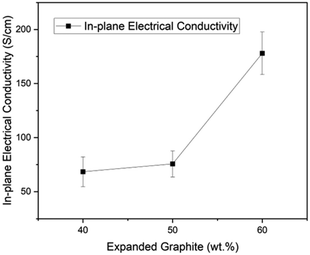
As shown in Fig. 5, there is a direct relationship between electrical conductivity and the expanded graphite content in the composite. For instance, the material with 60% content of expanded graphite reached 177.99 S cm−1, followed by 75.65 S cm−1 for the one with 50% and 68.38 S cm−1 for the composite with 40% filler content. This result is associated with creating continuous conductive paths within the composite due to the expansion ratio and amorphous character of GIC 1395. Moreover, in our previous works, we reached in-plane electrical conductivities of 19 S cm−1 (ref. 29) and 50 S cm−1 (ref. 23) employing GIC 3538 and carbon black, and 65.39 S cm−1 (ref. 17) with GIC 1395 and graphene oxide. Therefore, by optimizing the process and materials used, our research group has doubled the previous value of in-plane electrical conductivity without a secondary filler. These results are encouraging as they exceed the Department of Energy's (DOE) requirement of in-plane conductivity of >100 S cm−1. Furthermore, the percolation threshold for electrical conductivity in composites signifies the point at which the composite transitions from an insulator to a conductor. This threshold is typically reported to range from 30–50 wt% in EG-compositesased on applying the scaling law model34,35 with a three-dimensional filler. In this study, as illustrated in the Fig. 5, the percolation threshold is observed at 50 wt% of expanded graphite, indicating significant conductivity improvement above this concentration. However, it should be noted that this value depends on several factors, including the aspect ratio of the filler, dispersion, polymer matrix, and processing conditions.4.4 Flexural strength
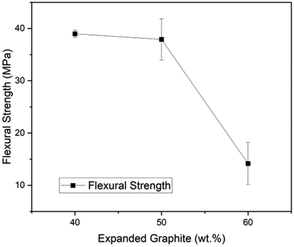
Fig. 6 presents the flexural strength as a function of EG content, and it is noticeable that the higher the EG load, the more fragile the material becomes. However, the DOE minimum for flexural strength of bipolar plates has been surpassed by the composites with 40 EG wt% (38.97 MPa) and 50 EG wt% (37.90 MPa), but the material with 60 EG wt% had a flexural strength of 14.16 MPa. The statistical variability of the results grows with the EG loading. For instance, the standard deviations were 0.68 for 60R-40G, 3.95 for 50R-50G, and 4.03 for 60G-40R. The trend displays a significant decay in flexural strength in the change from 50 to 60 wt% of EG. It could be attributed to uniform mixing becoming challenging at greater EG values because of EG's high specific volume. This phenomenon might also cause porosity and, thus, poorer flexural performance at high particle loads19 as demonstrated in previous SEM images, samples containing 60 wt% of EG exhibited a non-uniform morphology, characterized by a significant presence of microvoids. Therefore, assuring strong particle–matrix interaction and compaction is an area for improvement.5. Conclusions
The present study achieved a highly conductive epoxy/expanded graphite composite using a high expansion ratio of expanded graphite and low-viscosity epoxy resin. The approach omitted secondary fillers to streamline processing steps and minimize energy consumption during synthesis. Additionally, solvents were excluded due to long-term safety concerns. The study demonstrated high electrical conductivity values of 177.99 S cm−1 with 60 wt% expanded graphite and 75.65 S cm−1 with 50 wt%. This conductivity enhancement was attributed to the establishment of interconnected conductive paths within the composite structure.On the other hand, the corresponding flexural strengths were observed to be 37.90 MPa for 50 wt% expanded graphite and 14.16 MPa for 60 wt%. This latter did not meet DOE standards requiring strengths above 25 MPa. The lower flexural strength at 60 wt% expanded graphite was attributed to challenges in achieving a homogeneous microstructure. SEM images show heterogeneity due to graphite agglomeration and inadequate resin wetting. Conversely, a more uniform microstructure was achieved at 50 wt% expanded graphite, resulting in higher flexural strength. The findings suggest enhancing graphite dispersion and matrix compaction for compositions above 50 wt%. Future research directions include implementing sizing treatments for carbon materials to improve compatibility with the epoxy matrix, aiming to enhance mechanical properties while maintaining high electrical conductivity.
Author contributions
Jordy Santana-Villamar: data curation, formal analysis, investigation, conceptualization, methodology, writing – reviewing and editing. Miguel Carrasco-Cordero: data curation, formal analysis, investigation, writing – original draft preparation. Jose Suarez-Loor: data curation, formal analysis, investigation, writing – original draft preparation. Mayken Espinoza-Andaluz: project administration, supervision, resources, writing – reviewing and editing. Andres F. Rigail Cedeño: conceptualization, methodology, supervision, project administration, writing – reviewing and editing.Data availability
All data supporting the findings of this study are included within the article. Since the study presents specific experimental results, no external databases or repositories were used. Detailed results can be found in the figures and tables provided in the manuscript. No additional datasets were generated or analysed during the current study beyond those presented in this paper.Conflicts of interest
There are no conflicts to declare.Acknowledgements
The authors thank the Renewable Energy Laboratory (Lab FREE), the Laboratory of Testing Materials (LEMAT) from ESPOL, and the Center of Nanotechnology (CIDNA) for allowing the development of the current research.References
- M. A. Abdelkareem, K. Elsaid, T. Wilberforce, M. Kamil, E. T. Sayed and A. Olabi, Sci. Total Environ., 2021, 752, 141803 CrossRef CAS PubMed.
- K. Jiao, J. Xuan, Q. Du, Z. Bao, B. Xie, B. Wang, Y. Zhao, L. Fan, H. Wang, Z. Hou, S. Huo, N. P. Brandon, Y. Yin and M. D. Guiver, Nature, 2021, 595(7867), 361–369 CrossRef CAS PubMed.
- E4tech, The Fuel Cell Industry Review 2021, 2021.
- J. Santana-Villamar, M. Espinoza-Andaluz, S. Echeverria, G. Cedeño and M. Andersson, Electrochim. Acta, 2023, 464, 142963 CrossRef CAS.
- K. Xiong, W. Wu, S. Wang and L. Zhang, Appl. Energy, 2021, 301, 117443 CrossRef CAS.
- Y. Song, C. Zhang, C. Y. Ling, M. Han, R. Y. Yong, D. Sun and J. Chen, Int. J. Hydrogen Energy, 2020, 45, 29832–29847 CrossRef CAS.
- A. Tang, L. Crisci, L. Bonville and J. Jankovic, J. Renewable Sustainable Energy, 2021, 13 DOI:10.1063/5.0031447.
- A. Adloo, M. Sadeghi, M. Masoomi and H. N. Pazhooh, Renewable Energy, 2016, 99, 867–874 CrossRef CAS.
- M. Kim, J. W. Lim, K. H. Kim and D. G. Lee, Compos. Struct., 2013, 96, 569–575 CrossRef.
- P. Chaiwan and J. Pumchusak, Electrochim. Acta, 2015, 158, 1–6 CrossRef CAS.
- K. Tao, S. Yang, J. C. Grunlan, Y. S. Kim, B. Dang, Y. Deng, R. L. Thomas, B. L. Wilson and X. Wei, J. Appl. Polym. Sci., 2006, 102, 5248–5254 CrossRef CAS.
- J. H. Lee, Y. K. Jang, C. E. Hong, N. H. Kim, P. Li and H. K. Lee, J. Power Sources, 2009, 193, 523–529 CrossRef CAS.
- B. K. Kakati, A. Ghosh and A. Verma, Int. J. Hydrogen Energy, 2013, 38, 9362–9369 CrossRef CAS.
- A. Ghosh, P. Goswami, P. Mahanta and A. Verma, J. Solid State Electrochem., 2014, 18, 3427–3436 CrossRef CAS.
- R. B. Valapa, G. Pugazhenthi and V. Katiyar, RSC Adv., 2015, 5, 28410–28423 RSC.
- S. Simaafrookhteh, M. Khorshidian and M. Momenifar, Int. J. Hydrogen Energy, 2020, 45, 14119–14132 CrossRef CAS.
- J. Santana-Villamar, R. Reyna, A. F. Rigail-Cedeño and M. Espinoza-Andaluz, J. Electrochem. Soc., 2021, 168, 064508 CrossRef CAS.
- B. K. Kakati and D. Deka, Electrochim. Acta, 2007, 52, 7330–7336 CrossRef CAS.
- E. Planes, L. Flandin and N. Alberola, Energy Procedia, 2012, 20, 311–323 CrossRef CAS.
- S. R. Dhakate, R. B. Mathur, S. Sharma, M. Borah and T. L. Dhami, Energy and Fuels, 2009, 23, 934–941 CrossRef CAS.
- H. Suherman, J. Sahari and A. B. Sulong, Ceram. Int., 2013, 39, 7159–7166 CrossRef CAS.
- J. Zheng, Y. Peng, R. Fan, J. Chen, Z. Zhan, D. Yao and P. Ming, Chin. Chem. Lett., 2023, 34, 107616 CrossRef CAS.
- A. F. Rigail-Cedeño, M. Espinoza-Andaluz, J. Vera, M. Orellana-Valarezo and M. Villacis-Balbuca, Mater. Today: Proc., 2020, 33, 2003–2007 Search PubMed.
- A. Verma, K. Baurai, M. R. Sanjay and S. Siengchin, Polym. Compos., 2020, 41, 338–349 CrossRef CAS.
- A. Verma, P. Negi and V. K. Singh, Polym. Compos., 2019, 40, 2690–2699 CrossRef CAS.
- F. Jiang, W. Liao, T. Ayukawa, S. H. Yoon, K. Nakabayashi and J. Miyawaki, J. Power Sources, 2021, 482, 228903 CrossRef CAS.
- M. Soleimani Alavijeh, H. Kefayati, A. Nozad Golikand and S. Shariati, J. Nanostruct. Chem., 2019, 9, 11–18 CrossRef CAS.
- B. Burton, D. Alexander and H. Klein, EPOXY FORMULATIONS USING JEFFAMINE ® POLYETHERAMINES Search PubMed.
- A. F. Rigail-Cedeño, M. Espinoza-Andaluz, J. Medina-Andrade and K. Leal-Zavala, Key Eng. Mater., 2019, 821, 426–432 Search PubMed.
- R. Lan, W. Su and J. Li, Catalysts, 2019, 9(3), 280 CrossRef.
- P. Murugan, R. D. Nagarajan, B. H. Shetty, M. Govindasamy and A. K. Sundramoorthy, Nanoscale Adv., 2021, 3, 6294–6309 RSC.
- M. Salvatore, G. Carotenuto, S. De Nicola, C. Camerlingo, V. Ambrogi and C. Carfagna, Nanoscale Res. Lett., 2017, 12, 167 CrossRef PubMed.
- N. Saadat, H. N. Dhakal, S. Jaffer, J. Tjong, W. Yang, J. Tan and M. Sain, Compos. Sci. Technol., 2021, 207, 108654 CrossRef CAS.
- L. Yu, Y. H. Zhang, J. Shang, S. M. Ke, W. S. Tong, B. Shen and H. T. Huang, J. Electron. Mater., 2012, 41, 2439–2446 CrossRef CAS.
- B. Redondo-Foj, P. Ortiz-Serna, M. Carsí, M. J. Sanchis, M. Culebras, C. M. Gómez and A. Cantarero, Polym. Int., 2015, 64, 284–292 CrossRef CAS.
| This journal is © The Royal Society of Chemistry 2024 |

