 Open Access Article
Enhanced activity of highly ordered pristine and black anodic TiO2 nanotubes for high performance supercapacitors†
Farzad
Nasirpouri
 *,
Leila
Jafari-Foruzin
 ,
Amir-Ali
Farmani
 ,
Elham
Hosseinpour
and
Hassan
Yadipour
Faculty of Materials Engineering, Sahand University of Technology, Tabriz, 51335-1996, Iran. E-mail: f_nasirpouri@yahoo.com; nasirpouri@sut.ac.ir
First published on 30th July 2024
Abstract
For energy storage systems such as supercapacitors, it is a huge challenge to achieve high energy density. Here we report on the effect of either tube ordering manipulated by two-step anodisation or electrolytic surface reduction of TiO2 nanotubes (TNTs) on the supercapacitor performance. The microstructure, crystallinity, morphology and chemical composition of TNTs were examined, compared by using X-ray diffraction (XRD), X-ray energy dispersive spectroscopy (EDX) and field emission scanning electron microscopy (FE-SEM). Electrochemical investigations were performed using cyclic voltammetry (CV), galvanostatic charge–discharge (GCD) and electrochemical impedance spectroscopy (EIS). The GCD curves recorded for TNTs grown in different conditions confirmed the quasi-capacitive behaviour of the produced titanium oxide nanotubes. The galvanostatic charge–discharge showed an increase in the value of specific capacitance rising from 22 μF cm−2 to 3672 μF cm−2 at a current density of 50 μA cm−2 in a solution of 1 M KCl. The highest value corresponds to the black TiO2 owing to a decrease in charge transfer resistance as evidenced by the Nyquist plots. This study reveals the feasibility of one-pot electrochemical production of efficient TiO2 nanotubes as efficient nanoporous electrodes for supercapacitors.
1. Introduction
Since the beginning of the industrial revolution, most of the world's energy has been supplied by fossil resources such as coal, gas and oil, and the economic growth of countries depends on the consumption of fossil resources.1 In recent years, there has been a tremendous amount of attention devoted to developing net-zero carbon emissions by 2025 in order to achieve cleaner energy with lower costs, less environmental pollution and sustainability.2–7 A life cycle of green sustainable renewable energy production requires efficient energy storage devices. One good example for storing such energies is supercapacitors (SCs). SCs are devices at the boundary between dielectric capacitors and batteries whose main difference remains in the charging storage mechanisms. A lot of work has been carried out over recent years to improve the performance of SCs in terms of capacitance value, energy, power density, cycling efficiency and cycling life.8–12 SCs have attracted much attention due to their properties such as energy storage potential, which leads to higher power density than those of batteries and conventional dielectric capacitors. In a typical SC, a reversible ion adsorption and desorption reaction occurs at the interfaces between electrode materials and electrolytes, which stores and releases energy in successive cycles.13,14 Metal oxide materials such as titanium oxide have been considered as efficient electrodes for supercapacitor devices because of their outstanding electrochemical properties.15,16 For capacitor applications, TiO2 in spite of its low cost, exhibits relatively much lower areal capacitances in a range of 90–120 μF cm−2 than those of other transition metal oxides, such as MnO2 (160 mF cm−2) and RuO2 (13 mF cm−2), respectively. Therefore, different approaches are needed to enhance the capacitance properties of TiO2 to achieve practical efficient TiO2-based supercapacitors.17 A typical supercapacitor electrode can be made of pure elements, composites or hybrid materials.18–24 The energy storage mechanism for supercapacitors can be explained using three types of capacitive behaviour, including: (1) electrochemical double-layer capacitors (EDLCs) which use the net electric charge accumulated at the electrode interface, (2) pseudo-capacitors (PC) which develop from quick and reversible surface redox processes, and (3) hybrid capacitors which take advantage of both of the above mechanisms.25 An important key is to reach supercapacitors with high efficiency. A lot of effort has been made to overcome the aforementioned issue of supercapacitors to be used as future storage device for various low to high scale applications.26–30 There are two main approaches to enhance the electrochemical capacity and storage stability of SC electrodes. The first approach is to develop nanostructured electrodes with very large effective surface area. SCs represent an intermediate between batteries and capacitors, which can be classified into electrochemical double-layer capacitors and pseudo-capacitors. In electrochemical double-layer capacitors, the chemical reaction does not take place on the electrodes, whereas the charges accumulate at the electrode/electrolyte interface. In contrast, pseudo-capacitors show a high capacity compared to EDLCs, due to the fact that they stimulate reduction reactions occurring near the electrode surface. The energy density of SCs is determined by two factors: electrode capacitance and cell voltage. One of the effective ways to increase their capacity is to develop nanostructured and porous electrodes with increased energy density. The alternative method of making asymmetric/hybrid SCs includes a potential gap introduced between the two types of electrodes to increase the voltage of the whole cell. In the other words, the positive and negative electrodes are made of PC and EDLC materials, respectively. There are two types of asymmetric/hybrid SCs. First, capacitor type electrode/capacitor type electrode SCs (e.g., redox/redox type such as EDLCs/redox type). Second, capacitor type electrode/battery type electrode SCs.31TiO2 is one of the most diverse oxides studied in functional and device materials applications such as photocatalysis, electrochemical and photoelectrochemical devices, dye-sensitized solar cells and biomedical devices.32–34 TiO2 based binary and ternary composites as electrodes have been attempted by many researchers in order to make high performing candidates for supercapacitors.35–37
Anodic TiO2 nanotubes (TNTs) have been the focus of many research studies for years because of the flexible processing of nanotubes with different shapes and dimensions as well as the ease of doping or grafting them with other suitable elements and compounds.38 In principle, TNTs as one-dimensional TiO2 nanostructures exhibit high surface area as well as enhance the charge collection and transport. Earlier reports have also revealed that these nanostructures also have suitable light harvesting properties. TNTs are typically fabricated by anodisation of Ti and alloys in a simple manner where the morphology and dimensions of the nanotubes are manipulated solely by tuning the anodisation parameters. The anodising process offers several advantages for the synthesis of TNTs in form in industrial applications as well. Furthermore, two-step anodising results in more ordered and highly uniform TNTs. The enhanced surface area and improved photocatalytic properties of anodised TiO2 are particularly beneficial for applications in environmental purification, such as air and water treatment, and in energy storage and conversion devices, including batteries and solar cells. Additionally, anodizing is a scalable and cost-effective technique, making it suitable for large-scale and mass production. The produced anodic TNTs exhibit excellent adhesion to the substrate, mechanical stability, and resistance to wear and corrosion, which extends the lifespan and performance of the end products. In particular, the capability of the anodisation process in tuning the TNTs’ size and morphology allows for the customization of the TiO2 properties to meet specific industrial needs, thereby enhancing the versatility and application potential of this method across various sectors.
Due to the large band gap of TiO2 (3.0–3.2 eV) and the existence of several fast electron–hole recombination centres, the performance of TiO2-based materials is limited.39 This finding focused intense research activities on the growth, modification, properties and applications of these one-dimensional nanostructures of titania, e.g. nanotubes.40,41 Several attempts have been made to reduce the bandgap of TiO2. The anodisation time and temperature can reduce the band gap energy as it changes from 3.2 to 2.92 eV during two-step anodisation.42 Zhen-Kun He et al. have developed TNTs as a current collector for supercapacitors.43 The results show that the morphology of TiO2 can affect the amount of nitrogen doping. Due to the improved charge transfer and the unique free static nanorod structure, the optimized nitrided TiO2 electrode achieves a significant areal capacity, which is much larger than that of the unseeded nitrided TiO2 electrode. Wu et al.44 used a simple hydrogenation doping method to significantly improve the electronic conductivity and the capacitive performance of TiO2 nanotube electrodes.
Black (or reduced) TiO2 nanotubes (TNTs) are an improved titanium oxide based electrocatalyst because of its remarkable electrochemical activity.45 The improved activity of the black TNTs is attributed to the surface restructuring, and inducing microstructural defects such as oxygen vacancies or Ti3+.46 Applications of black TiO2 (reduced TiO2) were reported in different areas such as photocatalysis, photoelectrochemical sensors, catalysis, lithium-ion rechargeable batteries, and fuel cells.47,48 Surface modification of reduced TNTs has been accomplished by different methods. The surface area and porosity of the reduced TiO2 could be manipulated as a result of different synthesis approaches.49–53 A high photocatalytic efficiency was reported for black or reduced titania treated by ethylene glycol solution at room temperature.44,47 Chen et al. firstly reported that black TiO2 exhibits a decreased band gap energy down to 1.5 eV.54 This decrease of the band gap energy improved the electrochemical activity on black TiO2 electrodes. A. Chatzitakis et al.53 reported a new method of synthesis of black TiO2 in the form of nanotubes. In another study, amorphous TiO2 nanotubes (TNTs) were annealed and reduced in the presence of CaH2, where they were able to achieve control over the preferred crystal orientation by a simple manipulation.55 Also, TNTs treated by electrochemical hydrogenation doping (H-TNT) have been employed in supercapacitors. H-TNTs exhibit an improved specific (areal) capacitance at a scan rate of 100 mV s−1 (11.8 mF cm−2).56 The modified electrodes display improved areal capacitance compared to pure TNTs. Lu et al. reported that hydrogenated black TiO2 nanotube arrays obtained by heating anodised TiO2 nanotubes under a hydrogen environment between 300 to 600 °C exhibit an improved performance as supercapacitors due to increased densities of carriers and hydroxyl groups on the TiO2 surface from the hydrogenation.57 In brief, the increased performance as electrode materials for supercapacitor applications using black TiO2 nanomaterials was suggested to be due to increased densities of charge carriers and hydroxyl groups on the TiO2 surface and the higher electrical conductivity.56,57 But it is still a challenge to achieve high capacitance in supercapacitors, which requires the design of electrocatalysts. Table 1 summarises the reported data from several studies from the literature. The highest supercapacitor activity is shown according to the investigations performed in alkali media where the supercapacitor reaction in the alkali media is decayed after long-term cycling. Hence, the study of supercapacitor activity in neutral or near-neutral media is an attractive area for practical applications in the industrial system.
| Electrode material | Specific capacitance (or areal capacitance) (CS) | Electrolyte | Ref. |
|---|---|---|---|
| TNT-R | 9.8 μF cm−2@50 mV s−1 | KCl 1 M | This work |
| Nitrided TiO2 nanoparticle | 85.7 mF cm−2@10 mV s−1 | Na2SO4 0.5 M | 58 |
| TiO2/Nb2O5 nanotube | 37 mF cm−2@1 mV s−1 | H2SO4 1 M | 59 |
| TiO2−x/Ti | 81.75 mF cm−2@2 mV s−1 | H2SO4 1 M | 60 |
| TiO2-LSGO | 9.9 mF cm−2@1 mV s−1 | PVA/H2SO4 | 61 |
| Co(OH)2/TiO2 | 1188 F g−1@100 mV s−1 | KOH 1 M | 62 |
| TiO2/rGO NS (Green method) | 599.90 F g−1@1 A g−1 | H2SO4 1 M | 63 |
| GO/TiO2 | 100 F g−1@5 mV s−1 | Na2 SO4 1 M | 64 |
| rGO/TiO2 nanorod | 114.5 F g−1@5 mV s−1 | Na2 SO4 1 M | 65 |
| Py700@SFO@CC | 421 F g−1@1 A g−1 | KOH 6 M | 66 |
| SrCo0.9Fe0.1O3−δ@CC//AC@CC | 526.6 F g−1@1 A g−1 | KOH 1 M | 67 |
| Fe3Mo3C/Mo2C@CNT | 196.3 F g−1@10 mV s−1 | KOH 1 M | 68 |
| CoO@Co2V2O7 | 7.58 F cm −2@2 mA cm−2 | KOH 3 M | 69 |
| Cu2MoS4@CC | 33.9 mA h g−1@1 A g−1 | KOH 3 M | 70 |
| rGO–TiO2 NBs | 225@0.125 A g−1 | 1 M Na2SO4 | 71 |
| Graphene–TiO2 hybrid | 165@5 mV s−1 | 1 M Na2SO4 | 65 |
| 100 ALD TiO2–G | 84@10 mV s−1 | 1 M KOH | 72 |
| 3D TiO2@RGO | 397@0.36 A g−1 | 6 M KOH | 73 |
| GA/TiO2 | 142.6@5 mV s−1 | 0.1 M NaCl | 74 |
| Anatase TiO2-reduced graphene oxide | 206.7 F@0.5 A g−1 | 0.5 M Na2SO4 | 75 |
| (TiO2)–graphene nanocomposite hydrogel | 206.7 F@0.5 A g−1 | 0.5 M Na2SO4 | 76 |
| H-TiO2/NG | 401.7@1 A g−1 | 1 M KOH | 77 |
| Hydrogenated TiO2 nanotubes | 3.24 mF cm−2@100 mV s−1 | 0.5 M Na2SO4 | 78 |
In this work, we investigated two main strategies including (i) morphological evolution based on tube ordering and length and (ii) subsequent electrolytic reduction in ethylene glycol solution at room temperature. The effect of the first-step anodisation time of TNTs on the ordering of the nanotube array and their capacitance of the nanotube of pristine TNTs was investigated. In the next step, the effect of electrolytically reduced TNTs, i.e. black TNTs, was investigated. Electrochemical impedance spectroscopy (EIS), galvanostatic charge–discharge and cyclic voltammetry (CV) were used to measure the conductivity of the different nanotubes, and capacitance of the supercapacitor. Either strategy employed here is shown to improve the capacitance of TNTs for high specific capacity supercapacitor applications. The present results show a new approach to prepare highly reactive TNT-based electrocatalysts for SC or similar applications.
2. Materials and methods
2.1. Preparation of the Ti substrate
Ti foils (grade 2, 99.65%) with a thickness of 0.6 mm were purchased and used as the substrate. Ti foils were cut into dimensions of 1 × 2 cm2 and then ground on sand papers meshed up to 5000 grades. Then, the samples were immersed in HNO3 and HF (3![[thin space (1/6-em)]](https://www.rsc.org/images/entities/char_2009.gif) :
:![[thin space (1/6-em)]](https://www.rsc.org/images/entities/char_2009.gif) 1 volume ratio) as the chemical etchant and immediately washed with distilled water (DI). Finally, the samples were ultrasonically degreased in acetone, ethanol and deionized (DI) water for 15, 15 and 10 minutes, respectively, and washed in ethanol to remove residual contamination before anodising.
1 volume ratio) as the chemical etchant and immediately washed with distilled water (DI). Finally, the samples were ultrasonically degreased in acetone, ethanol and deionized (DI) water for 15, 15 and 10 minutes, respectively, and washed in ethanol to remove residual contamination before anodising.
2.2. Preparation of TiO2 nanotube arrays (TNTs)
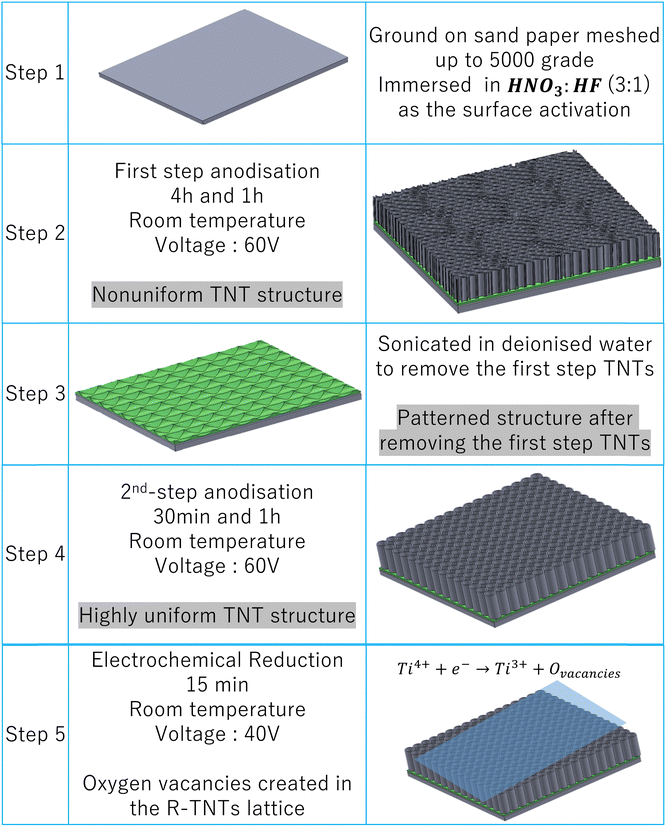
TNT electrodes were synthesized by two-step anodic oxidation. The anodisation experiments were carried out in a two-electrode cylindrical cell consisting of Ti foil as the anode and stainless steel (316L SS) as the cathode. The distance between the cathode and the anode was adjusted at 3 cm. An ethylene glycol-based solution containing 0.5% wt NH4F and 2.5% vol DI water was used as the anodisation electrolyte. The electrolyte was vigorously stirred during anodisation using a magnetic stirrer. All experiments were carried out at room temperature and a constant voltage of 60 V. Current transients were recorded during anodising by a computer-controlled data acquisition system (Mastech, Escort 172). In the first step of anodising, the Ti foils were anodised for 4 or 1 h, respectively, and an oxide layer with the structure of oxide nanotubes was made on the surface of the Ti foils. Then this layer was removed by an ultrasonic method in DI water. Then both samples were anodised for 30 min in the second anodisation step under the same conditions, similar to the first step. After the second step, the sample was cleaned with DI water and dried. The anodised TNTs were dried at 150 °C for 45 min to remove residual organic species and then annealed at 450 °C for 60 min in an oven at a heating rate of 3 °C min−1 until the amorphous structure changed to a crystalline structure. The obtained samples were numbered as TNT-4h-30min and TNT-1h-30min respectively. In order to investigate the effect of time on the TNTs in the second step, the Ti foil was anodised for four hours in the first step and one hour in the second step (TNT-4h-1h). Scheme 1 systematically shows the process of preparation of the TNTs.2.3. Preparation of reduced TiO2 TNTs
As shown in Scheme 1, after the annealing process, TNT-4h-1h was reduced electrochemically at room temperature in a two-electrode system. Anodised TNTs and stainless steel were the cathode and anode, respectively. An ethylene glycol solution consisting of 0.56 wt% NH4F was used as the reduction electrolyte. The cathodic voltage and the reduction time were fixed at 40 V and 15 minutes, respectively. Finally, the samples were dried for 20 minutes at 80 °C, and named as TNT-R. The conditions for the preparation of the samples are reported in Table 2.| Sample | First anodisation time (h) | Second anodisation time (min) |
|---|---|---|
| TNT-4h-30min | 4 | 30 |
| TNT-1h-30min | 1 | 30 |
| TNT-4h-1h | 4 | 60 |
| TNT-R | 4 | 60 |
2.4. Morphological and crystalline characterisation
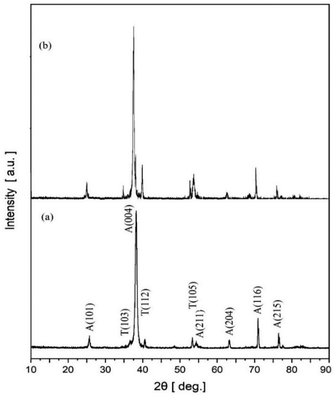
Field-emission scanning electron microscopy (FE-SEM) was used to examine the morphologies of the TNT samples (model MIRA3TESCAN-XMU). The chemical composition was estimated by energy dispersive X-ray spectroscopy (EDS) analysis. The crystalline structure was characterised by X-ray diffraction (XRD) using an X-ray diffractometer (BRUCKERS AXSD & ADVANCE-Germany) with a Cu Kα source in the range of 2θ = 20–80° (λ = 1.54178 A). Field emission scanning electron microscopy (FE-SEM) was used to examine the morphology of the TNT samples. Chemical composition was estimated using energy dispersive X-ray spectrometry (EDS).2.5. Electrochemical measurements
Electrochemical experiments were carried out by a computer-controlled potentiostat/impedance spectrometer (OrigaFlex-OGF500) using a standard three-electrode system in 1 M KOH electrolyte at room temperature. The active surface was calculated for all three samples and was considered as 1 square centimeter. An Hg/HgCl2 electrode (saturated in KCl), a platinum electrode and a TNT sample were used as the reference, counter and working electrode, respectively. The CV curves of the prepared TiO2 nanotubes were taken in 1 M KCl solution at a scan rate of 50 mV s−1 in the potential range of 0.0 to 5.0 V vs. Ag/AgCl. Also, the EIS plots were investigated in 1 M KCl, at the frequency range of 100 kHz to 0.01 Hz. The galvanostatic charge discharge (GCD) analysis was carried out based on chronopotentiometry plots taken on TNT electrodes in a solution of 1 M KCl.3. Results and discussion
3.1. Morphology and microstructure
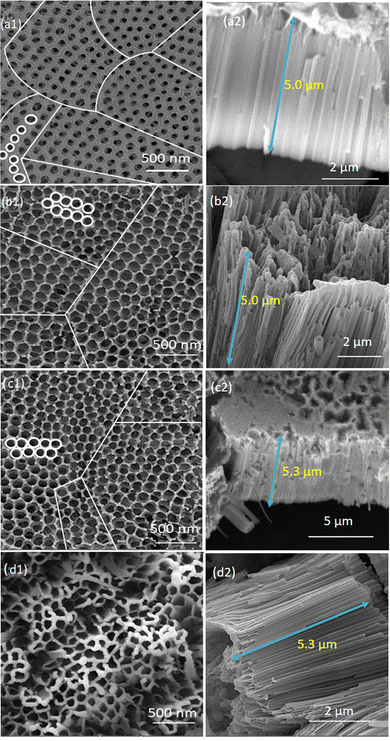
Fig. 2(a2)–(d2) show the cross-section images of the prepared TiO2-nanotubes. By comparing the images (a2) and (b2), it can be seen that with the increase in the time of the first step from 1 h to 4 h of the anodic oxidation process, the length of the nanotubes was not changed, so the change time of anodisation at the first step, only caused an increase in the ordering of the nanotubes. But increasing the time of anodisation at the second step [Fig. 2(c2)], from 30 min to 1 h, caused an increase in the length of the nanotubes from 5 to 5.3 μm, and consequently with the increase in the length of the nanotubes, the areal capacity also increases and caused an improvement in TiO2 activity as a supercapacitor electrode. Furthermore, as shown in Fig. 2(d1), for black or reduced TiO2-nanotubes, an inner tube diameter of about 134 nm and thickness of the tube walls of about 20 nm are formed. Also, as shown in Fig. 2(d2), the length of the nanotubes for the reduced TiO2 was not changed compared to the length of pristine TNTs, which were anodised for 1 h (TNT-4h-1h) [Fig. 2(c2)].
3.2. Electrochemical examination of pristine and black TNTs for supercapacitor performance
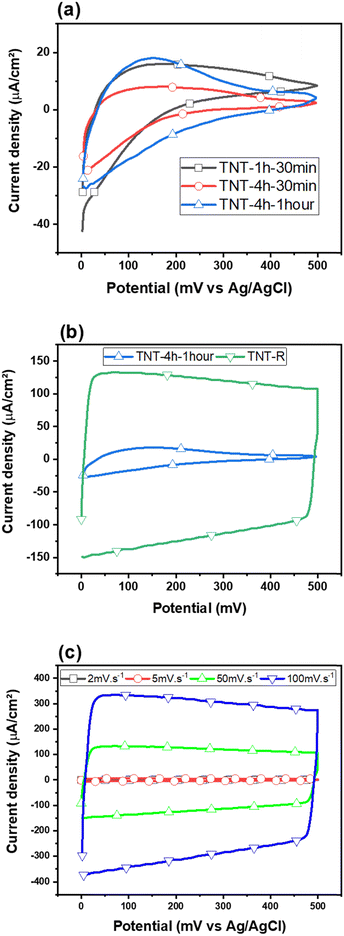
Furthermore, the black or reduced TNTs (TNT-R) exhibit quite different electrochemical performance indicating an electrocatalyst with electrical double layer capacitor (EDLC)-like behaviour. Obviously, black TNTs showed a significantly higher charging current compared to pristine TNTs. This can be attributed to the decrease of the band gap energy owing to the microstructural defects such as oxygen vacancies.46,83
Fig. 3(c) presents CV plots of TNT-R recorded at scan rates of 2, 5, 50 and 100 mV s−1. The current density of the CV curves is increased as a function of the scan rate. The shape of the curves is quasi-rectangular, which is characteristic of electrochemical double-layer capacitors (EDLCs). In CV recorded at low scan rates, the presence of redox peaks likely suggests a pseudocapacitive behavior. Considering that titanium dioxide (TiO2) nanotubes can exhibit both EDLC and pseudocapacitive characteristics depending on the electrolyte and the specific surface treatments, the supercapacitor depicted is likely a hybrid supercapacitor. This type of supercapacitor combines the principles of EDLC and pseudocapacitors to enhance energy storage capacity and power delivery.84 Based on the CV curves, the highest areal capacitance observed corresponds to TNT-R (reduced TiO2).
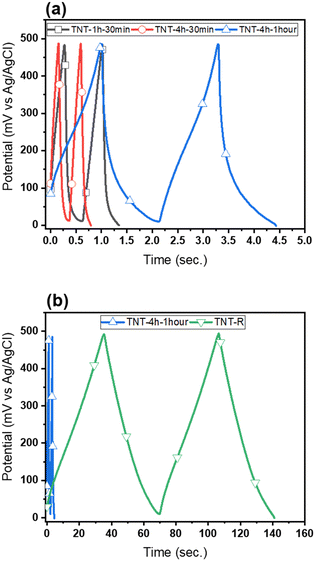 | ||
| Fig. 4 (a) Charge/discharge profiles of the different TNTs and (b) charge/discharge of the TNT-R and TNT-4h-1h. | ||
A reason for this could be attributed to the intensification of the redox reactions, which were carried out on the surface of the electrode and electrolyte. This redox reaction is due to the increase of charge carriers. Also, the GCD study is an efficient approach to determine the areal capacitance of electrodes and is frequently used in energy storage devices working at constant current density. Table 3 reports the charge–discharge curves of samples at the current density of 50 μA cm−2. Areal capacitance is estimated using the following formula:85
 | (1) |
| Electrode | Specific (areal) capacitance (μF cm−2) obtained from GCD |
|---|---|
| TNT-1h-30min | 37 |
| TNT-4h-30min | 22 |
| TNT-4h-1h | 121 |
| TNT-R | 3672 |
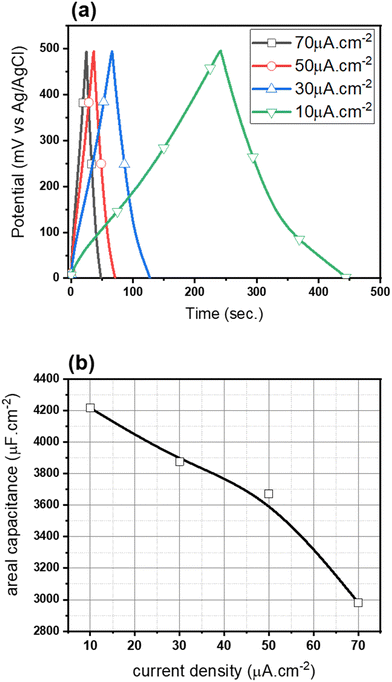
In Fig. 5(a), electrochemical measurements were reported for the TNT-R at the current density of 10, 30, 50, and 70 μA cm−2. As the current density enhances from 10 to 70 μA cm−2, the areal capacitance of the samples is reduced (Fig. 5(b)).
At a current density of 10 μA cm−2, a significant improvement in areal capacitance is observed for black (reduced) TNTs through electrochemical reduction over other current densities. It is possible that a high current density leads to irreversible processes. Although, a lower current density leads to an improvement in the electrode performance.86 Moreover, the high stability of the reduced TiO2 sample was evidenced by the dramatically improved charge storage.
Fig. 6 displays the Nyquist plot of the TNTs in a KCl 1 M electrolyte solution, which reveals interesting features of the electrode/electrolyte system. The Nyquist plot in Fig. 6(a) reveals that TNT-R has the lowest electrical resistance compared to the other samples. The equivalent resistance (RS), seen at the point where the curve meets the horizontal axis reflects the combined resistance of electrolyte ions, electrode materials and electrode–electrolyte interface. The charge transfer resistance (Rct), represented in the circuit by the element labelled “Rct”, signifies the resistance specifically at the electrode–electrolyte interface. The high frequency region corresponds to the charge transfer limiting process and is attributed to the double-layer capacitance (Cdl) in parallel with the charge transfer resistance (Rct) at the contact interface between the electrode surface and electrolyte solution. This region of the Nyquist plot provides valuable information about the charging and discharging behaviour of the electrodes. However, no semicircle arc was observed for the TNT electrode, as depicted in Fig. 6(a). This suggests that the charge transfer of these working electrodes is excellent and suitable for electrochemical supercapacitor applications, with virtually no indication of electrical resistance. The absence of a semicircle arc in the Nyquist plot is a clear indication of the superior performance of the TNT electrode.
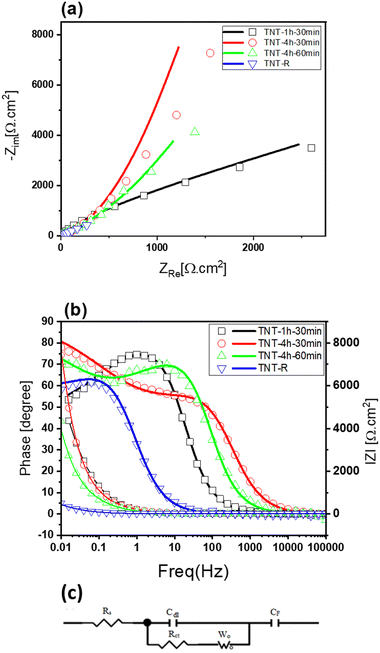 | ||
| Fig. 6 (a) Nyquist plots of the different TNTs and modeling of equivalent circuits for TNT supercapacitors, (b) Bode and phase plot (line: fitted data) and (c) their equivalent circuit. | ||
The linear part in the low frequency region is associated with the Warburg resistance (diffusive resistance) of the electrolyte into the interior of the electrode surface and ion diffusion/transport into the electrode surface. This region of the Nyquist plot provides insight into the mass transfer processes that occur during the charging and discharging of the electrodes. Moreover, a line almost vertical to the real axis in the imaginary part of the impedance in the low-frequency region, indicating swift ion diffusion in the electrolyte and adsorption onto the electrode surface, suggests an ideal capacitive behaviour of the electrodes. This behaviour is highly desirable for electrochemical supercapacitor applications, as it can result in high power density, fast charging/discharging rates, and long cycle life. The amount of charge transfer resistance in the Nyquist plots gives adequate information about the charge transfer.44,88,89
The TNT-4h-1h electrode has a smaller semicircle diameter in comparison with the TNT-1h-30min, and TNT-4h-30min electrodes. Furthermore, TNT-R shows a smaller charge transfer resistance than the other three electrodes. The low Rct at TNT-R can be attributed to low band gap energy, which improved the charge transfer.90,91 Also, an equivalent electrical circuit is presented in Fig. 6(c). The equivalent circuit was used to analyse the measured electrical impedance of the samples. Also, the results of fitted data are summarised in Table 4. The circuit components and their meanings are:
| Element | R s (Ω cm2) | R ct (Ω cm2) | W o (mS s5) | C dl (F) | C F (F) |
|---|---|---|---|---|---|
| TNT-1h-30min | 13.78 | 0.00062 | 10.26 | 5.714 × 10⁻⁴ | 4.67 × 10⁻⁸ |
| TNT-4h-30min | 4.97 | 0.00013 | 6.864 | 2.281 × 10⁻³ | 2.542 × 10⁻³ |
| TNT-4h-1h | 3.432 | 0.00057 | 7.10 | 2.214 × 10⁻³ | 6.377 × 10⁻³ |
| TNT-R | 15.07 | 0.00010 | 10.49 | 8.24 × 10⁻³ | 0.1998 |
R S: equivalent resistance; Cdl: double-layer capacitance; Wo: Warburg diffusion element; Rct: charge transfer resistance; CF: faradaic capacitance.
The RS values are 13.78, 4.97, 3.432, and 15.07 Ω cm2, and the Rct values are 0.00062, 0.00013, 0.00057, and 0.0001 Ω cm2 for TNT samples subjected to different conditions: TNT-1h-30min, TNT-4h-30min, TNT-4h-60min, and TNT-R. As you can see, the sample with the lowest the equivalent resistance (RS) is TNT-4h-60min, while the sample with the lowest resistance at the electrode–electrolyte interface (Rct) is TNT-R indicating better conductivity and capacitive behaviour. Table 3 demonstrates a significant rise in capacitance with increasing first anodisation time. This can be attributed to the formation of a more extensive network of TNT nanotubes, leading to a reduction in the overall charge transfer resistance (Rct). However, extending the second anodisation time can have an opposing effect. While it may lead to longer TNT nanotubes, their inherent semiconducting nature causes the electron transfer resistance to rise, as shown in Table 4. Additionally, the analysis of the Warburg impedance (Wo) for TNT-R suggests that this configuration offers the easiest access for ions compared to other samples. Interestingly, the analysis of the faradaic capacitance (CF) for TNT-R reveals that reducing TNT is the most effective approach to enhancing the capacitance of TNT samples. In summary, the Nyquist plots and EIS data provide valuable insights into the performance and behavior of the TNT electrode/electrolyte system. The absence of a semicircle arc in the Nyquist plot indicates excellent charge transfer and ideal capacitive behavior, making the TNT electrode a promising candidate for electrochemical supercapacitor applications.
4. Conclusion
Titanium dioxide nanotubes were synthesized by the anodic oxidation method. Then, the effects of ordering, and length of the nanotubes as well as the process of electrochemical reduction on the structure of the nanotubes were studied for their supercapacitor activity. For this purpose, in order to investigate the effect of the ordering of nanotubes, the anodic oxidation process was carried out in two steps for 1 h (TNT-1h-30min) and 4 h (TNT-4h-30min) in the first step. In order to investigate the effect of the length of the nanotubes, the second step of the synthesis process was performed in two times of 30 min (TNT-4h-30min) and 1 h (TNT-4h-1h). According to the results of electrochemical tests, the optimal time of 1 h for the second step was confirmed. An electrochemical reduction process was performed to produce black or reduced TNTs. Three types of electrochemical tests, including cyclic voltammetry, galvanostatic charge–discharge, and electrochemical impedance, were performed on the samples, and the results of all three tests are in complete agreement with each other. We understand that the ordering and length of the nanotubes are effective and efficient in improving the supercapacitor activity and increased the specific capacity, but the effect of the length of nanotubes is greater than that of the other factor. Also, in this method the reduced TiO2 nanotubes have a specific capacity of 3672 μF cm−2 under a current density of 50 μA cm−2.Data availability
Data reported in this manuscript are mainly extracted from an MSc theses of Elham Hosseinpour and Hassan Yadipour at Sahand University of Technology and Dr Leila Jafari Foruzin's postdoctoral research works. These data will be available on request.Conflicts of interest
There are no conflicts to declare.Acknowledgements
The authors are grateful to Sahand University of Technology for financial support.References
- P. S. Chen, Y. Hu, S.-Y. Li, M. Mazurkiewicz-Pawlicka and A. Małolepszy, Int. J. Electrochem. Sci., 2024, 19, 100523 CrossRef CAS.
- H. Zhou and Y. Zhang, J. Power Sources, 2013, 239, 128–131 CrossRef CAS.
- M. Ubaidullah, J. Ahmed, T. Ahamad, S. F. Shaikh, S. M. Alshehri and A. M. Al-Enizi, Mater. Lett., 2020, 266, 127492 CrossRef CAS.
- G. M. Dias, J. C. Bernardes, B. N. Wesling, D. Müller, L. S. Marques and C. R. Rambo, Open Ceram., 2021, 8, 100196 CrossRef CAS.
- A. M. Al-Enizi, J. Ahmed, M. Ubaidullah, S. F. Shaikh, T. Ahamad, M. Naushad and G. Zheng, J. Cleaner Prod., 2020, 248, 119251 CrossRef CAS.
- A. M. Al-Enizi, M. Ubaidullah, J. Ahmed, T. Ahamad, T. Ahmad, S. F. Shaikh and M. Naushad, Composites, Part B, 2020, 183, 107655 CrossRef CAS.
- M. Ubaidullah, A. M. Al-Enizi, T. Ahamad, S. F. Shaikh, M. A. Al-Abdrabalnabi, M. S. Samdani, D. Kumar, M. A. Alam and M. Khan, J. Energy Storage, 2021, 33, 102125 CrossRef.
- N. Kunthakudee, T. Puangpetch, P. Ramakul, K. Serivalsatit and M. Hunsom, Int. J. Hydrogen Energy, 2022, 47, 23570–23582 CrossRef CAS.
- G. Song, C. Li, T. Wang, K. H. Lim, F. Hu, S. Cheng, E. Hondo, S. Liu and S. Kawi, Small, 2024, 20, 2305517 CrossRef CAS PubMed.
- A. Tundwal, H. Kumar, B. J. Binoj, R. Sharma, G. Kumar, R. Kumari, A. Dhayal, A. Yadav, D. Singh and P. Kumar, RSC Adv., 2024, 14, 9406–9439 RSC.
- Y. M. Volfkovich, J. Electroanal. Chem., 2024, 118290 CrossRef CAS.
- Q. Rong, C. Yuwen, Y. Liu, Y. Liu, C. Wang, Y. Wang, D. Zhang and Z. Wen, Nano Res., 2024, 17, 4039–4046 CrossRef CAS.
- P. Liu, Y. Gao, Y. Tan, W. Liu, Y. Huang, J. Yan and K. Liu, Nano Res., 2019, 12, 2835–2841 CrossRef CAS.
- Q. Li, N. Mahmood, J. Zhu, Y. Hou and S. Sun, Nano Today, 2014, 9, 668–683 CrossRef CAS.
- S. Chetana, H. Guddappa, V. N. Thakur, N. Kumar, N. C. Joshi, V. Mirle and M. Shetty, J. Mater. Sci.: Mater. Electron., 2024, 35, 595 CrossRef CAS.
- S. Wongprasod, N. Tanapongpisit, P. Laohana, T. M. Huyen Nguyen, H. Q. Van, S. Kim, S. Srikam, S. Sonsupap, N. Chanlek and M. Horprathum, ACS Appl. Nano Mater., 2024, 7, 6712–6721 CrossRef CAS.
- W. Pholauyphon, R. N. Bulakhe, J. Praneerad, R. Attajak, J. Manyam, I. In and P. Paoprasert, Electrochim. Acta, 2021, 390, 138805 CrossRef CAS.
- R. Lakra, R. Kumar, D. Thatoi and A. Soam, Mater. Today: Proc., 2023, 74, 863–866 CAS.
- R. Lakra, R. Kumar, P. K. Sahoo, D. Thatoi and A. Soam, Inorg. Chem. Commun., 2021, 133, 108929 CrossRef CAS.
- N. Liu, X. Zhou, N. T. Nguyen, K. Peters, F. Zoller, I. Hwang, C. Schneider, M. E. Miehlich, D. Freitag and K. Meyer, ChemSusChem, 2017, 10, 62–67 CrossRef CAS PubMed.
- X. Yu, X. Zhang, Y. Lai, D. Wang and Y. Liu, Green Energy Environ., 2022, 7, 485–491 CrossRef CAS.
- R. Kumar, B. K. Singh, A. Soam, S. Parida, V. Sahajwalla and P. Bhargava, Nanoscale Adv., 2020, 2, 2376–2386 RSC.
- A. Soam, K. Parida, R. Kumar and R. O. Dusane, Ceram. Int., 2019, 45, 18914–18923 CrossRef CAS.
- S. Hejazi, S. Pour-Ali, M. Killian and S. Mohajernia, Electrochem. Commun., 2022, 136, 107246 CrossRef CAS.
- Y. Wang, Y. Song and Y. Xia, Chem. Soc. Rev., 2016, 45, 5925–5950 RSC.
- R. Lakra, R. Kumar, P. K. Sahoo, D. Sharma, D. Thatoi and A. Soam, Carbon Trends, 2022, 7, 100144 CrossRef CAS.
- S. Rani, N. Kumar, A. Tandon and Y. Sharma, IEEE Trans. Electron Devices, 2020, 68, 251–256 Search PubMed.
- M. Z. U. Shah, M. S. Javed, M. Sajjad, A. Shah, M. S. Shah, S. ur Rahman, A. Mahmood, M. Ahmad, M. A. Assiri and H. Hou, J. Sci.: Adv. Mater. Devices, 2022, 7, 100418 Search PubMed.
- D. Ghosh, S. Giri, S. Kalra and C. K. Das, Open J. Appl. Sci., 2012, 2, 70 Search PubMed.
- M. S. Lal, R. Badam, N. Matsumi and S. Ramaprabhu, J. Energy Storage, 2021, 40, 102794 CrossRef.
- M. Saleem, F. Ahmad, M. Fatima, A. Shahzad, M. S. Javed, S. Atiq, M. A. Khan, M. Danish, O. Munir and S. M. B. Arif, J. Energy Storage, 2024, 76, 109822 CrossRef.
- H. Cheshideh, E. Moslehifard and F. Nasirpouri, in Functionalized Nanomaterial-Based Electrochemical Sensors, ed. C. M. Hussain and J. G. Manjunatha, Woodhead Publishing, 2022, pp. 521–554 DOI:10.1016/B978-0-12-823788-5.00004-1.
- F. Nasirpouri, P. s N. S. Peighambardoust, A. Samardak, A. Ognev, V. Korochentsev, I. Osmushko and R. Binions, ChemElectroChem, 2017, 4, 1227–1235 CrossRef CAS.
- F. Nasirpouri, I. Yousefi, E. Moslehifard and J. Khalil-Allafi, Surf. Coat. Technol., 2017, 315, 163–171 CrossRef CAS.
- R. Huang, J. Zhang, Z. Dong, H. Lin and S. Han, Energy Fuels, 2022, 36, 9261–9271 CrossRef CAS.
- B. Pant, M. Park and S.-J. Park, Polymers, 2019, 11, 899 CrossRef CAS PubMed.
- D. P. Ojha, M. B. Poudel and H. J. Kim, Mater. Lett., 2020, 264, 127363 CrossRef.
- A. B. Younis, Y. Haddad, L. Kosaristanova and K. Smerkova, Wiley Interdiscip. Rev.: Nanomed. Nanobiotechnol., 2023, 15, e1860 CAS.
- A. M. Elshahawy, S. M. Elkatlawy, M. S. Shalaby, C. Guan and J. Wang, J. Electron. Mater., 2023, 52, 1347–1356 CrossRef CAS.
- P. Tang, X. Li, C. Xie and X. Xiao, ACS Appl. Nano Mater., 2023, 6, 410–420 CrossRef CAS.
- O. Zakir, A. Ait-Karra, R. Idouhli, M. Khadiri, B. Dikici, A. Aityoub, A. Abouelfida and A. Outzourhit, J. Solid State Electrochem., 2023, 1–19 Search PubMed.
- A. Pourandarjani and F. Nasirpouri, Ceram. Int., 2018, 44, 22671–22679 CrossRef CAS.
- X. Su, Q. He, Y.-E. Yang, G. Cheng, D. Dang and L. Yu, Diamond Relat. Mater., 2021, 114, 108168 CrossRef CAS.
- F. Habibi-Hagh, L. J. Foruzin and F. Nasirpouri, Int. J. Hydrogen Energy, 2023, 48, 11225–11236 CrossRef CAS.
- H. Sopha, J. Bacova, K. Baishya, M. Sepúlveda, J. Rodriguez-Pereira, J. Capek, L. Hromadko, R. Zazpe, S. M. Thalluri and J. Mistrik, Surf. Coat. Technol., 2023, 462, 129504 CrossRef CAS.
- Q. Kang, J. Cao, Y. Zhang, L. Liu, H. Xu and J. Ye, J. Mater. Chem. A, 2013, 1, 5766–5774 RSC.
- Z. Li, H. Bian, Z. Xu, J. Lu and Y. Y. Li, ACS Appl. Energy Mater., 2020, 3, 6087–6092 CrossRef CAS.
- D. Yu, Y. Zhang, F. Wang and J. Dai, RSC Adv., 2021, 11, 2307–2314 RSC.
- L. Andronic and A. Enesca, Front. Chem., 2020, 8, 565489 CrossRef CAS PubMed.
- T. Wu, G. Sun, W. Lu, L. Zhao, A. Mauger, C. M. Julien, L. Sun, H. Xie and J. Liu, Electrochim. Acta, 2020, 353, 136529 CrossRef CAS.
- L. F. Plaça, P.-L. S. Vital, L. E. Gomes, A. C. Roveda Jr, D. R. Cardoso, C. A. Martins and H. Wender, ACS Appl. Mater. Interfaces, 2022, 15, 43259–43271 CrossRef PubMed.
- F. Li, S. Wang, H. Yin, Y. Chen, Y. Zhou, J. Huang and S. Ai, ACS Sens., 2020, 5, 1092–1101 CrossRef CAS PubMed.
- N. Rahman, M. Nasir, A. A. Alothman, A. M. Al-Enizi, M. Ubaidullah and S. F. Shaikh, J. King Saud Univ., Sci., 2021, 33, 101280 CrossRef.
- X. Chen, L. Liu, P. Y. Yu and S. S. Mao, Science, 2011, 331, 746–750 CrossRef CAS PubMed.
- X. Liu, P. Carvalho, M. N. Getz, T. Norby and A. Chatzitakis, J. Phys. Chem. C, 2019, 123, 21931–21940 CrossRef CAS.
- X. Lu, G. Wang, T. Zhai, M. Yu, J. Gan, Y. Tong and Y. Li, Nano Lett., 2012, 12, 1690–1696 CrossRef CAS PubMed.
- M. Plodinec, I. Grčić, M. G. Willinger, A. Hammud, X. Huang, I. Panžić and A. Gajović, J. Alloys Compd., 2019, 776, 883–896 CrossRef CAS.
- H. Zhou and Y. Zhang, J. Phys. Chem. C, 2014, 118, 5626–5636 CrossRef CAS.
- I. Heng, C. W. Lai, J. C. Juan, A. Numan, J. Iqbal and E. Y. L. Teo, Ceram. Int., 2019, 45, 4990–5000 CrossRef CAS.
- Q. Wang, M. Li and Z. Wang, RSC Adv., 2019, 9, 7811–7817 RSC.
- L. Fornasini, S. Scaravonati, G. Magnani, A. Morenghi, M. Sidoli, D. Bersani, G. Bertoni, L. Aversa, R. Verucchi and M. Riccò, Carbon, 2021, 176, 296–306 CrossRef CAS.
- C. C. Raj, V. Srimurugan, R. Sundheep and N. Lakshman, Inorg. Chem. Commun., 2023, 148, 110286 CrossRef.
- A. H. Anwer, F. Abdulaziz, S. Latif, A. Alanazi, S. Sultana and M. Z. Khan, Mater. Sci. Eng., B, 2023, 291, 116367 CrossRef.
- R. Liu, W. Guo, B. Sun, J. Pang, M. Pei and G. Zhou, Electrochim. Acta, 2015, 156, 274–282 CrossRef CAS.
- A. Ramadoss and S. J. Kim, Carbon, 2013, 63, 434–445 CrossRef CAS.
- Y. Qiao, J. He, Y. Zhou, S. Wu, X. Li, G. Jiang, G. Jiang, M. Demir and P. Ma, ACS Appl. Mater. Interfaces, 2023, 15, 52381–52391 CrossRef CAS PubMed.
- L. Liu, G. Liu, S. Wu, J. He, Y. Zhou, M. Demir, R. Huang, Z. Ruan, G. Jiang and P. Ma, Ceram. Int., 2024, 50, 1970–1980 CrossRef CAS.
- R. Y. Hu, L. Y. Liu, J. H. He, Y. Zhou, S. B. Wu, M. X. Zheng, M. Demir and P. P. Ma, J. Energy Storage, 2023, 72, 108656 CrossRef.
- Z. Jiao, Y. Chen, M. Du, M. Demir, F. Yan, Y. Zhang, C. Wang, M. Gu, X. Zhang and J. Zou, J. Alloys Compd., 2023, 958, 170489 CrossRef CAS.
- R. H. Xu, P. P. Ma, G. F. Liu, Y. Qiao, R. Y. Hu, L. Y. Liu, M. Demir and G. H. Jiang, Energy Fuels, 2023, 37, 6158–6167 CrossRef CAS.
- C. Xiang, M. Li, M. Zhi, A. Manivannan and N. Wu, J. Mater. Chem., 2012, 22, 19161–19167 RSC.
- X. Sun, M. Xie, G. Wang, H. Sun, A. S. Cavanagh, J. J. Travis, S. M. George and J. Lian, J. Electrochem. Soc., 2012, 159, A364 CrossRef CAS.
- D. Yangbin, B. Wei, S. Jinhua, W. Yu, W. Chao, L. Chengbin, H. Yong and G. Jianxin, ACS Appl. Mater. Interfaces, 2016, 8, 12165–12175 CrossRef PubMed.
- H. Yin, S. Zhao, J. Wan, H. Tang, L. Chang, L. He, H. Zhao, Y. Gao and Z. Tang, Adv. Mater., 2013, 25, 6270–6276 CrossRef CAS PubMed.
- H. Kim, M. Y. Cho, M. H. Kim, K. Y. Park, H. Gwon, Y. Lee, K. C. Roh and K. Kang, Adv. Energy Mater., 2013, 3, 1500–1506 CrossRef CAS.
- Z. Zhang, F. Xiao, Y. Guo, S. Wang and Y. Liu, ACS Appl. Mater. Interfaces, 2013, 5, 2227–2233 CrossRef CAS PubMed.
- S. Yang, Y. Lin, X. Song, P. Zhang and L. Gao, ACS Appl. Mater. Interfaces, 2015, 7, 17884–17892 CrossRef CAS PubMed.
- V. H. Pham, T.-D. Nguyen-Phan, X. Tong, B. Rajagopalan, J. S. Chung and J. H. Dickerson, Carbon, 2018, 126, 135–144 CrossRef CAS.
- J. M. Macak, B. G. Gong, M. Hueppe and P. Schmuki, Adv. Mater., 2007, 19, 3027–3031 CrossRef CAS.
- L. A. Lyon and J. T. Hupp, J. Phys. Chem. B, 1999, 103, 4623–4628 CrossRef CAS.
- J. Gao, J. Xue, S. Jia, Q. Shen, X. Zhang, H. Jia, X. Liu, Q. Li and Y. Wu, ACS Appl. Mater. Interfaces, 2021, 13, 18758–18771 CrossRef CAS PubMed.
- T. S. Rajaraman, S. P. Parikh and V. G. Gandhi, Chem. Eng. J., 2020, 389, 123918 CrossRef CAS.
- S. Kalathil, M. M. Khan, S. A. Ansari, J. Lee and M. H. Cho, Nanoscale, 2013, 5, 6323–6326 RSC.
- S. Sharma and P. Chand, Results Chem., 2023, 5, 100885 CrossRef CAS.
- H. Zhang, L. Lin, B. Wu and N. Hu, J. Power Sources, 2020, 476, 228527 CrossRef CAS.
- K. G. Gallagher, S. E. Trask, C. Bauer, T. Woehrle, S. F. Lux, M. Tschech, P. Lamp, B. J. Polzin, S. Ha and B. Long, J. Electrochem. Soc., 2015, 163, A138 CrossRef.
- L. M. Peter, Electrochemical Impedance Spectroscopy and Related Techniques, 2023 Search PubMed.
- Z. Zhang, Y. Yuan, L. Liang, Y. Cheng, H. Xu, G. Shi and L. Jin, Thin Solid Films, 2008, 516, 8663–8667 CrossRef CAS.
- J. A. Castro, R. Quintero-Torres, N. R. de Tacconi, K. Rajeshwar and W. Chanmanee, J. Electrochem. Soc., 2010, 158, D84 CrossRef.
- T. Hecht, H. Winter, A. Borisov, J. Gauyacq and A. Kazansky, Phys. Rev. Lett., 2000, 84, 2517 CrossRef CAS PubMed.
- Q. Wang, X. Zong, L. Tian, Y. Han, Y. Ding, C. Xu, R. Tao and X. Fan, ChemSusChem, 2022, 15, e202102377 CrossRef CAS PubMed.
- S. Yang, Y. Li, J. Sun and B. Cao, J. Power Sources, 2019, 431, 220–225 CrossRef CAS.
- M. Machreki, T. Chouki, G. Tyuliev, D. A. Žigon, B. Ohtani, A. Loukanov, P. Stefanov and S. Emin, ACS Omega, 2023, 8, 21605–21617 CrossRef CAS PubMed.
Footnote |
| † Electronic supplementary information (ESI) available. See DOI: https://doi.org/10.1039/d4ma00199k |
| This journal is © The Royal Society of Chemistry 2024 |

