
 Open Access Article
 This Open Access Article is licensed under a Creative Commons Attribution-Non Commercial 3.0 Unported Licence
Reviving BVDT-TTF and EVT-TTF salts†
Federica
Solano
a,
Pascale
Auban-Senzier
b,
Bolesław
Barszcz
 c,
Arkadiusz
Frąckowiak
c,
Iwona
Olejniczak
c,
Pere
Alemany
d,
Enric
Canadell
*ef,
Nicolas
Zigon
*a and
Narcis
Avarvari
*a
c,
Arkadiusz
Frąckowiak
c,
Iwona
Olejniczak
c,
Pere
Alemany
d,
Enric
Canadell
*ef,
Nicolas
Zigon
*a and
Narcis
Avarvari
*a
aUniv Angers, CNRS, MOLTECH-ANJOU, SFR MATRIX, F-49000 Angers, France. E-mail: narcis.avarvari@univ-angers.fr; nicolas.zigon@univ-angers.fr
bUniversité Paris-Saclay, CNRS, UMR 8502, Laboratoire de Physique des Solides, 91405 Orsay, France
cInstitute of Molecular Physics, Polish Academy of Sciences, Smoluchowskiego 17, 60-179 Poznań, Poland
dDepartament de Ciència de Materials i Química Física and Institut de Química Teòrica i Computacional (IQTCUB), Universitat de Barcelona, Martí i Franquès 1, 08028 Barcelona, Spain
eInstitut de Ciència de Materials de Barcelona, ICMAB-CSIC, Campus de la UAB, 08193 Bellaterra, Spain. E-mail: canadell@icmab.es
fRoyal Academy of Sciences and Arts of Barcelona, Chemistry Section, La Rambla 115, 08002 Barcelona, Spain
First published on 30th January 2024
Abstract
Herein are reported the synthesis, in-depth structural description and conducting properties of various salts of the symmetric bis-vinylenedithio-tetrathiafulvalene (BVDT-TTF) and dissymmetric ethylene-vinylenedithio-tetrathiafulvalene (EVT-TTF). Compared to the omnipresent bis-ethylenedithio-tetrathiafulvalene (BEDT-TTF) these two closely related and easily synthesizable organic donors have been reported ca. 200 times less in the literature. Four new structures of organic conductors are herein investigated and analysed through a battery of techniques, including X-ray analysis on single-crystals, conductivity measurements, Raman spectroscopy and band structure calculations. All materials exhibit semiconducting behaviours with conductivities in the 10−3 to 10−1 S cm−1 range at RT and ambient pressure. The impact of the structural or electronic disorder on the conductivity and dimensionality of the salts is examined.
1. Introduction
The bis-ethylenedithio-tetrathiafulvalene (BEDT-TTF) donor is one of the most important representatives of the tetrathiafulvalene (TTF) family of electroactive precursors for molecular conductors and superconductors.1–6 Its radical cation salts are generally obtained by the electrocrystallization technique, a wide variety of counter-ions having been used so far,7,8 which allowed access to many high Tc superconductors (with Tc above 10 K).9–13 They often display a typical 2-D band structure thanks to efficient intra- and interstack orbital overlap interactions. For example, the BEDT-TTF salt with Cu [N(CN)]2X− (X = Cl, Br, I) is superconductive below 10 K,1 while α-BEDT-TTF2I3 is metallic at room temperature and superconducting below 1.4 K.14,15 Furthermore, their use in chiral salts or as ligands for metal complexes provided multifunctional materials where conductivity, chirality, luminescence, redox activity and/or magnetism are intrinsically linked.16–20On the other hand, the structurally related but unsaturated compounds bis-vinylenedithio-tetrathiafulvalene (BVDT-TTF) and ethylene-vinylenedithio-tetrathiafulvalene (EVT-TTF) have been far less reported in the literature. On the Scifinder database, over 5000 papers are reported for BEDT-TTF, while only 16 and 7 scientific reports do exist for BVDT-TTF21–31 and EVT-TTF,27,32–37 respectively. Amongst these, only 2 papers reported the X-ray structures of single-crystals for BVDT-TTF salts (PF6−)25,27 and two for EVT-TTF salts (PF6−, AsF6−, and Pt(CN)42−)27,36 despite the fact that early reports described conductive salts, though without structures, with the ReO4−, ClO4− or I3− anions, amongst others. Nogami et al. reported in a comparative study that the two-dimensional nature of the band structure is increasing in the series BVDT-TTF – EVT-TTF – BEDT-TTF along with the loss of unsaturation.27
The stringent lack of structural data on these organic donors, despite their close proximity with the ubiquitous BEDT-TTF structure, pushed us to investigate their combination with various anions and study in depth the structure–property relationship of the obtained materials. Herein, we report the modified synthesis of the organic donors EVT-TTF and BVDT-TTF, their electrocrystallization and X-ray structures of the corresponding radical cation salts. Conductivity measurements on single-crystals along with band structure calculations and Raman spectroscopy investigations unveil the charge-transport properties of these two under-reviewed organic donors.
2. Results and discussion
2.1 Synthesis of donors and of their crystalline radical cation salts
The EVT-TTF and BVDT-TTF syntheses have already been described in the literature through the elimination of an ethoxy leaving group for the formation of the unsaturated thione 2 as intermediate, with a ca. 15% yield.23 Here, the compound 2 was obtained in a 25% yield through refluxing (ethenylsulfinyl)benzene with the trithione 138 as reported by Garín et al. (Scheme 1).39 A direct phosphite-mediated coupling of 2 with ethylene-dithiol-one yielded a mixture of products unseparable on column chromatography. A phosphite mediated coupling of 2 with bis(thiopropionitrile)-dithiol-one afforded 3 in 36% yield, and subsequent deprotection in basic media in the presence of 1,2-dibromoethane yielded EVT-TTF in 78% yield.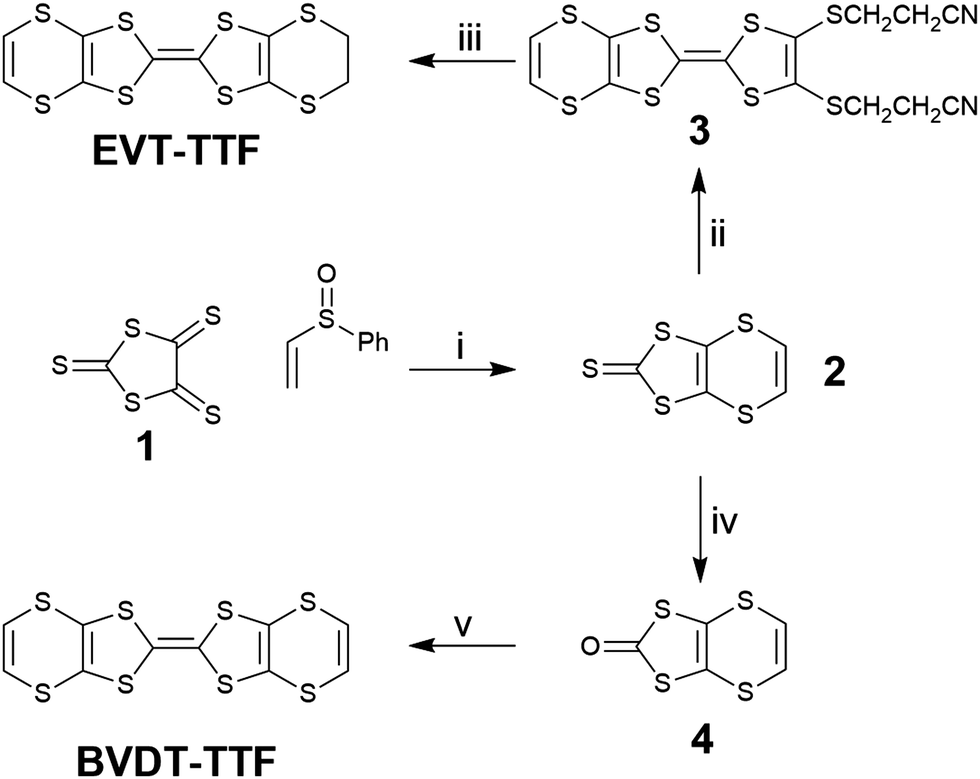 | ||
| Scheme 1 Synthesis of BVDT-TTF and EVT-TTF. (i) xylenes, Δ; (ii) bis(thiopropionitrile)-dithiol-one, P(OMe)3, Δ; (iii) EtONa, EtOH, 1,2-dibromoethane; (iv) Hg(OAc)2, CHCl3/AcOH, RT; (v) P(OMe)3, Δ. | ||
The ketone 4, obtained by transchalcogenation of the thione 2, self-reacts in a phosphite mediated coupling to obtain the BVDT-TTF with a 70% yield.
BVDT-TTF has yielded suitable single crystals when electrocrystallized in the presence of TaF6− or ReO4−, and EVT-TTF in presence of ClO4−. Furthermore, slow diffusion of I2 in a solution of BVDT-TTF provided crystals of triiodide salts of BVDT-TTF suitable for SCXRD, as reported elsewhere but without any crystal structure.26
Upon combination of BVDT-TTF and TBATaF6 in chloroform at RT with a 1 μA current for one week into an U-shaped cell, large purple blocks of BVDT-TTF(TaF6) were obtained. BVDT-TTF stands in its radical cationic form. The crystal is in the orthorhombic Pnnm space group, the measurement was made at 200 K (Table S1, ESI†) and the asymmetric unit contains one fourth of a donor and one fourth of an anion, without any additional guest or solvent molecules. The plane defined by the bis-thiovinylene moieties of BVDT-TTF is tilted by a 131.7° angle regarding to the plane defined by the eight sulphur atoms of the molecule, with an inversion centre lying on the central bond and a mirror plane running along this central C![[double bond, length as m-dash]](https://www.rsc.org/images/entities/char_e001.gif) C bond (Fig. 1). BVDT-TTF forms 1-D stacks along the a-axis where the planes between two molecules are distant of 3.67 Å, which also corresponds to the shortest observed S–S distance of 3.678(2) Å. Adjacent 1-D stacks form a H-bonded network along the b-axis with the TaF6− anions, characterized by dCH⋯F of 2.45 and 2.81 Å. Finally, lateral S–S interactions between BVDT-TTF molecules standing in two different 1-D stacks are observed with dS–S = 3.564(2) Å (Fig. 1(a) – highlighted in red). Therefore, an anisotropic band structure (see below) with a strong dispersion along the a axis is expected.
C bond (Fig. 1). BVDT-TTF forms 1-D stacks along the a-axis where the planes between two molecules are distant of 3.67 Å, which also corresponds to the shortest observed S–S distance of 3.678(2) Å. Adjacent 1-D stacks form a H-bonded network along the b-axis with the TaF6− anions, characterized by dCH⋯F of 2.45 and 2.81 Å. Finally, lateral S–S interactions between BVDT-TTF molecules standing in two different 1-D stacks are observed with dS–S = 3.564(2) Å (Fig. 1(a) – highlighted in red). Therefore, an anisotropic band structure (see below) with a strong dispersion along the a axis is expected.
 | ||
| Fig. 1 X-ray crystal structure of BVDT-TTF(TaF6) viewed along (a) the a axis and (b) the c axis (carbon: grey; sulphur: yellow; tantalum: blue; fluorine: green; hydrogen: white). For the sake of clarity the TaF6− anions have been removed on (b). | ||
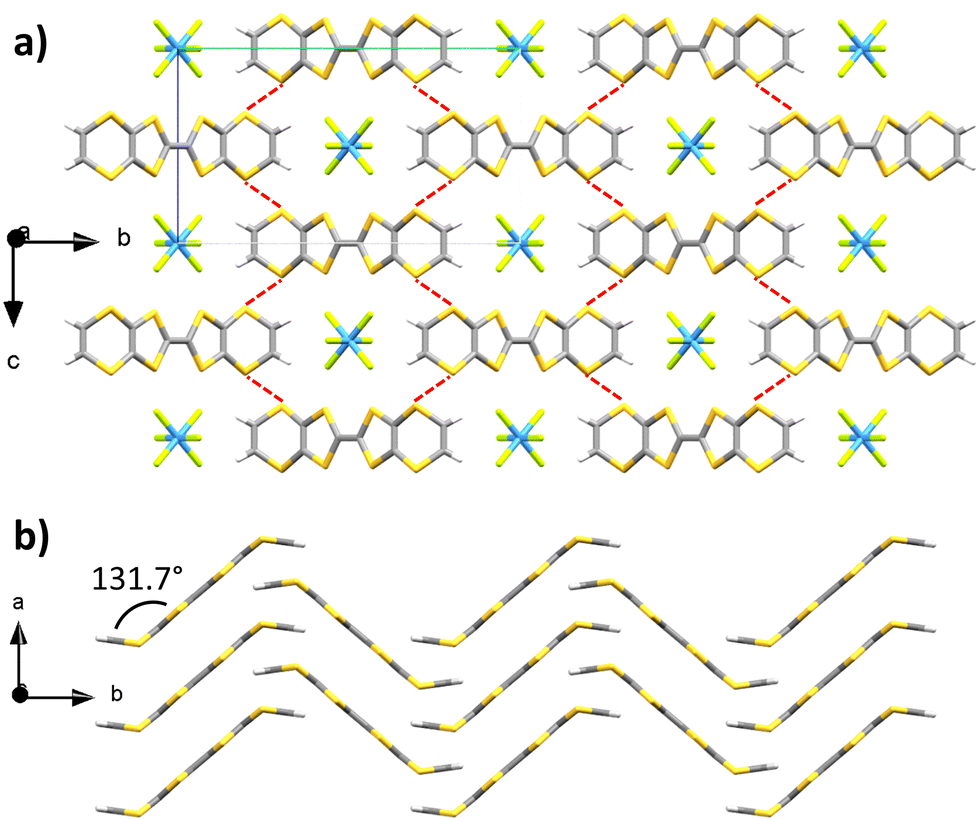
Upon diffusion of I2 vapours into a solution of BVDT-TTF in dichloromethane, large purple plates were obtained and characterized by SCXRD. The space group is orthorhombic Pnma, the measurement was made at 200 K (Table S1, ESI†) and the asymmetric unit contains one half of a BVDT-TTF and one fifth of a disordered I3− molecule. Raman spectroscopy confirmed the presence of I3− but also the presence of L-shaped I5− (see the ESI†). The molecule of BVDT-TTF is bent with a 132.5° angle between the vinylene moiety and the plane defined by the eight sulphur atoms (Fig. 2(c)). The molecules are stacking along the a axis, with an intermolecular distance of 3.46 Å between the planes of two molecules (Fig. 2(a) and (c)), but a shortest S–S distance of 3.73(6) Å. The larger S–S distance compared to BVDT-TTF(TaF6) is related to a sliding of the molecules along the axis of the stacks, and thus the sulphur atoms are not perfectly standing one above the other. Molecules from two adjacent stacks form numerous lateral S–S interactions in the 3.45 to 3.77 Å range, thus creating a dispersive band in the ab plane (Fig. 2(b)). The triiodide ions are strongly disordered along the a axis. In the Fig. 2(d) are represented the three disordered positions in blue, white and red colours. The occupancies are given for the iodine atoms in red. If only the red atoms are considered, the distances between two iodine atoms are in the 2.84–2.85 (2) Å range, which is typical for an I–I covalent bond. Three atoms with 40–20–40% occupancies, respectively, are almost perfectly co-linear with a 179.2° angle. This represents one triiodide molecule with a 20% occupancy, both external atoms having a 40% occupancy shared with the next molecule in the chain (of the same colour). The next three red atoms with 20–40–20% occupancies, respectively, form a 170.7° angle. The presence of I3− was confirmed by Raman spectroscopy (see below and ESI†) along with I5− that we could not directly observe crystallographically.
 | ||
| Fig. 2 X-ray crystal structure of (BVDT-TTF)2.5(I3) (a) viewed along the a axis. Details showing (b) the intermolecular S–S distances between two molecules from adjacent stacks viewed along the a axis, (c) a side-view along the b axis of a single stack of BVDT-TTF and (d) a schematized view of the disorder of the triiodide counter-anions along the b axis (carbon: grey; sulphur: yellow; iodine: purple; hydrogen: white). | ||
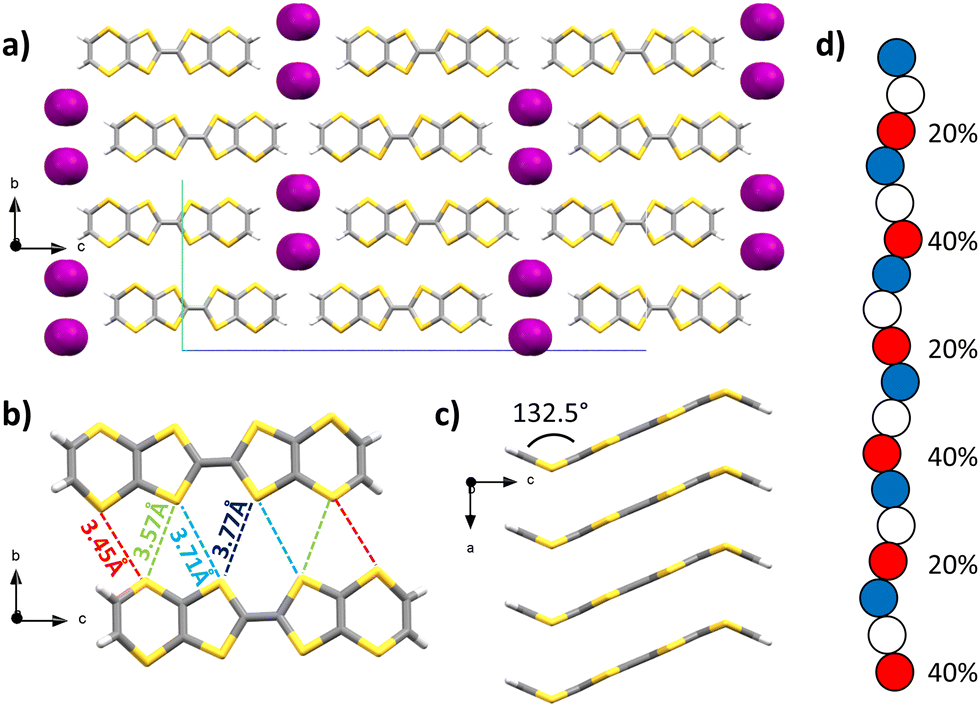
Upon combination of BVDT-TTF and TBAReO4 in tetrachloroethane at RT with a 1 μA current for 1 week into an U-shaped cell, small plate crystals of (BVDT-TTF)2(ReO4) were obtained. Several crystalline plates were overlayed, thus the crystals were subject to twinning. The space group is monoclinic C2/m and the measurement was made at 200 K (Table S1, ESI†) and the asymmetric unit contains half of a BVDT-TTF and one molecule of disordered ReO4− with a 25% occupancy. The BVDT-TTF is bent, with a 133.3° angle between the vinylene group and the plane defined by the eight sulphur atoms (Fig. 3(c)). The overall packing motif is reminiscent of the one obtained with (BVDT-TTF)2.5(I3) (Fig. 3(a)). Here, the molecules form stacks along the c-axis, with intermolecular distances of 3.50 Å between the two molecular planes (Fig. 3(a) and (c)) and S–S distances between 3.725(6) and 3.825(7) Å. As represented on Fig. 3(b), two BVDT-TTF molecules from adjacent stacks are engaged in a series of S–S interactions, with intermolecular dS–S in the 3.43–3.81 Å range, thus creating a dispersive band in the bc plane. The perrhenate anions are disordered over 4 positions along the c axis, and are engaged in H-bonding through their oxygen atoms and the vinylic C–H, with distances dCH–O in the 2.45–2.76 Å range.
 | ||
| Fig. 3 X-ray crystal structure of (BVDT-TTF)2(ReO4) (a) viewed along the c axis. Details showing (b) the intermolecular S–S distances between two molecules from adjacent stacks viewed along the c axis, and (c) a side-view along the b axis of one stack of BVDT-TTF (carbon: grey; sulphur: yellow; rhenium: blue; oxygen: red; hydrogen: white). | ||
EVT-TTF provided crystals with perchlorate counter-ions in dichloromethane with a 1 μA current after 1 week. The X-ray crystal structure is resolved in the monoclinic P21/c space group and the measurement was made at 297 K (Table S1, ESI†). The asymmetric unit contains one EVT-TTF molecule along with a ClO4− anion disordered over two positions with 50%/50% occupancies, and half of a dichloromethane molecule. The angle between the vinylidene moiety and the plane of the molecule is 130.9°. The ethylene group is not disordered. Two donors are forming a head-to-tail dimer whose planes are separated by 3.42 Å (Fig. 4(b)). These dimers are surrounded by perchlorate and dichloromethane molecules. Two adjacent dimers are connected through lateral S–S interactions along the ac plane with distances in the 3.67–3.98 Å range, thus creating a conducting pathway along the ac plane.
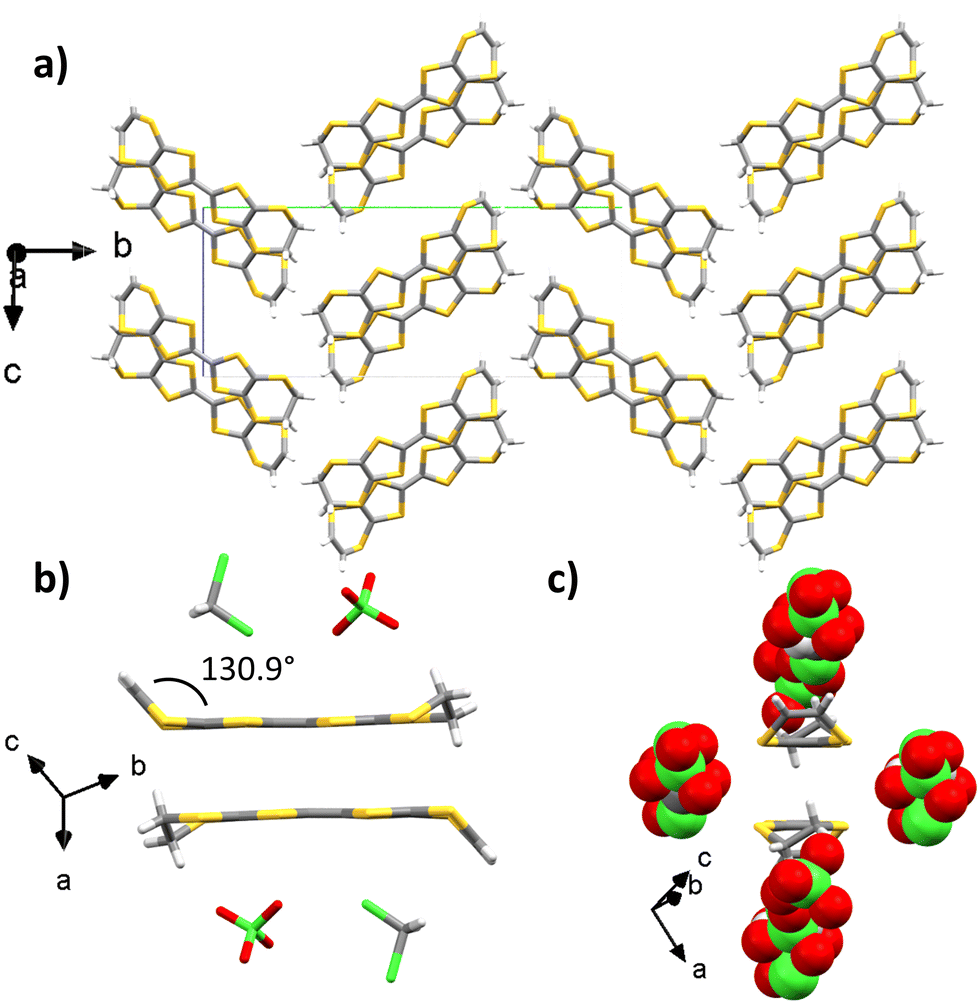 | ||
| Fig. 4 X-ray crystal structure of (EVT-TTF)(ClO4)·0.5(CH2Cl2) (a) viewed along the a axis. Details showing (b) a side-view of the EVT-TTF dimer and (c) a front-view of the EVT-TTF dimer (for the sake of clarity, solvent molecules and anions have been omitted on (a), and disordered molecules have been omitted for the sake of clarity on (b) and (c) (carbon: grey; sulphur: yellow; chlorine: green; oxygen: red; hydrogen: white)). | ||
Guionneau et al. have shown that the charge of a BEDT-TTF molecule was directly correlated to the bond lengths.40 Interestingly, this method is transferable to the BVDT-TTF and EVT-TTF scaffolds thanks to their resemblance with the BEDT-TTF (Table 1). For (BVDT-TTF)2(ReO4), the lower X-ray data quality is at the origin of the mismatch between the experimental and calculated values, and the calculated value is indicated in brackets.
| Donor | Anion | Stoichiometry | Calculated charge of the organic donor40 | Single crystal conductivity (S cm−1, 290 K) |
|---|---|---|---|---|
| BVDT-TTF | TaF6− | 1![[thin space (1/6-em)]](https://www.rsc.org/images/entities/char_2009.gif) :1 :1 |
+1.03 | 5 × 10⁻² |
| BVDT-TTF | I3− | 2.5:1 |
+0.27 | 3.5 × 10⁻² |
| BVDT-TTF | ReO4− | 2:1 |
(−0.2)* | 2 × 10⁻³ |
| EVT-TTF | ClO4− | 1:1 |
+1.09 | 2 × 10⁻² |
Conductivity measurements were performed on single crystals with a two-contact method, due to the limited size of the crystalline samples. One crystal of (EVT-TTF)(ClO4) was large enough to be measured with a four-probe method and gave similar resistivity values, indicating that the contact resistance is not predominant in these systems. Despite different stoichiometries, all compounds exhibit room temperature conductivities between 10−3 and 0.5 × 10⁻¹ S cm−1 (Table 1) and semi-conducting behaviours when cooling down (Fig. S1–S3 ESI†).
2.2 Band structure calculations
The correlation between crystal structure and transport properties of the reported salts was studied by means of first-principles DFT (density functional theory) calculations for (BVDT-TTF)2.5(I3), BVDT-TTF(TaF6) and EVT-TTF(ClO4)·0.5(CH2Cl2). The X-ray data quality for (BVDT-TTF)2(ReO4) was not sufficient for calculations.(BVDT-TTF)2.5(I3) and BVDT-TTF(TaF6) contain uniform donor chains, although the short S⋯S contacts build a 3D lattice in the second but a 2D one in the first. In contrast, EVT-TTF(ClO4)·0.5(CH2Cl2) contains chains of donor dimers building a 2D lattice of short S⋯S contacts.
The calculated band structure for EVT-TTF(ClO4)·0.5(CH2Cl2) is shown in Fig. 5. Since the unit cell contains two layers of dimerized chains (four donor molecules per unit cell), the band structure contains two pairs of bands, each one associated with one layer and mostly build from the HOMO (highest occupied molecular orbital) of the donors. The two bands in each pair are practically degenerate because there are no short interlayer S⋯S contacts. The splitting between the two HOMO levels in an isolated dimer is calculated to be ≈0.48 eV and this is also the separation between the centres of the two pairs of bands in Fig. 5. Thus, the lower/upper pair of bands are built from the bonding/antibonding combinations of the HOMOs within the dimers. Because of substantial HOMO–HOMO overlaps, the two pairs of bands acquire dispersion along both the chain (Γ–X) and the inter-chain (Γ–Z) directions and on account of the 1:1 stoichiometry only the lower pair of bands is filled. The bottom of the empty bands and the top of the filled bands occur at the R point and they are separated by a gap of 76 meV.
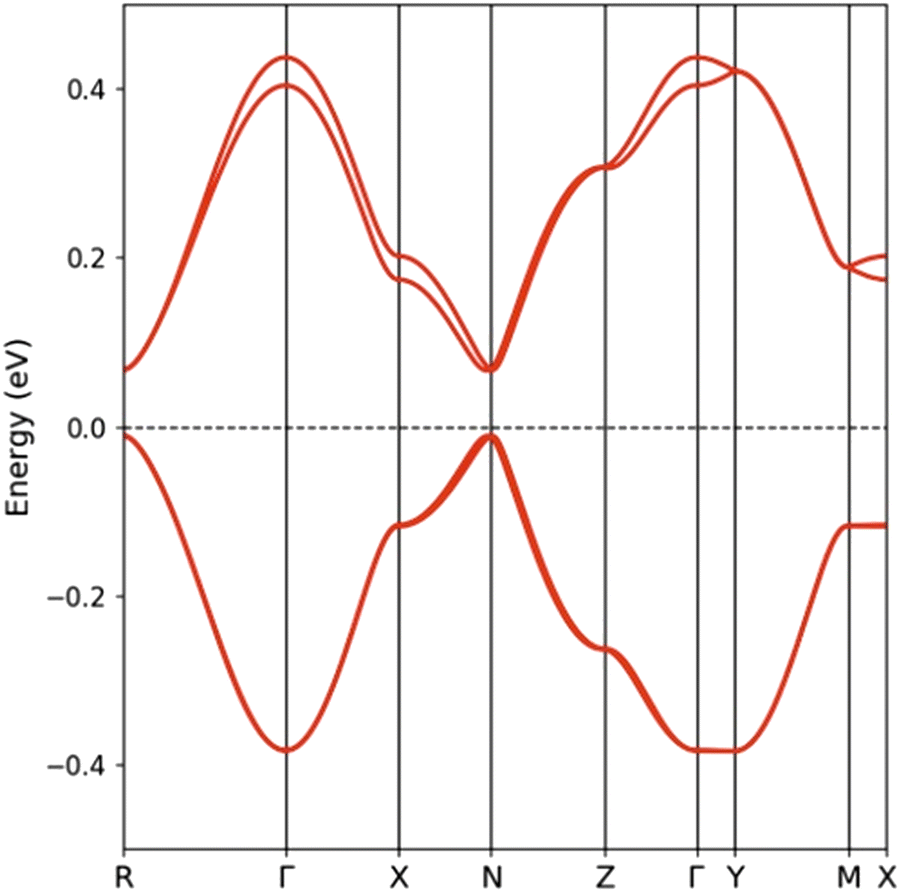 | ||
| Fig. 5 Band structure for EVT-TTF(ClO4)·0.5(CH2Cl2) where Γ = (0, 0, 0), X = (a*/2, 0, 0), Y = (0, b*/2, 0), Z = (0, 0, c*/2), M = (a*/2, b*/2, 0), N = (a*/2, 0, c*/2) and R = (a*/2, b*/2, c*/2). Because of disorder, only donor molecules were included explicitly in the calculation while anions and solvent molecules were replaced by a uniform background charge. | ||
The unit cell of the orthorhombic structure of BVDT-TTF(TaF6) (see Fig. 1) contains two uniform donor chains which build a 3D lattice of S⋯S interactions. The DFT band structure assuming double occupation of the levels is shown in Fig. 6 (note that a double cell along the chain direction (a) has been used so that the two bands are folded in this figure). The two bands exhibit a large dispersion along the chain direction (Γ–X) but a very small one along the other directions (Γ–Y and Γ–Z). Because of the 1:1 stoichiometry only half of the levels are filled and the salt would be predicted to be a 1D metal according to these calculations. The Fermi surface is strongly 1D, i.e. contains very slightly warped parallel lines, and thus a metal-to-insulator transition associated with a dimerization along the chains would be predicted. The fact that the 290 K conductivity measurements indicate a semiconducting behaviour and the 1:1 stoichiometry suggests that, despite the substantial band dispersion, electronic repulsions take over and localize one unpaired electron on each donor. To test this idea we carried out spin-polarized calculations using a double unit cell along the chain direction to be able to consider an antiferromagnetic situation. The AF state was calculated to be the ground state of the system and is found to be 28.0 meV per donor more stable than the metallic state. Note the large gap opened in the band structure of the AF state (see Fig. 6(b)) which is almost twice larger than in the (BVDT-TTF-Py4)˙+–CdCl2–I3− salt of a related donor for which the stabilization of the AF state with respect to the metallic state is very similar (34.0 meV per donor).41 The width of the partially filled band in the present compound is very large (∼0.8 eV, between two and three times larger than in (BVDT-TTF-Py4)˙+–CdCl2–I3−) thus providing a strong bias for electronic delocalization so that strong antiferromagnetic interactions are needed to stabilize the localized state. The semiconducting character of the EVT-TTF(ClO4)·0.5(CH2Cl2) and BVDT-TTF(TaF6) salts have thus completely different origins, i.e. structural vs electronic dimerization, respectively.
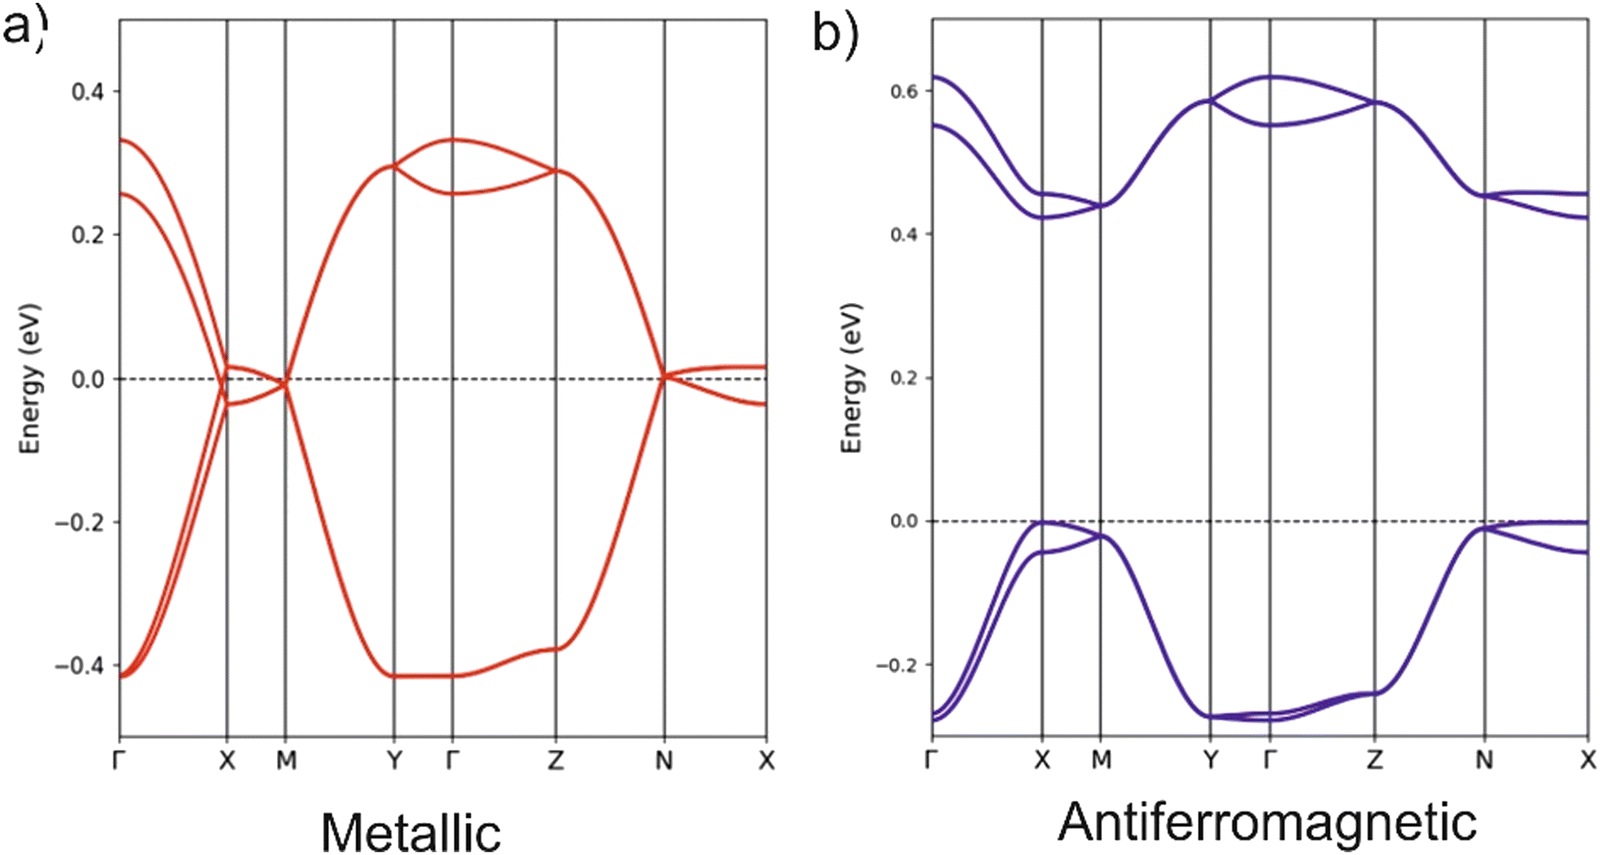 | ||
| Fig. 6 Band structure for the (a) metallic and (b) antiferromagnetic (along a), states of BVDT-TTF(TaF6) using a double cell along a. The energy zero refers to the highest occupied state in both cases and Γ = (0, 0, 0), X = (a'*/2, 0, 0), Y = (0, b*/2, 0), Z = (0, 0, c*/2), M = (a'*/2, b*/2, 0) and N = (a'*/2, 0, c*/2) where a' = 2a. In (b) the spin-up and spin-down bands are shown in blue and red, respectively. However, since the spin-up and spin-down bands are identical, although located in spatially different but equivalent sites, they superpose and only the blue bands are visible. | ||
The crystal structure for the (BVDT-TTF)2.5(I3) salt contains uniform donor chains similar to those of BVDT-TTF(TaF6). However, the chains in (BVDT-TTF)2.5(I3) are not really uniform because of the disorder in the anionic sublattice and the determined crystal structure is an average structure where the donor chains are apparently uniform. The inter-planar donor separation is now 0.21 Å shorter, so that bands with stronger dispersion along the chains (a-direction) can be expected. At the same time, there are more and shorter inter-chain S⋯S contacts, so that a 2D character may be anticipated in the ab layers. The DFT band structure for the hypothetical metallic state is reported in Fig. 7(a). The two bands along the directions parallel to chains are separated by a shift of around 0.1 eV, whereas they were almost superposed in BVDT-TTF(TaF6). This clearly indicates a stronger interaction between the chains in (BVDT-TTF)2.5(I3) and thus a more pronounced 2D behaviour. However, in contrast with the initial expectations, the band dispersion along the chains (Γ–X) is now around 28% smaller. The reason is that the HOMO–HOMO overlap along the chain is a bit different in the two salts because of the different interaction with the anions. In BVDT-TTF(TaF6), six of the S atoms are just on top of those of the adjacent donor so that the six pairs of S pz orbitals of the HOMO interact very strongly. In (BVDT-TTF)2.5(I3) there is a sliding of one donor with respect to the adjacent one and the interaction is thus smaller, even if the inter-planar separation is shorter. A very important feature of the present salt is that there is one hole every 2.5 donors, i.e. the bands are 3/5-filled, whereas in BVDT-TTF(TaF6) they are half-filled. Both the larger filling of the bands and the stronger inter-chain interactions make the hypothetical metallic state associated with Fig. 7(a) less 1D. In fact, the calculated Fermi surface contains both 1D and 2D contributions.
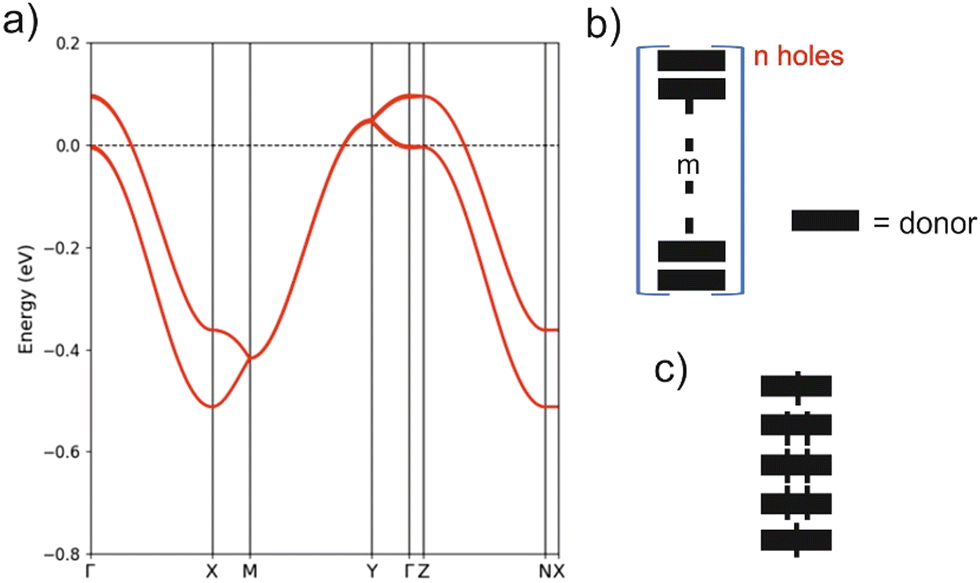 | ||
| Fig. 7 (a) Band structure for the hypothetical metallic state of (BVDT-TTF)2.5(I3) where Γ = (0, 0, 0), X = (a*/2, 0, 0), Y = (0, b*/2, 0), Z = (0, 0, c*/2), M = (a*/2, b*/2, 0) and N = (a*/2, 0, c*/2). Discrete (donorm)n+ (b) and (donor5)2+ (c) units discussed in the text. | ||
The high but activated conductivity of (BVDT-TTF)2.5(I3) could be attributed to the effect of the electron repulsions and this idea will be tested by carrying out spin-polarized calculations. However, let us first consider the strong disorder of the I3− groups, which must also play a very relevant role. It is well established that the hydrogen bonding interaction between the hydrogen atoms of the donors and the two outer iodine atoms of the I3− groups, which are those bearing the charge, plays a crucial role in molecular conductors.4 For instance, these interactions are at the origin of the long debated charge-ordering transition of α-(BEDT-TTF)2I3.42,43 The Hdonor⋯I interactions will certainly induce small breaks in the uniformity of the chains (either through donor sliding, donor–donor separations or intra-donor changes) leading to the creation of a disordered set of (donorm)n+ units (Fig. 7(b)). For instance, that shown in Fig. 7(c) would be especially well adapted to an average +0.4 charge although the real chain is certainly not an ordered succession of such units. Some delocalization of the spin density within the m donor units certainly occurs in comparison to the localized case depicted in Fig. 7. By combining units with different n and m values, the average 1:2.5 stoichiometry of the structure of (BVDT-TTF)2.5(I3) can be obtained. The creation of these disorder-induced units will structurally localize the electrons and create small energy gaps responsible for the activated, but relatively high conductivity of the salt.
The role of electron repulsions in localising the electrons was assessed through spin-polarized calculations using a uniform background instead of real anions and the uniform structure of the chain. A proper consideration of antiferromagnetic interactions for the 1:2.5 stoichiometry or similar ones requires the use of large unit cells along the chain. For instance, a cell with ten donors along the chain is required for the present salt. Consequently, we have carried out spin-polarized calculations for an isolated chain as in (BVDT-TTF)2.5(I3) with different average charges and introduced ferromagnetic or antiferromagnetic interactions. However, we could not stabilize any gapped localized state with ferromagnetic or antiferromagnetic interactions along the chain in the case of a +0.4 average charge. This result may be surprising when noting that the calculated band dispersion along the chains is smaller than in EVT-TTF(ClO4)·0.5(CH2Cl2) thus suggesting a smaller bias for delocalization. However, it is in agreement with more formal condensed matter approaches showing that the proclivity to localization because of electron repulsions is maximal for a half-filled band.44 We thus believe that the electronic repulsions are not especially relevant to understand the activated nature of the conductivity of (BVDT-TTF)2.5(I3) and conclude that the conductivity in this salt is essentially governed by the disorder due to local distortions induced by the Hdonor⋯I interactions that break the uniformity of the donor chains. Otherwise, the system could be metallic. Consequently, although pressure may certainly increase the conductivity by strengthening HOMO–HOMO interactions and lead to an increase of the bandwidth, a real metallic behaviour is not expected to be achieved as long as a strong anion disorder persists.
The activated conductivity of the three salts examined here originates from three different mechanisms. The two salts with a 1:1 stoichiometry exhibit two different types of dimerization: a structural dimerization in EVT-TTF(ClO4)·0.5(CH2Cl2) but an electronic dimerization (i.e. antiferromagnetism) in BVDT-TTF(TaF6). The conductivity is thus determined by the magnitude of the band gap and the shape of the bands around this gap in the first salt, but by the strength of the electronic repulsions in the second. In contrast, the high but activated conductivity of (BVDT-TTF)2.5(I3) is governed by the small gaps induced by disorder. In fact, if it were not for disorder, this salt would most likely exhibit a quite stable metallic behaviour because of the simultaneous occurrence of robust chains, the uncommon 1:2.5 stoichiometry and relatively strong inter-chain interactions. The proclivity of BVDT-TTF to build up robust chains, because of the planarity and easiness to bend of the bis-thiovinylene moieties, offers the possibility to control the structural and transport properties of its most likely pseudo-one-dimensional radical cation salts. As shown by BVDT-TTF(TaF6) and (BVDT-TTF)2.5(I3), both the strength of the intra-chain interactions (induction of slight sliding) and the inter-chain interactions (very weak vs. substantial coupling of the chains) can be tuned with appropriate anion changes.
2.3 Raman spectroscopy
Similar to a wide range of the low-dimensional molecular conductors,45 the crystal structure of the BVDT-TTF and EVT-TTF salts is characterized by the presence of two-dimensional interactions between donor molecules in the conducting layer. On the other hand, unlike BEDT-TTF and many others TTF-derived donor molecules, both BVDT-TTF and EVT-TTF exhibit significant bending that leads to a unique arrangement of the donor molecule stacks in the crystal structure. Nevertheless, considering the shape of the frontier orbitals for BVDT-TTF (Fig. 8) and EVT-TTF (Fig. 9), which show a charge density mostly concentrated in the flat central part of the molecules, we can expect the presence of similar Mott or charge-ordered insulating phases which depend on the strength of the onsite and intersite electronic Coulomb correlations within the structure and differ in the charge distribution.45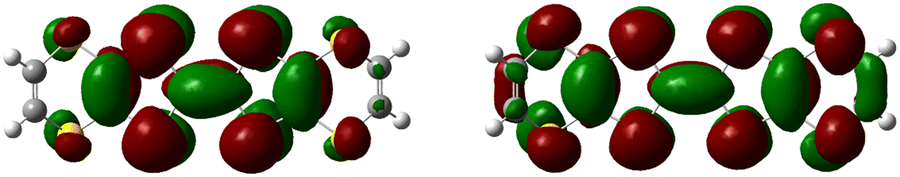 | ||
| Fig. 8 Frontier molecular orbitals: HOMO (highest occupied molecular orbital) of the neutral BVDT-TTF (left), and α-SOMO (single occupied MO) of the BVDT-TTF*+ radical cation (right), calculated by DFT methods. | ||
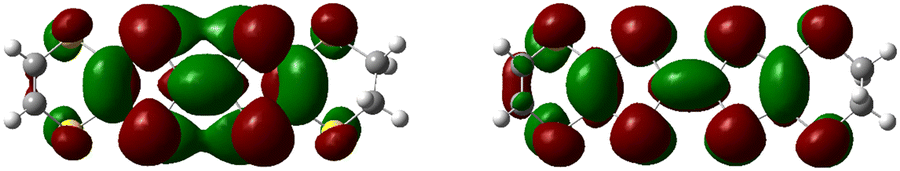 | ||
| Fig. 9 Frontier molecular orbitals: HOMO (highest occupied molecular orbital) of the neutral EVT-TTF (left), and α-SOMO (single occupied MO) of the EVT-TTF*+ radical cation (right), calculated by DFT methods. | ||
In order to estimate the oxidation states of the BVDT-TTF and EVT-TTF molecules in their salts, Raman spectroscopy was used similarly to reports for BEDT-TTF salts,46 in combination with the DFT calculations of the vibrational modes for the neutral and the radical cation with the charge +1e. We focused on the CC stretching mode, which is observed in the frequency range 1300–1600 cm−1 and characterized by a strong and linear frequency dependence on charge.47,48 The schematic pattern of the mode labelled as νC for the BVDT-TTF and EVT-TTF cations is shown in Fig. 10 (upper panels). While the νC mode is restricted to the central double CC bond in the case of BVDT-TTF, it also involves out-of-phase stretching of the two lateral double CC bonds for EVT-TTF.
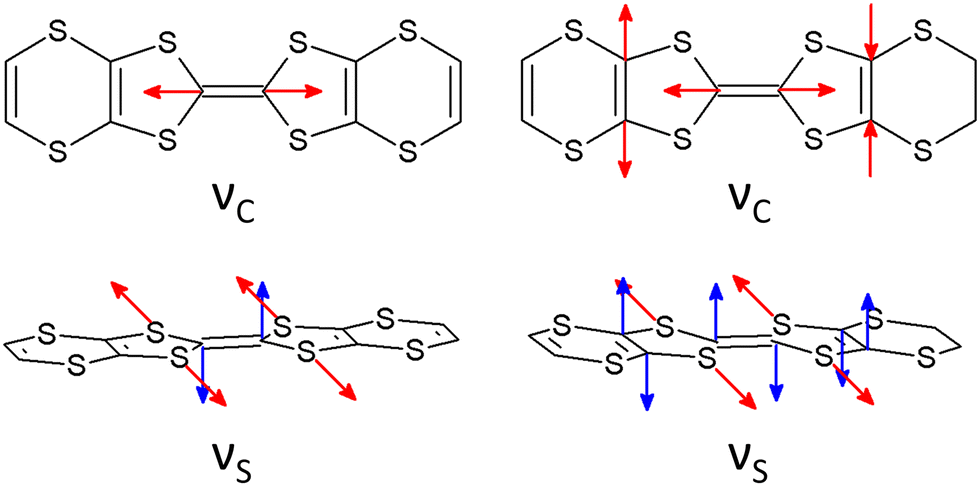 | ||
| Fig. 10 The schematic patterns of the charge-sensitive CC stretching νC mode (upper panels) and the out-of-plane C–S stretching νS mode (lower panels) of the BVDT-TTF*+ cation (left) and the EVT-TTF*+ cation (right), based on the DFT calculations. | ||
Fig. 11 shows the room temperature Raman spectra of (BVDT-TTF)(TaF6), (BVDT-TTF)2(ReO4), (BVDT-TTF)2.5(I3), and (EVT-TTF)(ClO4) in the frequency range of the stretching CC vibrations together with the theoretical Raman spectra of the isolated BVDT-TTF and EVT-TTF donor molecules, both the neutral and the cation. The νC mode appears in the theoretical spectra at about 1500 cm−1 for the neutral and at 1382 cm−1 for the cation, resulting in a frequency difference of about 120 cm−1 upon oxidation of BVDT-TTF/EVT-TTF, similar to BEDT-TTF.46 The Raman spectra of (BVDT-TTF)(TaF6), (BVDT-TTF)2(ReO4), and (BVDT-TTF)2.5(I3) in Fig. 11(a) are characterized by a broadened shape, suggesting a semiconducting behaviour with a low-lying electronic charge transfer excitation that can couple with CC stretching modes due to the electron-molecular vibration (EMV) coupling.46 We assign the broad features, at ∼1416 cm−1 as the νC mode of BVDT-TTF+1, and at ∼1474 cm−1 as the νC mode of BVDT-TTF+0.5/0.4. Taking the stoichiometry into account, the formal charge on the BVDT-TTF donor molecule is +1e for (BVDT-TTF)(TaF6), +0.5e for (BVDT-TTF)2(ReO4), and +0.4e for (BVDT-TTF)2.5(I3). Therefore, the presence of both BVDT-TTF+1 and BVDT-TTF+0.5/0.4 molecules in the structure of these three salts with different stoichiometries suggests some degree of disorder and/or charge-ordering in the conducting plane. Unlike the other materials presented here, the Raman spectrum of (EVT-TTF)(ClO4)·0.5(CH2Cl2) (Fig. 11(a)) in the 1350–1500 cm−1 frequency range shows three relatively narrow features that are close to the corresponding modes in the theoretical spectrum of the EVT-TTF cation, both in terms of frequencies and relative intensities (Fig. 11(b)). Thus, only EVT-TTF+1 cations are present in the structure, in agreement with the stoichiometry. The frequencies of the νC mode are summarized in Table 2.
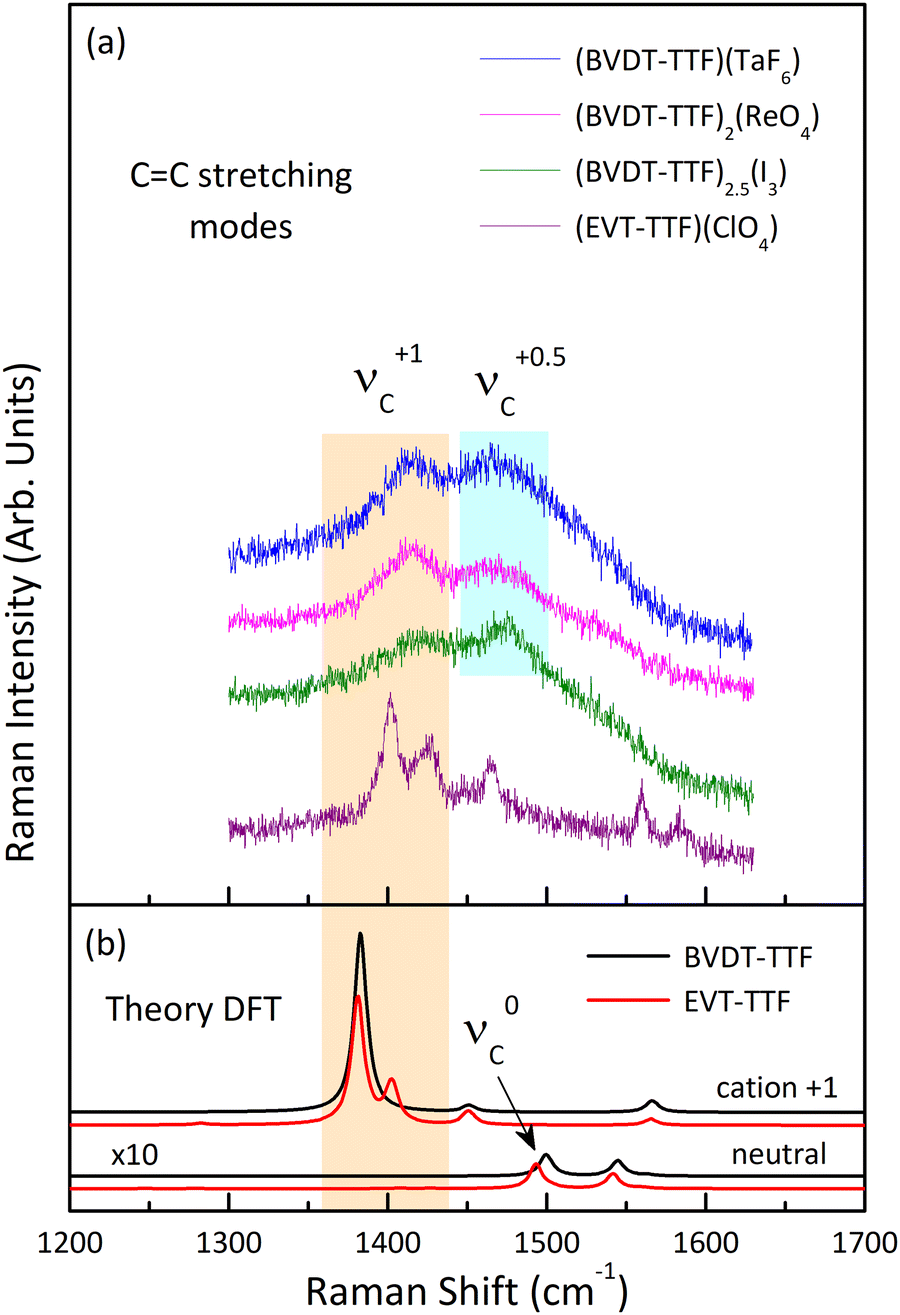 | ||
| Fig. 11 (a) Raman spectra of (BVDT-TTF)(TaF6), (BVDT-TTF)2(ReO4), (BVDT-TTF)2.5(I3), and (EVT-TTF)(ClO4)·0.5(CH2Cl2) measured at room temperature with the 632.8 nm excitation line, in the frequency range of the CC stretching vibrations; the spectra show the presence of the νC modes associated with the donor molecules of charge +1e and +0.5e; (b) theoretical Raman spectra of the isolated BVDT-TTF and EVT-TTF donor molecules, both the neutral and the cation, calculated at the B3LYP/6-31++G(d,p) level of theory; the theoretical spectra of the neutral BVDT-TTF and EVT-TTF have been multiplied by a factor of 10. The spectra in both panels are offset for clarity. | ||
C stretching νC mode of BVDT-TTF/EVT-TTF for the neutral ν0C, the cation ν+0.5/0.4C, and the cation ν+1C, in experimental Raman spectra of (BVDT-TTF)(TaF6), (BVDT-TTF)2(ReO4), (BVDT-TTF)2.5(I3), (EVT-TTF)(ClO4)·0.5(CH2Cl2), BVDT-TTF0, and EVT-TTF0, and calculated (DFT) Raman spectra for BVDT-TTF and EVT-TTF
| ν 0C | ν +0.5/0.4C | ν +1C | |
|---|---|---|---|
| a Theory level: B3LYP/6-31++G(d,p), scaled with a 0.9614 factor. | |||
| (BVDT-TTF)(TaF6) | — | ∼1474 | ∼1416 |
| (BVDT-TTF)2(ReO4) | — | ∼1474 | ∼1416 |
| (BVDT-TTF)2.5(I3) | — | ∼1476 | ∼1416 |
| (EVT-TTF)(ClO4)·0.5(CH2Cl2) | — | — | 1402 |
| BVDT-TTF0 | 1506 | — | — |
| EVT-TTF0 | 1504 | — | — |
| BVDT-TTF (DFT) | 1500 | — | 1382 |
| EVT-TTF (DFT) | 1493 | — | 1381 |
Fig. 12(a) shows the room temperature Raman spectra of (BVDT-TTF)(TaF6), (BVDT-TTF)2(ReO4), (BVDT-TTF)2.5(I3), and (EVT-TTF)(ClO4)·0.5(CH2Cl2) in the frequency range of the stretching CS vibrations. Here, the strong feature centred between 503 cm−1 in (BVDT-TTF)(TaF6) and 510 cm−1 in (EVT-TTF)(ClO4)·0.5(CH2Cl2) is attributed to the so-called “breathing mode” labelled νS (Fig. 10), which appears in the theoretical spectra at about 500 cm−1 (Fig. 12(b)). This mode is characteristic of the radical cation spectra. The equivalent of this vibration for BEDT-TTF is known to be strongly coupled to the electronic background.48,49 Therefore, the significantly broadened shape in the case of (BVDT-TTF)(TaF6), (BVDT-TTF)2(ReO4), and (BVDT-TTF)2.5(I3) suggests the proximity of the charge transfer excitation. This conclusion is further confirmed by the optical conductivity spectrum for (BVDT-TTF)2(ReO4) in Fig. 12(c), where we observe a broad charge transfer (CT) electronic band at about 2000 cm−1 together with the strong vibronic shape at ∼1500 cm−1 resulting from the EMV coupling of the νC mode. On the other hand, the optical conductivity spectrum of (EVT-TTF)(ClO4)·0.5(CH2Cl2) (Fig. 12(d)) with the electronic band centred at about 6000 cm−1 confirms that the 1:1 salt has an insulating character.49
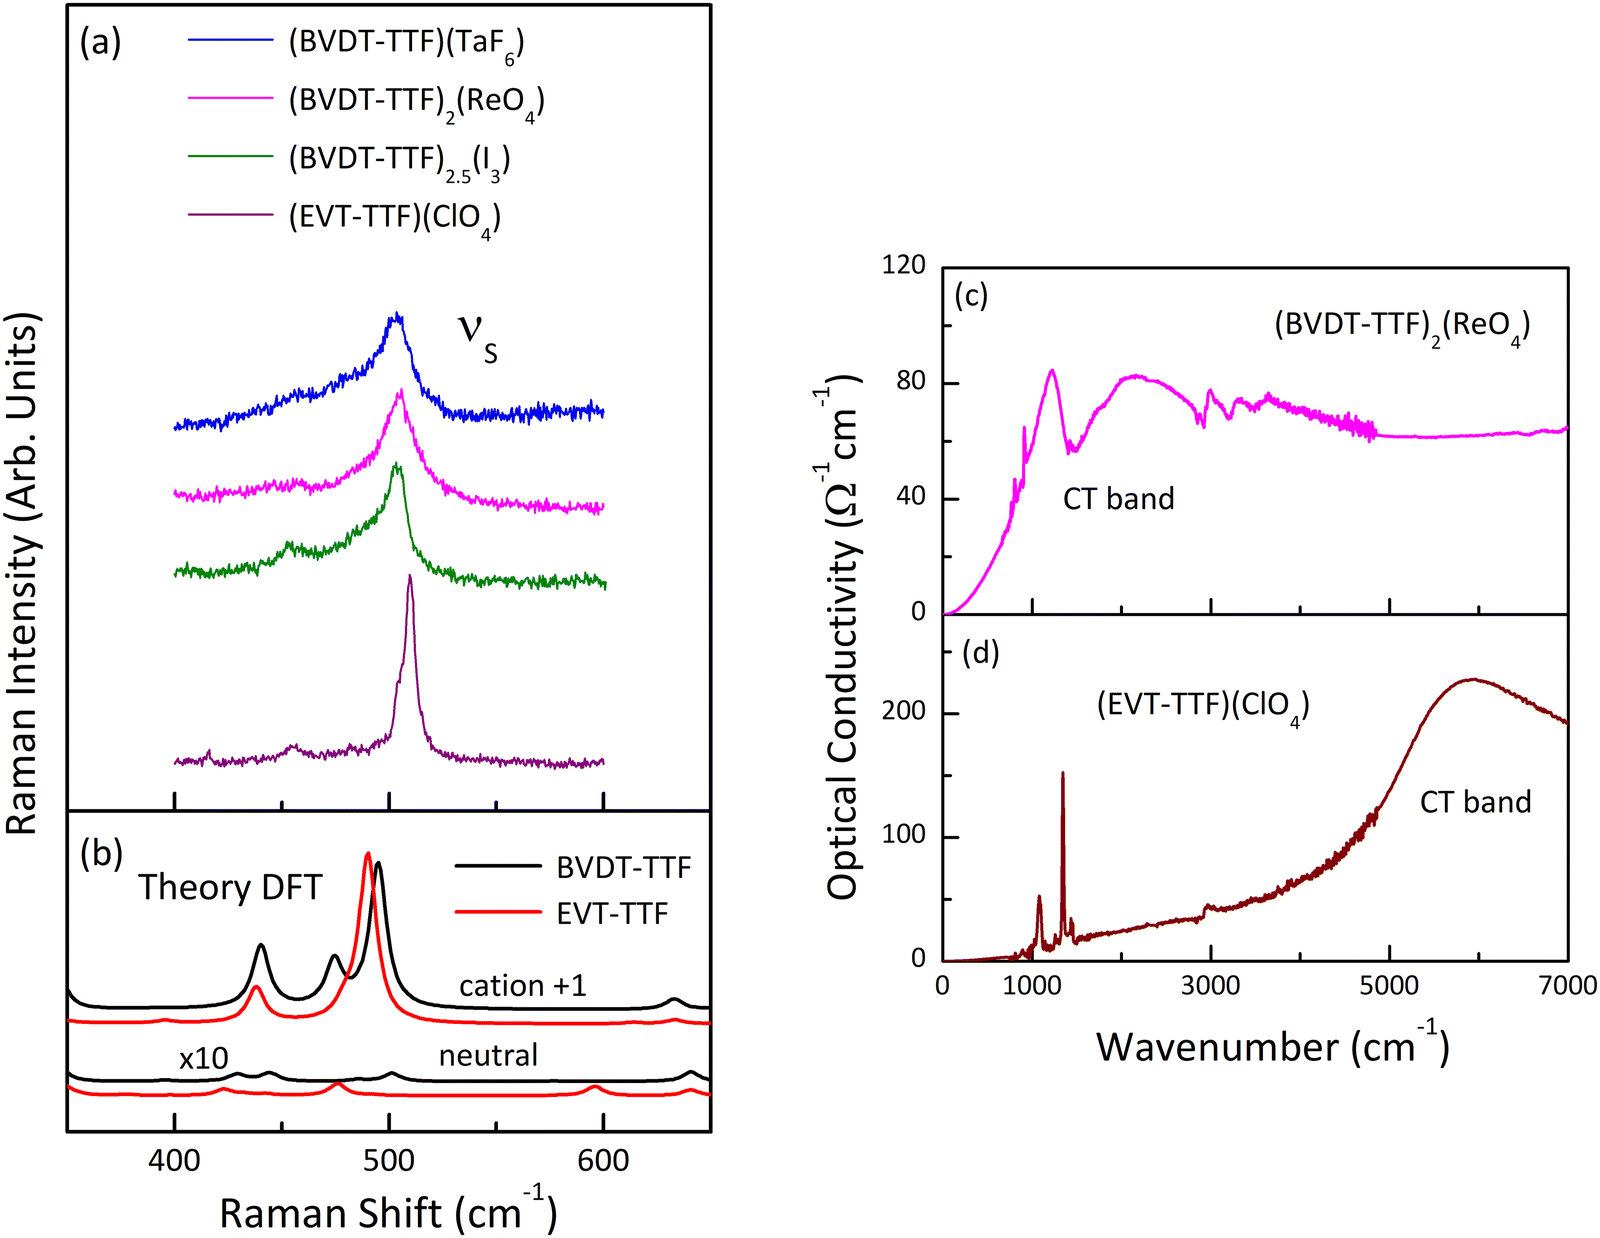 | ||
| Fig. 12 (a) Raman spectra of (BVDT-TTF)(TaF6), (BVDT-TTF)2(ReO4), (BVDT-TTF)2.5(I3), and (EVT-TTF)(ClO4)·0.5(CH2Cl2) measured at room temperature with the 632.8 nm excitation line, in the frequency range of the CS stretching vibrations; (b) theoretical Raman spectra of the isolated BVDT-TTF and EVT-TTF donor molecules in their neutral and cationic forms, calculated at the B3LYP/6-31++G(d,p) level of theory; the theoretical spectra of the neutral BVDT-TTF and EVT-TTF have been multiplied by a factor of 10. The spectra in panels (a, b) are offset for clarity; (c, d) room temperature optical conductivity spectra of (BVDT-TTF)2(ReO4) (c), and (EVT-TTF)(ClO4)·0.5(CH2Cl2) (d), respectively, polarized in the conducting plane. | ||
3. Conclusion
Using the BVDT-TTF and the EVT-TTF as donors with different counterions, four conducting salts have been obtained. Their structures were determined by X-ray diffraction on single crystals and thoroughly analyzed. The relationship between structure and properties was interpreted under the light of their conductivity measurements, their Raman spectra and band structure calculations. They all have a semiconducting character, although a metallic behaviour could be expected at first sight from the band structure calculations for the (BVDT-TTF)2.5(I3) salt. The observed semiconducting character was explained by a structural dimerization for EVT-TTF(ClO4)·0.5(CH2Cl2), resulting in a band-gap semiconductor, an electronic dimerization for (BVDT-TTF)(TaF6), with an antiferromagnetic ground state, or structural disorder induced by the anions for (BVDT-TTF)2.5(I3). The related salts with BEDT-TTF and similar anions reported in the literature display conductivities in the same range (see Table S2 in the ESI†). For instance, (BEDT-TTF)2X (X = I3− or ClO4−) display a transition to a superconducting state around 2 K. Although scarcely studied in the literature, one can expect that the BVDT-TTF and the EVT-TTF donors deserve to be examined further, especially in regard of the perfect stacks and S–S overlap allowed by the planarity of the vinylene moieties compared to BEDT-TTF.4. Experimental section
4.1 Materials and methods
All the solvents and precursors for synthesis were commercially available and used without further purification. 1H and 13C spectra were recorded on a Bruker Advance DRX 300 spectrometer operating at 300 MHz for 1H and 76 MHz for 13C (Fig. S5–S11, ESI†). Chemical shifts are given in ppm relative to tetramethylsilane TMS and coupling constants J in Hz. The residual non-deuterated solvent was used as an internal standard. Mass spectra were obtained by the MALDI-TOF techniques by using a Bruker Biflex-IIITM apparatus, equipped with a 337 nm N2 laser (Fig. S12–S15, ESI†). Bis(thiopropionitrile)-dithiol-one50 and the compound 239 were synthesized according to reported procedures.4.2 X-Ray structure determinations
Details about data collection and solution refinement are given in Table S1 (ESI†). Data collections were performed on a Rigaku Oxford Diffraction SuperNova diffractometer equipped with an Atlas CCD detector and micro-focus Cu-Kα radiation (λ = 1.54184 Å). The structures were solved by intrinsic phasing and refined on F2 by full matrix least-squares techniques with SHELX programs (SHELXT 2018/2 and SHELXL 2018/3) using the ShelXle and the Olex2 graphical user interfaces.51,52 All non-H atoms were refined anisotropically and absorption was corrected by multiscan empirical absorption using spherical harmonics with CrysAlisPro program. The H atoms were placed at calculated positions and refined using a riding model. Crystallographic data for the five structures have been deposited with the Cambridge Crystallographic Data Centre, deposition numbers CCDC 2296888 for (BVDT-TTF)(TaF6), 2296889 for (BVDT-TTF)2.5(I3), 2296890 for (BVDT-TTF)2(ReO4), and 2296891 for (EVT-TTF)(ClO4). These data can be obtained free of charge from CCDC, 12 Union road, Cambridge CB2 1EZ, UK (e-mail: deposit@ccdc.cam.ac.uk or https://www.ccdc.cam.ac.uk).†4.3 Conductivity measurements
Electrical resistivity measurements were performed on 0.2 to 0.5 mm long single crystals. Gold wires were glued with silver paste on both ends of the crystals. A two-contact method was used either applying a dc current of 0.1 μA and measuring the voltage with a Keithley 2400 Sourcemeter, either applying a voltage of 1 V and measuring the current with a Keithley 6487 Picoammeter/Voltage Source. A crystal of (EVT-TTF)(ClO4)·0.5(CH2Cl2) could be measured with four contacts at room temperature giving the same value of conductivity as measured for other crystals in two contacts; this indicates that the resistance of the contacts is not dominant over the intrinsic resistance of the samples.4.4 Computational details for band structure calculations
The first-principles calculations were carried out using a numeric atomic orbitals density functional theory (DFT) approach53,54 developed for efficient calculations in large systems and implemented in the SIESTA code.55–58 We used the generalized gradient approximation (GGA) to DFT and, in particular, the functional of Perdew, Burke, and Ernzerhof.59 To study the relative energies of states with localized electrons, spin polarized band calculations were carried out. All calculations included a Hubbard correction term Ueff = U − J = 6.0 eV for the S 3p states.60 In previous work we have found that this U term on the chalcogen atoms is needed for appropriately describing the electronic structure of molecular conductors were accurate experimental information on the bandwidth and charge transfer is available.61 Only the valence electrons are considered in the calculation, with the core being replaced by norm-conserving scalar relativistic pseudopotentials62 factorized in the Kleinman–Bylander form.63 We have used a split-valence double-ζ basis set including polarization orbitals with an energy shift of 10 meV for S, C and H atoms.64 The energy cutoff of the real space integration mesh was 300 Ry. The Brillouin zone was sampled using grids65 of (15 × 5 × 10) k-points for EVT-TTF(ClO4).0.5(CH2Cl2) and BVDT-TTF(TaF6). For (BVDT-TTF)2.5(I3) (15 × 10 × 5), (10 × 7 × 15) and (10 × 1 × 1) k-point grids were used for calculations with a single cell, 2a double cell and single chains along a. The experimental crystal structures were used for the computations. In the case of EVT-TTF(ClO4).0.5(CH2Cl2) and (BVDT-TTF)2.5(I3) we removed the cations and solvent from the calculation because of the disorder, replacing them by an appropriate uniform background charge keeping the neutrality of the unit cell.4.5 Raman and IR measurements
Typical lengths of single crystalline samples of BVDT-TTF and EVT-TTF salts used in the spectroscopic measurements were: 0.2 mm (ca. 0.2 × 0.1 × 0.1 mm3) for (BVDT-TTF)2(ReO4), 0.5 mm (ca. 0.5 × 0.1 × 0.1 mm3) for (BVDT-TTF)(TaF6), 1 mm (ca. 1 × 0.3 × 0.1 mm3) for (BVDT-TTF)2.5(I3), and 1 mm (ca. 1 × 0.3 × 0.1 mm3) for (EVT-TTF)(ClO4)·0.5(CH2Cl2). Neutral BVDT-TTF and EVT-TTF materials were also studied as a reference. Raman spectra were measured in a backward scattering geometry with a Raman LABRAM HR800 spectrometer equipped with a microscope and He–Ne laser excitation λ = 632.8 nm. The spectra were recorded at room temperature with a spectral resolution of 2 cm−1 and power reduced to approximately 0.3 mW to avoid sample overheating. The infrared reflectance spectra of (BVDT-TTF)2(ReO4), and (EVT-TTF)(ClO4)·0.5(CH2Cl2) in the frequency range 650–10000 cm−1 were recorded using a Bruker Equinox 55 FT-IR spectrometer equipped with a Hyperion 2000 infrared microscope, with a resolution of 4 cm−1. No polarization dependence was found, which is most likely related to the specific crystal structure. Absolute values of the optical reflectance were obtained using an aluminium mirror. The optical conductivity was calculated from the reflectance spectra using a Kramers–Kronig analysis.66 In the low frequency range the data were extrapolated assuming a constant value that is appropriate for the insulating response. Beyond the high frequency limit the data were extrapolated to zero assuming a ω−2 behavior up to 106 cm−1 and a ω−4 behavior for higher frequencies.4.6 DFT for Raman spectroscopy
Theoretical calculations of normal vibrations for BVDT-TTF and EVT-TTF isolated molecules were performed with Gaussian 03,67 using the 6-31++G(d,p) basis set and the hybrid density functional (B3LYP). The result of the structure optimization corresponds to energy minima as no imaginary frequencies were found. Based on the optimized structure, vibrational frequencies and Raman scattering activities were calculated. The frequencies obtained with a quantum harmonic oscillator approximation tend to be higher than the experimental ones, therefore the scaling factor of 0.9614 was applied to the calculated frequencies.68 The theoretical Raman intensities were calculated from the scattering activities and wavenumbers using reported procedures.69,704.7 Synthesis
:DCM 1:1) to afford the ketone 4 as a yellowish solid (0.54 g, 70%). 1H NMR (300 MHz, CDCl3): δ (ppm) 6.64 (s, 2H). 13C NMR (76 MHz, CDCl3): δ (ppm) 192.43, 124.05, 117.31.MS (MALDI-TOF) m/z: 205.89, Mtheo. (C5H2OS4) = 205.90. Elemental analysis calcd. (%): C 29.11; H 0.98; O 7.75; S 62.16; found: C 28.70; H 0.98; O 7.51; S 62.11.
Conflicts of interest
There are no conflicts to declare.Acknowledgements
This work was supported in France by the CNRS and the University of Angers (PhD funding to F. S.). N. A., I. O., and A. F. thank the Narodowa Agencja Wymiany Akademickiej – NAWA (Poland, BPN/BFR/2021/1/00001/U/00001) and the French Ministry of Foreign Affairs and the French Ministry of Education and Research (France, PHC Project 48119PG) for financial support through the bilateral Polonium project. The work in Poland was supported within the Statutory Activities of the Institute of Molecular Physics Polish Academy of Sciences. The work in Spain was supported by MICIU through Grants PID2022-139776NB-C61 and PID2021-128217NB-I00, Generalitat de Catalunya (2021SGR01519 and 2021SGR00286). E. C. acknowledges the support of the Spanish MICIU through the Severo Ochoa FUNFUTURE (CEX2019-000917-S) Excellence Centre distinction and P. A. from the Maria de Maeztu Units of Excellence Program (CEX-2021-001202-M).References
- H. H. Wang, K. D. Carlson, U. Geiser, A. M. Kini, A. J. Schultz, J. M. Williams, L. K. Montgomery, W. K. Kwok, U. Welp, K. G. Vandervoort, S. J. Boryschuk, A. V. S. Crouch, J. M. Kommers, D. M. Watkins, J. E. Schriber, D. L. Overmyer, D. Jung, J. J. Novoa and M.-H. Whangbo, Synth. Met., 1991, 42, 1983–1990 CrossRef CAS.
- P. Day and M. Kurmoo, J. Mater. Chem., 1997, 7, 1291–1295 RSC.
- S. Lefebvre, P. Wzietek, S. Brown, C. Bourbonnais, D. Jérome, C. Mézière, M. Fourmigué and P. Batail, Phys. Rev. Lett., 2000, 85, 5420–5423 CrossRef CAS PubMed.
- J.-P. Pouget, P. Alemany and E. Canadell, Mater. Horiz., 2018, 5, 590–640 RSC.
- H. Akutsu, A. Kohno, S. S. Turner and Y. Nakazawa, Chem. Lett., 2020, 49, 1345–1348 CrossRef CAS.
- T. Ishiguro, K. Yamaji and G. Saito, Organic Superconductors, Springer-Verlag, Heidelberg, 1998 Search PubMed.
- T. Mori, Chem. Rev., 2004, 104, 4947–4970 CrossRef CAS PubMed.
- E. Coronado and P. Day, Chem. Rev., 2004, 104, 5419–5448 CrossRef CAS PubMed.
- H. Urayama, H. Yamochi, G. Saito, K. Nozawa, T. Sugano, M. Kinoshita, S. Sato, K. Oshima, A. Kawamoto and J. Tanaka, Chem. Lett., 1988, 55–58 CrossRef.
- A. M. Kini, U. Geiser, H. H. Wang, K. D. Carlson, J. M. Williams, W. K. Kwok, K. G. Vandervoort, J. E. Thompson and D. L. Stupka, Inorg. Chem., 1990, 29, 2555–2557 CrossRef CAS.
- T. Komatsu, T. Nakamura, N. Matsukawa, H. Yamochi, G. Saito, H. Ito, T. Ishiguro, M. Kusunoki and K. Sakaguchi, Solid State Commun., 1991, 80, 843–847 CrossRef CAS.
- G. Saito, H. Yamochi, T. Nakamura, T. Komatsu, T. Ishiguro, Y. Nogami, Y. Ito, H. Mori, K. Oshima, M. Nakashima, S. Uchida, H. Takagi, S. Kagoshima and T. Osada, Synth. Met., 1991, 42, 1993–1998 CrossRef CAS.
- K. Miyagawa, K. Kanoda and A. Kawamoto, Chem. Rev., 2004, 104, 5635–5654 CrossRef CAS PubMed.
- K. Bender, K. Dietz, H. Endres, H. W. Helberg, I. Hennig, H. J. Keller, H. W. Schäfer and D. Schweitzer, Mol. Cryst. Liq. Cryst., 1984, 107, 45–53 CrossRef CAS.
- G. W. Crabtree, K. D. Carlson, L. N. Hall, P. T. Copps, H. H. Wang, T. J. Emge, M. A. Beno and J. M. Williams, Phys. Rev. B: Condens. Matter Mater. Phys., 1984, 30, 2958–2960 CrossRef CAS.
- N. Avarvari and J. D. Wallis, J. Mater. Chem., 2009, 19, 4061–4076 RSC.
- D. Lorcy, N. Bellec, M. Fourmigué and N. Avarvari, Coord. Chem. Rev., 2009, 253, 1398–1438 CrossRef CAS.
- F. Pop, P. Auban-Senzier, E. Canadell, G. L. J. A. Rikken and N. Avarvari, Nat. Commun., 2014, 5, 3757 CrossRef PubMed.
- F. Pop, N. Zigon and N. Avarvari, Chem. Rev., 2019, 119, 8435–8478 CrossRef CAS PubMed.
- N. Mroweh, C. Mézière, F. Pop, P. Auban-Senzier, P. Alemany, E. Canadell and N. Avarvari, Adv. Mater., 2020, 2002811 CrossRef CAS PubMed.
- R. R. Schumaker, V. Y. Lee and E. M. Engler, J. Phys., Colloq., 1983, 44, C3–1145 CrossRef.
- K. Sukumar Varma and A. E. Underhill, Physica B+C, 1986, 143, 321–323 CrossRef.
- T. Nakamura, S. Iwasaka, H. Nakano, K. Inoue, T. Nogami and H. Mikawa, Bull. Chem. Soc. Jpn., 1987, 60, 365–368 CrossRef CAS.
- T. Nogami, K. Inoue, T. Nakamura, S.-I. Iwasaka, H. Nakano and H. Mikawa, Synth. Met., 1987, 19, 539–544 CrossRef CAS.
- H. Kobayashi, A. Kobayashi, T. Nakamura, T. Nogami and Y. Shirota, Chem. Lett., 1987, 559–562 CrossRef CAS.
- S. Iwasaka, T. Nogami and Y. Shirota, Synth. Met., 1988, 26, 177–184 CrossRef CAS.
- H. Nakano, K. Miyawaki, T. Nogami, Y. Shirota, S. Harada, N. Kasai, A. Kobayashi, R. Kato and H. Kobayashi, Bull. Chem. Soc. Jpn., 1990, 63, 2281–2287 CrossRef CAS.
- V. Khodorkovsky, A. Edzifna and O. Neilands, J. Mol. Electron., 1989, 5, 33–36 Search PubMed.
- G. C. Papavassiliou, D. J. Lagouvardos, V. C. Kakoussis and G. A. Mousdis, Z. Naturforsch. B, 1990, 45, 1216–1218 CrossRef CAS.
- R. Świetlik and C. Garrigou-Lagrange, Synth. Met., 1993, 56, 2217–2221 CrossRef.
- S. Sekizaki, C. Tada, H. Yamochi and G. Saito, J. Mater. Chem., 2001, 11, 2293–2302 RSC.
- G. C. Papavassiliou, G. A. Mousdis, S. Y. Yiannopoulos, V. C. Kakoussis and J. S. Zambounis, Synth. Met., 1988, 27, 373–378 CrossRef.
- H. Nakano, K. Miyawaki, T. Nogami, Y. Shirota, S. Harada and N. Kasai, Bull. Chem. Soc. Jpn., 1989, 62, 2604–2607 CrossRef CAS.
- H. Nakano, S. Ikegawa, K. Miyawaki, K. Yamada, T. Nogami and Y. Shirota, Synth. Met., 1991, 42, 2409–2413 CrossRef CAS.
- J. S. Zambounis and C. W. Mayer, Tetrahedron Lett., 1991, 32, 2737–2740 CrossRef CAS.
- A. D. Dubrovskii, N. G. Spitsina, A. N. Chekhlov, O. A. Dyachenko, L. I. Buravov, A. A. Lobach, J. V. Gancedo and C. Rovira, Synth. Met., 2004, 140, 171–176 CrossRef CAS.
- Y. Halpin, M. Schulz, A. C. Brooks, W. R. Browne, J. D. Wallis, L. González, P. Day and J. G. Vos, Electrochim. Acta, 2013, 100, 188–196 CrossRef CAS.
- N. Svenstrup and J. Becher, Synthesis, 1995, 215–235 CrossRef CAS.
- J. Garín, R. Andreu, J. Orduna and J. M. Royo, Synth. Met., 2001, 120, 749–750 CrossRef.
- P. Guionneau, C. J. Kepert, G. Bravic, D. Chasseau, M. R. Truter, M. Kurmoo and P. Day, Synth. Met., 1997, 86, 1973–1974 CrossRef CAS.
- F. Solano, P. Auban-Senzier, I. Olejniczak, B. Barszcz, T. Runka, P. Alemany, E. Canadell, N. Avarvari and N. Zigon, Chem. – Eur. J., 2023, 29, e202203138 CrossRef CAS PubMed.
- P. Alemany, J.-P. Pouget and E. Canadell, Phys. Rev. B: Condens. Matter Mater. Phys., 2012, 85, 195118 CrossRef.
- T. Ivek, M. Čulo, M. Kuveždić, E. Tutiš, M. Basletić, B. Mihaljević, E. Tafra, S. Tomić, A. Löhle, M. Dressel, D. Schweitzer and B. Korin-Hamzić, Phys. Rev. B, 2017, 96, 075141 CrossRef.
- E. H. Lieb and F. Y. Wu, Phys. Rev. Lett., 1968, 20, 1445–1448 CrossRef.
- H. Seo, C. Hotta and H. Fukuyama, Chem. Rev., 2004, 104, 5005–5036 CrossRef CAS PubMed.
- K. Yakushi, Crystals, 2012, 2, 1291–1346 CrossRef CAS.
- T. Yamamoto, M. Uruichi, K. Yamamoto, K. Yakushi, A. Kawamoto and H. Taniguchi, J. Phys. Chem. B, 2005, 109, 15226–15235 CrossRef CAS PubMed.
- A. Girlando, J. Phys. Chem. C, 2011, 115, 19371–19378 CrossRef CAS.
- G. Visentini, M. Masino, C. Bellitto and A. Girlando, Phys. Rev. B: Condens. Matter Mater. Phys., 1998, 58, 9460–9467 CrossRef CAS.
- Q. Fang, H. Chen, H. Lei, G. Xue and X. Chen, CrystEngComm, 2014, 17, 787–796 RSC.
- C. B. Hübschle, G. M. Sheldrick and B. Dittrich, J. Appl. Cryst., 2011, 44, 1281–1284 CrossRef PubMed.
- O. V. Dolomanov, L. J. Bourhis, R. J. Gildea, J. A. K. Howard and H. Puschmann, J. Appl. Cryst., 2009, 42, 339–341 CrossRef CAS.
- P. Hohenberg and W. Kohn, Phys. Rev., 1964, 136, B864–B871 CrossRef.
- W. Kohn and L. J. Sham, Phys. Rev., 1965, 140, A1133–A1138 CrossRef.
- J. M. Soler, E. Artacho, J. D. Gale, A. García, J. Junquera, P. Ordejón and D. Sánchez-Portal, J. Phys.: Condens. Matter, 2002, 14, 2745–2779 CrossRef CAS.
- E. Artacho, E. Anglada, O. Diéguez, J. D. Gale, A. García, J. Junquera, R. M. Martin, P. Ordejón, J. M. Pruneda, D. Sánchez-Portal and J. M. Soler, J. Phys.: Condens. Matter, 2008, 20, 064208 CrossRef PubMed.
- A. García, N. Papior, A. Akhtar, E. Artacho, V. Blum, E. Bosoni, P. Brandimarte, M. Brandbyge, J. I. Cerdá, F. Corsetti, R. Cuadrado, V. Dikan, J. Ferrer, J. Gale, P. García-Fernández, V. M. García-Suárez, S. García, G. Huhs, S. Illera, R. Korytár, P. Koval, I. Lebedeva, L. Lin, P. López-Tarifa, S. G. Mayo, S. Mohr, P. Ordejón, A. Postnikov, Y. Pouillon, M. Pruneda, R. Robles, D. Sánchez-Portal, J. M. Soler, R. Ullah, V. W. Yu and J. Junquera, J. Chem. Phys., 2020, 152, 204108 CrossRef PubMed.
- For more information on the SIESTA code visit: https://departments.icmab.es/leem/siesta/.
- J. P. Perdew, K. Burke and M. Ernzerhof, Phys. Rev. Lett., 1996, 77, 3865–3868 CrossRef CAS PubMed.
- S. L. Dudarev, G. A. Botton, S. Y. Savrasov, C. J. Humphreys and A. P. Sutton, Phys. Rev. B: Condens. Matter Mater. Phys., 1998, 57, 1505–1509 CrossRef CAS.
- Y. Kiyota, I.-R. Jeon, O. Jeannin, M. Beau, T. Kawamoto, P. Alemany, E. Canadell, T. Mori and M. Fourmigué, Phys. Chem. Chem. Phys., 2019, 21, 22639–22646 RSC.
- N. Troullier and J. L. Martins, Phys. Rev. B: Condens. Matter Mater. Phys., 1991, 43, 1993–2006 CrossRef CAS PubMed.
- L. Kleinman and D. M. Bylander, Phys. Rev. Lett., 1982, 48, 1425–1428 CrossRef CAS.
- E. Artacho, D. Sánchez-Portal, P. Ordejón, A. García and J. M. Soler, Phys. Status Solidi B, 1999, 215, 809–817 CrossRef CAS.
- H. J. Monkhorst and J. D. Pack, Phys. Rev. B: Solid State, 1976, 13, 5188–5192 CrossRef.
- M. Dressel and G. Grüner, Electrodynamics of Solids: Optical Properties of Electrons in Matter, Cambridge University Press., 2002 Search PubMed.
- M. J. Frisch, G. W. Trucks, H. B. Schlegel, G. E. Scuseria, M. A. Robb, J. R. Cheeseman, J. A. Montgomery, Jr., T. Vreven, K. N. Kudin, J. C. Burant, J. M. Millam, S. S. Iyengar, J. Tomasi, V. Barone, B. Mennucci, M. Cossi, G. Scalmani, N. Rega, G. A. Petersson, H. Nakatsuji, M. Hada, M. Ehara, K. Toyota, R. Fukuda, J. Hasegawa, M. Ishida, T. Nakajima, Y. Hona, O. Kitao, H. Nakai, M. Klene, X. Li, J. E. Knox, H. P. Hratchian, J. B. Cross, C. Adamo, J. Jaramillo, R. Gomperts, R. E. Stratmann, O. Yazyev, A. J. Austin, R. Cammi, C. Pomelli, J. W. Ochterski, P. Y. Ayala, K. Morokuma, G. A. Voth, P. Salvador, J. J. Dannenberg, V. G. Zakrzewski, S. Dapprich, A. D. Daniels, M. C. Strain, O. Farkas, D. K. Malick, A. D. Rabuck, K. Raghavachari, J. B. Foresman, J. V. Ortiz, Q. Cui, A. G. Baboul, S. Clifford, J. Cioslowski, B. B. Stefanov, G. Liu, A. Liashenko, P. Piskorz, I. Komaromi, R. L. Martin, D. J. Fox, T. Keith, M. A. Al-Laham, C. Y. Peng, A. Nanayakkara, M. Challacombe, P. M. W. Gill, B. Johnson, W. Chen, M. W. Wong, C. Gonzalez and J. A. Pople, Gaussian 03 (Revision D.01), Gaussian, Inc., Wallingford CT, 2004 Search PubMed.
- A. P. Scott and L. Radom, J. Phys. Chem., 1996, 100, 16502–16513 CrossRef CAS.
- R. Sun, J. Yao, S. Li and R. Gu, Vib. Spectrosc., 2008, 47, 38–43 CrossRef CAS.
- D. Michalska and R. Wysokiński, Chem. Phys. Lett., 2005, 403, 211–217 CrossRef CAS.
Footnote |
| † Electronic supplementary information (ESI) available. CCDC 2296888 for (BVDT-TTF)(TaF6), 2296889 for (BVDT-TTF)2.5(I3), 2296890 for (BVDT-TTF)2(ReO4), and 2296891 for (EVT-TTF)(ClO4). For ESI and crystallographic data in CIF or other electronic format see DOI: https://doi.org/10.1039/d4ma00054d |
| This journal is © The Royal Society of Chemistry 2024 |