 Open Access Article
Nanomolar level electrochemical sensing of explosive material sodium azide by a hexagonal boron nitride modified glassy carbon electrode†
Arya Nair
J. S.
and
Sandhya
K. Y.
 *
*
Department of Chemistry, Indian Institute of Space Science and Technology, Valiyamala, Thiruvananthapuram 695-547, Kerala, India. E-mail: sandhya@iist.ac.in
First published on 11th December 2023
Abstract
In this work, for the first time, a solvent-exfoliated hexagonal boron nitride nanosheet (h-BNNS) has been employed for the electrochemical (EC) sensing of a hazardous primary azide (sodium azide, SA). Besides, this is the first time that a modified glassy carbon electrode (GCE) platform has been demonstrated for the EC sensing of SA. The h-BNNS made by exfoliating bulk h-BN in dilute NaOH, which exhibited stability for more than one year with a few layers of thickness, was utilized to drop cast on a GCE for the electrode. The h-BNNS/GCE showed a ∼25- and 20-fold increase in peak current compared to those of the corresponding controls: unmodified GCE and bulk h-BN/GCE for SA. The detection limit is in parts per trillion (0.1 nM, i.e., 6.5 ppt), is the lowest so far reported, and satisfactorily meets the sensitivity requirement for SA based on the U.S. Environmental Protection Agency prescribed safe limit. The sensing performance was successfully extended to environmental water samples such as ground-, tap-, and contaminated river water spiked with SA. Our results suggest that highly stable h-BNNS could open the way to a range of important applications of h-BN-based materials.
1. Introduction
Sodium azide (SA), which is a hazardous primary explosive, is widely used as a preservative in hospitals, biological studies, agriculture, organic synthesis, and photographic emulsions.1,2 Even at levels of ≥0.15 ppm (i.e.; 150 ppb), it is highly reactive and toxic and can cause cytochrome oxidase inhibition, vasodilation, hypotension, stroke, and even death.3 The toxicity is compared with that of cyanide salts as they both can give similar concomitant health risks. It is greatly soluble in water, and its solution at a pH ≤ 5 is slowly hydrolyzed into a very toxic gas called hydrazoic acid. Furthermore, these azide anions tend to block the body cells from using oxygen, thereby creating harmful effects mainly on the heart and the brain.4,5 Currently, the determination of azide is done using chromatography,6 microdiffusion spectrophotometry,7 biosensor-based,3,8 and metal-free fluorescent methods.9 However, the mentioned techniques need trained technicians to operate, have a high maintenance cost, need a higher quantity of sample for studies, have a longer analysis time, and have lower resolution, mostly in ppm or ppb. The electrochemical (EC) sensing method holds remarkable advantages, such as simplicity, portability, real-time readout, cost-effectiveness, exceptional selectivity & sensitivity, reproducibility, and the possibility of very low detection limits and miniaturization making it compatible with integrated circuit technology for data acquisition, processing, & transfer thus enabling continuous and field monitoring.10–12 There are reports of EC sensor materials for secondary explosives such as nitrophenol (NP),13 dinitrophenol (DNP),14 and trinitrophenol (TNP);15 however, there are only two reports so far on the EC sensing of SA, which used a boron-doped diamond (BDD) electrode that exhibited a lowest limit of detection (LOD) of 7.7 μM,16 and a silicon oil-based carbon paste electrode (CPE) with a LOD of 0.1 μM.17 So far there are no reports of a glassy carbon electrode (GCE) platform-based electrode for the EC sensing of SA and the GCE has advantages when compared to the BDD and CPE in the previous reports. CPEs cannot be used in non-aqueous media/organic solvents, and in some redox systems, as their response may be negatively affected by specific reaction kinetics,18 and in the case of BDD electrodes, B-doping is usually carried over with a chemical vapour deposition process, which requires expensive instrumentation and emits toxic by-products.19 In contrast, the GCE has relatively low cost, excellent electrical conductivity, EC inertness over a broad potential window, chemical stability, impermeability, and ease of surface modification, and can be successfully implemented in portable devices because of the possibility to miniaturize it into screen printed electrodes (SPEs).15,20 Being an explosive component and a pollutant, the detection of SA is very significant, and hence a field-portable tool capable of sensitive and selective detection in a rapid, simpler, and consistent manner is of significance. In this work, for the first time, we demonstrated a GCE as a base working electrode for the EC detection of SA.The two-dimensional hexagonal boron nitride (2D-hBN), with a structure similar to that of graphene, comprises equal quantities of boron (B) and nitrogen (N) atoms arranged in a hexagonal structure with strong sigma bonds between them and weak van der Waals forces between the layers.21 Due to its structure, it possesses many advanced properties such as a wide bandgap, higher active surface area, high oxidation resistance, higher thermal conductivity, chemical stability, and mechanical strength.21–23 The 2D-hBN has been utilized as an electrocatalyst in applications such as the oxygen reduction reaction24 and in solar energy conversion by photoredox catalysis.22 However, there are only a few literature reports of h-BN as the main active material for EC sensing, such as the simultaneous EC sensing of dopamine (DA) and uric acid (UA) by a 2D-hBN on SPE,25 EC sensing of phenol and 4-aminophenol by defect-rich h-BN,26 sensing of ascorbic acid (AA), DA, and UA by h-BN nanoflakes,27 and nitrite (NO2−) sensing by h-BN whiskers.28 So far there are no reports of the utilization of h-BN towards EC sensing of explosives.
In this work, we explore, for the first time, exfoliated h-BN nanosheets (h-BNNS) as a potential electrocatalyst for the detection of a primary explosive SA, using GCE as the platform. The h-BNNS exhibited sensing of SA with a LOD as low as 0.1 nM (i.e., 0.006 ppb/6.0 ppt, 10−10 M), which is the lowest reported to date. Besides, most of the reported literature utilized Au, surfactants, etc., for the effective EC sensing of biomolecules such as DA, UA, AA, and nitrites by using h-BN,25,29 whereas in this study, the electrode fabrication process is relatively simple without using any specific electron transfer mediator. The formed h-BNNS delivered selective sensing towards SA with no current response for other possible interferences, such as toxic pollutants and metal ions even at their higher concentrations. As mentioned earlier, this is the first time that a GCE was utilized as the base platform for the sensing of SA, and this research delivers a new perception both in developing EC sensors for the sensing of primary azides and in the exploration of the properties, performance, and applicability of 2D-hBN towards EC sensing.
2. Experimental section
2.1. Raw materials
All chemicals were of analytical grade and were used as received from Sigma-Aldrich without any further purification. All solutions were prepared with deionized water and used with high purity for all EC measurements.2.2. Equipment
High-resolution transmission electron microscopy (HR-TEM) analysis was done using an FEI, TECNAIS twin microscope with an acceleration voltage of 300 kV. Field emission scanning electron microscopy (FE-SEM) was performed on a Zeiss EVO 18 scanning electron microscope with an acceleration voltage of 15 kV. Raman spectroscopy measurements were carried out on a Renishaw confocal Raman microscope with an excitation laser wavelength of 532 nm. X-Ray photoelectron spectroscopy (XPS) analyses were carried out using a Kratos analytical axis ultra-X-ray photoelectron spectrometer with the excitation source of Al Kα. Brunauer–Emmett–Teller (BET) surface areas of the BN samples were obtained from a nitrogen adsorption–desorption isotherm using an ASAP 2020 analyzer (Micromeritics Instrument Co.), and the outgassing process was run at 200 °C for 12 h. Zeta potentials of the BN samples in aqueous suspension were measured with a Zetasizer NANO-ZS90 (Malvern Instrument, UK).2.3. Fabrication of electrodes for EC sensing
The h-BN powder (∼1 μm, 98%) was dispersed in NaOH at a concentration of 0.5 mg mL−1 by probe sonication at room temperature (RT) for 30 minutes to form a suspension. About 20 μL of this dispersion was drop cast onto the GCE to form the electrode. Prior to modification of the GCE, it was mechanically polished with a wetted micro cloth containing alumina powder for about 15–20 minutes, and then carefully cleaned using distilled water, followed by acetone by ultra-sonication for 5 minutes each. The sample dispersions were drop cast over the pre-treated GCE carefully and then dried at RT to achieve the modified electrodes.2.4. EC methods
The EC behaviour of SA, various metal ions, and other toxic molecules were investigated on the h-BNNS/GCE using cyclic voltammetry (CV) and differential pulse voltammetry (DPV). All the voltammetric determinations were performed on an Autolab (PGstat320N from Metrohm) EC workstation. The experiments were carried out in a conventional EC cell containing the modified GCE as the working electrode, a platinum wire counter electrode, and an Ag(s)/AgCl(s)/Cl−1 (aq., saturated) electrode as a reference electrode. Unless otherwise specified, the electrolyte solution used was 0.1 M phosphorous buffer solution (PBS). The CV experiments were carried out with a CV scan from 0.2 to 1.1 V at the optimized scan rate of 80 mV s−1. The DPV scans were performed at 0.2 to 1.1 V with optimized parameters (pulse amplitude 25 mV).2.5. Preparation of environmental samples
The real environment samples spiked with SA were prepared using groundwater (GW), tapwater (TW) (both collected from Thiruvananthapuram), and contaminated water samples (CW) (collected from Parvathy Puthanaar, Thiruvananthapuram). The blank readings corresponding to each of the samples were carried out, and the current response, if any, was subtracted from each result to obtain the values (corrected for blank). The corresponding recovery values, as well as relative standard deviation (RSD), were calculated.3. Results and discussion
3.1. Sample preparation and physiochemical characterizations of h-BNNS
As this is the first time that h-BNNS has been investigated as an electrode modifier for the EC sensing of SA, commercial/bulk h-BN ultra-sonicated in 0.1 M NaOH was used. Bulk h-BN can be exfoliated layer by layer with NaOH insertion between the BN layers and, finally, break into h-BNNS.30 Since the bulk h-BN is poorly soluble and exhibits a hydrophobic character in water/aqueous solutions, h-BNNS preparation through exfoliation is crucial to obtain the superlative properties that are required especially in in vitro and/or in vivo applications.22,25,31,32 The resultant product was dried, and its aqueous dispersion was used for modifying the GCE. The schematic of the preparation of h-BNNS is detailed in Scheme 1. The prepared h-BNNS was further characterized using HR-TEM, FE-SEM, RAMAN, and XPS techniques to ascertain the structure and properties of h-BNNS.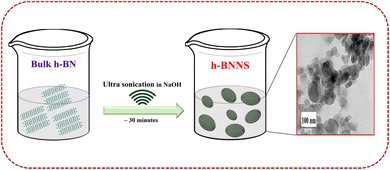 | ||
| Scheme 1 Illustration of the preparation of h-BNNS by solvent exfoliation of bulk h-BN using simple ultrasonication. | ||
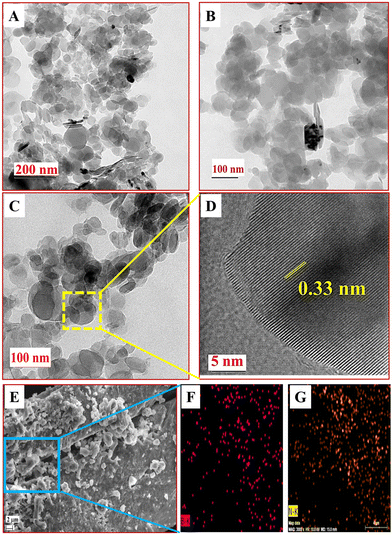
The characterization of h-BNNS by HR-TEM (Fig. 1(A)–(D)) revealed semi-transparent layers suggesting the presence of few-layered nanosheets of h-BNNS and the lattice fringes (Fig. 1D) indicating the presence of single-layered h-BNNS. Besides, the interplanar spacing of 0.33 nm, which matches well with the (002) planes of h-BN,33 and the good symmetry of h-BNNS indicates that the h-BNNS structure is integral and not damaged during ultrasonic exfoliation. The in-plane high-resolution selected area electron diffraction (SAED) pattern (Fig. S1A, ESI†) indicates the polycrystalline in-plane structures in the h-BNNS.21 Furthermore, the Tyndall experiment (Fig. S1B and C, ESI†) performed on bulk h-BN and the h-BNNS dispersions using laser light of wavelength 635 nm displayed a light scattering effect only in the latter. The surface morphology and elemental composition of h-BNNS by FE-SEM with elemental mapping (Fig. 1E–G) exhibited that the surface morphology of the h-BNNS (Fig. 1E) was quite homogeneous with sheet-like structures corroborating the structure by the TEM images and the subsequent elemental mapping of selected regions (Fig. 1F and G) clearly shows uniform distribution of B and N in the h-BNNS.
The Raman spectra of h-BNNS show a major peak at 1363 cm−1 (Fig. 2A) due to the in-plane vibration of the sp2 hybridized B–N–B bond (E2g) in h-BNNS.30,31 The intense and broad peak implies the randomly ordered layers due to exfoliation. The small sharp peak at 1432 cm−1 is an artifact of the measurement and not related to h-BNNS.34 The XPS analysis further revealed the chemical and bond composition of h-BNNS. The XPS survey spectrum of h-BNNS (Fig. 2B) exhibited B 1s and N 1s peaks at 191 and 399 eV, respectively. The peak at 190.4 eV observed in the B 1s spectrum (Fig. 2C), can be assigned to B–N bonds, while the shoulder at 191.2 eV shall be assigned to B–OH bonds formed by B-site hydroxylation during exfoliation. In the N 1s spectra (Fig. 2D), the binding energy at 397.6 eV is assigned to B–N bonds accompanied by two small peaks attributed to N–H bonds at 403.6 and 407.3 eV, which are possibly introduced by hydrolysis during the exfoliation process.22,24,35 Thus, the Raman and XPS results confirm that the product is composed of a few layered h-BN sheets with a few surface groups such as B–N, B-OH, and N–H.
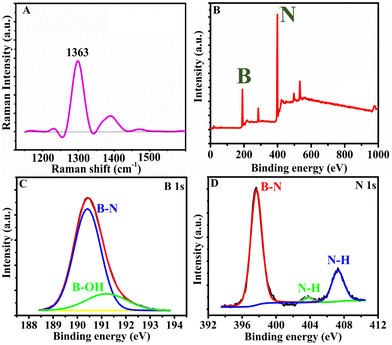 | ||
| Fig. 2 (A) The Raman spectrum and (B)–(D) the XPS survey spectrum and the high-resolution scans of B 1s and N 1s, respectively, of h-BNNS. | ||
3.2. Exploration of the analytical parameters
The optimization of the pre-concentration (PC) time was conducted by measuring the current at different PC times for solutions containing 1 mM of SA. The result (Fig. S2A, ESI†) showed that the peak current was the highest for the PC time of 3 min. Hence, 3 min was chosen as the most suitable PC time for further analysis. Besides, the influence of PC potential was studied in the range of −0.4 V to +1.2 V in a solution containing 1 mM SA. As shown in Fig. S2B (ESI†), the peak current increased when the PC potential shifted from negative potential to positive potential. The peak current increases up to +0.5 V and remains more or less the same for further increase in the potential. Therefore, +0.6 V was chosen as the PC potential.3.3. Electrocatalytic property of h-BNNS/GCE
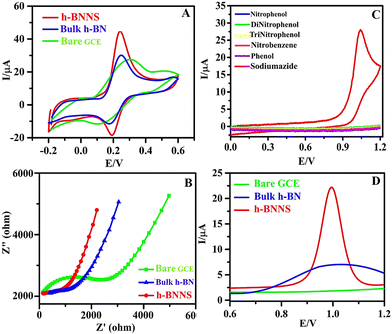
CV is an effective and powerful method to acquire the electrochemically active surface area (EASA) of different modified electrodes. Fig. 3A demonstrates the CV response of different electrodes (bare GCE, bulk h-BN/GCE, and h-BNNS/GCE) and each electrode established a pair of well-defined redox peaks, which resulted from the redox of [Fe(CN)6]3− and among them, h-BNNS/GCE exhibited the sharpest and highest redox peak. This reveals that the electron transfer rate of h-BNNS/GCE is faster than that of the others. In addition, this amplified response can be attributed to the formation of nanosheets of h-BN with less no. of layers and less agglomeration that has enhanced the conductivity by decreasing the pathway for diffusion and improved the active sites that led to enhanced catalytic activity. Likewise, the enhancement in the current response for SA on h-BNNS/GCE shall be attributed to the improved conductivity due to the nanostructure of h-BNNS. Furthermore, EASA of the electrodes was calculated based on the Randles–Sevcik equation by using the CV data,| Ip = 2.69 × 10⁵(n3/2)AD1/2Cν1/2 | (1) |
The EASA values of GCE, h-BN/GCE, and h-BNNS/GCE were 1.984 × 10⁻³ cm2, 2.137 × 10⁻³ cm2, and 7.112 × 10⁻³ cm2, respectively. From the results, it is observed that h-BNNS/GCE holds the highest value of EASA compared to that of the GCE and h-BN/GCE. The good electron transfer ability and large EASA of h-BNNS/GCE should be ascribed to the defect structures induced by ultrasonication in NaOH as they not only modulate the electronic structure of h-BN but also provide more active sites for EC reaction.
In addition, the BET method was performed to investigate the specific surface area (SSA) of the bulk h-BN and h-BNNS in the nitrogen (N2) adsorption/desorption environment. Fig. S3 (ESI†) shows that the SSAs of the bulk h-BN and h-BNNS were 29.9 and 206 m2 g−1, respectively. The increased SSA of h-BNNS than bulk h-BN indicates that the exfoliation greatly changed the SSA of the h-BN. With the decreasing of the layers, more and more h-BN was exposed, resulting in a promotion of the BET surface in h-BNNS than bulk h-BN and this can offer a greater number of active sites and enhances the surface area, which is beneficial for the EC sensing application.
In an attempt to understand the improved sensing property of SA on h-BNNS, the electrocatalytic ability of the electrodes was studied by EC impedance spectroscopy (EIS) using 5 mM [Fe(CN)6]3− as the redox probe and 0.1 M KCl as the supporting electrolyte. The result (Fig. 3B) revealed that the charge-transfer resistance (Rct) value was in the order of bare GCE (206 kΩ) > bulk h-BN/GCE (162 kΩ) > and h-BNNS/GCE (6.1 kΩ). The lowest Rct value of h-BNNS compared to the controls indicates that the modified electrode has a superior electroactive surface due to the defects created at the edges and basal planes of h-BNNS, which can act as active electron transport sites that provided a smooth pathway for the exchange of redox species at the electrode–electrolyte interface.
3.4. EC sensing studies of SA on different modified electrodes
As of now, h-BN-based electrode materials were explored for the EC sensing of biomolecules. Here in this work, h-BNNS was explored for the EC sensing of contaminants such as aromatics and explosives. The preliminary EC sensing property of h-BNNS/GCE was screened using nitrophenol (NP), di-nitrophenol (DNP), tri-nitrophenol (TNP), phenol (PH), nitrobenzene (NB), and SA and the results showed a current response only for SA (Fig. 3C). The CV profile of 1 mM SA on bare GCE, bulk h-BN/GCE and h-BNNS/GCE in 0.1 M PBS (Fig. 3D) showed a very weak anodic peak/no peak of SA at the bare GCE due to its sluggish EC kinetics. When bulk h-BN was decorated on the GCE, ipa (SA) increased to 4.98 μA, which is attributed to its moderate adsorption capacity and admirable catalytic activity. A well-defined and sharp anodic peak was found on the h-BNNS/GCE with a maximal ipa (SA) of 24.98 μA, which was 25- and 5-times higher than that of the bare GCE and bulk h-BN/GCE. The superior response peak current of SA on h-BNNS/GCE is largely due to its lower Rct and larger EASA, which drastically enhanced the electron transfer and SA accumulation.3.5. Sensitivity study of h-BNNS/GCE for SA detection
The sensitivity and concentration dependency of h-BNNS/GCE toward the EC detection of SA was evaluated by recording the DPV responses starting from a low concentration level of 0.1 nM (ppb levels). Fig. 4A shows the DPV response of the h-BNNS/GCE with increasing concentration of SA in 0.1 M PBS electrolyte. The oxidation current gradually increased with increasing concentration of SA. The calibration graph (Fig. 4B) obtained covered a wide range of concentrations from 0.1 nM to 1 mM with a single linear dynamic range (LDR) and had a correlation coefficient (R2) of 0.9987 in the concentration range of 10−10 to 10−3 M. The corresponding linear regression equation can be expressed for the oxidation peak current as Ipa (μA) = 1.138 × (μM) + 8.1278 with a sensitivity value of 14.201 μA μM−1 cm−2. The calculated LOD for SA on the h-BNNS was 1.26 × 10⁻¹⁰ M (S/N = 3), which is in agreement with the experimental LOD which is 1 × 10⁻¹⁰ M (∼6.5 ppt) (Fig. 4C). According to the US Environmental Protection Agency (EPA) the maximum allowed limit of SA in drinkable water is 150 ppb. Therefore, a sensor with a LOD of 6.5 ppt, 3 orders of magnitude (1/1000th) lower than the safe concentration limit specified by the EPA, can be considered highly suitable and sensitive enough to detect SA. An illustration of the enhanced sensing property towards SA in DPV upon modification of GCE by h-BNNS/GCE is shown in Scheme 2.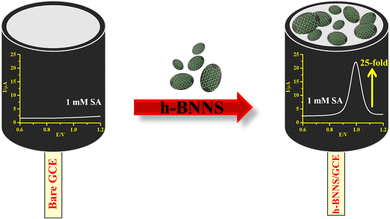 | ||
| Scheme 2 The schematic shows the enhancement in the current response for SA in DPV on modification of the GCE with h-BNNS. | ||
3.6. Selectivity and interference studies of h-BNNS/GCE
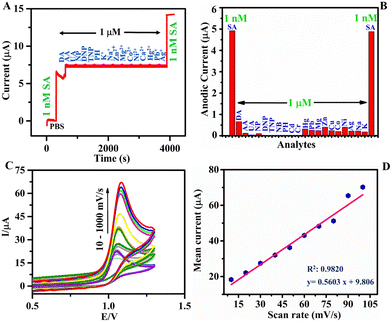
To scrutinize the selectivity of the h-BNNS towards SA, interference studies were conducted in the presence of potential interfering molecules in the environmental samples such as NP, DNP, TNP, PH, NB, and metal ions: [Pb(II), Cr(VI), Ag(I), Cd(II), Hg(II), Zn(II), Ni(II), Co(II), Mg(II), Cu(II), Mn(II), and Sn(II)] (at 103X concentration) using chronoamperometry and DPV studies. The result (Fig. 5A and Fig. S4, ESI†) reveals that while 1 nM concentration of SA shows a well-defined amperometric current response on h-BNNS/GCE, no current responses were observed for any of the other co-interfering molecules and metal ions at 1 μM concentration. Furthermore, the current response in the absence of the other interfering molecules and metal ions was the same (∼5 μA), suggesting the non-interference from the studied molecules/ions and the selective sensing of SA by the h-BNNS/GCE and depicted in the bar diagram (Fig. 5B).3.7. Scan rate study and mechanism
It is evident from the results that h-BNNS has preferential interaction towards azide ions and it is important to see whether it is governed by a diffusion or adsorption-controlled process. To investigate the mechanism of sensing, the influence of scan rate on the electrocatalytic response of the h-BNNS/GCE towards SA oxidation was examined and the CV response at different scan rates from 10 and 1000 mV s−1 is given in Fig. 5C. The linear relationship (R2: 0.9820 and 0.9477) between the redox peak currents and the scan rates (Fig. 5D and Fig. S5, ESI†) reveals that the EC reaction of SA on the h-BNNS surface is a typical surface adsorption-controlled process (Fig. 5D) than a diffusion-controlled process (Fig. S5, ESI†).Furthermore, the zeta potential measurement (Fig. S6, ESI†) showed that the surface charge of the bulk h-BN and h-BNNS are +11.2 and +31.1 mV, respectively. The higher zeta potential indicates improved dispersion stability of h-BNNSs in water. Besides, the surface of h-BNNS mainly adsorbs and interacts with negative ions. Hence, during EC sensing studies, the azide ions can adsorb onto the positive surface of h-BNNS through electrostatic interaction and further undergo oxidation reaction.
As there are no prior reports of the EC sensing of the SA by using the GCE as a platform, the comparison of the analytical performance of h-BNNS/GCE was made with other reported electrode platforms/materials and methods (Tables 1 and 2). The data shows that compared to the other methods and the sensors, BDD,16 CPE,17 and carbon screen printed electrodes (CSPE),36 h-BNNS/GCE displays two to four orders of magnitude lower LOD for SA. In addition, the achieved LOD by h-BNNS/GCE is the lowest reported for SA so far by any sensing method.37–43 To the best of our knowledge, the lowest LOD reported for SA is 0.26 μM, by a fluorescent platform using a water-soluble Cu(II) system.41 Since the allowed toxicity level of SA in water is 150 ppb, the LOD value of 0.006 ppb reported in the present study, which is 1000 times below the specific level, shows the efficiency of h-BNNS towards SA detection.
| S. no. | Method used | Materials | LOD (μM) | Ref. |
|---|---|---|---|---|
| 1 | Ion chromatography | Quaternary amine functionalized metal–organic framework | 0.24 | 43 |
| 2 | UV detection | Sartans | 0.17 | 44 |
| 3 | Colorimetric detection | Eosin Y | 3.5 | 38 |
| 4 | Potentiometric sensing | Iron(III) hydrotris(3,5-dimethylpyrazolyl)borate acetylacetonate chloride | 0.38 | 40 |
| 5 | Fluorescent sensing | Water soluble Cu(II) complex | 0.26 | 41 |
| 6 | Fluorescent sensing | 7-Nitrobenzo-1,2,5-oxadiazole-4-thiol-dansyl sulfonate dyad | 0.48 | 39 |
| 7 | EC bio-sensing | Laccase enzyme | 2.5 | 37 |
| 8 | EC sensing | h-BNNS | 0.0001 | This study |
3.8. Long-term stability, reusability, and reproducibility of h-BNNS/GCE
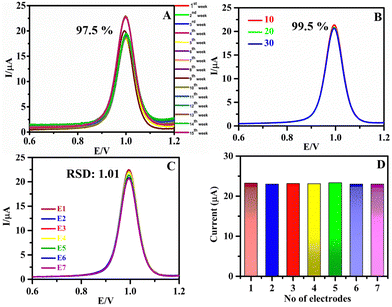
The current response of SA was monitored every week to obtain the stability of h-BNNS and is given in Fig. 6A. The h-BNNS/GCE retained 97.5% of the initial current response after 105 (15th week) days of storage from the initial drop cast of h-BNNS/GCE. The long-term stability of the h-BNNS/GCE sensor depends on two factors: (i) the inherent stability of the h-BNNS material and (ii) the adhesion of drop casting h-BNNS onto the GCE. The former can be explained based on the structural properties of the prepared h-BNNS. Furthermore, h-BNNS does not undergo oxidation or decomposition, so instability of h-BNNS does not arise. Hence, the long-term stability of the h-BNNS/GCE observed reveals the strong interaction between the h-BNNS and the GCE electrode and can be assigned to the nanosheet-like structure of h-BNNS, which has improved the effective surface area and hence can spread easily onto the GCE surface. Moreover, the TEM analysis of h-BNNS was recorded after 100 days (Fig. S7, ESI†) revealing that the morphology of h-BNNS remains the same with no or minimal change in the structure, which is evident in the stability of the h-BNNS. Furthermore, the reusability of h-BNNS/GCE was evaluated by washing the electrode immediately and Fig. 6B shows the result after 30 times of washing. The 99.5% retention of the initial value of current proves that the material has significant reusability. For the reproducibility studies, the current responses of seven different electrodes were examined (Fig. 6C and D) and the RSD of the peak currents of these individually prepared electrodes was found to be within ∼1.01%, indicating the reproducibility of the electrode.3.9. Real sample analysis
The sensing studies were extended to real water samples such as GW, TW, and CW. The GW, TW, and CW were spiked with SA at different concentration levels (0.5 to 30 nM), analyzed and the recovery amounts were calculated (Table 3). The recovery calculated was found to be in the range of 99.8 to 101.06%, which shows the selective sensing capability of the h-BNNS/GCE towards SA without any interference from the components present in the environmental water samples. The calibration graphs corresponding to the GW, CW, and TW samples (Fig. 7A–C) display good R2 values of 0.9783, 0.9772, and 0.9783, respectively with the corresponding linear regression equation as Ipa (μA) = 0.86974 × (μM) + 0.90498, Ipa (μA) = 0.85072 × (μM) + 0.90547, and Ipa (μA) = 0.82171 × (μM) + 0.91447, respectively. Moreover, the slopes of the calibration plots for real samples (GW, TW, and CW) are very close to that for PBS (Fig. 4B), confirming the excellent anti-interfering ability. All of these results confirm that the proposed h-BNNS/GCE can be implemented for SA determination in the environment samples.| Sample no. | Analyte | Analyte spiked (nM) | Environmental samples | Found (nM) | Recovery (%) |
|---|---|---|---|---|---|
| 1 | Sodium azide | 0.5 | GW | 0.501 | 100.20 |
| TW | 0.499 | 99.80 | |||
| CW | 0.501 | 100.20 | |||
| 2 | 1 | GW | 1.000 | 100.00 | |
| TW | 1.010 | 101.00 | |||
| CW | 1.000 | 100.00 | |||
| 3 | 2 | GW | 2.021 | 101.00 | |
| TW | 1.998 | 99.90 | |||
| CW | 2.000 | 100.00 | |||
| 4 | 5 | GW | 5.011 | 100.20 | |
| TW | 5.001 | 100.02 | |||
| CW | 4.999 | 99.98 | |||
| 5 | 10 | GW | 10.104 | 101.04 | |
| TW | 10.103 | 101.03 | |||
| CW | 10.106 | 101.06 | |||
| 6 | 20 | GW | 20.013 | 100.07 | |
| TW | 20.007 | 100.03 | |||
| CW | 20.008 | 100.04 | |||
| 7 | 30 | GW | 30.008 | 100.02 | |
| TW | 30.006 | 100.02 | |||
| CW | 30.015 | 100.05 |
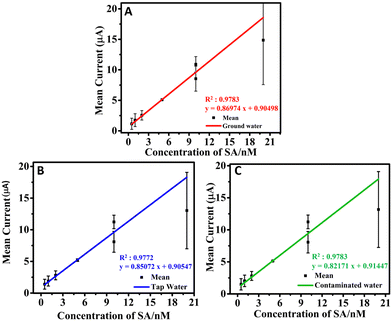 | ||
| Fig. 7 (A)–(C) LDR obtained for the sensing of SA on the h-BNNS/GCE in GW, TW, and CW for the concentration range of 0.5 to 20 nM. | ||
Furthermore, the LOD of 0.1 nM value obtained in PBS was retained even in GW as the electrolyte (Fig. S8, ESI†). Thus, the result is indicative of the sensitivity and selectivity of the electrode towards SA sensing in complex real water samples where the presence of different organic compounds or species will make the sensing usually difficult. Notably, no other literature report has demonstrated the applicability of electrodes in GW, TW, and CW for sensing SA.
4. Conclusion
Here in this work, we have successfully demonstrated, for the first time, the merits of a solvent-exfoliated h-BN for the EC sensing of a primary explosive compound, SA, which can detect up to ppt (10−10 M) levels and is the lowest reported, so far. In addition, it shows excellent selectivity for SA. Moreover, there are no literature reports of GCE or h-BN-based materials for SA sensing, and the developed h-BNNS/GCE could detect SA in real water samples with no interference. Besides, the electrode preparation is simple as it involves only a solvent exfoliation of h-BN to h-BNNS via ultrasonication and is environmentally benign. Moreover, the electrode exhibits excellent reusability, reproducibility, and stability. Thus, in this work, a simple and cost-effective electrode for the sensing of SA is reported, which according to the results, is indeed a promising electrode for detecting SA ions in complex environmental samples.Conflicts of interest
There are no conflicts to declare.Acknowledgements
The authors acknowledge the Indian Institute of Space Science and Technology (IIST) for the research fellowship and funding.References
- J. Xu and G. M. Swain, Oxidation of Azide Anion at Boron-Doped Diamond Thin-Film Electrodes, Anal. Chem., 1998, 70, 1502–1510 CrossRef CAS.
- A. Dalmia, R. F. Savinell and C. C. Liu, The Anodic Behavior of Azide Ions on Gold and Platinum Electrodes in Neutral Electrolyte, J. Electrochem. Soc., 1996, 143, 1827–1833 CrossRef CAS.
- M. K. Sezgintürk, T. Göktuǧ and E. Dinçkaya, A biosensor based on catalase for determination of highly toxic chemical azide in fruit juices, Biosens. Bioelectron., 2005, 21, 684–688 CrossRef PubMed.
- T. Szabados, et al., A chronic Alzheimer's model evoked by mitochondrial poison sodium azide for pharmacological investigations, Behav. Brain Res., 2004, 154, 31–40 CrossRef CAS PubMed.
- E. A. Betterton, Critical Reviews in Environmental Science and Technology Environmental Fate of Sodium Azide Derived from Automobile Airbags, 2010, pp. 37–41 Search PubMed.
- P. L. Annable and L. A. Sly, Azide determination in protein samples by ion chromatography, J. Chromatogr. A, 1991, 546, 325–334 CrossRef CAS PubMed.
- K. Tsuge, M. Kataoka and Y. Seto, Rapid determination of cyanide and azide in beverages by microdiffusion spectrophotometric method, J. Anal. Toxicol., 2001, 25, 228–236 CrossRef CAS PubMed.
- F. Daigle, F. Trudeau, G. Robinson, M. R. Smyth and D. Leech, Mediated reagentless enzyme inhibition electrodes, Biosens. Bioelectron., 1998, 13, 417–425 CrossRef CAS.
- K. Wang, et al., A metal-free turn-on fluorescent probe for the fast and sensitive detection of inorganic azides, Bioorg. Med. Chem. Lett., 2016, 26, 1651–1654 CrossRef CAS PubMed.
- X. Wan, et al., UiO-66/Carboxylated Multiwalled Carbon Nanotube Composites for Highly Efficient and Stable Voltammetric Sensors for Gatifloxacin, ACS Appl. Nano Mater., 2023, 6, 19403–19413 CrossRef CAS.
- G. Li, et al., Lamellar α-Zirconium Phosphate Nanoparticles Supported on N-Doped Graphene Nanosheets as Electrocatalysts for the Detection of Levofloxacin, ACS Appl. Nano Mater., 2023, 6, 17040–17052 CrossRef CAS.
- G. Li, et al., Highly stable electrochemical sensing platform for the selective determination of pefloxacin in food samples based on a molecularly imprinted-polymer-coated gold nanoparticle/black phosphorus nanocomposite, Food Chem., 2024, 436, 137753 CrossRef CAS PubMed.
- C. Rajkumar, P. Veerakumar, S. M. Chen, B. Thirumalraj and K. C. Lin, Ultrathin Sulfur-Doped Graphitic Carbon Nitride Nanosheets As Metal-Free Catalyst for Electrochemical Sensing and Catalytic Removal of 4-Nitrophenol, ACS Sustainable Chem. Eng., 2018, 6, 16021–16031 CrossRef CAS.
- R. A. Dar, et al., Performance of graphene-zinc oxide nanocomposite coated-glassy carbon electrode in the sensitive determination of para-nitrophenol, Sci. Rep., 2022, 12, 1–14 CrossRef PubMed.
- A. Ramachandran, J. S. Arya Nair and S. Karunakaran Yesodha, Polyaniline-Derived Nitrogen-Doped Graphene Quantum Dots for the Ultratrace Level Electrochemical Detection of Trinitrophenol and the Effective Differentiation of Nitroaromatics: Structure Matters, ACS Sustainable Chem. Eng., 2019, 7, 6732–6743 CrossRef CAS.
- A. Suzuki, et al., Direct electrochemical detection of sodium azide in physiological saline buffers using highly boron-doped diamond electrodes, Sens. Actuators, B, 2007, 120, 500–507 CrossRef CAS.
- K. Li, et al., Sensitive electrochemical detection of sodium azide based on the electrocatalytic activity of the pasting liquid of a carbon paste electrode, Anal. Bioanal. Chem., 2018, 410, 4953–4957 CrossRef CAS PubMed.
- I. Svancara and J. Zima, Possibilities and Limitations of Carbon Paste Electrodes in Organic Electrochemistry, Curr. Org. Chem., 2011, 15, 3043–3058 CrossRef CAS.
- K. Muzyka, et al., Boron-doped diamond: Current progress and challenges in view of electroanalytical applications, Anal. Methods, 2019, 11, 397–414 RSC.
- J. S. Arya Nair, S. Saisree, R. Aswathi and K. Y. Sandhya, Ultra-selective and real-time detection of dopamine using molybdenum disulphide decorated graphene-based electrochemical biosensor, Sens. Actuators, B, 2022, 354, 131254 CrossRef CAS.
- V. Guerra, et al., 2D boron nitride nanosheets (BNNS) prepared by high-pressure homogenisation: Structure and morphology, Nanoscale, 2018, 10, 19469–19477 RSC.
- C. Huang, et al., Stable colloidal boron nitride nanosheet dispersion and its potential application in catalysis, J. Mater. Chem. A, 2013, 1, 12192–12197 RSC.
- A. García-Miranda Ferrari, et al., Tailoring the electrochemical properties of 2D-hBN: Via physical linear defects: Physicochemical, computational and electrochemical characterisation, Nanoscale Adv., 2020, 2, 264–273 RSC.
- Y. Xue, et al., Excellent electrical conductivity of the exfoliated and fluorinated hexagonal boron nitride nanosheets, Nanoscale Res. Lett., 2013, 8, 1–7 CrossRef PubMed.
- A. García-Miranda Ferrari, S. J. Rowley-Neale and C. E. Banks, Recent advances in 2D hexagonal boron nitride (2D-hBN) applied as the basis of electrochemical sensing platforms, Anal. Bioanal. Chem., 2021, 413, 663–672 CrossRef PubMed.
- Y. Shen, H. Yan, H. Guo, Y. Long and W. Li, Defect-rich hexagonal boron nitride for the simultaneous determination of 4-aminophenol and phenol, Sens. Actuators, B, 2020, 303, 127248 CrossRef CAS.
- Q. Li, et al., Preparation of flake hexagonal BN and its application in electrochemical detection of ascorbic acid, dopamine and uric acid, Sens. Actuators, B, 2018, 260, 346–356 CrossRef CAS.
- J. Hassan, et al., Application of Chemically Exfoliated Boron Nitride Nanosheets Doped with Co to Remove Organic Pollutants Rapidly from Textile Water, Nanoscale Res. Lett., 2020, 15, 1–13 CrossRef PubMed.
- A. F. Khan, D. A. C. Brownson, E. P. Randviir, G. C. Smith and C. E. Banks, 2D Hexagonal Boron Nitride (2D-hBN) Explored for the Electrochemical Sensing of Dopamine, Anal. Chem., 2016, 88, 9729–9737 CrossRef CAS PubMed.
- Q. Liu, C. Hu and X. Wang, One-pot solvothermal synthesis of water-soluble boron nitride nanosheets and fluorescent boron nitride quantum dots, Mater. Lett., 2019, 234, 306–310 CrossRef CAS.
- B. Zhang, et al., High-efficient liquid exfoliation of boron nitride nanosheets using aqueous solution of alkanolamine, Nanoscale Res. Lett., 2017, 12, 0–6 Search PubMed.
- R. Bari, et al., Liquid phase exfoliation and crumpling of inorganic nanosheets, Phys. Chem. Chem. Phys., 2015, 17, 9383–9393 RSC.
- T. Kokulnathan, T. J. Wang, M. Thangapandian and S. O. Alaswad, Synthesis and characterization of hexagonal boron nitride/halloysite nanotubes nanocomposite for electrochemical detection of furazolidone, Appl. Clay Sci., 2020, 187, 105483 CrossRef CAS.
- S. Angizi, A. Hatamie, H. Ghanbari and A. Simchi, Mechanochemical Green Synthesis of Exfoliated Edge-Functionalized Boron Nitride Quantum Dots: Application to Vitamin C Sensing through Hybridization with Gold Electrodes, ACS Appl. Mater. Interfaces, 2018, 10, 28819–28827 CrossRef CAS PubMed.
- A. F. Khan, D. A. C. Brownson, C. W. Foster, G. C. Smith and C. E. Banks, Surfactant exfoliated 2D hexagonal Boron Nitride (2D-hBN) explored as a potential electrochemical sensor for dopamine: Surfactants significantly influence sensor capabilities, Analyst, 2017, 142, 1756–1764 RSC.
- A. G. Eldin, A. E. G. E. Amr, A. H. Kamel and S. S. M. Hassan, Screen-printed Microsensors Using Polyoctyl-thiophene (POT) Conducting Polymer As Solid Transducer for Ultratrace Determination of Azides, Molecules, 2019, 24(7), 1392 CrossRef CAS PubMed.
- D. Leech, Optimisation of a reagentless laccase electrode for the detection of the inhibitor azide, Analyst, 1998, 123(7), 1971–1974 RSC.
- J. Wang, H. Yu and Y. He, Eosin Y as a high-efficient photooxidase mimic for colorimetric detection of sodium azide, Anal. Bioanal. Chem., 2020, 412, 7595–7602 CrossRef CAS PubMed.
- Y. A. Jeong, I. J. Chang and S. K. Chang, Discriminative sensing of sulfide and azide ions in solution by a nitrobenzoxadiazole-dansyl dyad by simply tuning the water content, Sens. Actuators, B, 2016, 224, 73–80 CrossRef CAS.
- A. K. Singh, U. P. Singh, V. Aggarwal and S. Mehtab, Azide-selective sensor based on tripodal iron complex for direct azide determination in aqueous samples, Anal. Bioanal. Chem., 2008, 391, 2299–2308 CrossRef CAS PubMed.
- K. Dhara, et al., A new water-soluble copper(II) complex as a selective fluorescent sensor for azide ion, Chem. Commun., 2010, 46, 1754–1756 RSC.
- B. J. Morris, D. C. Willcox, T. A. Donlon and B. J. Willcox, FOXO3: A Major Gene for Human Longevity–A Mini-Review, Gerontology, 2015, 61(6), 515–525 CrossRef CAS PubMed.
- S. Zhang, P. Han and Y. Xia, Facile extraction of azide in sartan drugs using magnetized anion-exchange metal–organic frameworks prior to ion chromatography, J. Chromatogr. A, 2017, 1514, 29–35 CrossRef CAS PubMed.
- M. Gričar and S. Andrenšek, Determination of azide impurity in sartans using reversed-phase HPLC with UV detection, J. Pharm. Biomed. Anal., 2016, 125, 27–32 CrossRef PubMed.
Footnote |
| † Electronic supplementary information (ESI) available. See DOI: https://doi.org/10.1039/d3ma00999h |
| This journal is © The Royal Society of Chemistry 2024 |

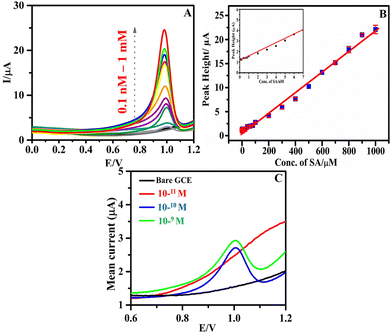
![[thin space (1/6-em)]](https://www.rsc.org/images/entities/char_2009.gif) 000 ppb) (inset: LDR fit obtained for the lower concentrations of SA (0.1–10 nM)); and (C) the DPV response of 0.006 ppb (10−10 M) SA on h-BNNS/GCE in 0.1 M PBS at the scan rate of 80 mV s−1.
000 ppb) (inset: LDR fit obtained for the lower concentrations of SA (0.1–10 nM)); and (C) the DPV response of 0.006 ppb (10−10 M) SA on h-BNNS/GCE in 0.1 M PBS at the scan rate of 80 mV s−1.