DOI:
10.1039/D3MA00962A
(Paper)
Mater. Adv., 2024,
5, 2826-2840
Ultra-responsive and highly sensitive 1D ZnO nanotubes for detecting perilous low levels of NO2 gas†
Received
3rd November 2023
, Accepted 29th January 2024
First published on 5th February 2024
Abstract
1D ZnO nanotubes were synthesized using a combination of chemical bath deposition (CBD) and thermal methods. The resulting ZnO nanotubes maintained a hexagonal crystal structure with an average length of 500–700 nm. The 1D ZnO nanotube sensor developed in this study exhibited remarkable responses of 84% for 5 ppm and 20% for 1 ppm NO2 at a relatively low operating temperature of 200 °C, significantly below the exposure limit of 20 ppm. Additionally, the 1D ZnO nanotube sensor demonstrated rapid response times of 1 second for 1 ppm NO2 and 2.85 seconds for 5 ppm NO2. The superior performance of the 1D ZnO nanotube sensor, when compared to those of nanoparticles and broken nanotubes, can be attributed to its higher surface area, enhanced charge transport, and improved sensitivity in gas sensing applications. Impedance spectroscopy was employed to investigate the mechanism responsible for the increase in resistance due to NO2 gas molecule adsorption on ZnO nanotubes. Consequently, 1D ZnO nanotubes exhibit significant potential for the development of advanced gas sensing devices.
1. Introduction
Rapid industrial expansion and vehicle emissions have led to the release of various hazardous gases into the environment, resulting in a range of health consequences.1–6 Some of the most common polluting gases include hydrogen disulfide (H2S), nitrogen dioxide (NO2), acetone, and ammonia (NH3).7–10 These gases have considerable health repercussions and are significant contributors to lung diseases like emphysema, respiratory irritation syndrome, and chronic obstructive pulmonary disease.11–13 In particular, NO2 is a highly toxic gas and is a major contributor to air pollution.14,15 Prolonged exposure to high levels of NO2 can cause respiratory problems, such as bronchitis and asthma, and may even lead to lung cancer.14,16–18 The World Health Organization (WHO) has conducted extensive research on the health risks associated with NO2 emissions and has included NO2 as one of the harmful pollutants in its air pollution standards for higher concentrations.19 Exposure to high levels of NO2 can lead to respiratory problems and other health issues, underscoring the importance of being able to detect and monitor its concentration in air.20 The allowable NO2 exposure level is 5–25 ppm, as per the most recent Occupational Safety and Health Administration regulations.7,21,22 In the environment, NO2 may mix with oxygen, water, and other compounds to create acid rain.14,23 This can have detrimental effects on the stability of ecosystems. Therefore, there is a critical need for efficient NO2 gas sensors that can identify and measure low amounts of NO2 in the atmosphere.
Metal oxide semiconductor (MOS) resistance gas sensors are commonly used as sensing devices due to their simplicity, compact size, rapid and dependable response and exceptional sensitivity.19,24,25 Various MOS materials have been reported as NO2 sensors, including Nb2O5,26 CuO,27 NiO,28 SnO2,29 In2O3,30 CeO2,31 WO3,32,33 and Fe2O3.34 However, their selectivity and response were poor at a working temperature of 200 °C. Among the range of MOS materials, ZnO emerges as a standout candidate for sensing applications. Its advantages include a large band gap (3.37 eV), widespread availability, and straightforward synthesis. Additionally, ZnO shows good electron mobility, inherent sensing capabilities, and robust electrical properties and offers the most diverse range of nanostructures.35–41 Furthermore, it has drawn the attention of many researchers due to its excellent ability to detect NO2 gas. A comparison of NO2 responses of ZnO-based sensors with those of other materials demonstrates that ZnO-based sensors are capable of detecting NO2 gas, as shown in Table 1.
Table 1 NO2 responses of ZnO-500 nanotubes compared to those of other materials described in the literature
| Materials |
Synthesis method |
Morphology |
Operating temperature (°C) |
NO2 concentration (ppm) |
Gas response (%) |
Response time (s) |
Recovery time (s) |
Ref. |
| WO3 |
Hydrothermal |
Nanoflowers |
200 |
1 |
6.78 |
|
|
32
|
| SnO2 |
Thermal evaporation |
Nanoparticles |
200 |
5 |
31 |
9.0 |
135 |
29
|
| NiO |
Chemical spray pyrolysis |
Pores |
200 |
20 |
57.3 |
— |
— |
28
|
| Nb2O5–SE |
Sol–gel method |
Spherical grains |
780 |
50 |
14 |
|
|
26
|
| CuO |
Electrospinning method |
Nanofibers |
150 |
1 |
4 |
18 |
3 |
27
|
| ZnO |
Hydrothermal |
Nanosheets |
170 |
50 |
10.2 |
36 |
4 |
90
|
| ZnO |
Chemical |
Nanoneedles |
200 |
200 |
89 |
41 |
125 |
91
|
| CuO–ZnO |
Chemical |
Flakes |
200 |
5 |
8 |
13 |
5 |
46
|
| ZnO |
Chemical bath deposition |
Nanotubes |
200 |
1 |
20 |
1 |
30 |
Present |
| 5 |
84 |
2.85 |
59 |
work |
ZnO-based gas sensors have shown to have rapid recovery/response rates, making them ideal for real-time detection of changes in NO2 concentration.42 This feature is particularly important for ensuring that appropriate measures are taken to reduce exposure to NO2 and prevent potential health hazards. ZnO-based sensors can be utilized not only in industrial and outdoor air pollution monitoring, but also in applications such as indoor air quality monitoring, automotive emission control, and environmental monitoring.43,44 With the continuous advancements in ZnO-based gas sensing technology, the development of even more efficient and reliable NO2 sensors is expected. For instance, Patil et al.45 reported a hierarchical ZnO nanostructure sensor using a catalyst-free thermal evaporation method and its recovery and response times for 1 ppm NO2 were 180 and 48 seconds, respectively, at 200 °C. Chen et al.46 reported CuO–ZnO nanocomposites synthesized using a chemical method. The gas response to 5 ppm NO2 was 8% at 250 °C, with response and recovery times of 5 and 13 seconds. Patil et al.47 reported ZnO nanorods for gas sensing applications using a hydrothermal route and found that the response/recovery times for 10 ppm NO2 were 70 and 30 seconds at 200 °C. Based on the results mentioned above, it appears that the NO2 gas sensors reported in the study may meet some of the desired criteria but not all of them. Ideally, a satisfactory sensor should exhibit fast response, have high selectivity, and demonstrate short response/recovery times. Furthermore, gas sensing selectivity can be enhanced by incorporating specific receptor materials that selectively interact with target gases.48 Additionally, tailoring the sensor's surface properties and optimizing its operating conditions further contribute to its heightened selectivity in gas detection.48,49
Gas sensing properties are influenced not only by the chemical composition, but also by the morphology of the sensing material.50 To date, various ZnO nanostructures, including one-dimensional (1D),51,52 two-dimensional (2D),53 and three-dimensional (3D)54 structures, have been successfully synthesized for gas sensing applications. Among them, 1D nanostructures, especially nanotubes, have received a lot of interest due to their rapid gas diffusion, which significantly improves their gas sensing performance.55,56 In contrast, ZnO nanotubes have emerged as promising candidates for gas sensing applications due to their unique structural and chemical properties.55,57 The scope of ZnO nanotubes in gas sensing lies in their high surface-to-volume ratio and large specific surface area, providing ample sites for gas molecules to interact, leading to enhanced sensitivity.55 Additionally, their tubular morphology facilitates efficient charge transport and rapid response to changes in the gas environment. However, the limitations include challenges in reproducibility and scalability of the synthesis methods, which may hinder large-scale production.58 Advantages of ZnO nanotubes include their intrinsic semiconducting nature, making them suitable for detecting a variety of gases.59 Nevertheless, these sensors may suffer from selectivity issues, as they can be sensitive to multiple gases simultaneously.58 Compared to other oxide materials, ZnO nanotubes exhibit improved sensitivity and response time, owing to their unique nanostructure.55,57,58 The tubular geometry provides more active sites for gas adsorption, enhancing the overall performance. Moreover, ZnO nanotubes can outperform 2D materials in certain aspects due to their three-dimensional structure, offering a larger surface area for gas interaction.59 This structural advantage contributes to a higher sensitivity and a lower detection limit, making ZnO nanotubes a preferable choice for gas sensing applications when compared to some conventional oxides and 2D materials.
In this investigation, we synthesized 1D ZnO nanotubes using a combination of chemical bath deposition (CBD) and thermal methods. The resulting ZnO nanotubes exhibited excellent gas sensitivity and an ultrafast response to NO2 gas, especially at 200 °C working temperature. Models of ZnO nanotubes were proposed to explain the mechanism behind their gas sensitivity. Our findings demonstrate that ZnO nanotube sensors showed a high sensitivity of 84% towards 5 ppm NO2 gas and 20% towards 1 ppm NO2 gas, with ultrafast response times of 1 to 1.21 seconds for detecting both 1 and 5 ppm NO2 gas.
2. Experimental section
2.1. Precursors
The ZnO nanostructured films were synthesized on pre-cleaned glass substrates using 99.99% zinc nitrate hexahydrate [Zn (NO3)2·6H2O] (AR grade) as the precursor. The pH of the solution was adjusted by adding ammonia (NH3) (SD fine chemicals) and hydrogen peroxide (H2O2) (Thomas Baker) was used as the oxidising agent.
2.2. Preparation of ZnO nanostructures
Fig. 1 depicts a schematic representation of the fabrication process of ZnO nanostructures using the CBD method. To prepare the reaction mixture, 2.97 g of Zn (NO3)2·6H2O was dissolved in 50 ml of double distilled water at room temperature. Subsequently, NH3 solution was added dropwise to adjust the pH to 12, and 2–3 ml of H2O2 was added to the solution, which was stirred for 20 minutes. The resulting mixture was transferred to a 100 ml cleaned beaker, where cleaned glass substrates were inserted vertically using a hanging system. The beaker was then placed in another large glass vessel containing paraffin oil, and the entire setup was placed on a magnetic stirrer with a temperature-controlled hot plate at 100 rpm. Sample deposition was carried out at an operating temperature of 70 °C for a duration of 3 hours, followed by 24 hours of drying at room temperature. The produced films were then calcined for 1 hour in air at 100, 200, 300, 400, 500, and 600 °C to obtain the zinc oxide products, indicated as ZnO-100, ZnO-200, ZnO-300, ZnO-400, ZnO-500, and ZnO-600. The calcination temperature can affect the crystal structure, surface area and morphology of ZnO nanostructures, which can influence their sensing properties.
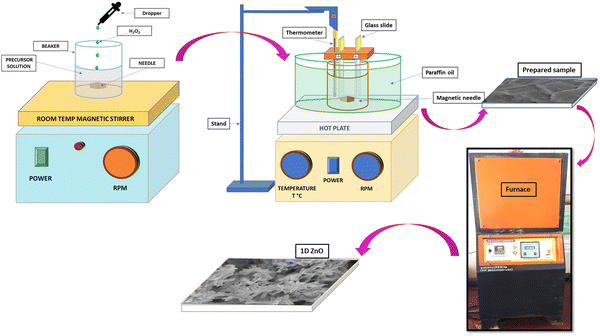 |
| | Fig. 1 Schematic representation of the various stages in the fabrication of 1D ZnO nanotubes using CBD. | |
During the CBD method, the cationic solution (containing metal ions) and the anionic solution (containing a source of anions such as hydroxide or nitrate) are mixed together. Ammonia (NH3) is often used as a complexing agent to form metal–ammonia complexes, which are more stable and soluble than metal ions. Ammonia also acts as an anionic precursor, providing hydroxide ions (OH−) through its reaction with water. These OH− ions then react with metal ions to form metal hydroxide precursors, which can be further converted to metal oxide nanostructures through thermal treatment. The chemical reaction of ZnO nanostructures can be shown by eqn (1)–(4):
| | | Zn(NO3)2 + 2NH4OH → Zn(OH)2 + 2NH4NO3 | (1) |
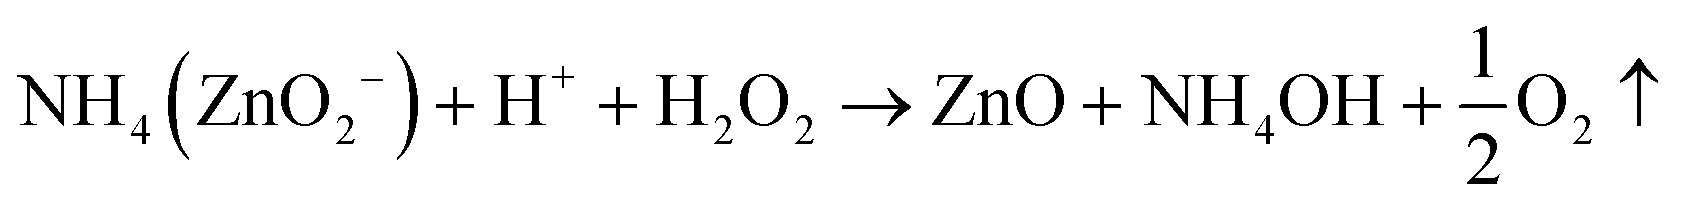
| | | Zn(OH)2 + 2NH4OH → NH4ZnO2− + H+ + H2O | (2) |
| |  | (3) |
| | | ZnO + H2O2 → ZnO + 2OH− | (4) |
At lower temperatures, an excess portion of the Zn melted and approached the surface, leading to increased crystal growth and the formation of nanoparticles. As the calcination temperature increased to 500 °C, crystal growth became even more pronounced, and Zn dissipation was more efficient, resulting in the creation of a greater number of nanotubes. However, at higher calcination temperatures (600 °C), the nanotubes became broken due to the high temperature. These results suggest that careful control of calcination temperature can be used to tailor the microstructure of ZnO nanostructures for sensor devices.
2.3. Characterization techniques
The characteristics of the ZnO nanostructures have been examined using X-ray diffraction analysis (XRD, Rigaku, Ultima IV, Cu Kα/40 kV/40 mA), field emission scanning electron microscopy (FESEM, FEI Nova Nano SEM 450), and X-ray photoelectron spectroscopy (XPS, VG Multilab 2000, Thermo Scientific). The vibrational modes of the materials were analyzed using a Raman spectrometer (WITec-Alpha 300) with a laser wavelength of 532 nm. The specific surface area and pore size distribution of the materials were determined by performing BET analysis using NOVA and Quantachrome instruments.
2.4. Gas sensing test
Gas sensing tests were performed on ZnO nanostructures in a specialized 250cc gas sensor apparatus, and the ZnO nanostructure sensor's response to different gases was measured over a range of 100–300 °C. The target gases (H2S, SO2, ethanol, and NO2) were sourced from certified cylinders with a purity level of 99%. The gas sensing data were collected using a Keithley-6514 programmable electrometer.60 To find the optimum operating temperature, the sensitivity of a ZnO nanostructure sensor to 1 ppm and 5 ppm NO2 was evaluated at various operating temperatures. Additionally, the sensor response/recovery properties were assessed by varying the concentrations of gas. The response (S%) was calculated using eqn (5):32,33| |  | (5) |
where Rg and Ra represent the sensor resistance when exposed to the gas and air.
3. Results and discussion
3.1. Characterization of synthesized ZnO nanostructures
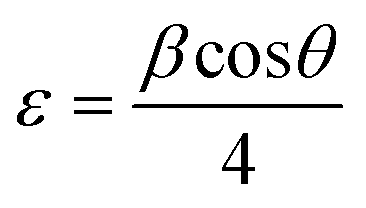
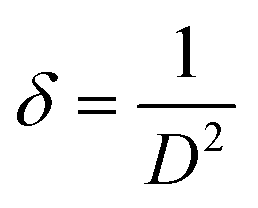
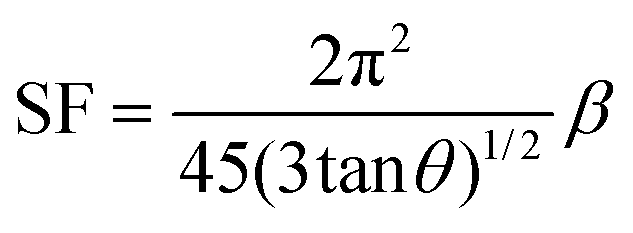
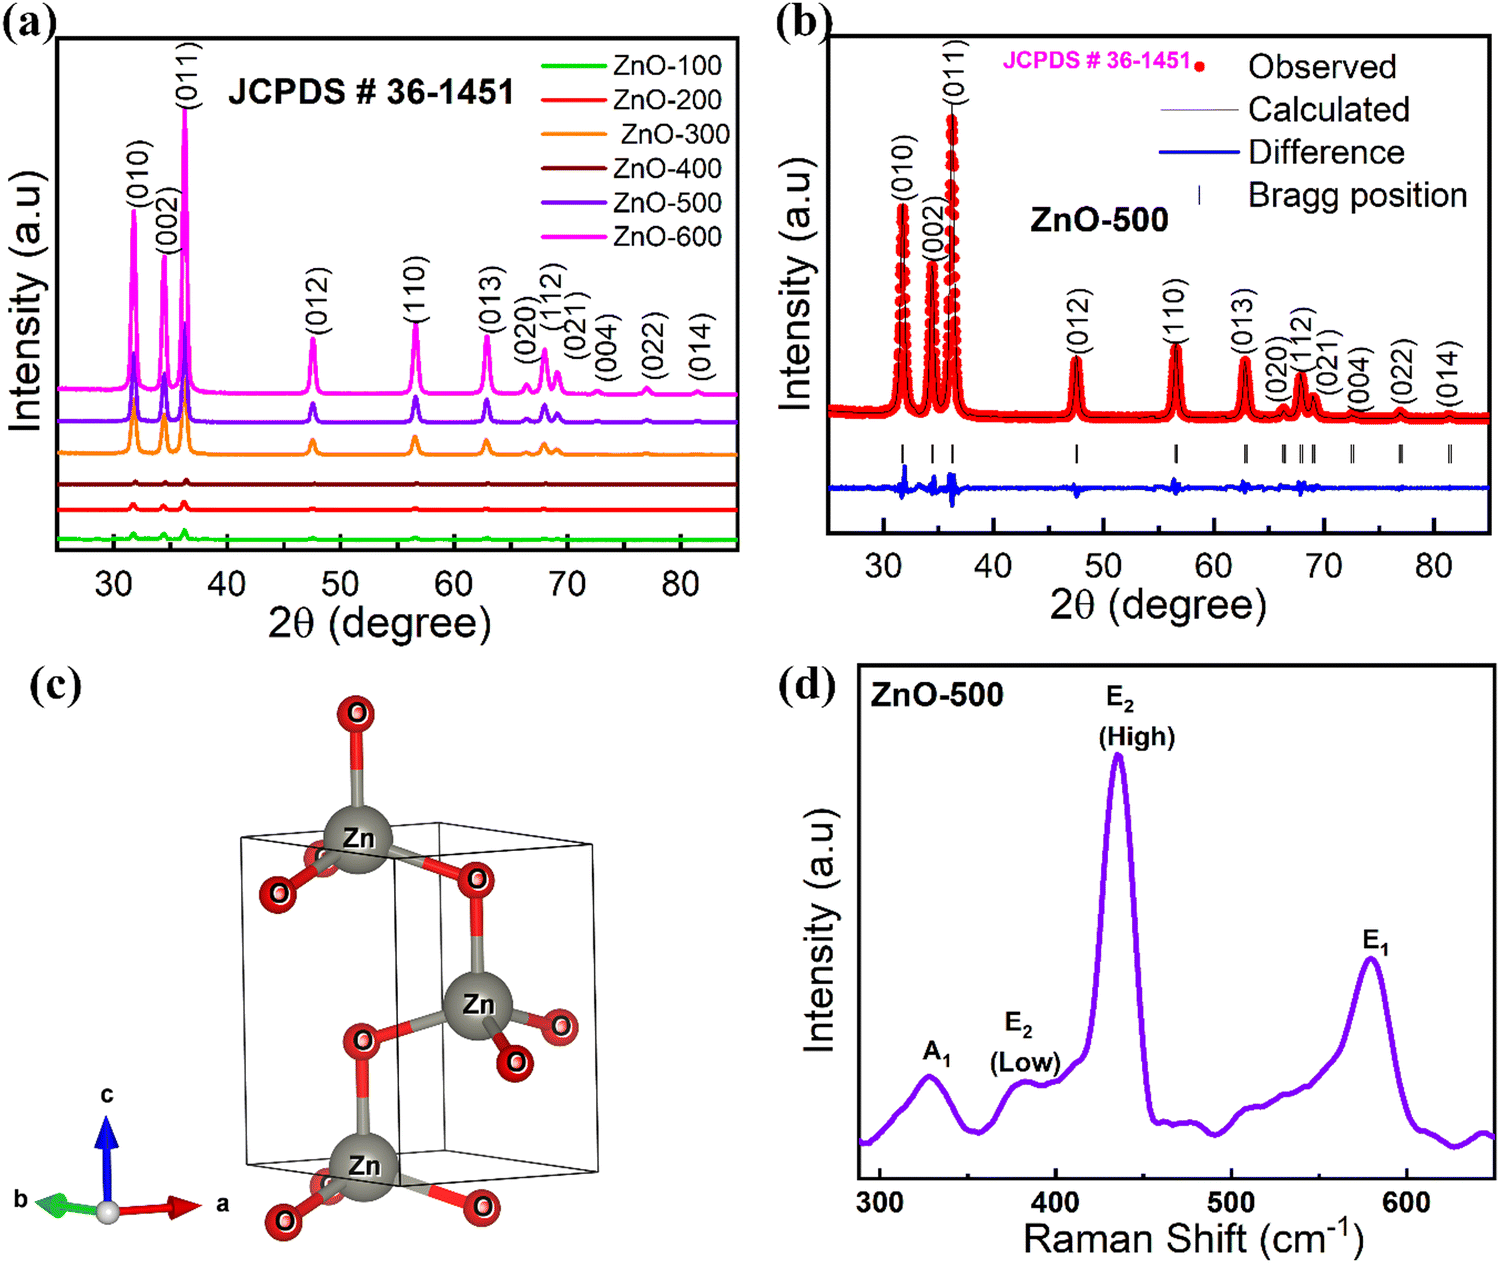
XRD is a widely used analytical technique that can be used to determine the crystalline structure. Fig. 2 shows the XRD patterns of ZnO-100, ZnO-200, ZnO-300, ZnO-400, ZnO-500, and ZnO-600 nanostructures, which reveal that all the samples have the same hexagonal crystalline structure with the space group P63mc and lattice constants of a = b = 0.32490 nm and c = 0.52040 nm (ICSD 57450) (Fig. 2(a)). A pure phase with hexagonal crystal structure has formed, according to the Rietveld refinement study of the XRD pattern of ZnO-500, as illustrated in Fig. 2(b). The lattice parameters were calculated using the Full-Prof suite software. Fig. 2(c) shows the schematic unit cell crystal structure obtained from output refinement data. The VESTA software package was used to visualize the crystal structure. The XRD analysis also provided information on the dislocation density (δ), stacking fault (SF), and micro-strain (ε), as indicated in Table S1 (ESI†).| |  | (6) |
| |  | (7) |
| |  | (8) |
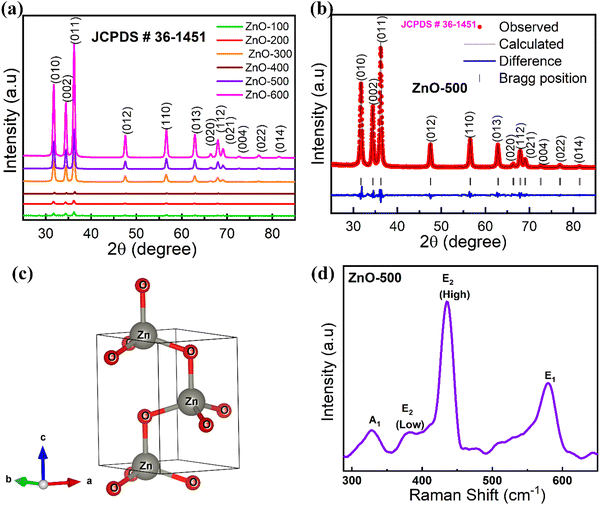 |
| | Fig. 2 Crystal structure determination. (a) XRD spectra of ZnO nanostructures produced on a glass substrate: ZnO-100, ZnO-200, ZnO-300, ZnO-400, ZnO-500 and ZnO-600 nanostructures. (b) Rietveld-refined XRD pattern of ZnO-500 nanostructures. (c) The crystal structures of ZnO-500 were determined by fitting data and visualized using the VESTA software. (d) Raman spectra of ZnO-500 nanostructures. | |
The ZnO nanostructures were found to be highly sensitive to calcination temperature, as evidenced by changes in microstrain, dislocation density and stacking fault.
Raman spectroscopy is indeed a powerful technique for identifying and characterizing vibrational modes in molecules. The ZnO-500 nanotubes exhibit four Raman-active modes: E1 longitudinal optical (LO), E2 (high), E2 (low), and A1 (TO) modes, as shown in Fig. 2(d). The E1 longitudinal optical (LO) mode, which involves the displacement of Zn and O atoms in opposite directions along the c-axis, occurs at ∼578 cm−1.43 The E2 (high) mode, also known as the A1 (longitudinal) mode or the Raman active mode, occurs at ∼441 cm−1 and involves the in-plane vibration of O atoms. The E2 (low) mode occurs at ∼379 cm−1 and involves the out-of-plane vibration of Zn atoms; this mode is also known as the E1 (transverse) mode or the Raman inactive mode. Finally, the A1 mode occurs at ∼332 cm−1 and involves transverse optical vibration of the oxygen atoms along the c-axis. This mode is also known as the E mode or the R3 mode.
FESEM characterization was utilized to analyze the surface morphology of all ZnO nanostructure samples. ZnO-100 displayed a flake-like, porous structure (Fig. 3(a)), which is consistent with previous reports.61,62Fig. 3(b) and (c) show that the porous morphological structure becomes more prominent in the ZnO-200 and ZnO-300 nanostructures. The FE-SEM image of ZnO-400 in Fig. 3(d) shows the transformation of the porous structure into nanoparticles, which have dimensions ranging from 55.8 to 45.0 nm. Furthermore, the nanotube-like structure of ZnO-500 observed in Fig. 3(e) has a unique morphology with a nanotube length of approximately 400–700 nm, a diameter of 150 nm, and walls that are approximately 46 nm thick. The high aspect ratio of these structures has the potential to provide a large surface area, which could be useful for gas sensing applications. The rough and porous surface of the ZnO nanotubes observed at high magnification (as shown in the inset of Fig. 3(e)) can increase the surface area of the nanotubes. This enhanced surface area can create additional sites for gas adsorption and reaction, which can ultimately lead to improved sensitivity in gas sensing. The porous structure can also allow for better gas diffusion and access to the interior of the nanotubes, leading to more efficient gas sensing performance. However, higher calcination temperatures of ZnO-600 lead to the breakdown of these nanotubes, as shown in Fig. 3(f). The diameter of the broken holes ranges from 505 to 605 nm, which can restrict their suitability for gas sensing applications. Fig. 3(g) presents a histogram of 1D ZnO-500 nanotube size distribution, with an average nanotube length of 500–700 nm. Additionally, Fig. 3(h) shows EDS mapping of the nanotubes, confirming the successful synthesis of ZnO.
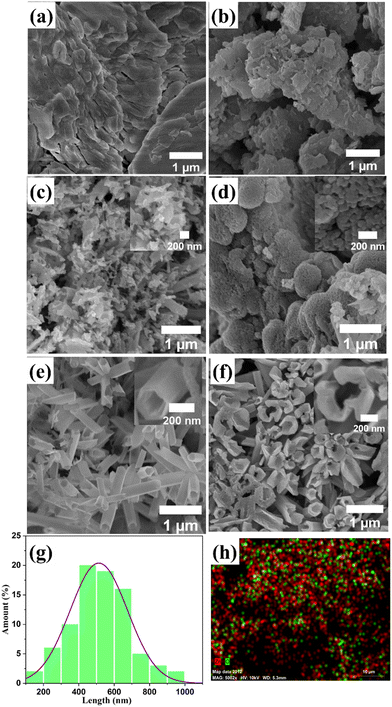 |
| | Fig. 3 FESEM images of ZnO nanostructures. (a) ZnO-100 shows a porous and flake-type structure, (b) ZnO-200 shows a porous structure, (c) ZnO-300 shows a porous structure with a high porosity, (d) ZnO-400 shows nanoparticles, (e) ZnO-500 shows nanotubes, (f) ZnO-600 shows broken nano-holes. (g) Histogram plot showing the length distribution of ZnO-500 nanotubes and (h) EDS mapping of ZnO-500 nanotubes. | |
EDS analysis was performed to obtain elemental mapping of Zn and O in ZnO-100, ZnO-200, ZnO-300, ZnO-400, and ZnO-600 nanostructures, as depicted in Fig. S1 (ESI†). The results demonstrate that Zn and O are the primary elements present in the prepared samples, indicating the formation of ZnO nanostructures. Moreover, the chemical composition and purity of ZnO-100, ZnO-200, ZnO-300, ZnO-400, ZnO-500, and ZnO-600 nanostructures were analyzed using EDS spectra, which are displayed in Fig. 4(a)–(f). The inset tables in Fig. 4(a)–(f) provide the atomic and weight % and intensities of Zn and O in each sample. The data suggest that the calcination process caused some variation in the atomic and weight percentages, which could be attributed to heat agitation in the prepared samples.
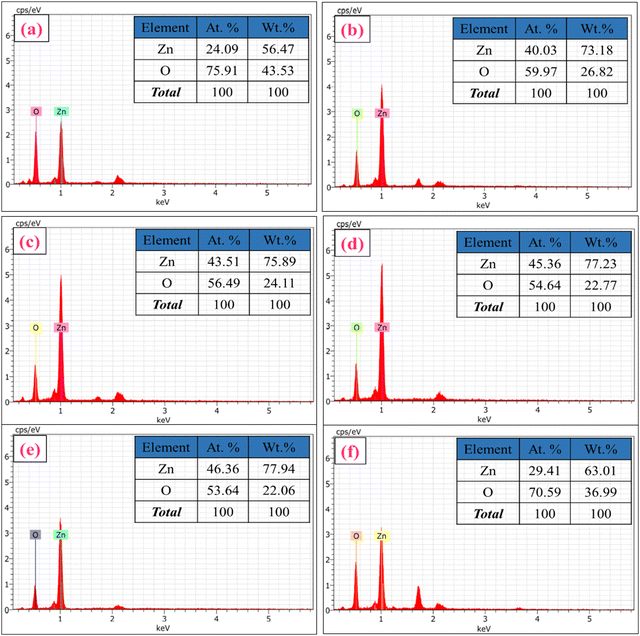 |
| | Fig. 4 EDS spectra and elemental composition of ZnO nanostructures. (a) ZnO-100, (b) ZnO-200, (c) ZnO-300, (d) ZnO-400, (e) ZnO-500, and (f) ZnO-600. | |
The BET surface area measurement is a widely used method for determining the specific surface area of a material. It relies on analyzing the adsorption isotherm of a gas onto a solid surface, with the amount of gas adsorbed being proportional to the surface area of the material. Fig. S2 (ESI†) depicts the surface areas and nitrogen physical adsorption–desorption isotherms of different ZnO nanostructures. Surface area is a critical structural property greatly influenced by morphology. The BET surface areas of ZnO-300 (porous structures), ZnO-400 (nanoparticles), ZnO-500 (nanotubes), and ZnO-600 (broken nanotubes) are 30.4527, 40.8447, 56.9546, and 50.5161 m2 g−1, respectively. These BET findings show that nanotubes have a greater surface area than porous structures, nanoparticles, and broken nanotubes. This suggests that the cylindrical shape of the nanotube structure is responsible for its larger surface area when compared to other structures. Nanotubes are cylindrical structures that provide a very large surface area per unit mass. The walls of the nanotubes are also very thin, typically only 46 nm in thickness, which means that a significant fraction of the atoms in the material are located on the surface. This leads to a very high surface area and makes nanotubes attractive for gas sensing. On the other hand, the lower surface area of ZnO-300 porous structures can be attributed to their irregular and disordered morphology, which leads to a lower surface area per unit mass. The same is true for ZnO-400 nanoparticles, which have a relatively low surface area due to their small size and spherical shape. ZnO-400 (nanoparticles) has a higher surface area compared to ZnO-300 because the nanoparticles have a smaller size and higher surface-to-volume ratio, resulting in a larger surface area per unit mass. ZnO-600 broken nanotubes, although they have a similar morphology to nanotubes, have a lower surface area compared to ZnO-500, possibly due to structural defects that may have occurred during the breakdown process. The breakdown of the nanotube structure reduces the overall surface area of the ZnO-500 sample.
XPS was employed to clarify the compositions and electronic states of ZnO nanostructure samples. In the ESI,† Fig. S3(a)–(f) shows a wide region survey spectrum of ZnO nanostructures, which indicates the presence of oxygen (O), zinc (Zn), and carbon (C) elements in the ZnO-100 to ZnO-600 nanostructures. The peak observed at around 537–528 eV indicates the presence of oxidized metal ions O–Zn in ZnO. In Fig. 5(a), high-resolution XPS spectra of ZnO-100 nanostructures show the absence of elemental Zn in ZnO nanostructures, as evidenced by a shift in the binding energy (BE) over 1021 eV. The peak at 1021.3 eV is associated with Zn 2p3/2 species in stoichiometric ZnO.63 The additional peak at 1025 eV corresponds to groups of –OH connected to Zn ions on the nanostructures' surfaces or Zn-deficient areas.63,64 The Zn 2p1/2 XPS spectra generated two satellites at 1045.1 and 1050.1 eV, corresponding to Zn 2p1/2 in the ZnO matrix and the –OH impurities bound to Zn ions.63 As shown in Fig. 5(b), the ZnO-500 nanostructures displayed two peaks in the Zn 2p spectrum at around 1043.69 and 1020.68 eV, respectively. These peaks corresponded to Zn 2p1/2 and Zn 2p3/2.65,66 The XPS data suggest that a low calcination temperature of 100 °C (ZnO-100 porous nanostructures) shows groups of –OH connected to Zn ions on the nanostructures' surfaces, while a higher calcination temperature of 500 °C (ZnO-500 nanotubes) exhibits pure ZnO nanostructures.
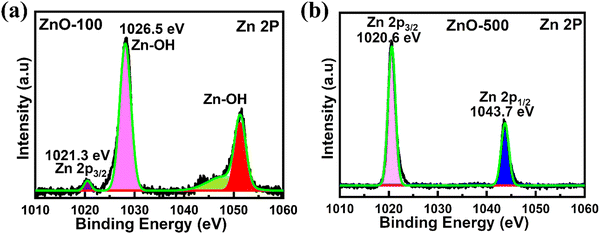 |
| | Fig. 5 XPS spectra of the Zn 2p peak of ZnO nanostructures of (a) ZnO-100 and (b) ZnO-500 samples. | |
3.2. Gas sensing studies
3.2.1. Working temperature effect.
Determining the optimal working temperature is crucial for the performance of gas sensors. The sensor response values are typically influenced by the sensing temperature due to temperature-dependent gas adsorption and diffusion phenomena.67,68 In this study, tests were conducted to determine the optimal working temperature of the ZnO-500 sensor. The sensor response values were measured as a function of the working temperature, as depicted in Fig. 6(a) and (b). It was observed that the sensor responded to NO2 gas concentrations of 1 ppm and 5 ppm at all sensing temperatures; nevertheless, its response was noticeably impacted by the sensing temperature. The lower temperatures may not offer enough energy to achieve effective NO2 gas adsorption, which can result in higher desorption rates relative to adsorption rates at higher temperatures. According to the test results, it was observed that the gas sensor made using ZnO-500 nanotubes demonstrated the best responses of 20% and 84% at 200 °C for 1 and 5 ppm concentrations. However, the response rates decreased at 250 °C and 300 °C. The efficiency of gas sensing can be significantly impacted by the sensing temperature as the processes of desorption, diffusion, and adsorption are all dependent on temperature. When the temperature falls below the optimal range, sensor's responsiveness decreases due to deactivation of diffusion and desorption processes. Conversely, when the temperature exceeds the optimal range, the sensing efficiency is compromised because adsorption becomes inefficient, and desorption takes place too rapidly.69 Therefore, the gas sensor's response decreases at 300 °C, which is above the optimal sensing temperature for NO2 gas sensing. In the case of the NO2 gas sensors discussed, it was observed that 200 °C is the optimal temperature for reliable and accurate gas detection.
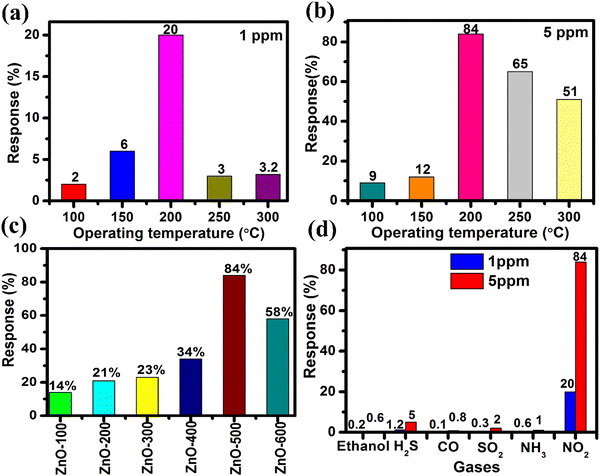 |
| | Fig. 6 (a) and (b) The response of the ZnO-500 nanotube sensor measured at different operating temperatures for 1 ppm and 5 ppm NO2 gas. (c) The selectivity responses of ZnO-100, ZnO-200, ZnO-300, ZnO-400, ZnO-500 and ZnO-600 nanostructures sensors to various gases measured at 200 °C at a gas concentration of 5 ppm NO2. (d) The response of the ZnO-500 nanotube sensor to various gases measured at different operating temperatures for 1 ppm and 5 ppm gas concentrations. | |
3.2.2. Selectivity study.
The performance of a sensor depends significantly on its selectivity, which refers to the sensor's capacity to detect the target gas specifically and exclude interference from other gases. In the case of the ZnO nanostructure sensor, the selectivity was tested using a custom-fabricated gas detecting unit for NO2 gas at 5 ppm at 200 °C. The ZnO-500 sensor demonstrated an exceptional response of 84% for 5 ppm concentration of NO2, while other sensors displayed notably lower responses. The responses were 14% for ZnO-100, 21% for ZnO-200, 34% for ZnO-300, 50% for ZnO-400, and 58% for ZnO-600, as illustrated in Fig. 6(c). The ZnO-500 nanotube sensor responds to NO2 more strongly than the ZnO-100, ZnO-200, ZnO-300, ZnO-400, and ZnO-600 sensors. This difference can be attributed to the particle sizes and the gradual agglomeration of particles at low treatment temperatures. As a result, the reduced specific surface areas negatively impact the adsorption of NO2 molecules on the sensing materials' surfaces, leading to a decline in their responses. In addition, 1D ZnO nanotubes have a very high aspect ratio, which means that their length (∼700 nm) is much greater than their diameter (∼150 nm). The high aspect ratio of ZnO 1D nanotubes provides them with a high surface area-to-volume ratio, which allows them to interact more effectively with the target molecules. When exposed to a gas, the molecules adsorb onto the nanotube surface, causing a change in its electrical properties. This change can then be detected and used to determine the presence and concentration of the target molecules. The large surface area of ZnO 1D nanotubes is also beneficial because it enhances their sensitivity and selectivity. The increased surface area provides more opportunities for the target molecules to interact with the nanotubes, resulting in a greater sensor response. Moreover, the high aspect ratio of the nanotubes provides better control over the orientation and positioning of the target molecules, potentially leading to improved selectivity of the sensor.70
Furthermore, the selectivity of the ZnO-500 nanotube sensor was tested using a custom-fabricated gas detecting unit for various gases including ethanol, H2S, CO, NH3, SO2 and NO2 at 5 ppm and 1 ppm at 200 °C, as depicted in Fig. 6(d). The results of the selectivity analysis demonstrate that the prepared ZnO-500 nanotube sensor is more responsive to NO2 gas compared to other gases such as ethanol, H2S, CO, NH3 and SO2.
3.2.3. Response and recovery time values.
Fig. 7(a) illustrates the results of an investigation into the gas response of a 1D ZnO nanotube sensor for NO2 gas concentrations between 1 and 5 ppm and results show that the sensor response increases with an increase in gas concentration as illustrated in Fig. 7(a). Fig. 7(b) shows the sensor's 20% response at an NO2 concentration of 1 ppm, with a response time of 1 second and 30 seconds for recovery. At an NO2 concentration of 5 ppm, the 1D ZnO nanotube sensor exhibited a maximum response of 84%, with a response time of 2.85 seconds and a recovery time of 59 seconds as depicted in Fig. 7(c). Table 2 summarizes the sensor response, response time, and recovery time of the 1D ZnO nanotube sensor at different concentrations of NO2. The response and recovery times vary with different concentrations of NO2, as shown in Fig. S4 (ESI†). Compared to other NO2 sensors documented in Table 1, the 1D ZnO nanotube sensor exhibits a faster response time and a shorter recovery period. In contrast, the ZnO-500 nanotube sample has shown fast response and recovery times for detecting low levels of NO2 gas, making it a promising material for practical applications such as air quality monitoring, industrial emission control, and automotive exhaust systems.71–73
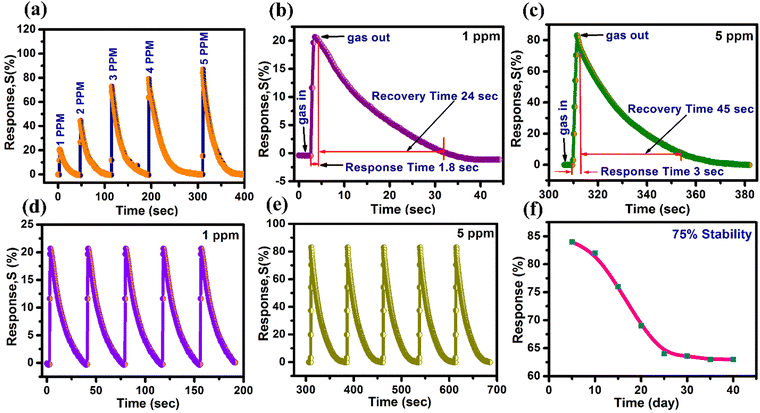 |
| | Fig. 7 (a) The response–recovery curves of ZnO nanostructures for NO2 detection at various concentrations at an operating temperature of 200 °C. (b) The response transient of ZnO-500 nanotubes for 1 ppm NO2 was recorded at a working temperature of 200 °C. (c) The response transient of ZnO-500 nanotubes for 5 ppm NO2 was recorded at 200 °C. (d) and (e) The reproducibility evaluated for 1 ppm and 5 ppm NO2 gas. (f) A long-term stability test conducted with 5 ppm NO2 gas. | |
Table 2 The sensing responses of a 1D ZnO-500 sensor were investigated for 1–5 ppm NO2 gas at 200 °C operating temperature
| NO2 concentration (ppm) |
Response (%) |
Response time (s) |
Recovery time (s) |
| 1 |
20 |
1 |
30 |
| 2 |
44 |
1.21 |
41 |
| 3 |
74 |
1.8 |
47 |
| 4 |
79 |
2.6 |
56 |
| 5 |
84 |
2.85 |
59 |
3.2.4. Reproducibility and stability studies.
Reproducibility refers to the ability of a sensor to produce consistent and reliable results when tested multiple times under the same conditions. In practical applications, the reliability and effectiveness of a sensor depend significantly on its reproducibility and stability. These factors are crucial for ensuring that the sensor can produce consistent and accurate results over time. The reproducibility of the 1D ZnO-500 nanotube sensor was assessed by measuring its response to 1 and 5 ppm NO2 at 200 °C for five testing cycles. The sensor showed excellent reproducibility, maintaining its initial response after each cycle, as shown in Fig. 7(d) and (e). Furthermore, stability of the sensor was determined by measuring its response to 5 ppm NO2 concentration every five days for a period of 40 days, as depicted in Fig. 7(f). The sensor's response remained stable, changing by less than 25% even after 40 days, indicating that the sensor was highly stable. The 1D ZnO-500 nanotube sensor has demonstrated outstanding reproducibility and stability in detecting NO2 gas, suggesting that this sensor has high potential for practical applications as a reliable and long-lasting device for detecting nitrogen dioxide gas.
3.2.5. Gas sensing mechanism.
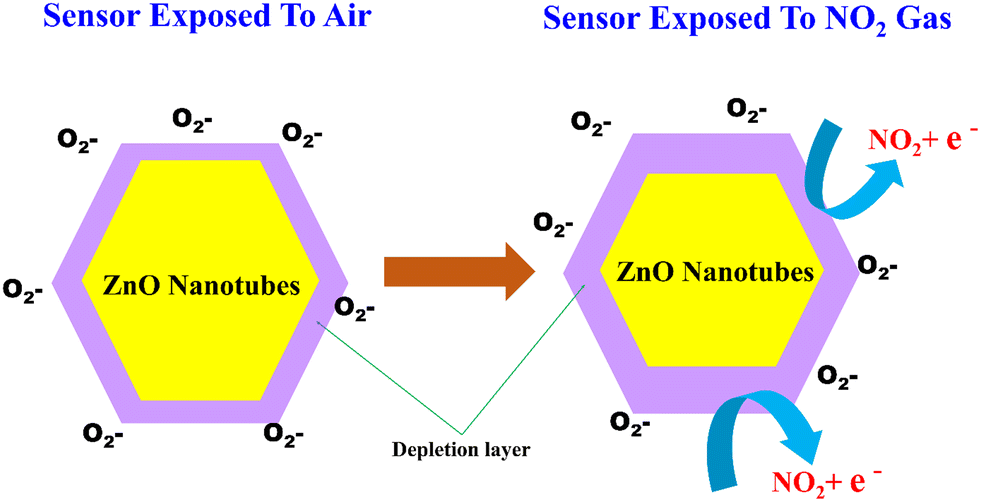
According to electron depletion theory, when NO2 gas comes into contact with the surface of ZnO nanotubes, it reacts with the surface oxygen ions to form nitrate ions and oxygen vacancies.74,75 This reaction causes the depletion of electrons in the ZnO nanotubes, resulting in a decrease in the electrical conductivity of the nanotubes. The magnitude of the decrease in conductivity is proportional to the concentration of NO2 gas in the environment. Therefore, the change in the electrical conductivity of ZnO nanotubes can be used to detect the concentration of NO2 gas in the environment. The sensing mechanism of ZnO nanotubes to detect NO2 is depicted in Fig. 8. When the ZnO nanotube gas sensor comes into contact with the air, O2 molecules remove electrons from the surface of the sensor, resulting in the production of oxygen species (O2−, O2− and O−) and the formation of a layer on the surface of ZnO depleted of electrons.76,77| | | O2(gas) ↔ O2(adsorbed)− (25 °C) | (9) |
| | | O2(gas) + e− ↔ 2O2(adsorbed)− (25–200 °C) | (10) |
| | | O2(gas) + e− ↔ O2(adsorbed)− (200–300 °C) | (11) |
 |
| | Fig. 8 Schematic representation of the gas sensing mechanism of 1D ZnO nanotubes in air and in gas. | |
As the experiments are conducted at 200 °C, the production of O−2 will occur (according to eqn (10)). Furthermore, when exposed to NO2 gas, the NO2 molecules adsorbed onto the surface of the ZnO nanotubes will interact with the oxygen species that are also adsorbed onto the surface. This results in the NO2 molecules capturing more electrons from the conduction band of ZnO, causing the depletion layer to widen and the resistance of the ZnO sensor to increase.78 The overall reaction can be presented as follows:
| | | NO2(gas) + e− → NO2(ads)− | (12) |
NO
2 molecules capture electrons (e
−) and are converted into NO
2− ions.
| | | NO2(gas)− + O2(ads)− + 2e− → NO2(ads)− + 2O(ads)− | (13) |
NO
2− ions react with O
2− ions and two electrons to produce NO
2− and two O
2− ions.
In the absence of NO2 gas, the resistance of the ZnO nanotubes returns to its original value when exposed to air. This is because the adsorbed NO2 gas molecules gradually desorb from the nanotube surface and return to the gas phase. When the NO2 gas molecules desorb from the surface of the nanotubes, the electron density and hence the conductivity of the nanotubes return to their original values. This is because the existence of NO2 gas alters the electron density of the ZnO nanotubes, leading to a change in their electrical conductivity. In contrast, in the gas adsorption process on ZnO nanotubes, NO2 gas molecules interact with the surface, capturing electrons and leading to the widening of the depletion layer. This interaction increases the resistance of the nanotubes. Concurrently, oxygen species present on the ZnO surface facilitate this adsorption mechanism. Conversely, during the desorption process, the ZnO nanotubes are heated, prompting the release of the previously adsorbed NO2 molecules. This heating-driven desorption effectively restores the original configuration of the ZnO sensor, preparing it for subsequent detection events.
The high surface area to volume ratio of ZnO nanotubes provides an increased number of active sites for gas adsorption, which enhances the gas sensing properties of ZnO nanotubes. The unique tubular structure also provides a higher degree of freedom for gas molecules to interact with the ZnO nanotubes, leading to a more efficient gas sensing response. Additionally, the tubular structure of ZnO nanotubes can offer mechanical flexibility, which can help maintain the stability and durability of the gas sensing device during sensing operations. Overall, the tubular structure of ZnO nanotubes makes them promising candidates for gas sensing devices.
3.3. Impedance spectroscopy
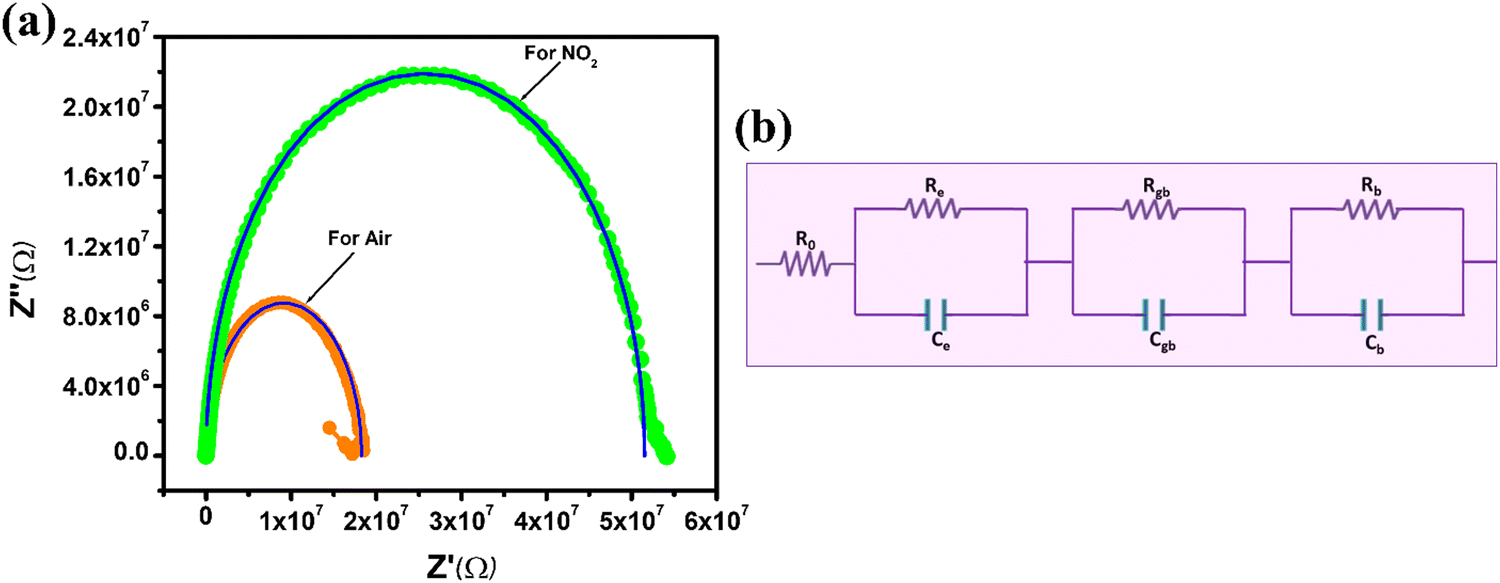
Impedance measurements are a common method for studying the electrical properties of materials and gas sensing devices.79–83 In the case of the ZnO nanotube sensor, impedance measurements were conducted to investigate the changes in electrical properties before and after exposure to NO2 gas as illustrated in Fig. 9(a). The impedance graph shows a semi-circular curve that ranges from low (20 Hz) to high frequencies (10 MHz) when the imaginary component (Z′′) is plotted versus the real component (Z′). This is a characteristic feature of a parallel resistor–capacitor (RC) circuit, as shown in Fig. 9(b). The impedance data were generated using an equivalent circuit model composed of three parallel RC networks and one series resistor. The circuit model parameters consist of Re and Ce, representing electrode contact resistance and capacitance; Ro, Rb and Rgb represent initial, bulk boundary and grain resistances; and Cgb and Cb represent grain boundary and bulk capacitances.60,79,80,84–88Table 3 presents the simulated values of these parameters for both air and NO2 environments. The results show that Re, Rb, and Rgb increased when the ZnO nanotube sensor was exposed to NO2 gas, while Ce, Cb, and Cgb decreased. NO2 gas adsorption on the surface of n-type ZnO nanotubes results in an increase in resistance.89 The process of adsorbing these gas molecules can lead to the trapping of some free electrons within the conduction band. This reduces the number of available free electrons and increases the resistance of the material, making it harder for electric current to flow through the nanotubes. As a result, the electrical conductivity of the material is reduced, which can be measured as an increase in resistance. The electrical properties of n-type ZnO nanotubes undergo changes upon the adsorption of NO2 gas molecules. Fig. 9(a) demonstrates that the agreement between the experimental data and the software simulation data indicates the accuracy of the equivalent circuit model used to simulate the impedance data. The model can be utilized to predict changes in the electrical properties of the ZnO nanotube sensor when exposed to NO2 gas. It should be noted that the solid lines in the figure represent the experimental data, while the symbols represent the software simulation data.
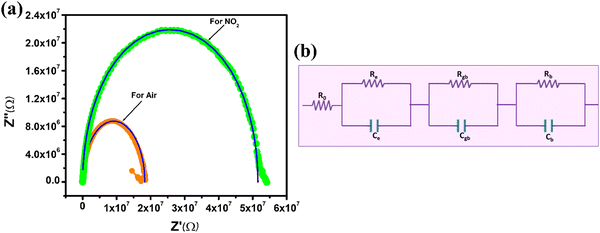 |
| | Fig. 9 (a) Nyquist impedance plot that shows the electrical behavior of ZnO-500 nanotubes when exposed to air and NO2 gas at a concentration of 5 ppm and a temperature of 200 °C. (b) Impedance fitting circuit. | |
Table 3 Values of parameters of the equivalent circuit for fitting the impedance spectra of the 1D ZnO nanotube sensor measured in air and NO2 ambient
| Parameters |
R
0 (KΩ) |
R
e (MΩ) |
R
gb (MΩ) |
R
b (MΩ) |
C
e (pF) |
C
gb (pF) |
C
b (pF) |
| In air |
6.006 |
6.3153 |
7.8318 |
4.1111 |
17.10 |
21.68 |
20.22 |
| In gas |
6.006 |
14.8423 |
20.9534 |
15.7207 |
7.882 |
1.316 |
4.02 |
The study investigates the gas sensing capabilities of 1D ZnO-500 nanotubes through several tests, such as selectivity response/recovery time and impedance spectroscopy, when exposed to NO2 gas at concentrations of 1 and 5 ppm. The results show that the nanotubes exhibit gas responses of 20% at 1 ppm and 84% at 5 ppm when operated at a temperature of 200 °C. These sensitivity levels are higher than those of other materials such as ZnO nanosheets,90 ZnO nanoneedles,91 a bunch of ZnO nanowires,45 and CuO–ZnO flakes.46 These findings imply that 1D ZnO nanotubes have the potential to be employed as an NO2 sensor device. In addition, 1D ZnO nanotubes have been shown to exhibit response and recovery times of 1/30 seconds and 2.85/59 seconds in the presence of NO2 concentrations of 1 ppm and 5 ppm. These times are faster than those of other materials, including macro-to-mesoporous ZnO,92 ZnO nanowires,93 ZnO spheres,94 Pr doped ZnO nanospindles,95 and BiOI–ZnO microballs.96 Therefore, these results suggest that 1D ZnO nanotubes are a promising material for use in real-time monitoring applications, such as air quality monitoring systems, that require swift detection and response times to ensure public health and safety.71–73,97
4. Conclusion
ZnO nanotubes synthesized using chemical bath deposition and thermal methods show promising potential for NO2 gas detection. The resultant 1D ZnO-500 nanotube sensor demonstrated outstanding sensitivity to NO2 gas, operating at 200 °C with a response sensitivity of 84% for 5 ppm NO2 and 20% for 1 ppm NO2. The NO2 detection limit of 1 ppm is considerably lower than the critical exposure limit of 20 ppm. The response and recovery times for 1 ppm NO2 were 1 and 30 seconds, respectively, while for 5 ppm NO2, the response and recovery times were 2.85 and 59 seconds, respectively. The sensor demonstrated outstanding stability, retaining 75% of its initial sensing performance over 40 days. Impedance spectroscopy results highlighted an increase in resistance due to the interaction of gases with adsorbed NO2 gas molecules. The outstanding NO2 gas-sensing ability may be due to the synergistic effect, inherent structural properties of 1D ZnO-500 nanotubes and surface-adsorbed oxygen species. The NO2 sensor's detection limit of 5 ppm meets the requirements of various regulatory bodies, making it suitable as a potential sensor device in real-world environments for NO2 gas detection.
Author contributions
Prasad Godse: investigation, writing the original manuscript and developing the methodology; Sujit A. Kadam: writing the original manuscript, conducting analysis, curating the data, and editing and reviewing the manuscript; T. M. Nimbalkar: editing and revising the manuscript; Y. M. Jadhav supervision; Yuan-Ron Ma: supervision; Yuvraj B Jadhao: analysis; and Professor V. B. Patil: investigation, providing necessary resources, editing and revising the manuscript, and writing original content. They also provided supervision throughout the project.
Data availability
Data will be provided upon request.
Conflicts of interest
There is no conflict of interest for the authors.
References
- C. Chen, G. Xie, J. Dai, W. Li, Y. Cai, J. Li, Q. Zhang, H. Tai, Y. Jiang and Y. Su, Integrated core-shell structured smart textiles for active NO2 concentration and pressure monitoring, Nano Energy, 2023, 116, 108788 CrossRef CAS.
- H. Pan, G. Chen, Y. Chen, A. Di Carlo, M. A. Mayer, S. Shen, C. Chen, W. Li, S. Subramaniam, H. Huang, H. Tai, Y. Jiang, G. Xie, Y. Su and J. Chen, Biodegradable cotton fiber-based piezoresistive textiles for wearable biomonitoring, Biosens. Bioelectron., 2023, 222, 114999 CrossRef CAS PubMed.
- J. Li, G. Xie, J. Jiang, Y. Liu, C. Chen, W. Li, J. Huang, X. Luo, M. Xu, Q. Zhang, M. Yang and Y. Su, Enhancing photodegradation of Methyl Orange by coupling piezo-phototronic effect and localized surface plasmon resonance, Nano Energy, 2023, 108, 108234 CrossRef CAS.
- Y. Su, Y. Liu, W. Li, X. Xiao, C. Chen, H. Lu, Z. Yuan, H. Tai, Y. Jiang, J. Zou, G. Xie and J. Chen, Sensing–transducing coupled piezoelectric textiles for self-powered humidity detection and wearable biomonitoring, Mater. Horiz., 2023, 10, 842–851 RSC.
- L. Liu, Y. Wang, K. Guan, Y. Liu, Y. Li, F. Sun, X. Wang, C. Zhang, S. Feng and T. Zhang, Influence of oxygen vacancies on the performance of SnO2 gas sensing by near-ambient pressure XPS studies, Sens. Actuators, B, 2023, 393, 134252 CrossRef CAS.
- S. T. Navale, X. G. Gui, P. Cao, N. Joshi, F. J. Stadler, S. S. Kim and H. W. Kim, Morphology engineering of hierarchical spinal nickel-cobaltite nanostructures for enhanced ethanol detection, Nano-Struct. Nano-Objects, 2023, 34, 100981 CrossRef CAS.
- A. Alagh, F. E. Annanouch, A. Sierra-Castillo, E. Haye, J.-F. Colomer and E. Llobet, Three-Dimensional Assemblies of Edge-Enriched WSe2 Nanoflowers for Selectively Detecting Ammonia or Nitrogen Dioxide, ACS Appl. Mater. Interfaces, 2022, 14, 54946–54960 CrossRef CAS PubMed.
- X. Wang, Y. Yong, W. Yang, A. Zhang, X. Xie, P. Zhu and Y. Kuang, Adsorption, Gas-Sensing, and Optical Properties of Molecules on a Diazine Monolayer: A First-Principles Study, ACS Omega, 2021, 6, 11418–11426 CrossRef CAS PubMed.
- L. Arellano-García, S. Le Borgne and S. Revah, Simultaneous treatment of dimethyl disulfide and hydrogen sulfide in an alkaline biotrickling filter, Chemosphere, 2018, 191, 809–816 CrossRef PubMed.
- R. N. Dhanawade, N. S. Pawar, M. A. Chougule, G. M. Hingangavkar, T. M. Nimbalkar, G. T. Chavan, C.-W. Jeon and V. B. Patil, Influence of the Camphor Sulphonic Acid (CSA) Intercalation on the Micro-structural and Gas Sensing Properties of Polyaniline-CeO2 Nanohybrid for NH3 Gas Detection, ChemistrySelect, 2023, 8, e202204750 CrossRef CAS.
- E. Martínez-Ahumada, M. L. Díaz-Ramírez, Md. J. Velásquez-Hernández, V. Jancik and I. A. Ibarra, Capture of toxic gases in MOFs: SO2, H2S, NH3 and NOx, Chem. Sci., 2021, 12, 6772–6799 RSC.
- Y. Uesugi, H. Nagakawa and M. Nagata, Highly Efficient Photocatalytic Degradation of Hydrogen Sulfide in the Gas Phase Using Anatase/TiO2(B) Nanotubes, ACS Omega, 2022, 7, 11946–11955 CrossRef CAS PubMed.
- L. Yang, G. Zheng, Y. Cao, C. Meng, Y. Li, H. Ji, X. Chen, G. Niu, J. Yan, Y. Xue and H. Cheng, Moisture-resistant, stretchable NOx gas sensors based on laser-induced graphene for environmental monitoring and breath analysis, Microsyst. Nanoeng., 2022, 8, 78 CrossRef CAS PubMed.
- X. Geng, S. Li, L. Mawella-Vithanage, T. Ma, M. Kilani, B. Wang, L. Ma, C. C. Hewa-Rahinduwage, A. Shafikova, E. Nikolla, G. Mao, S. L. Brock, L. Zhang and L. Luo, Atomically dispersed Pb ionic sites in PbCdSe quantum dot gels enhance room-temperature NO2 sensing, Nat. Commun., 2021, 12, 4895 CrossRef CAS PubMed.
- M. A. G. Demetillo, A. Navarro, K. K. Knowles, K. P. Fields, J. A. Geddes, C. R. Nowlan, S. J. Janz, L. M. Judd, J. Al-Saadi, K. Sun, B. C. McDonald, G. S. Diskin and S. E. Pusede, Observing Nitrogen Dioxide Air Pollution Inequality Using High-Spatial-Resolution Remote Sensing Measurements in Houston, Texas, Environ. Sci. Technol., 2020, 54, 9882–9895 CrossRef CAS PubMed.
- M. U. Ali, Y. Yu, B. Yousaf, M. A. M. Munir, S. Ullah, C. Zheng, X. Kuang and M. H. Wong, Health impacts of indoor air pollution from household solid fuel on children and women, J. Hazard. Mater., 2021, 416, 126127 CrossRef CAS PubMed.
- W. Huang, X. Zhuang, F. S. Melkonyan, B. Wang, L. Zeng, G. Wang, S. Han, M. J. Bedzyk, J. Yu, T. J. Marks and A. Facchetti, UV–Ozone Interfacial Modification in Organic Transistors for High-Sensitivity NO2 Detection, Adv. Mater., 2017, 29, 1701706 CrossRef PubMed.
- M. J. Cooper, R. V. Martin, M. S. Hammer, P. F. Levelt, P. Veefkind, L. N. Lamsal, N. A. Krotkov, J. R. Brook and C. A. McLinden, Global fine-scale changes in ambient NO2 during COVID-19 lockdowns, Nature, 2022, 601, 380–387 CrossRef CAS PubMed.
- A. Moumen, R. Konar, D. Zappa, E. Teblum, I. Perelshtein, R. Lavi, S. Ruthstein, G. D. Nessim and E. Comini, Robust Room-Temperature NO2 Sensors from Exfoliated 2D Few-Layered CVD-Grown Bulk Tungsten Di-selenide (2H-WSe2), ACS Appl. Mater. Interfaces, 2021, 13, 4316–4329 CrossRef CAS PubMed.
- Z. Feng, H. Wang, Y. Zhang, D. Han, Y. Cheng, A. Jian and S. Sang, ZnO/GaN n-n heterojunction porous nanosheets for ppb-level NO2 gas sensors, Sens. Actuators, B, 2023, 396, 134629 CrossRef CAS.
- H. Chi, Z. Xu, X. Duan, J. Yang, F. Wang and Z. Li, High-Performance Colorimetric Room-Temperature NO2 Sensing Using Spin-Coated Graphene/Polyelectrolyte Reflecting Film, ACS Appl. Mater. Interfaces, 2019, 11, 32390–32397 CrossRef CAS PubMed.
- V. V. Ganbavle, S. I. Inamdar, G. L. Agawane, J. H. Kim and K. Y. Rajpure, Synthesis of fast response, highly sensitive and selective Ni:ZnO based NO2 sensor, Chem. Eng. J., 2016, 286, 36–47 CrossRef CAS.
- J. Zeng, Y. Xu, J. Yu, X. Zhang, X. Zhang, H. Jin, Q. Jin, W. Shen, J. Zou, S. Deng and J. Jian, Compact Yttria-Stabilized Zirconia Based Total NOx Sensor with a Dual Functional Co3O4/NiO Sensing Electrode, ACS Sens., 2019, 4, 2150–2155 CrossRef CAS PubMed.
- H. Bi, Y. Shen, S. Zhao, P. Zhou, S. Gao, B. Cui, D. Wei, Y. Zhang and K. Wei, Synthesis of
NiO-In2O3 heterojunction nanospheres for highly selective and sensitive detection of ppb-level NO2, Vacuum, 2020, 172, 109086 CrossRef CAS.
- R. N. Dhanawade, N. S. Pawar, M. A. Chougule, G. M. Hingangavkar, Y. M. Jadhav, T. M. Nimbalkar, Y. H. Navale, G. T. Chavan, C.-W. Jeon and V. B. Patil, Highly sensitive and selective PAni-CeO2 nanohybrid for detection of NH3 biomarker at room temperature, J. Mater. Sci.: Mater. Electron., 2023, 34, 781 CrossRef CAS.
- K. Mahendraprabhu and P. Elumalai, Stabilized zirconia-based selective NO2 sensor using sol-gel derived Nb2O5 sensing-electrode, Sens. Actuators, B, 2017, 238, 105–110 CrossRef CAS.
- Y. H. Navale, S. T. Navale, F. J. Stadler, N. S. Ramgir, A. K. Debnath, S. C. Gadkari, S. K. Gupta, D. K. Aswal and V. B. Patil, Thermally evaporated copper oxide films: A view of annealing effect on physical and gas sensing properties, Ceram. Int., 2017, 43, 7057–7064 CrossRef CAS.
- M. M. Gomaa, M. H. Sayed, V. L. Patil, M. Boshta and P. S. Patil, Gas sensing performance of sprayed NiO thin films toward NO2 gas, J. Alloys Compd., 2021, 885, 160908 CrossRef CAS.
- S. M. Ingole, S. T. Navale, Y. H. Navale, D. K. Bandgar, F. J. Stadler, R. S. Mane, N. S. Ramgir, S. K. Gupta, D. K. Aswal and V. B. Patil, Nanostructured tin oxide films: Physical synthesis, characterization, and gas sensing properties, J. Colloid Interface Sci., 2017, 493, 162–170 CrossRef CAS PubMed.
- P. Zhou, Y. Shen, W. Lu, S. Zhao, T. Li, X. Zhong, B. Cui, D. Wei and Y. Zhang, Highly selective NO2 chemiresistive gas sensor based on hierarchical In2O3 microflowers grown on clinoptilolite substrates, J. Alloys Compd., 2020, 828, 154395 CrossRef CAS.
- T. M. Nimbalkar, Y. M. Jadhav, R. N. Dhanawade, N. S. Pawar, A. C. Molane, S. S. Gavande, G. T. Chavan, C.-W. Jeon, S. D. Sartale and V. B. Patil, Simple chemical synthesis of CeO2 nanoparticles for toxic NO2 gas detection, J. Alloys Compd., 2023, 966, 171461 CrossRef CAS.
- G. M. Hingangavkar, Y. H. Navale, T. M. Nimbalkar, R. N. Mulik and V. B. Patil, Hydrothermally engineered WO3 nanoflowers: A selective detection towards toxic NO2 gas, Sens. Actuators, B, 2022, 371, 132584 CrossRef CAS.
- G. M. Hingangavkar, S. A. Kadam, Y.-R. Ma, S. D. Sartale, R. N. Mulik and V. B. Patil, Intercalation of two-dimensional graphene oxide in WO3 nanoflowers for NO2 sensing, Nano-Struct. Nano-Objects, 2023, 34, 100964 CrossRef CAS.
- L. Liu, S. Fu, X. Lv, L. Yue, L. Fan, H. Yu, X. Gao, W. Zhu, W. Zhang, X. Li and W. Zhu, A Gas Sensor With Fe2O3 Nanospheres Based on Trimethylamine Detection for the Rapid Assessment of Spoilage Degree in Fish, Front. Bioeng. Biotechnol., 2020, 8, 567584 CrossRef PubMed.
- A. Król-Górniak, V. Railean, P. Pomastowski, T. Płociński, M. Gloc, R. Dobrucka, K. J. Kurzydłowski and B. Buszewski, Comprehensive study upon physicochemical properties of bio-ZnO NCs, Sci. Rep., 2023, 13, 587 CrossRef PubMed.
- R. Devi Chandra and K. G. Gopchandran, Simple, Low-Temperature Route To Synthesize ZnO Nanoparticles and Their Optical Neuromorphic Characteristics, ACS Appl. Electron. Mater., 2021, 3, 3846–3854 CrossRef CAS.
- H.-J. Kim and J.-H. Lee, Highly sensitive and selective gas sensors using p-type oxide semiconductors: Overview, Sens. Actuators, B, 2014, 192, 607–627 CrossRef CAS.
- V. V. Volkov, D. J. Oliver and C.
C. Perry, Polariton condensation and surface enhanced Raman in spherical ZnO microcrystals, Nat. Commun., 2020, 11, 4908 CrossRef PubMed.
- J. Nasser, K. Steinke and H. Sodano, ZnO Nanostructured Interphase for Multifunctional and Lightweight Glass Fiber Reinforced Composite Materials under Various Loading Conditions, ACS Appl. Nano Mater., 2020, 3, 1363–1372 CrossRef CAS.
- L. Maria Jose, S. Anna Thomas, A. Aravind, Y.-R. Ma and S. Anil Kadam, Effect of Ni doping on the adsorption and visible light photocatalytic activity of ZnO hexagonal nanorods, Inorg. Chem. Commun., 2023, 147, 110208 CrossRef CAS.
- N. S. George, S. Anil Kadam, S. Sreehari, L. Maria Jose, Y. Ron Ma and A. Aravind, Inquest on photocatalytic and antibacterial traits of low composition Cu doped ZnO nanoparticles, Chem. Phys. Lett., 2023, 815, 140351 CrossRef CAS.
- M. A. Patil, V. V. Ganbavle, K. Y. Rajpure, H. P. Deshmukh and S. H. Mujawar, Fast response and highly selective nitrogen dioxide gas sensor based on Zinc Stannate thin films, Mater. Sci. Energy Technol., 2020, 3, 36–42 CAS.
- G. J. Thangamani, K. Deshmukh, T. Kovářík, N. A. Nambiraj, D. Ponnamma, K. K. Sadasivuni, H. P. S. A. Khalil and S. K. K. Pasha, Graphene oxide nanocomposites based room temperature gas sensors: A review, Chemosphere, 2021, 280, 130641 CrossRef CAS PubMed.
- S. Tyagi, M. Chaudhary, A. K. Ambedkar, K. Sharma, Y. K. Gautam and B. P. Singh, Metal oxide nanomaterial-based sensors for monitoring environmental NO2 and its impact on the plant ecosystem: a review, Sens. Diagn., 2022, 1, 106–129 RSC.
- Y. H. Navale, S. T. Navale, N. S. Ramgir, F. J. Stadler, S. K. Gupta, D. K. Aswal and V. B. Patil, Zinc oxide hierarchical nanostructures as potential NO2 sensors, Sens. Actuators, B, 2017, 251, 551–563 CrossRef CAS.
- S. M. Mali, S. S. Narwade, Y. H. Navale, S. B. Tayade, R. V. Digraskar, V. B. Patil, A. S. Kumbhar and B. R. Sathe, Heterostructural CuO–ZnO Nanocomposites: A Highly Selective Chemical and Electrochemical NO2 Sensor, ACS Omega, 2019, 4, 20129–20141 CrossRef CAS PubMed.
- N. S. Harale, A. S. Kamble, N. L. Tarwal, I. S. Mulla, V. K. Rao, J. H. Kim and P. S. Patil, Hydrothermally grown ZnO nanorods arrays for selective NO2 gas sensing: Effect of anion generating agents, Ceram. Int., 2016, 42, 12807–12814 CrossRef CAS.
- J. Zhang, X. Liu, G. Neri and N. Pinna, Nanostructured Materials for Room-Temperature Gas Sensors, Adv. Mater., 2016, 28, 795–831 CrossRef CAS PubMed.
- N. Joshi, T. Hayasaka, Y. Liu, H. Liu, O. N. Oliveira and L. Lin, A review on chemiresistive room temperature gas sensors based on metal oxide nanostructures, graphene and 2D transition metal dichalcogenides, Microchim. Acta, 2018, 185, 213 CrossRef PubMed.
- Q. Yu, C. Yu, J. Wang, F. Guo, S. Gao, S. Jiao, H. Li, X. Zhang, X. Wang, H. Gao, H. Yang and L. Zhao, Gas sensing properties of self-assembled ZnO nanotube bundles, RSC Adv., 2013, 3, 16619–16625 RSC.
- N. Kaur, M. Singh and E. Comini, One-Dimensional Nanostructured Oxide Chemoresistive Sensors, Langmuir, 2020, 36, 6326–6344 CrossRef CAS PubMed.
- Q. Zhang, G. Xie, M. Duan, Y. Liu, Y. Cai, M. Xu, K. Zhao, H. Tai, Y. Jiang and Y. Su, Zinc Oxide Nanorods for Light-Activated Gas Sensing and Photocatalytic Applications, ACS Appl. Nano Mater., 2023, 6, 17445–17456 CrossRef CAS.
- H. Wang, J. Bai, M. Dai, K. Liu, Y. Liu, L. Zhou, F. Liu, F. Liu, Y. Gao, X. Yan and L. Geyu, Visible light activated excellent NO2 sensing based on 2D/2D ZnO/g-C3N4 heterojunction composites, Sens. Actuators, B, 2020, 304, 127287 CrossRef CAS.
- Y. Qu, Z. Song and J. Zhang, Enhanced gas-sensing to low-concentration ethanol gas from 3-dimensional (3D) urchin-like ZnO micro/nanospheres, Mater. Lett., 2023, 335, 133817 CrossRef CAS.
- J. X. Wang, X. W. Sun, Y. Yang and C. M. L. Wu, N–P transition sensing behaviors of ZnO nanotubes exposed to NO2 gas, Nanotechnology, 2009, 20, 465501 CrossRef CAS PubMed.
- R. Kumar, O. Al-Dossary, G. Kumar and A. Umar, Zinc Oxide Nanostructures for NO2 Gas–Sensor Applications: A Review, Nano-Micro Lett., 2015, 7, 97–120 CrossRef PubMed.
- S. Sakalley, A. Saravanan, D. Kathiravan, J.-C. Tang, W.-C. Cheng, S.-C. Chen, H. Sun and B.-R. Huang, Enhanced hydrogen gas sensing through the utilization of a hybrid nanostructure combining ZnO nanotubes and HiPIMS Cu3N thin film, Sens. Actuators, B, 2024, 402, 135107 CrossRef CAS.
- V. S. Bhati, M. Hojamberdiev and M. Kumar, Enhanced sensing performance of ZnO nanostructures-based gas sensors: A review, Energy Rep., 2020, 6, 46–62 CrossRef.
- M. A. Franco, P. P. Conti, R. S. Andre and D. S. Correa, A review on chemiresistive ZnO gas sensors, Sens. Actuators Rep., 2022, 4, 100100 CrossRef.
- G. M. Hingangavkar, S. A. Kadam, Y.-R. Ma, R. N. Mulik and V. B. Patil, Highly selective and sensitive MoS2 nano-sensor for H2S detection, J. Alloys Compd., 2023, 941, 168849 CrossRef CAS.
- T. J. Trivedi, D. Bhattacharjya, J.-S. Yu and A. Kumar, Functionalized Agarose Self-Healing Ionogels Suitable for Supercapacitors, ChemSusChem, 2015, 8, 3294–3303 CrossRef CAS PubMed.
- B. Zhou, Q. Ma, C. Cui, S. Ma, J. Bai and H. Wang, Preparation of the lead-free graphene-glass frit composites for crystalline silicon solar cells and investigation of performance, Sol. Energy, 2020, 211, 988–998 CrossRef CAS.
- D. Das and P. Mondal, Photoluminescence phenomena prevailing in c-axis oriented intrinsic ZnO thin films prepared by RF magnetron sputtering, RSC Adv., 2014, 4, 35735–35743 RSC.
- G. Deroubaix and P. Marcus, X-ray photoelectron spectroscopy analysis of copper and zinc oxides and sulphides, Surf. Interface Anal., 1992, 18, 39–46 CrossRef CAS.
- P. Ji, X. Hu, R. Tian, H. Zheng, J. Sun, W. Zhang and J. Peng, Atom-economical synthesis of ZnO@ZIF-8 core–shell heterostructure by dry gel conversion (DGC) method for enhanced H2 sensing selectivity, J. Mater. Chem. C, 2020, 8, 2927–2936 RSC.
- R. Al-Gaashani, S. Radiman, A. R. Daud, N. Tabet and Y. Al-Douri, XPS and optical studies of different morphologies of ZnO nanostructures prepared by microwave methods, Ceram. Int., 2013, 39, 2283–2292 CrossRef CAS.
- C. Yuan, J. Ma, Y. Zou, G. Li, H. Xu, V. V. Sysoev, X. Cheng and Y. Deng, Modeling Interfacial Interaction between Gas Molecules and Semiconductor Metal Oxides: A New View Angle on Gas Sensing, Adv. Sci., 2022, 9, 2203594 CrossRef CAS PubMed.
- N. K. Chowdhury and B. Bhowmik, Micro/nanostructured gas sensors: the physics behind the nanostructure growth, sensing and selectivity mechanisms, Nanoscale Adv., 2021, 3, 73–93 RSC.
- J.-H. Kim, Y. Zheng, A. Mirzaei and S. Kim, Excellent Carbon Monoxide Sensing Performance of Au-Decorated SnO2 Nanofibers, Korean J. Mater. Res., 2016, 26, 741–750 CrossRef CAS.
- J.-H. Kim, A. Mirzaei, H. W. Kim and S. S. Kim, Low-Voltage-Driven Sensors Based on ZnO Nanowires for Room-Temperature Detection of NO2 and CO Gases, ACS Appl. Mater. Interfaces, 2019, 11, 24172–24183 CrossRef CAS PubMed.
- X. Li, Z. Zhuang, D. Qi and C. Zhao, High sensitive and fast response humidity sensor based on polymer composite nanofibers for breath monitoring and non-contact sensing, Sens. Actuators, B, 2021, 330, 129239 CrossRef CAS.
- H.-S. Kim, J.-H. Kang, J.-Y. Hwang and U. S. Shin, Wearable CNTs-based humidity sensors with high sensitivity and flexibility for real-time multiple respiratory monitoring, Nano Convergence, 2022, 9, 35 CrossRef CAS PubMed.
- S. Kanaparthi and S. G. Singh, Reduction of the Measurement Time of a Chemiresistive Gas Sensor Using Transient Analysis and the Cantor Pairing Function, ACS Meas. Sci. Au, 2022, 2, 113–119 CrossRef CAS PubMed.
- M. Al-Hashem, S. Akbar and P. Morris, Role of Oxygen Vacancies in Nanostructured Metal-Oxide Gas Sensors: A Review, Sens. Actuators, B, 2019, 301, 126845 CrossRef CAS.
- J. Xuan, G. Zhao, M. Sun, F. Jia, X. Wang, T. Zhou, G. Yin and B. Liu, Low-temperature operating ZnO-based NO2 sensors: a review, RSC Adv., 2020, 10, 39786–39807 RSC.
- J. Sukunta, A. Wisitsoraat, A. Tuantranont, S. Phanichphant and C. Liewhiran, WO3 nanotubes−SnO2 nanoparticles heterointerfaces for ultrasensitive and selective NO2 detections, Appl. Surf. Sci., 2018, 458, 319–332 CrossRef CAS.
- Z. Chen, H. Guo, F. Zhang, X. Li, J. Yu and X. Chen, Porous ZnO/rGO Nanosheet-Based NO2 Gas Sensor with High Sensitivity and ppb-Level Detection Limit at Room Temperature, Adv. Mater. Interfaces, 2021, 8, 2101511 CrossRef CAS.
- A. Afzal, N. Cioffi, L. Sabbatini and L. Torsi, NOx sensors based on semiconducting metal oxide nanostructures: Progress and perspectives, Sens. Actuators, B, 2012, 171–172, 25–42 CrossRef CAS.
- V. Balasubramani, S. Chandraleka, T. S. Rao, R. Sasikumar, M. R. Kuppusamy and T. M. Sridhar, Review—Recent Advances in Electrochemical Impedance Spectroscopy Based Toxic Gas Sensors Using Semiconducting Metal Oxides, J. Electrochem. Soc., 2020, 167, 037572 CrossRef CAS.
- V. Balasubramani, S. Sureshkumar, T. S. Rao and T. M. Sridhar, Impedance Spectroscopy-Based Reduced Graphene Oxide-Incorporated ZnO Composite Sensor for H2S Investigations, ACS Omega, 2019, 4, 9976–9982 CrossRef CAS PubMed.
- P. Sobaś, O. Nilsen, H. Fjellvåg and B. Svensson, Electrical Properties and Gas Sensing Characteristics of the Al2O3/4H SiC Interface Studied by Impedance Spectroscopy, Mater. Sci. Forum, 2010, 531–534 Search PubMed.
- G. M. Hingangavkar, S. A. Kadam, Y.-R. Ma, S. S. Bandgar, R. N. Mulik and V. B. Patil, Tailored formation of WO3-rGO nanohybrids for dependable low temperature NO2 sensing, Ceram. Int., 2023, 49, 38866–38876 CrossRef CAS.
- G. M. Hingangavkar, S. A. Kadam, Y.-R. Ma, S. S. Bandgar, R. N. Mulik and V. B. Patil, MoS2-GO hybrid sensor: A discerning approach for detecting harmful H2S gas at room temperature, Chem. Eng. J., 2023, 472, 144789 CrossRef CAS.
- S. B. Kulkarni, Y. H. Navale, S. T. Navale, F. J. Stadler, N. S. Ramgir and V. B. Patil, Hybrid polyaniline-WO3 flexible sensor: A room temperature competence towards NH3 gas, Sens. Actuators, B, 2019, 288, 279–288 CrossRef CAS.
- D. K. Bandgar, S. T. Navale, S. R. Nalage, R. S. Mane, F. J. Stadler, D. K. Aswal, S. K. Gupta and V. B. Patil, Simple and low-temperature polyaniline-based flexible ammonia sensor: a step towards laboratory synthesis to economical device design, J. Mater. Chem. C, 2015, 3, 9461–9468 RSC.
- G. M. Hingangavkar, S. A. Kadam, Y.-R. Ma, M. Selvaraj, R. N. Mulik and V. B. Patil, On the behavior of MoS2-rGO nanocomposites for chemiresistive H2S detection at room temperature, Sens. Actuators, B, 2024, 399, 134843 CrossRef CAS.
- S. A. Kadam, Y.-R. Ma, Y.-R. Chen, Y. H. Navale, A. S. Salunkhe, V. B. Patil, S. D. Ralegankar and P. D. More, Mn-Incorporated α-Fe2O3 Nanostructured Thin Films: Facile Synthesis and Application as a High-Performance Supercapacitor, J. Electron. Mater., 2023, 52, 500–513 CrossRef CAS.
- Y. Su, W. Li, X. Cheng, Y. Zhou, S. Yang, X. Zhang, C. Chen, T. Yang, H. Pan, G. Xie, G. Chen, X. Zhao, X. Xiao, B. Li, H. Tai, Y. Jiang, L.-Q. Chen, F. Li and J. Chen, High-performance piezoelectric composites via β phase programming, Nat. Commun., 2022, 13, 4867 CrossRef CAS PubMed.
- X. Yang, Y. Deng, H. Yang, Y. Liao, X. Cheng, Y. Zou, L. Wu and Y. Deng, Functionalization of Mesoporous Semiconductor Metal Oxides for Gas Sensing: Recent Advances and Emerging Challenges, Adv. Sci., 2023, 10, 2204810 CrossRef CAS PubMed.
- T. V. A. Kusumam, V. S. Siril, K. N. Madhusoodanan, M. Prashantkumar, Y. T. Ravikiran and N. K. Renuka, NO2 gas sensing performance of zinc oxide nanostructures synthesized by surfactant assisted Low temperature hydrothermal technique, Sens. Actuators, A, 2021, 318, 112389 CrossRef CAS.
- R. C. Pawar, J.-W. Lee, V. B. Patil and C. S. Lee, Synthesis of multi-dimensional ZnO nanostructures in aqueous medium for the application of gas sensor, Sens. Actuators, B, 2013, 187, 323–330 CrossRef CAS.
- Y. Xia, L. Zhou, J. Yang, P. Du, L. Xu and J. Wang, Highly Sensitive and Fast Optoelectronic Room-Temperature NO2 Gas Sensor Based on ZnO Nanorod-Assembled Macro-/Mesoporous Film, ACS Appl. Electron. Mater., 2020, 2, 580–589 CrossRef CAS.
- X. Chen, Y. Shen, W. Zhang, J. Zhang, D. Wei, R. Lu, L. Zhu, H. Li and Y. Shen, In-situ growth of ZnO nanowire arrays on the sensing electrode via a facile hydrothermal route for high-performance NO2 sensor, Appl. Surf. Sci., 2018, 435, 1096–1104 CrossRef CAS.
- X. Liu, Q. Li, Y. Cui, J. Lin and L. Ding, Synthesis of porous spherical ZnO nanomaterials and the selective detection of NO at room temperature, Sens. Actuators, B, 2023, 378, 133155 CrossRef CAS.
- J. Fang, J.-J. Xue, R.-P. Xiao, X. Chen, Y.-M. Guo and J.-M. Song, Synthesis of Pr-doped ZnO nanospindles by one-pot precipitation as a triethylamine sensor, J. Environ. Chem. Eng., 2022, 10, 108334 CrossRef CAS.
- Y. Li, Y. Liu, Y. Lu, Z. Liu, C. Sui, Y. Wang, L. Yang, F. Liu, P. Sun, F. Liu and G. Lu, Preparation of BiOI-Functionalized ZnO Nanorods for Ppb-Level NO2 Detection at Room Temperature, ACS Sens., 2022, 7, 3915–3922 CrossRef CAS PubMed.
- N. A. Isaac, I. Pikaar and G. Biskos, Metal oxide semiconducting nanomaterials for air quality gas sensors: operating principles, performance, and synthesis techniques, Microchim. Acta, 2022, 189, 196 CrossRef CAS PubMed.
|
| This journal is © The Royal Society of Chemistry 2024 |
Click here to see how this site uses Cookies. View our privacy policy here. 
 Open Access Article
 This Open Access Article is licensed under a Creative Commons Attribution-Non Commercial 3.0 Unported Licence
 *b,
Tanaji M.
Nimbalkar
a,
Yogesh M.
Jadhav
a,
Yuvraj B.
Jadhao
c,
Yuan-Ron
Ma
*b,
Tanaji M.
Nimbalkar
a,
Yogesh M.
Jadhav
a,
Yuvraj B.
Jadhao
c,
Yuan-Ron
Ma