 Open Access Article
2D/2D Z-scheme WO3/g-C3N4 heterojunctions for photocatalytic organic pollutant degradation and nitrogen fixation†
Yasi
Li
 a and
Junkai
Wang
*b
aDepartment of Mechanical Engineering, College of Engineering, Shantou University, Shantou 515063, China
bCollege of Chemistry and Chemical Engineering, Shantou University, Shantou 515063, China. E-mail: jkwang@stu.edu.cn
First published on 5th December 2023
Abstract
Two-dimensional/two-dimensional (2D/2D) Z-scheme WO3/g-C3N4 heterojunctions were successfully prepared by facile rapid calcination, which exhibited considerable photocatalytic performance in environmental application and energy application without any cocatalyst. The synthesized 2D/2D Z-scheme WO3/g-C3N4 significantly improved the visible-light photocatalytic degradation of tetracycline hydrochloride (TC-HCl), and 40%WO3/g-C3N4 had the best photocatalytic degradation effect. 40%WO3/g-C3N4 could also degrade rhodamine B (RhB), methylene blue (MB) and methyl orange (MO), and RhB was almost completely degraded after 20 min irradiation. ˙O2− was the main active species in the degradation process of 40%WO3/g-C3N4. The 2D/2D Z-scheme heterostructure enhanced the photogenerated electron–hole separation and transfer ability and possessed good photocatalytic stability. The 2D/2D Z-scheme WO3/g-C3N4 heterojunction system was first used in nitrogen fixation. 40%WO3/g-C3N4 can simultaneously achieve photocatalytic nitrogen reduction reaction (NRR) and nitrogen oxidation reaction (NOR) to produce NH4+ and NO3−, respectively, using air as a nitrogen source. However, in the presence of a hole sacrificial agent and N2 as a nitrogen source, the photocatalytic nitrogen fixation reaction of 40%WO3/g-C3N4 was dominated by NRR. The nitrogen fixation products and their possible mechanisms were also discussed. This study confirms that the designed 2D/2D Z-scheme WO3/g-C3N4 heterojunctions have great potential in the photocatalytic degradation of different-type organic pollutants and regulable photocatalytic NRR and NOR reactions.
Introduction
Environmental safety and energy resources are among the primary needs for human survival and development. Photocatalysis is regarded as one of the most hopeful methods for environment remediation and energy conversion because of its mild reaction conditions, no secondary pollution, and low energy consumption.1–4 Under light irradiation, the semiconductor photocatalysts are excited to produce photogenerated carriers, which can directly or indirectly participate in the oxidation–reduction reaction.1–4 Among the visible-light catalytic materials, WO3 and g-C3N4 photocatalytic materials have the advantages of a suitable energy band structure, good visible-light response range, and relatively simple preparation process.5–7 Therefore, WO3 and g-C3N4 are ideal materials for constructing efficient visible-light catalysts. Furthermore, if the two materials are integrated to construct type-II or Z-scheme heterojunctions, the electrons (e−) and holes (h+) can be physically separated, favoring the redox reaction.19,20 In addition, the Z-scheme can simultaneously use the more positive valence band (VB) of one semiconductor and the more negative conduction band (CB) of the other semiconductor, so it has a stronger redox capacity than the one-component semiconductor.8–16 Two-dimensional/two-dimensional (2D/2D) composite structures have the largest interface contact area, which is conducive to photogenerated carrier transmission.9–16 Therefore, 2D/2D Z-scheme heterojunctions can effectively enhance the performance of WO3/g-C3N4 photocatalysts. The reported 2D/2D Z-scheme WO3/g-C3N4 heterojunction systems had complex synthesis, insufficient application research, need for cocatalyst and other deficiencies to some degree.9–16 Thus, it is necessary to further study the 2D/2D Z-scheme WO3/g-C3N4 heterojunction in more ways.Industrial manufacturing, agricultural production, and daily life produce much wastewater. Organic pollutants in wastewater are toxic, accumulative, and challenging to degrade even at low concentrations, posing a serious threat to the water environment.17 There are a variety of organic pollutants with various properties in environmental water bodies, such as organic dyes, antibiotics, surfactants, and endocrine disruptors.17–19 Tetracycline hydrochloride (TC-HCl) has been widely used in humans and animals as an inexpensive broad-spectrum antibiotics.20–23 TC-HCl easily accumulates in water and soil systems because of its excellent water solubility and long half-life.20–23 Organic dyes are common organic pollutants, and the same method has different removal effects on dyes with different properties.24 The traditional removal methods of organic pollutants in the water include physical adsorption, chemical oxidation, and biodegradation. However, most of them have the disadvantages of poor efficiency, complicated methods, high cost, or easily causes secondary pollution.16,21–23 The degradation of different-type organic pollutants in water is an urgent problem to be solved.
Moreover, nitrogen is an indispensable component of the biological structure.25–27 It is found in proteins and nucleic acids, and most organisms except nitrogen-fixing microorganisms cannot directly use N2.25,28,29 Nitrogen fixation is the conversion of N2 to simple nitrogenous compounds (nitric oxide, ammonia and others), followed by the generation of more complex compounds that can be used by organisms.29,30 In recent years, NH3 has become a crucial raw material and green energy carrier.28 Nevertheless, the traditional Haber–Bosch process remains the dominant industrial NH3 production method, which consumes excessive fossil and releases harmful gases.25,28,30–33 HNO3 is also a vital raw material in agriculture, military, chemical industry and other areas.34,35 However, the industrial HNO3 is synthesized by the Ostwald process through catalytic oxidation of NH3, so this method is highly energy-consuming.31,32,34,35 At present, most of the new methods of artificial nitrogen fixation are to reduce N2 to produce NH3. However, there are few studies on the oxidation of N2 to produce HNO3 or N2 disproportionation reaction. Therefore, developing eco-friendly and low-cost methods to fix N2 by directly forming NH3 and HNO3 is of great interest.34,35
In this paper, 2D/2D Z-scheme WO3/g-C3N4 heterojunctions with different doping ratios were prepared using ice water bath ultrasonography and rapid calcination. The degradation effects on typical antibiotic organic pollutants (TC-HCl) and typical dye organic pollutants with different charge properties [amphoteric dye rhodamine B (RhB), cationic dye methylene blue (MB), and anionic dye methyl orange (MO)] were explored. The performance of photocatalytic nitrogen fixation (NRR and NOR) was investigated using two typical photocatalytic nitrogen fixation conditions. According to the experimental results, the possible mechanisms of the photocatalytic degradation and photocatalytic nitrogen fixation were proposed, which offered a reference for preparing 2D/2D Z-scheme heterojunction photocatalysts and photocatalytic degradation and nitrogen fixation.
Experimental
Materials
Sodium tungstate dihydrate (Na2WO4·2H2O), potassium sodium tartrate tetrahydrate (C4H4KNaO6·4H2O), and sodium hydroxide (NaOH) were obtained from Sinopharm Chemical Reagent Co., Ltd. Tetracycline hydrochloride (TC-HCl), rhodamine B (RhB), methylene blue (MB), methyl orange (MO), ammonium oxalate (AO), ammonium chloride (NH4Cl), potassium nitrate (KNO3) and potassium mercury iodide (K2HgI4) were acquired from Shanghai Maclin Biochemical Co., Ltd. Isopropyl alcohol (IPA), ethanol and methanol were obtained from Beijing Chemical Plant. 65% Nitric acid was derived from Beijing Chemical Plant. Melamine (chemically pure, content ≥98%) was purchased from Sigma Aldrich (Shanghai) Trading Co., Ltd. High purity nitrogen (content ≥99.999%) and compressed air were acquired from Beijing Millennium Capital Gas Co., Ltd. All solutions in this paper were prepared using ultra-pure water.Synthesis of 2D/2D Z-scheme WO3/g-C3N4 heterojunctions
400 mg of Na2WO4·2H2O was added into 300 mL of 4.8 M nitric acid at room temperature for 72 h, centrifugally washed and dried, and ground into a yellow powder as the WO3·2H2O precursor.34 10 g melamine was put into a covered crucible and calcined at 550 °C (heating rate: 5 °C min−1) in a muffle furnace for 4 h. After air cooling, it was ground into a light yellow powder as Bulk g-C3N4.36500 mg of Bulk g-C3N4 was mixed with WO3·2H2O of different masses in 20 mL ethanol, ultrasonicated in an ice water bath for 12 h, stirred for 1 hour, and completely dried. The sample underwent rapid calcination at 400 °C for 0.5 h, and was fully ground to obtain the 2D/2D Z-scheme WO3/g-C3N4 heterojunctions. WO3 in the WO3/g-C3N4 composite is the final product of 10 wt.%, 20 wt.%, 30 wt.%, 40 wt.% and 50 wt.%, respectively. They were named as 10% WO3/g-C3N4, 20% WO3/g-C3N4, 30% WO3/g-C3N4, 40% WO3/g-C3N4 and 50% WO3/g-C3N4. Pure WO3 and pure g-C3N4 were prepared for comparison experiments.
Photocatalytic degradation evaluation
The light source was a 300 W Xenon lamp (HX-UV300, Beijing NBET Technology Co., Ltd) equipped with a UVCUT420 (λ ≥ 420) UV cut-off filter. The optical power meter (CEL-NP2000) monitored the light intensity, and the light intensity was controlled at 100 mW cm−2.This work used antibiotic organic pollutants TC-HCl and dye organic pollutants MB, RhB and MO as photocatalytic degradation targets. The characteristic peaks of TC-HCl, RhB, MB and MO were 357 nm, 554 nm, 664 nm and 463 nm,37–39 respectively. The 30 mg photocatalyst was dispersed in 100 mL aqueous solution containing 10 mg L−1 organic pollutants, and stirred away from light for 30 min to achieve the adsorption–desorption equilibrium. After the visible-light source was turned on, a 3 mL suspension was taken at certain intervals for centrifugation, and the absorbance of the organic pollutants after degradation was determined by UV-Vis spectrophotometer (YOKE T3202). The degradation efficiency (η) was calculated using the characteristic peak absorbance value. The η was calculated by the eqn (1):38
 | (1) |
Photocatalytic nitrogen fixation evaluation
Experiment 1 and Experiment 2 are two typical conditions of the photocatalytic nitrogen fixation reaction.34,40,41 The light source was 300 W Xenon lamp (HSX-UV300).Experiment 1: a 100 mg quantity of photocatalyst was dispersed in 100 mL ultra-pure water, and then ultrasonicated for 15 min. Air flowed into the above suspension at a rate of 100 mL min−1. The suspension was taken at set intervals to test the concentration of NH4+ and NO3−.34,41
Experiment 2: a 100 mg quantity of photocatalyst was dispersed in 100 mL 20% methanol aqueous solution, and then ultrasonicated for 15 min. N2 flowed into the above suspension at a rate of 100 mL min−1. The suspension was taken at set intervals to test the concentration of NH4+ and NO3−.40,41
The concentration of NH4+ was determined by Nessler's reagent colorimetric method. The concentration of NO3− was measured by ion chromatography (Shimadzu LC20Adsp, Shodex IC SI-52 4E). The above methods were referred to in our previous paper.41
Results and discussion
Photocatalyst characterization
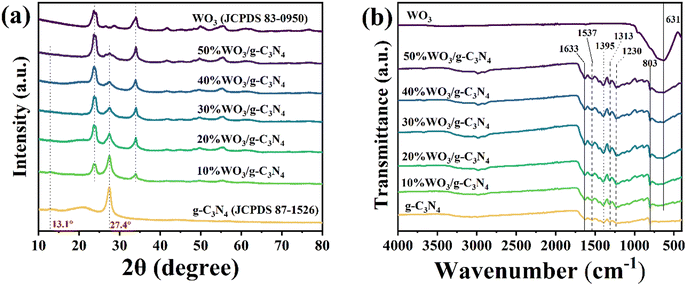
X-ray diffraction spectra (XRD, Rigaku D/MAX-2550V) (Fig. 1(a)) and Fourier-transform infrared (FT-IR, BRUKER VERTEX70) spectra (Fig. 1(b)) were used to characterize the chemical composition and structure of the g-C3N4, WO3 and WO3/g-C3N4 composites. In Fig. 1(a), the characteristic peaks at 13.1° and 27.4° belong to the (100) and (002) crystal faces of pure g-C3N4 (JCPDS 87-1526),33,42 respectively. The (002) peak is attributed to the stacking structure of the conjugated aromatic rings, while the (100) peak is attributed to the interlayer stacking of g-C3N4.43,44 Therefore, after g-C3N4 was peeled off by ultrasonic treatment, the intensity of the (100) peak gradually broadened and weakened until it disappeared. The characteristic peaks of pure WO3 are in accordance with JCPDS 83-0950, which belongs to monoclinic WO3 (m-WO3).45 The XRD results of WO3/g-C3N4 contain the characteristic peaks of g-C3N4 and WO3. With the increase of WO3 doping amount, the peaks of WO3 become stronger, while the peaks of g-C3N4 become weaker. The XRD results indicate that the WO3/g-C3N4 composites were prepared successfully. These materials maintain the complete crystal structure of the sheet-like g-C3N4 and WO3.As shown in Fig. 1(b), the FT-IR spectrum of pure WO3 has a wide peak at 631 cm−1 due to the stretching vibration of the O–W–O bond.46 The peak of pure g-C3N4 at 803 cm−1 was ascribed to the out-of-plane bending vibration of the 3-S-triazine ring. The peaks at 1230 cm−1, 1313 cm−1, 1395 cm−1, 1537 cm−1 and 1633 cm−1 belong to the skeleton stretching vibration of the C–N heterocyclic ring.42 All signals of g-C3N4 can be seen in the FT-IR spectra of WO3/g-C3N4. With the increase of the WO3 doping amount, the characteristic peaks of WO3 gradually become stronger. This is consistent with the XRD results, and indicates the structural integrity of the WO3/g-C3N4 composite.
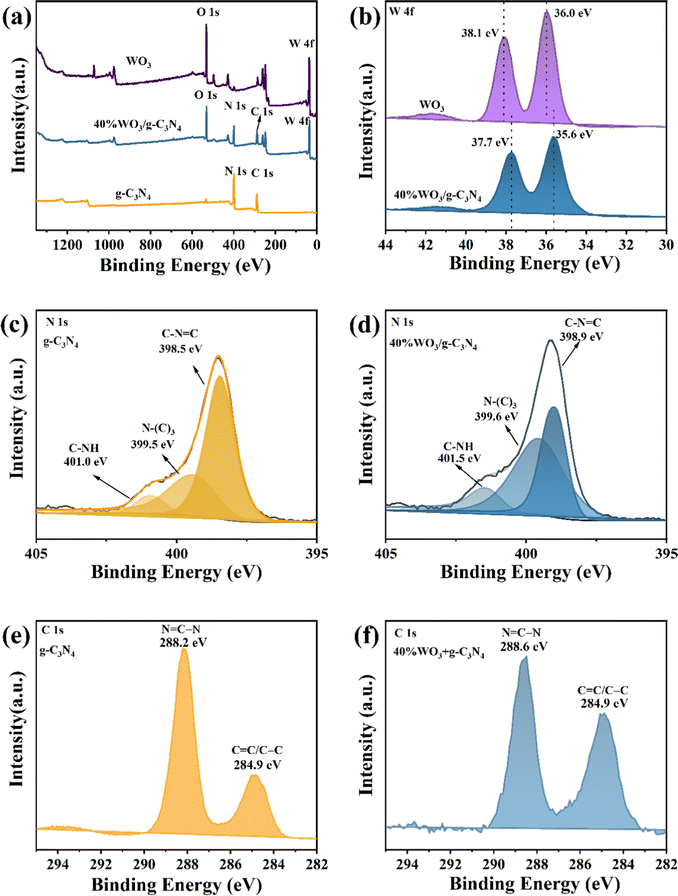
X-ray photoelectron spectroscopy (XPS, Thermo Fisher Scientific ESCALAB250Xi) was applied to study the surface element composition and valence information of the photocatalysts. Fig. 2(a) shows the XPS full spectrum of g-C3N4, WO3 and 40%WO3/g-C3N4. The XPS survey spectrum of 40%WO3/g-C3N4 shows four elements (C, N, O and W), and no other impurities appear. The C and N are provided by g-C3N4, and O and W are provided by WO3. Fig. 2(b) is the high-resolution W 4f spectrum of WO3 and 40%WO3/g-C3N4. Compared with the two peaks of pure WO3 (36.0 eV and 38.1 eV), the two peaks of 40%WO3/g-C3N4 shift to lower binding energy (35.6 eV and 37.7 eV). The reason for this shift may be that the hydrogen bond formed between the terminal –NH2 and W–O bond during the action of WO3 and g-C3N4 will slightly weaken the W–O bond, thus reducing the binding energy value of W 4f in 40%WO3/g-C3N4.47,48Fig. 2(c) and (d) show the high-resolution N 1s spectra of g-C3N4 and 40%WO3/g-C3N4, respectively. The positions of the three N1s peaks of pure g-C3N4 are 398.5 eV, 399.5 eV and 401.0 eV, which can be attributed to C–N![[double bond, length as m-dash]](https://www.rsc.org/images/entities/char_e001.gif) C, N–(C)3 and C–NH,49 respectively. The N 1s peaks of 40%WO3/g-C3N4 are shifted towards higher binding energy due to the charge transfer at the interface of WO3 and g-C3N4.50 This illustrates that a heterostructure is formed between g-C3N4 and WO3. Fig. 2(e) and (f) show the high-resolution C 1s spectra of g-C3N4 and 40%WO3/g-C3N4, respectively. 40%WO3/g-C3N4 has two major C 1s peaks at 284.9 eV and 288.6 eV, corresponding to sp2 bonded carbon (N
C, N–(C)3 and C–NH,49 respectively. The N 1s peaks of 40%WO3/g-C3N4 are shifted towards higher binding energy due to the charge transfer at the interface of WO3 and g-C3N4.50 This illustrates that a heterostructure is formed between g-C3N4 and WO3. Fig. 2(e) and (f) show the high-resolution C 1s spectra of g-C3N4 and 40%WO3/g-C3N4, respectively. 40%WO3/g-C3N4 has two major C 1s peaks at 284.9 eV and 288.6 eV, corresponding to sp2 bonded carbon (N![[double bond, length as m-dash]](https://www.rsc.org/images/entities/char_e001.gif) C–N) and aromatic carbon (C
C–N) and aromatic carbon (C![[double bond, length as m-dash]](https://www.rsc.org/images/entities/char_e001.gif) C/C–C),19 while the corresponding peaks positions for pure g-C3N4 are 284.9 eV and 288.2 eV, respectively. Compared to g-C3N4, the position of 40%WO3/g-C3N4 was slightly shifted by 0.4 eV.50 This is consistent with the results of N1s, verifying the existence of the heterojunction.
C/C–C),19 while the corresponding peaks positions for pure g-C3N4 are 284.9 eV and 288.2 eV, respectively. Compared to g-C3N4, the position of 40%WO3/g-C3N4 was slightly shifted by 0.4 eV.50 This is consistent with the results of N1s, verifying the existence of the heterojunction.
The surface morphology of g-C3N4, WO3 and 40%WO3/g-C3N4 can be visually displayed through scanning electron microscope (SEM, Hitachi SU8010) and high-resolution transmission electron microscope (HRTEM, JEOL JEM-F200) with an energy dispersive spectrometer (EDS). As shown by the white arrow in Fig. 3(a), g-C3N4 is a stack of nanosheets with a thickness of less than 30 nm. WO3 is composed of WO3 nanosheets, which are indicated by the white arrow in Fig. 3(b). Fig. 3(c) shows that 40%WO3/g-C3N4 is a 2D composite structure formed by stacking g-C3N4 nanosheets and WO3 nanosheets together.
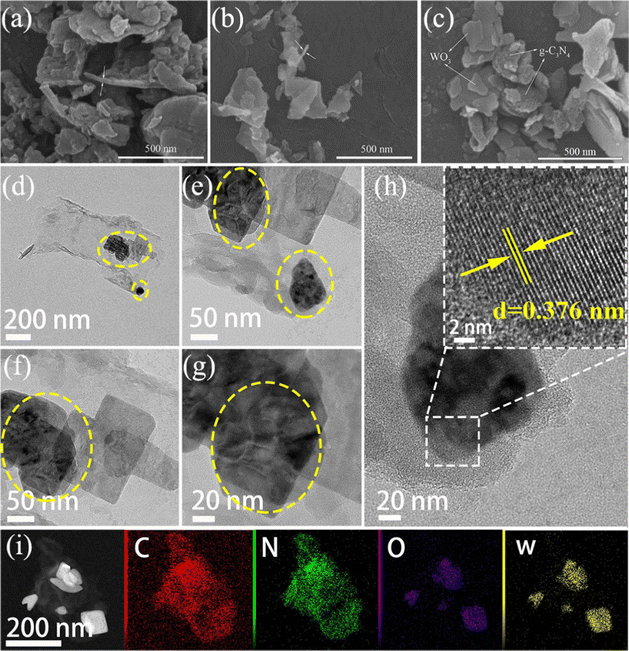 | ||
| Fig. 3 SEM images of (a) g-C3N4, (b) WO3 and (c) 40%WO3/g-C3N4; (d)–(h) HRTEM images and (i) EDS mapping images of 40%WO3/g C3N4. | ||
Fig. 3(d)–(h) displays the HRTEM images of 40%WO3/g-C3N4. WO3 is darker than g-C3N4, and WO3 is marked with the yellow circle. The lattice plane of 0.376 nm corresponds to the (002) plane of WO3 (Fig. 3(h)).10 The EDS mapping images of 40%WO3/g C3N4 (Fig. 3(i)) demonstrates the existence and the location of the C, N, O and W elements. These results further prove the successful preparation of 2D/2D WO3/g C3N4.
The specific surface area and pore structure of the g-C3N4 and WO3/g-C3N4 composites were studied by N2 adsorption–desorption isotherm (Fig. S1a, ESI†) using Micromeritics ASAP 2460. The pore size distribution diagram (Fig. S1b, ESI†) shows that the pore sizes of these six samples are mainly mesoporous. Among them, the pores of 40%WO3/g-C3N4 are mainly distributed in the 1.5–16 nm range, and there are few mesopores smaller than 2 nm.51 Table S1 (ESI†) summarizes the data for the specific surface area and pore volume. The specific surface areas of the WO3/g-C3N4 composites are all smaller than that of pure g-C3N4, and 20%WO3/g-C3N4 (11.88 m2 g−1) has the smallest specific surface area. The specific surface area sizes of 40% WO3/g-C3N4 (14.87 m2 g−1) and 50% WO3/g-C3N4 (14.90 m2 g−1) are similar. For the pore volume, the pure g-C3N4 (0.49 cm3 g−1) is still the largest, and 20% WO3/g-C3N4 (0.04 cm3 g−1) is the smallest. The specific surface area and pore volume can affect the number of active sites, and thus affect the adsorption and reaction effect in the catalytic process. However, the specific surface area and pore volume are not necessarily better with larger sizes. It is necessary to synthesize other properties to obtain the final catalytic performance. Table S1 (ESI†) also shows the zeta potential of the g-C3N4 and WO3/g-C3N4 composites in water.
Fig. 4(a) shows the results from investigating the optical properties of the g-C3N4, WO3 and WO3/g-C3N4 composites by ultraviolet and visible diffuse reflectance spectra (UV-Vis DRS, SHIMADZU UV-3600 Plus). Fig. 4(a) was converted into Fig. 4(b) using the Kubelka–Munk function, and the band gap (Eg) of the g-C3N4, WO3 and WO3/g-C3N4 composites was estimated.41 The Eg values of pure g-C3N4 and pure WO3 are 2.48 eV and 2.41 eV, respectively. The similar Eg of these two pure substances leads to the similar Eg of the WO3/g-C3N4 composites, which is why the g-C3N4, WO3 and WO3/g-C3N4 composites are all yellow. The Eg of 40%WO3/g-C3N4 and 50%WO3/g-C3N4 is 2.43 eV, which is the smallest Eg among the five WO3/g-C3N4 composites and is more conducive to the absorption of visible light.
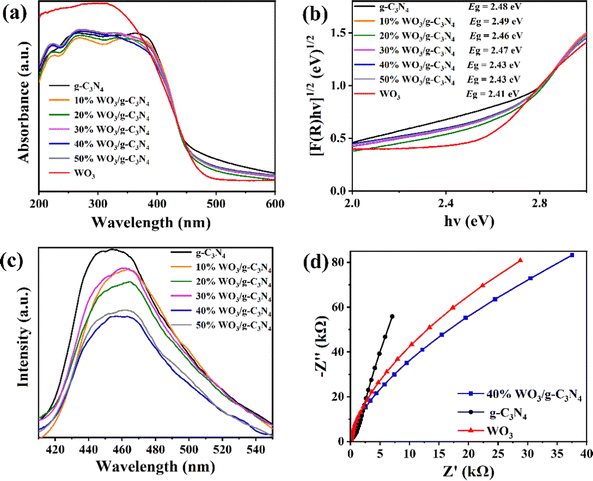 | ||
| Fig. 4 (a) UV-vis DRS spectra, (b) Eg and (c) PL spectra of the g-C3N4, WO3 and WO3/g-C3N4 composites; (d) EIS of 40%WO3/g-C3N4, g-C3N4 and WO3. | ||
To further study the photogenerated carrier recombination probability of the g-C3N4 and WO3/g-C3N4 composites, the photoluminescence (PL, HORIBA FluoroMax-4) spectra of the samples were tested. The weak PL peak intensity indicates the low recombination probability of the photogenerated carriers and high separation efficiency.43,52 As shown in Fig. 4(c), the PL peak intensity was ranked as g-C3N4 > 30%WO3/g-C3N4 > 10%WO3/g-C3N4 > 20%WO3/g-C3N4 > 50%WO3/g-C3N4 > 40% WO3/g-C3N4. The 40%WO3/g-C3N4 photogenerated carrier recombination rate is the lowest in the above samples. Thus, the photogenerated e−–h+ separation efficiency of 40%WO3/g-C3N4 is the highest, which is conducive to improving its photocatalytic performance.
Electrochemical impedance spectroscopy (EIS, CHI660E Electrochemical Workstation) was used to further investigate the charge transfer capability of the g-C3N4, WO3 and 40% WO3/g-C3N4 (Fig. 4(d)).41 A smaller arc radius on the EIS Nyquist diagram corresponds to a smaller charge transfer resistance on the working electrode surface.41 In Fig. 4(d), the arc radius of 40% WO3/g-C3N4 is smaller than that of g-C3N4 and WO3, illustrating that 40% WO3/g-C3N4 has better photogenerated electron–hole separation and transfer ability.
Photocatalytic degradation performance
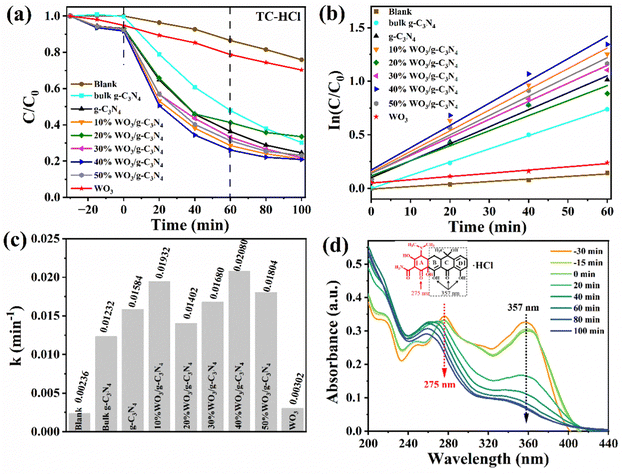
Firstly, the photocatalyst and TC-HCl were mixed away from light for 30 min (t is −30 to 0 min in the corresponding Fig. 5(a)) to reach the adsorption–desorption equilibrium. The degradation efficiencies of the g-C3N4, WO3 and WO3/g-C3N4 composites as a photocatalyst for the antibiotic organic pollutant TC-HCl are shown in Fig. 5(a). The adsorption efficiency of the g-C3N4, WO3 and WO3/g-C3N4 composites for TC-HCl is about 7%. The adsorption rate of pure WO3 to TC-HCl is slower than that of the g-C3N4 and WO3/g-C3N4 composites, while the adsorption of bulk g-C3N4 to TC-HCl was almost zero. When t is 0 min, the visible light source was turned on to start the photocatalytic reaction. “Blank” is the blank control without any photocatalyst. The self-degradation rate of TC-HCl is 24.1% after 100 min visible-light irradiation. The removal efficiency of TC-HCl by bulk g-C3N4, g-C3N4, WO3, 10%WO3/g-C3N4, 20%WO3/g-C3N4, 30%WO3/g-C3N4, 40%WO3/g-C3N4 and 50%WO3/g-C3N4 are 69.8%, 75.4%, 29.7%, 78.8%, 66.6%, 78.1%, 79.1% and 76.9%, respectively. It shows that 40%WO3/g-C3N4 has the best degradation effect on TC-HCl. The degradation rate of the WO3/g-C3N4 composite became slow after the irradiation time t was 60 min, indicating that the maximum degradation efficiency was reached at 60 min. Therefore, t was 0–60 min for the first-order kinetic fitting (Fig. 5(b)). Fig. 5(a) shows the degradation process, and Fig. 5(b) shows the first-order kinetics fitting curve, which was calculated by eqn (2): | (2) |
Fig. 5(c) is a histogram comparison of the apparent rate constant k. The k values of bulk g-C3N4, g-C3N4, WO3, 10%WO3/g-C3N4, 20%WO3/g-C3N4, 30%WO3/g-C3N4, 40%WO3/g-C3N4 and 50%WO3/g-C3N4 were 0.00236 min−1, 0.01232 min−1, 0.01584 min−1, 0.00302 min−1, 0.01932 min−1, 0.01402 min−1, 0.01680 min−1, 0.02080 min−1 and 0.01804 min−1, respectively. Therefore, the introduction of the g-C3N4 nanosheets is greatly enhanced the catalytic effect of WO3. Among them, 40%WO3/g-C3N4 had the best degradation efficiency, which was 1.69 times, 1.31 times and 6.89 times of bulk g-C3N4, g-C3N4 and WO3, respectively.
Fig. 5(d) shows the UV-visible absorption spectrum during the adsorption and degradation of TC-HCl by 40%WO3/g-C3N4. TC-HCl has two characteristic peaks at 275 nm and 357 nm, as shown in Fig. 5(d). It has been reported that the peak at 275 nm is associated with the aromatic ring A structure, including the enolic hydroxyl, amide and ketone groups. The peak at 357 nm is from aromatic rings B, C, and D, comprising the extended chromophores.53 40%WO3/g-C3N4 can simultaneously destroy the rings B, C, D, and A, but the destructive effect on A is relatively weak under visible light. The slight shift in the location of the characteristic peak may be caused by the slight change in pH during the removal process.
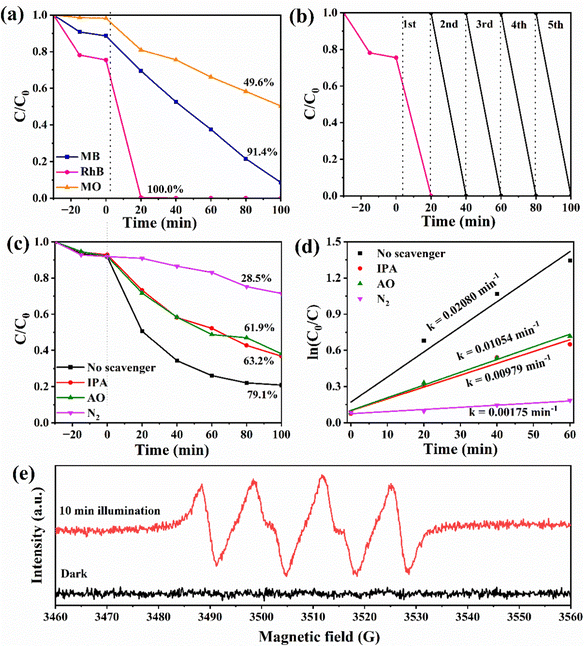
Fig. 6(a) shows the removal process of 40%WO3/g-C3N4 as a photocatalyst for three typical dyes with different charge properties, cationic dye MB, amphoteric dye RhB, and anionic dye MO. After 30 min dark adsorption process, 11.4% MB, 24.6% RhB and 1.8% MO can be removed. According to Table S1 (ESI†), 40%WO3/g-C3N4 was negatively charged in water, so the adsorption effect of the anionic dye MO was poor. When the light source was turned on, RhB was almost completely degraded after 20 min. After 100 min, the total removal rate of MB reached 91.4%, while that of MO was only 49.6%. Therefore, it proves that 40%WO3/g-C3N4 has a good removal effect on MB and RhB.
Fig. 6(b) shows the recycling experiments of 40%WO3/g-C3N4, where it can be seen that 40%WO3/g-C3N4 almost maintained its original degradation efficiency of RhB after 5 cycles. Therefore, 40%WO3/g-C3N4 possessed good photocatalytic stability for the potential application.
Photocatalytic degradation mechanism
It has been reported that the superoxide radical (˙O2−), hole (h+), and hydroxyl radical (˙OH) are the main active species in photocatalytic oxidation reactions.54 To study the photocatalytic degradation mechanism of the 40%WO3/g-C3N4 photocatalyst, three trapping agents were applied to explore the active species in the photocatalytic reaction process. In this work, 1 mM ammonium oxalate (AO) was used to capture h+, and 1 mM isopropyl alcohol (IPA) was used to capture ˙OH. N2 is used to remove O2 in the reaction system. It blocked the generation of ˙O2− from the root. Therefore, N2 can be used as the trapping agent of ˙O2−.55 By adding different trapping agents in the reaction solution, the corresponding reactive species were removed. According to the change of photocatalytic efficiency, the role of different active substances in the photocatalytic process can be determined. The device and process of the above capture experiment are the same as that of the photocatalytic performance test.Fig. 6(c) shows the degradation process of 10 mg L−1 TC-HCl by 0.3 g L−1 40%WO3/g-C3N4 when IPA, AO and N2 were added to the reaction system. The removal rate decreased from 79.1% to 63.2%, 61.9% and 28.5%, respectively. It indicated that N2 has the greatest impact on the removal rate. Therefore, ˙O2− was the main active species, while h+ and ˙OH had similar effects as the minor active species. Fig. 6(d) shows the kinetic fitting curves for the photocatalytic process that is shown in Fig. 6(c). The first 60 min of the reaction process conforms to the first-order kinetic model. The apparent rate constants k decreased from 0.02080 min−1 to 0.00979 min−1, 0.01054 min−1 and 0.00175 min−1, respectively (Fig. 6(d)). This verifies that the role of the active species in this process is ranked as ˙O2− > h+ ≈ ˙OH.
The valence band potential (EVB) and conduction band potential (ECB) of the semiconductor zero charge point (pHzpc) can be estimated by eqn (3) and (4):56–60
| EVB = X − Ee + 0.5Eg | (3) |
| ECB = EVB − Eg | (4) |
Whether the ˙O2− species are generated over 40% WO3/g-C3N4 under light irradiation offers an important clue to determining the transfer route of the charge carriers. ·O2− was detected using electron paramagnetic resonance (EPR, Bruker EMXplus-6/1). In Fig. 6(e), the apparent ˙O2− characteristic peaks can be observed in the EPR spectrum of 5,5-dimethyl-1-pyrroline N-oxide (DMPO)- ˙O2− adduct over 40% WO3/g-C3N4 after 10 min light illumination, demonstrating the generation of ˙O2−.61,62
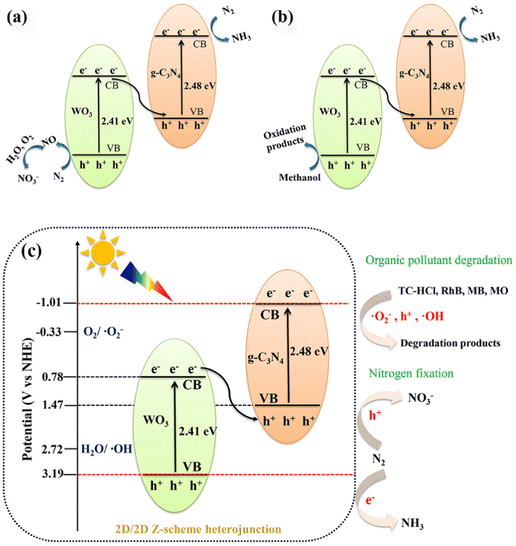
According to the results of the above capture experiments and EPR, two possible reaction mechanisms are proposed in Fig. 7. The electron (e−) on the CB of WO3 and h+ on VB of g-C3N4 in the Z-scheme 40%WO3/g-C3N4 heterojunction (Fig. 7(a)) are recombined. The CB of g-C3N4 is more negative than O2/˙O2− (−0.33V vs. NHE), and the VB of WO3 is more positive than H2O/˙OH (2.72V vs NHE), which allows ˙O2− and ˙OH to be produced. If g-C3N4 and WO3 form a conventional type-II heterojunction (Fig. 7(b)), the CB of g-C3N4 will transfer e− to the CB of WO3, while the VB of WO3 will transfer h+ to the VB of g-C3N4. However, in this case, the CB of WO3 will be more positive than O2/˙O2−, so that the electrons on CB cannot reduce O2 to generate ˙O2−.47 At the same time, the VB of g-C3N4 will be more negative than H2O/˙OH, so that the h+ in VB cannot oxidize H2O to generate ˙OH.47 In conclusion, 40%WO3/g-C3N4 is the Z-scheme heterojunction. This structure can improve the separation of the photogenerated e− and h+, and enhance the redox ability of the photogenerated e− and h+, as well as the catalytic performance of the photocatalyst.9–16
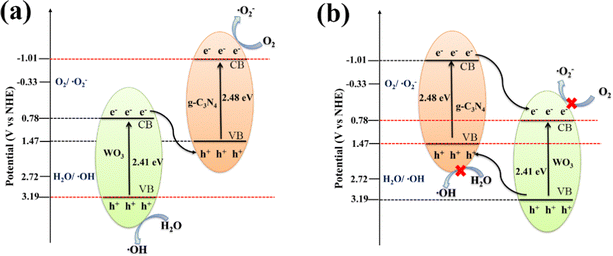 | ||
| Fig. 7 The proposed mechanisms for the degradation of organic pollutants by 40%WO3/g-C3N4 (a) Z-scheme heterojunction and (b) type-II heterojunction. | ||
In addition, the comparison of almost all published 2D/2D Z-scheme WO3/g-C3N4 heterojunction systems is shown in Table 1, which indicates that the facile synthetic 2D/2D Z-scheme WO3/g-C3N4 heterojunctions in this work exhibit considerable photocatalytic performance in the environmental application and energy application without any cocatalyst.9–16
| Photocatalyst | Synthesis | Environmental application | Energy application | Ref. |
|---|---|---|---|---|
| WO3·H2O/g-C3N4 | Ultrasonic-assisted self-assembly | 95% RhB degradation in 80 min | — | 9 |
| WO3/Ag/CN | Solvent evaporation and in situ calcination | 96.2% RhB degradation in 40 min; ∼90% TC degradation in 140 min | — | 10 |
| WO3/CNT/g-C3N4 | Wet impregnation | 92.3% MO degradation in 60 min | H2 production | 11 |
| Pt-g-C3N4/H-WO3 | Post-annealing | — | H2 production | 12 |
| WO3/RGO/H-g-C3N4 | Microwave-assisted hydrothermal method | ∼90% TC-HCl degradation in 60 min | — | 13 |
| WO3/g-C3N4 | In situ construction | ∼100% RhB degradation in 40 min | — | 14 |
| Pt–WO3/g-C3N4 | Reverse microemulsion | — | H2 production | 15 |
| g-C3N4/Si-O/WO3 | Wet chemical method | — | Aerobic alcohol oxidation | 16 |
| WO 3 /g-C 3 N 4 | Rapid calcination | 79.1% TC-HCl, 91.4% MB and 49.6% MO degradation in 100 min, respectively; ∼100% RhB degradation in 20 min | Nitrogen fixation (NNR and NOR) | This work |
Photocatalytic nitrogen fixation performance
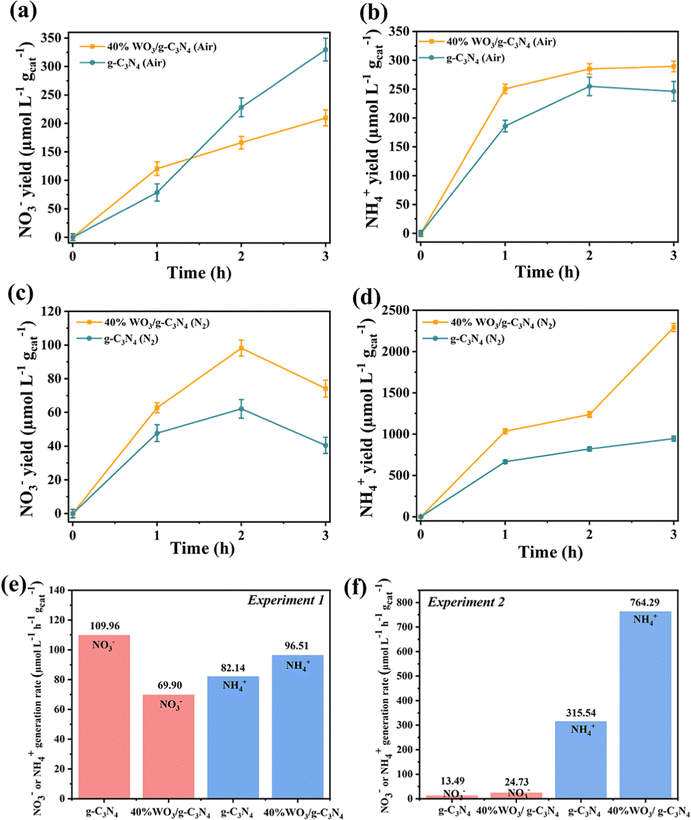
Fig. 8(a), (b) and (e) show the generation of NO3− and NH4+ in Experiment 1. As shown in Fig. 8(a), when the air was introduced into the aqueous suspension of 40%WO3/g-C3N4 under Xenon lamp irradiation, the NO3− concentration increased with the increase of the reaction time. After 1 h, the NO3− yield decreased, and the amount of the NO3− yield was lower than that of pure g-C3N4. As shown in Fig. 8(b), the yield of NH4+ first increased for 1 h and then gradually stabilized. At the same time, the yield was always higher than that of pure g-C3N4. Fig. 8(e) shows that the 3 h average NO3− yield of 40%WO3/g-C3N4 was 69.90 μmol L−1 h−1 gcat−1, and the 3 h average NH4+ yield was 96.51 μmol L−1 h−1 gcat−1. Unlike pure g-C3N4, the yield of the nitrogen fixed product NO3− in the N2 disproportionation reaction of 40%WO3/g-C3N4 was lower than that of NH4+. The total nitrogen fixation efficiency of 40%WO3/g-C3N4 was 166.41 μmol L−1 h−1 gcat−1, which was lower than that of pure g-C3N4 (192.10 μmol L−1 h−1 gcat−1). Therefore, the nitrogen disproportionation reaction efficiency of 40%WO3/g-C3N4 in Experiment 1 was lower than that of pure g-C3N4 and the NRR accounted for a larger proportion in the disproportionation reaction.The generation of NO3− and NH4+ in Experiment 2 is shown in Fig. 8(c), (d) and (f). When N2 was introduced into a 20% methanol (as hole scavenger) aqueous suspension containing 40%WO3/g-C3N4 under Xenon lamp irradiation, the NO3− yield first increased and then decreased (Fig. 8(c)). In the 2 hours, a small amount of NO3− was produced due to the removal of h+. After 2 hours, the e− reduce NO3− and the NO3− yield decreased. For Fig. 8(d), the NH4+ yield continued to increase. In addition, the NH4+ yield of 40%WO3/g-C3N4 was 2.37 times higher than that of pure g-C3N4. Fig. 8(f) shows that the 3 h average NO3− yield of 40%WO3/g-C3N4 was 24.73 μmol L−1 h−1 gcat−1, and the 3 h average NH4+ yield was 764.29 μmol L−1 h−1 gcat−1. NH4+ was the main nitrogen fixation product. The total nitrogen fixation efficiency of 40%WO3/g-C3N4 (789.02 μmol L−1 h−1 gcat−1) was 2.40 times higher than that of the g-C3N4 nanosheets (329.03 μmol L−1 h−1 gcat−1). Experiment 2 showed that 40% WO3/g-C3N4 enhanced the NRR.
Photocatalytic nitrogen fixation mechanism
A photocatalytic nitrogen fixation mechanism based on the 40%WO3/g-C3N4Z-scheme heterojunction was proposed, as shown in Fig. 9(a) and (b). Under light irradiation, 40%WO3/g-C3N4 generated photogenerated electron–hole (e−–h+) pairs on VB. Then, e− was transferred from VB to CB while leaving h+ on VB. In Experiment 1 (Fig. 9(a)), the photogenerated e− on VB can be transferred to the surface via nitrogen vacancies. Then, e− can reduce N2 (in the incoming air) to NH3. At the same time, the remaining photogenerated h+ in VB can oxidize N2 (in the incoming air) to NO. Then, NO further reacts with O2 and H2O to generate NO3−.31,34In Experiment 1, N2 underwent a disproportionation reaction to generate NH4+ and NO3−. It has been reported that the disproportionation reactions are energetically more favorable than the individual oxidation or reduction reactions.31 According to the law of charge conservation, the ratio of NO3− to NH4+ generated in the N2 dismutation reaction should be 3![[thin space (1/6-em)]](https://www.rsc.org/images/entities/char_2009.gif) :
:![[thin space (1/6-em)]](https://www.rsc.org/images/entities/char_2009.gif) 5.31 Nevertheless, the actual ratio of NO3− to NH4+ is closer to 5
5.31 Nevertheless, the actual ratio of NO3− to NH4+ is closer to 5![[thin space (1/6-em)]](https://www.rsc.org/images/entities/char_2009.gif) :
:![[thin space (1/6-em)]](https://www.rsc.org/images/entities/char_2009.gif) 7. The slightly lower proportion of NH4+ is due to the competition from the hydrogen evolution reaction (HER). In Experiment 1, 40%WO3/g-C3N4 with the Z-scheme heterojunction was not more effective than pure g-C3N4. This is because g-C3N4 is beneficial to the adsorption and activation of N2, and the active ingredient of 40%WO3/g-C3N4 is mainly on the VB of WO3. The adsorbed and activated N2 on g-C3N4 is far from h+, which results in reduced NOR efficiency.
7. The slightly lower proportion of NH4+ is due to the competition from the hydrogen evolution reaction (HER). In Experiment 1, 40%WO3/g-C3N4 with the Z-scheme heterojunction was not more effective than pure g-C3N4. This is because g-C3N4 is beneficial to the adsorption and activation of N2, and the active ingredient of 40%WO3/g-C3N4 is mainly on the VB of WO3. The adsorbed and activated N2 on g-C3N4 is far from h+, which results in reduced NOR efficiency.
However, in Experiment 2 (Fig. 9(b)), the photogenerated h+ was consumed by the hole sacrifice agent, which highlighted the advantage of the 40%WO3/g-C3N4Z-scheme heterojunction. A large amount of photogenerated e− could reduce N2 to NH3 and improve the NRR reaction efficiency. Therefore, 40%WO3/g-C3N4 is suitable for photocatalytic nitrogen fixation, reducing N2 to ammonia. The reaction conditions of nitrogen fixation have a great influence on the reaction products of nitrogen fixation.
Conclusions
A series of 2D/2D Z-scheme WO3/g-C3N4 heterojunctions were prepared by facile rapid calcination, and the degradation effect of different WO3 ratios on the typical antibiotic organic contaminant TC-HCl was explored. The photocatalytic degradation effect of 40%WO3/g-C3N4 is 1.69, 1.31 and 6.89 times higher than that of bulk g-C3N4, g-C3N4 and WO3 nanosheets, respectively. The removal efficiency of RhB, MB and MO were 100%, 91.4% and 49.6%, respectively. The main reactive species of 40%WO3/g-C3N4 in the degradation process was ˙O2−. The 2D/2D Z-scheme WO3/g-C3N4 can realize photocatalytic nitrogen fixation. With the presence of a hole sacrifice agent and N2 as the nitrogen source, the photocatalytic nitrogen fixation reaction of 40%WO3/g-C3N4 was dominated by NRR, and the almost all product was NH4+ (764.29 μmol L−1 h−1 gcat−1). The total nitrogen fixation efficiency was 2.40 times higher than that of pure g-C3N4. The results prove that the 2D/2D Z-scheme heterojunction enhanced the photogenerated electron–hole separation and transfer ability, which is very effective in both photocatalytic degradation and photocatalytic nitrogen fixation application scenarios (Fig. 9(c)). This work provides a reference for understanding the 2D/2D Z-scheme heterojunctions, photocatalytic NRR and NOR reactions, and the photocatalytic degradation process of antibiotics and organic pollutants with different charge properties.Author contributions
Yasi Li contributed to the experimental design, investigation, validation, and writing of the original draft. Junkai Wang performed the conceptualization, methodology, investigation, visualization, and funding acquisition.Conflicts of interest
There are no conflicts to declare.Acknowledgements
This work was funded by the Special Program for Science Research Foundation of the Higher Education Institutions of Guangdong Providence (grant no. 2020ZDZX2052), and the Shantou University Scientific Research Foundation for Talents (grant no. NTF22004).References
- J. Bai, R. Shen, Z. Jiang, P. Zhang, Y. Li and X. Li, Chin. J. Catal., 2022, 43, 359–369 CrossRef.
- Y. Hu, X. Li, W. Wang, F. Deng, L. Han, X. Gao, Z. Feng, Z. Chen, J. Huang, F. Zeng and F. Dong, Chin. J. Struct. Chem., 2022, 41, 2206069 Search PubMed.
- G. M. Li, B. Wang and R. Wang, Chin. J. Struct. Chem., 2020, 39, 1675–1688 Search PubMed.
- Z. Jin, Y. Li and X. Hao, Acta Phys.-Chim. Sin., 2021, 37, 1912033 Search PubMed.
- X. Li, B. Wang, W. Yin, J. Di, J. Xia, W. Zhu and H. Li, Acta Phys.-Chim. Sin., 2020, 36, 17401 Search PubMed.
- L. Huang, H. Xu, Y. Li, H. Li, X. Cheng, J. Xia, Y. Xu and G. Cai, Dalton Trans., 2013, 42, 8606–8616 RSC.
- Y. Y. Zhou, J. X. Zhang and D. F. Wu, ChemistrySelect, 2023, 8, e202301237 CrossRef.
- K. He, J. Xie, X. Luo, J. Wen, S. Ma, X. Li, Y. Fang and X. Zhang, Chin. J. Catal., 2017, 38, 240–252 CrossRef.
- L. Li, D. Jiang, X. Wu, X. Sun, X. Qu, L. Shi and F. Du, J. Mater. Sci., 2020, 55, 4238–4250 CrossRef CAS.
- J. Chen, X. Xiao, Y. Wang and Z. Ye, Appl. Surf. Sci., 2019, 467–468, 1000–1010 CAS.
- U. Bharagav, N. R. Reddy, V. N. K. Rao, P. Ravi, M. Sathish, D. Rangappa, K. Prathap, C. S. Chakra, M. V. Shankar, L. Appels, T. M. Aminabhavi, R. R. Kakarla and M. M. Kumari, Chemosphere, 2023, 311, 137030 CrossRef CAS PubMed.
- D. Liu, S. Zhang, J. Wang, T. Peng and R. Li, ACS Appl. Mater. Interfaces, 2019, 11, 27913–27923 CrossRef CAS.
- Y. Bao, H. Guo, L. Jiang, Z. Liu, J. Qu, C. Zhang, X. Jia and K. Chen, Appl. Surf. Sci., 2019, 496, 143639 CrossRef CAS.
- H. Zhang, Z. Cai, W. Xu, M. Huang and X. Liu, New J. Chem., 2019, 43, 17416 RSC.
- S. Tang, Y. Ma, H. Wang, Y. Liang, X. Xu, D. Zhang, B. Cao, Q. Wang and W. Li, ChemSusChem, 2023, 16, e202202184 CrossRef CAS.
- L. Sun, B. Li, X. Chu, N. Sun, Y. Qu, X. Zhang, I. Khan, L. Bai and L. Jing, ACS Sustainable Chem. Eng., 2019, 7, 9916–9927 CrossRef CAS.
- Z. B. Wu, X. Z. Yuan, J. Zhang, H. Wang, L. B. Jiang and G. M. Zeng, ChemCatChem, 2017, 9, 41–64 CrossRef CAS.
- E. Forgacs, T. Cserhati and G. Oros, Environ. Int., 2004, 30, 953–971 CrossRef CAS PubMed.
- X. R. Yang, Z. Chen, W. Zhao, C. X. Liu, X. X. Qian, M. Zhang, G. Y. Wei, E. Khan, Y. H. Ng and Y. S. Ok, Chem. Eng. J., 2021, 405, 126806 CrossRef CAS PubMed.
- H. Yang, Z. C. Zhao, Y. P. Yang, Z. Zhang, W. Chen, R. Q. Yan, Y. X. Jin and J. Zhang, Sep. Purif. Technol., 2022, 300, 121846 CrossRef CAS.
- Y. X. Li, M. Fu, R. Q. Wang, S. W. Wu and X. M. Tan, Chem. Eng. J., 2022, 444, 136567 CrossRef CAS.
- J. Guo, T. T. Liu, H. Peng and X. G. Zheng, Int. J. Mol. Sci., 2022, 23, 9343 CrossRef CAS.
- F. D. Wu, J. C. Chen and J. P. Hu, J. Environ. Chem. Eng., 2022, 10, 107117 CrossRef CAS.
- S. Krobthong, T. Rungsawang and S. Wongrerkdee, Toxics, 2023, 11, 266 CrossRef CAS.
- G. H. Dong, W. K. Ho and C. Y. Wang, J. Mater. Chem. A, 2015, 3, 23435–23441 RSC.
- J. H. Yang, H. Y. Bai, Y. Z. Guo, H. Zhang, R. B. Jiang, B. C. Yang, J. F. Wang and J. C. Yu, Angew. Chem., Int. Ed., 2021, 60, 927–936 CrossRef CAS PubMed.
- P. F. Xia, X. C. Pan, S. L. Jiang, J. G. Yu, B. W. He, P. M. Ismail, W. Bai, J. J. Yang, L. Yang, H. H. Zhang, M. Cheng, H. Y. Li, Q. Zhang, C. Xiao and Y. Xie, Adv. Mater., 2022, 34, 2200563 CrossRef CAS.
- M. Cheng, C. Xiao and Y. Xie, J. Mater. Chem. A, 2019, 7, 19616–19633 RSC.
- N. Cherkasov, A. O. Ibhadon and P. Fitzpatrick, Chem. Eng. Process., 2015, 90, 24–33 CrossRef CAS.
- X. Z. Chen, N. Li, Z. Z. Kong, W. J. Ong and X. J. Zhao, Mater. Horiz., 2018, 5, 9–27 RSC.
- W. J. Ren, Z. W. Mei, S. S. Zheng, S. N. Li, Y. M. Zhu, J. X. Zheng, Y. Lin, H. B. Chen, M. Gu and F. Pan, Research, 2020, 2020, 3750314 CrossRef CAS PubMed.
- Y. T. Wang, Y. F. Yu, R. R. Jia, C. Zhang and B. Zhang, Natl. Sci. Rev., 2019, 6, 730–738 CrossRef CAS.
- X. B. Chen, L. Liu, P. Y. Yu and S. S. Mao, Science, 2011, 331, 746–750 CrossRef CAS.
- H. Tong, S. X. Ouyang, Y. P. Bi, N. Umezawa, M. Oshikiri and J. H. Ye, Adv. Mater., 2012, 24, 229–251 CrossRef CAS.
- X. C. Wang, K. Maeda, A. Thomas, K. Takanabe, G. Xin, J. M. Carlsson, K. Domen and M. Antonietti, Nat. Mater., 2009, 8, 76–80 CrossRef CAS.
- W. J. Ong, L. L. Tan, Y. H. Ng, S. T. Yong and S. P. Chai, Chem. Rev., 2016, 116, 7159–7329 CrossRef CAS.
- R. B. Xu, M. H. Su, Y. H. Liu, Z. B. Chen, C. Ji, M. L. Yang, X. Y. Chang and D. Y. Chen, J. Cleaner Prod., 2020, 242, 118366 CrossRef CAS.
- Y. S. Li, M. R. Ti, Z. Q. Li, Y. Zhang, L. Wu and Y. J. He, J. Mater. Sci.: Mater. Electron., 2021, 32, 2268–2282 CrossRef CAS.
- T. T. Xiao, Z. Tang, Y. Yang, L. Q. Tang, Y. Zhou and Z. G. Zou, Appl. Catal., B, 2018, 220, 417–428 CrossRef CAS.
- Y. J. Xue, Y. C. Guo, Z. G. Liang, H. Z. Cui and J. Tian, J. Colloid Interface Sci., 2019, 556, 206–213 CrossRef CAS.
- Y. Li, M. Ti, D. Zhao, Y. Zhang, L. Wu and Y. He, J. Alloys Compd., 2021, 870, 159298 CrossRef CAS.
- Y. T. Xiao, G. H. Tian, W. Li, Y. Xie, B. J. Jiang, C. G. Tian, D. Y. Zhao and H. G. Fu, J. Am. Chem. Soc., 2019, 141, 2508–2515 CrossRef CAS.
- Y. J. Xue, X. K. Kong, Y. C. Guo, Z. Q. Liang, H. Z. Cui and J. Tian, J. Materiomics, 2020, 6, 128–137 CrossRef.
- X. Chen, J. Y. Li, Z. R. Tang and Y. J. Xu, Catal. Sci. Technol., 2020, 10, 6098–6110 RSC.
- V. Luxmi and A. Kumar, Mater. Sci. Semicond. Process., 2019, 104, 104690 CrossRef CAS.
- S. Prabhu, S. Manikumar, L. Cindrella and O. J. Kwon, Mater. Sci. Semicond. Process., 2018, 74, 136–146 CrossRef CAS.
- W. Yu, J. Chen, T. Shang, L. Chen, L. Gu and T. Peng, Appl. Catal., B, 2017, 219, 693–704 CrossRef CAS.
- J. Meng, X. Wang, Y. Liu, M. Ren, X. Zhang, X. Ding, Y. Guo and Y. Yang, Chem. Eng. J., 2021, 403, 126354 CrossRef CAS.
- H. Yu, R. Shi, Y. Zhao, T. Bian, Y. Zhao, C. Zhou, G. I. N. Waterhouse, L. Z. Wu, C. H. Tung and T. Zhang, Adv. Mater., 2017, 29, 1605148 CrossRef.
- J. Fu, Q. Xu, J. Low, C. Jiang and J. Yu, Appl. Catal., B, 2019, 243, 556–565 CrossRef CAS.
- Y. Wang, X. Di, X. Wu and X. Li, J. Alloys Compd., 2020, 846, 156215 CrossRef CAS.
- W. Ho, Z. Zhang, W. Lin, S. Huang, X. Zhang, X. Wang and Y. Huang, ACS Appl. Mater. Interfaces, 2015, 7, 5497–5505 CrossRef CAS.
- Y. Quan, M. Liu, H. Wu, X. Tian, L. Dou and Z. Wang, Appl. Surf. Sci., 2024, 642, 158601 CrossRef CAS.
- S. Chen, Y. Hu, S. Meng and X. Fu, Appl. Catal., B, 2014, 150, 564–573 CrossRef.
- X. Liu, A. Jin, Y. Jia, T. Xia, C. Deng, M. Zhu, C. Chen and X. Chen, Appl. Surf. Sci., 2017, 405, 359–371 CrossRef CAS.
- M. Chatterjee, M. Mondal, T. Sukul, K. Ghosh and S. K. Pradhan, J. Ind. Eng. Chem., 2023, 127, 390–405 CrossRef CAS.
- S. Zwane, D. S. Dlamini, B. B. Mamba and A. T. Kuvarega, Inorg. Chem. Commun., 2023, 151, 110637 CrossRef CAS.
- M. Lv, H. Wang and H. Shi, Colloids Surf., A, 2023, 679, 132579 CrossRef CAS.
- C. Mrabet, R. Jaballah, N. Mahdhi, A. Boukhachem and M. Amlouk, J. Alloys Compd., 2023, 968, 172252 CrossRef CAS.
- K. Li, J. Zhu, W. Zhou, L. Sun and S. Tian, J. Alloys Compd., 2023, 968, 171955 CrossRef CAS.
- L. Zhang, J. Qiu, G. Xia, D. Dai, X. Zhong and J. Yao, J. Mater. Sci. Technol., 2023, 138, 214–220 CrossRef CAS.
- X. Mo, X. Zhang, B. Lin, C. Ning, M. Li, H. Liao, Z. Chen and X. Wang, J. Mater. Sci. Technol., 2023, 145, 174–184 CrossRef CAS.
Footnote |
| † Electronic supplementary information (ESI) available. See DOI: https://doi.org/10.1039/d3ma00915g |
| This journal is © The Royal Society of Chemistry 2024 |

