 Open Access Article
Creative Commons Attribution 3.0 Unported Licence
Rapid preparation of electrospun nanofibre sponges through supercritical CO2 drying†
Gioele
Mol
 a,
Christina
Fialová
ab and
Christian
Adlhart
 *a
*a
aZHAW Zurich University of Applied Sciences, School of Life Sciences and Facility Management, Institute of Chemistry and Biotechnology, 8820 Wädenswil, Switzerland. E-mail: christian.adlhart@zhaw.ch
bFaculty of Textile Engineering, Technical University of Liberec TUL, Institute for Nanomaterials, 46117 Liberec 1, Czech Republic
First published on 20th March 2024
Abstract
Nanofibre sponges (NFS) – also known as nanofibre aerogels – are an intriguing class of ultralight, highly porous and flexible materials currently produced by self-assembly of prefabricated nanofibre building blocks. The synthesis of NFS involves a time-consuming freeze-drying step. Here, we report a fast method for the preparation of NFS using rapid critical point drying (CPD). Highly porous NFS were prepared from electrospun polyamid-6 (PA6) nanofibres by conventional freeze-drying and CPD with supercritical CO2 (scCO2). Their microscopic architecture and macroscopic properties such as mechanical strength, permeability, and liquid filtration properties towards microplastics were compared and a filtration mechanism was elaborated. Processing time was significantly reduced from a 48-hour drying step to <1 h by using CPD. The final nanofibre sponges were similar in porosity and mechanical strength, but their microscopic architecture and filtration behaviour (99.4% to 99.998%) were distinctive. The CPD process, already industrially used for the preparation of silica aerogels, has the potential for large-scale fabrication of nanofibre-based porous materials. Moreover, CPD is considered as an additional tool for tuning the microscopic architecture of such materials to the desired application.
Introduction
Electrospun nanofibre sponges (NFS) – also referred to as electrospun nanofibre aerogels1 – are a fascinating class of ultralight, highly porous and flexible materials. They are fabricated by self-assembly of prebuilt electrospun nanofibre building blocks from a large variety of synthetic polymers or biopolymers and offer great potential as thermal insulators,2–4 in biomedical application,2,3,5–9 in supercapacitors and energy storage devices,7,8,10 and in liquid or air filtration.2,8,11–14 So far, few alternative methods for the preparation of nanofibre sponges such as 3D printing,15,16 self-assembly,15,16 blow spinning,17 or self-agglomeration18 have been reported, while the conventional fabrication method of electrospun nanofibre sponges from prefabricated nanofibre building blocks follows a common principle:19–21 (1) nanofibre mats (NFM) obtained through electrospinning are chopped to single short nanofibres, (2) the fragmented nanofibres are dispersed to obtain a stable suspension, (3) the suspension is poured into a mould, and frozen, a process known as freeze-casting. (4) Through sublimation the frozen dispersion medium is removed, leaving a porous body of free-standing nanofibres. The architecture of the porous body is largely controlled by the freezing conditions such as temperature gradient19,22 or preferred crystal structure of the dispersion medium. For example, lamellar channels are obtained for water, whereas prismatic channels are obtained for t-BuOH.23,24 The time-consuming sublimation pore designing freezing steps is necessary to overcome surface tension of the dispersion medium under evaporative drying conditions. Surface tensions causes irreversible shrinkage which prevents the formation of a porous body with a large specific surface area.25,26 Alternatively, the surface tension of the dispersion medium can be overcome by a phase transition from the liquid into the supercritical state. Supercritical drying – also known as critical point drying (CPD) – is a widely applied and effective method for the synthesis of classical silica aerogels.27,28 For aerogels, the principle is to exchange the gelation solvent with liquid CO2. By isochoric heating, the liquid CO2 is brought into its supercritical state and then released to obtain the dry aerogel.25,29,30 CPD was also successfully used for the synthesis of porous structures from nanofibrillated cellulose (NFC),31,32 bacterial cellulose (BC),33 chitin nanocrystals (ChNC),16 or graphene sheets.30 However, CPD drying has never been used for the preparation of sponges from electrospun nanofibers which differ in their generally larger dimension (100–500 nm fibre diameter instead of 5–100 nm). CPD may also generate sponges with another pore architecture than the currently employed freeze-drying approach resulting in cellular pores imprinted through the freezing crystals of the dispersion medium. The pore structure could be decisive for the macroscopic properties of the sponges, in particular for their filtration efficiency.13Here, we report for the first time the preparation of nanofibre sponges using CPD, reducing the 48-h drying step in freeze-drying to approx. 1 h (i.e. twelve exchange 4.5 min cycles). Fig. 1 shows the main aspects in the preparation of nanofibre sponges by CPD or freeze-drying. Detailed analysis revealed the inherent differences of the microscopic architecture of nanofibre sponges prepared by either freeze-drying or CPD. These differences have also macroscopic implications such as reduced elastic moduli, lower permeability, but a different filtration behaviour with higher efficiency.
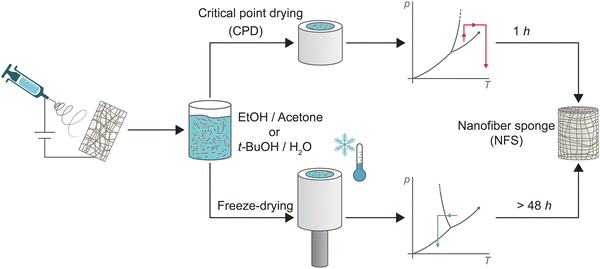 | ||
| Fig. 1 Schematic representation of the preparation of nanofibre sponges (NFS) from electrospun nanofibres through conventional freeze-drying, bottom, rapid critical point drying (CPD), top. | ||
Experimental
Materials
PA6 (Ultramid B24 N 03) was purchased from Elmarco Ltd, Czech Republic. Ethanol (96% puriss p.a. ACS), acetone (≥99.5%, ACS) and acetic acid (≥99.7%, ACS) were purchased from Sigma Aldrich GmbH, Germany. Formic acid (97%) and t-BuOH (99%) were supplied by abcr GmbH, Germany. Liquid CO2 (≥99.995%) was purchased from PanGas AG, Switzerland. All chemicals were used as received without further purification.Electrospinning
PA6 pellets were stirred in a mixture of acetic and formic acid (2![[thin space (1/6-em)]](https://www.rsc.org/images/entities/char_2009.gif) :
:![[thin space (1/6-em)]](https://www.rsc.org/images/entities/char_2009.gif) 1 w/w) for 12 h to obtain a solution with a PA6 mass fraction of 12% w/w. The nanofibres were synthesized by free surface electrospinning with a Nanospider™ NS LAB 500 from Elmarco. A wire electrode (d = 0.2 mm, electrode rotation = 5 rpm) was used, and the applied voltage was 65 kV ± 5 kV. The distance between the grounded collector and the electrode was 17 cm and the lateral velocity of the siliconized baking paper substrate was 10 mm min−1. Ambient conditions were 25 °C ± 3 °C and 35 ± 5% RH.
1 w/w) for 12 h to obtain a solution with a PA6 mass fraction of 12% w/w. The nanofibres were synthesized by free surface electrospinning with a Nanospider™ NS LAB 500 from Elmarco. A wire electrode (d = 0.2 mm, electrode rotation = 5 rpm) was used, and the applied voltage was 65 kV ± 5 kV. The distance between the grounded collector and the electrode was 17 cm and the lateral velocity of the siliconized baking paper substrate was 10 mm min−1. Ambient conditions were 25 °C ± 3 °C and 35 ± 5% RH.
Preparation of NFS
The electrospun nanofibre mats (NFM) were cut into approximately 1 × 1 cm2 pieces and suspended in t-BuOH/water 20% w/w to obtain a mass concentration of γ = 10 mg mL−1. The suspended NFMs were crushed 12 times for 10 s using a B-400 mixer (Büchi Labortechnik AG, Switzerland) and then homogenized with a T 25 digital ULTRA-TURRAX® disperser (IKA®-Werke GmbH & Co. KG, Germany) for 15 min at 13![[thin space (1/6-em)]](https://www.rsc.org/images/entities/char_2009.gif) 000 rpm to obtain a dispersion of short nanofibres. To produce CPD sponges the short nanofibres were separated by filtration and redispersed in a EtOH/acetone mixture 1
000 rpm to obtain a dispersion of short nanofibres. To produce CPD sponges the short nanofibres were separated by filtration and redispersed in a EtOH/acetone mixture 1![[thin space (1/6-em)]](https://www.rsc.org/images/entities/char_2009.gif) :
:![[thin space (1/6-em)]](https://www.rsc.org/images/entities/char_2009.gif) 1 w/w at a mass concentration of γ = 10 mg mL−1. The CPD step was performed with an EM CPD300 critical point dryer (Leica Microsystem, Germany) using specially adapted moulds (ESI,† Fig. S1). For freeze-dried samples, the slurries were poured in a mild and frozen directionally at −20 °C. The dispersion medium was sublimated using a CHRIST Alpha 3–4 LSC basic freeze-dryer (Martin Christ Gefriertrocknungsanlagen GmbH, Germany) at a pressure of <1 mbar for at least 48 h. CPD and freeze-dried sponges were finally crosslinked at 205 °C for 1.5 h.
1 w/w at a mass concentration of γ = 10 mg mL−1. The CPD step was performed with an EM CPD300 critical point dryer (Leica Microsystem, Germany) using specially adapted moulds (ESI,† Fig. S1). For freeze-dried samples, the slurries were poured in a mild and frozen directionally at −20 °C. The dispersion medium was sublimated using a CHRIST Alpha 3–4 LSC basic freeze-dryer (Martin Christ Gefriertrocknungsanlagen GmbH, Germany) at a pressure of <1 mbar for at least 48 h. CPD and freeze-dried sponges were finally crosslinked at 205 °C for 1.5 h.
Scanning electron microscope
Structural characterization of the fibres and sponges was performed using a FEI Quanta FEG 250 scanning electron microscope (Thermo Fisher Scientific Inc., USA) with an acceleration voltage of 5 kV in the secondary electron mode and high vacuum. The samples were gold coated with a Q150 R-S sputter coating system (Quorum Technologies Ltd, UK). Fibre diameter and length were determined from at least 100 individual fibres using the open source software ImageJ.34Differential scanning calorimetry
Differential scanning calorimetry (DSC, Mettler Toledo, Switzerland) characterization was done under nitrogen with a flow rate of 60 ml min−1 while the furnace temperature was kept at 27 °C for 30 min and then increased to 280 °C (heating rate of 10 °C min−1).Infrared spectroscopy
Attenuated total reflection infrared spectroscopy (ATR-IR) was performed on a PerkinElmer Spectrum Frontier spectrometer. Spectra were recorded between 600 and 4000 cm−1 with a resolution of 4 cm−1 and 16 accumulations.Thermal analysis
Thermogravimetric analysis was performed using a TGA 1 STAR (Mettler Toledo Inc., Switzerland). Samples were heated from 25 °C to 500 °C at a rate of 10 °C min−1.Air permeability
Air permeability was measured based on ISO 7231:2023 using an FX 3300 LabAir IV air permeability tester (TEXTest AG, Switzerland) with a differential pressure between 1250 and 2500 Pa. For sealing, nanofibre sponges were radially compressed to a diameter of 16.3 mm (n ≥ 7), see ESI,† Fig. S2.Compression test
The compressibility of the nanofibre sponges was measured using a TA.XTplus texture analyser (Stable Micro System, UK) calibrated at 50 N and equipped with a cylindrical 35 mm diameter probe. The compression speed was 1 mm s−1, the samples were compressed 500 times with 70% compressive stress. The effective moduli were calculated using the compressive stress values between 50 and 60%.Filtration
The filtration was performed using the setup described in the ESI† (Fig. S3). The hydrostatic pressure on the sponge was constant at ≈5 kPa. Turbidity was measured using an Eutech TN-100 turbidimeter (Thermo Fisher Scientific Inc., USA). For filtration, suspensions of either γ = 1 g L−1 microplastics (polystyrene-co-divinylbenzene microparticles) or γ = 10 g L−1 Arizona Test Dust (ISO 12103-1, A2 ATD, 68–76% silica) were used. The volumetric particle size distribution of microplastics and Arizona Test Dust were measured by dynamic light scattering using a Mastersizer hydro 2000MS (Malvern Panalytical, UK). Poly(sodium 4-styrenesulfonate) (Sigma-Aldrich, Germany), was added to stabilize the colloidal suspension. The suspensions were sonicated for 30 s before each measurement. Each sample was analysed 6 times with stirring at 2000 rpm, and results are given as volume-weighted mean.Results and discussion
Preparation of PA6 nanofibre sponges
Recently, PA6 nanofibre sponges were prepared by free surface electrospinning and freeze-drying.35 In this work we used the same method to prepare electrospun PA6 nanofibres. The NFMs were free of defects and beads and had an average diameter of 174.3 ± 79.1 nm (n = 255), Fig. 2a. This agrees well with values reported by Mousavi et al. (175 ± 49 nm) and Aulova et al. (183 ± 47 nm).35,36 Then, we suspended the NFMs in t-BuOH/H2O 20% w/w, cut, and homogenized them, to obtain a suspension of short nanofibres with a length of 60.1 ± 19.6 μm (n = 117). The short nanofibres in the suspension were clearly separated as confirmed by SEM analysis from dried samples, Fig. 2b, and intertwined fibres were rarely observed (ESI,† Fig. S4).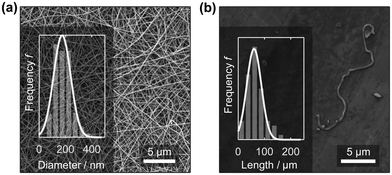 | ||
| Fig. 2 PA6 nanofibre mat (NFM) after electrospinning with a mean nanofibre diameter of 174.3 ± 79.1 nm (a). The length of the short, suspended nanofibres was 60.1 ± 19.6 μm (b). | ||
Before the CPD process, Fig. 1, the t-BuOH/H2O dispersion medium of the short nanofibre dispersion was exchanged by filtration and redispersion in EtOH/acetone 1![[thin space (1/6-em)]](https://www.rsc.org/images/entities/char_2009.gif) :
:![[thin space (1/6-em)]](https://www.rsc.org/images/entities/char_2009.gif) 1. Then the EtOH/acetone slurry was poured in a customized mould (d = 3.0 cm, h = 2.1 cm, see ESI,† Fig. S1) and critically point dried. We optimized the relevant parameters of the drying process, namely delay, liquid CO2 entry rate, exchange rate, numbers of exchange cycles, heating rate and CO2 release rate, in terms of processing time and drying quality.
1. Then the EtOH/acetone slurry was poured in a customized mould (d = 3.0 cm, h = 2.1 cm, see ESI,† Fig. S1) and critically point dried. We optimized the relevant parameters of the drying process, namely delay, liquid CO2 entry rate, exchange rate, numbers of exchange cycles, heating rate and CO2 release rate, in terms of processing time and drying quality.
When drying and exchange rate were too high, the sponges remained wet because the liquid CO2 did not have enough time for complete exchange with the EtOH/acetone phase. This induced a breakdown of the porous three-dimensional structure of the sponges. The best conditions for a 1-h drying process were twelve 4.5 min exchange cycles of 1/12 filling volume with respect to the volume of the mould (4 min) and a 1/12 removal volume (30 s), while the chamber was kept at 10 °C. After twelve exchange cycles, the liquid CO2 was heated up to 35 °C at a rate of 3 °C min−1 to bring the liquid CO2 in its supercritical state. The scCO2 was released at a rate of 0.15 bar s−1 and the CPD sponge green body was obtained. The CO2 entry rate and the heating rate did not affect the structure of the sponge. The CO2 exchange rate, on the other hand, affected the structure of the sponge because of the instrumentation design: the inlet sitting on the top of the chamber and the outlet sitting at the bottom, which induced vertical CO2 flux drawing the dispersed nanofibres toward the bottom of the chamber. Similarly, the CO2 release rate determined the structure of the nanofibre sponge: as PA6 nanofibres tended to float on liquid CO2 a too slow release provided more time to the fibres to concentrate on the top of the chamber reducing the height of the final sponges.
Another critical processing parameter was the choice of the liquid phase of the dispersion. On the one hand, the liquid should stabilize the nanofibre suspension and prevent aggregation. On the other hand, the liquid must be miscible with liquid CO2. Therefore, H2O is not suited for CPD. Suited dispersion media are ethanol and acetone. Acetone would be the better choice in terms of CO2 miscibility,37,38 however pure acetone suspensions showed a high tendency for nanofibre agglomeration. The addition of ethanol stabilized the suspension and reduced the degree of agglomeration. Fibre agglomeration is also critical when preparing NFS through conventional freeze-drying and often solved by adding alcohols such as t-BuOH to the aqueous20 to reduce surface tensions39 and thus improve the wettability of the fibres.
For the conventional freeze-drying process, the t-BuOH/H2O slurry was poured as such into a mould, frozen at −20 °C, and freeze-dried for 48 h to obtain the freeze-dried green body as previously described.35
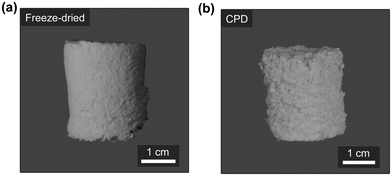
Subsequently, both the CPD-processed and the freeze-dried nanofibre sponge green bodies were thermally annealed at 205 °C for 1.5 h to obtain the final crosslinked and mechanically stable nanofibre sponges (Fig. 3a and b).
As mentioned earlier, the nanofibres were slightly pulled toward the bottom of the mould by the vertical CO2 flow in the liquid phase exchange process during CPD. This resulted in a lower volume and consequently a higher bulk density. In fact, the CPD-processed nanofibre sponges had a bulk density of 23.7 ± 1.3 mg cm−3 with a porosity of 97.8 ± 0.1% (n = 11), while the conventionally freeze-dried nanofibre sponges had a bulk density of 18.6 ± 0.6 mg cm−3 with a porosity of 98.3 ± 0.1% (n = 12).
Thermal annealing at a temperature close to the melting point of PA6 is a physical crosslinking method aiming to tightly bind the nanofibre junctions rendering the mechanically stable crosslinked sponge.35 Thermal annealing induced subtle rearrangements of the polymer chains within the fibres and at the fibre junctions while the overall fibre network remained intact. This rearrangement of polymer fibres was also observed when comparing the DSC curves of the green bodies and crosslinked sponges, Fig. 4a and b. While both, the freeze-dried and the CPD green bodies showed a single melting peak at 225 °C with a lower temperature shoulder, two peaks at 212 °C and 224 °C were observed for the crosslinked samples which illustrated the morphological changes induced by thermal annealing. Such an effect of annealing on PA6 DSC curves is well known.40–42 Position and intensity of the first peak vary significantly with annealing time and temperature but also DSC heating rate.40,41 While the main peak at 224 °C is associated with the melting of PA6 α-crystals, the peak at 212 °C is interpreted as melting of small amounts of γ-crystals42 or of microcrystals formed in the amorphous regions during annealing.43 The DCS curves of the green bodies were identical with those of the as electrospun fibres including the endothermic α-relaxation peak44 between 63 °C and 70 °C, which is missing in DSC curves of PA6 pellets (ESI,† Fig. S5). Morphological transitions upon thermal annealing were also observed by IR, Fig. 4c to f and ESI,† Fig. S6: a decrease of characteristic amorphous vibrations at 1170 and 987 cm−1 and increased vibrations at 1200, 1030, 959, and 930 cm−1, which are associated with α-crystals.45,46 Based on the IR spectra, no conclusions can be drawn about the presence of minor amounts of γ-crystals after the annealing process, but the formation of γ-crystals through annealing was reported based on X-ray diffraction data.41–43,47
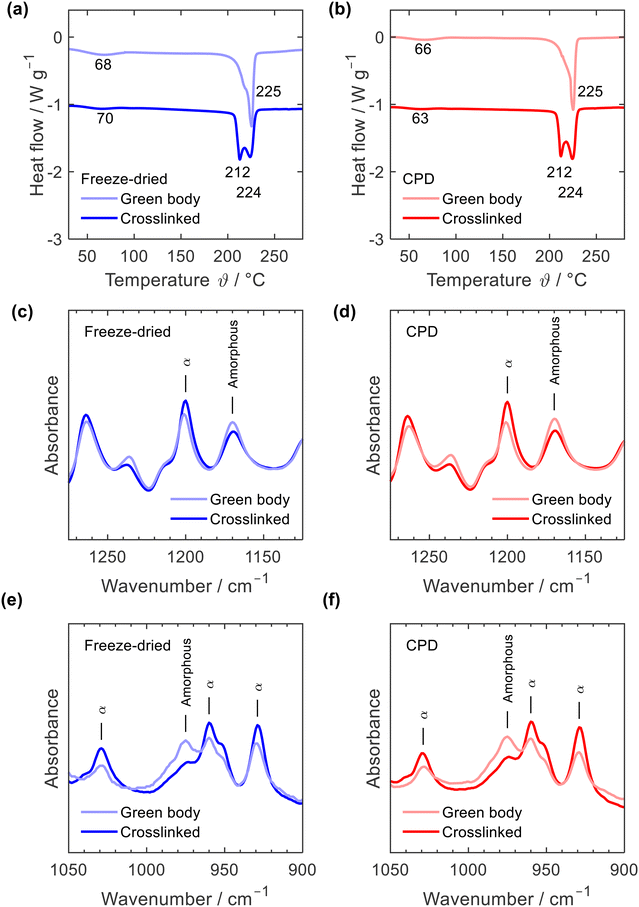 | ||
| Fig. 4 DSC curves (a) and (b) and IR spectra (c)–(f) of freeze-dried (blue) and CPD processed nanofibre sponges (red) before (green body) and after thermal annealing (crosslinked). | ||
DSC curves and IR spectra clearly reveal that both processing strategies for nanofibre sponges – freeze-drying or CPD – involve the same morphological transitions of the electrospun PA6 nanofibres providing materials with identical polymer morphology. Moreover, the PA6 nanofibre sponges are free of any other components as demonstrated by their identical TGA thermograms (ESI,† Fig. S7).
Sponge structure
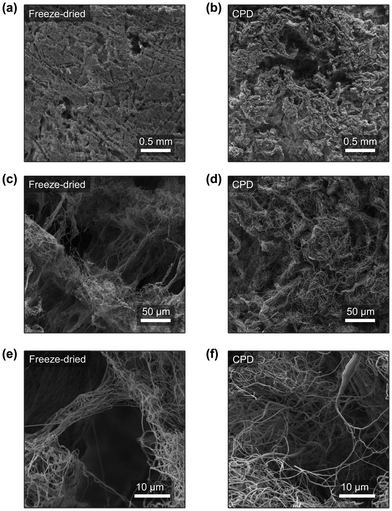
The characterization of the structure of the nanofibre sponges was performed by SEM. Fig. 5a–f show their horizontal cross sections. The pore structure of freeze-dried and CPD-processed sponges is clearly different. As discussed previously,19,22 freezing front velocity and fibre density affect pore structure and porosity. In sponges prepared by sublimation and frozen at −20 °C, a high number of directional pores and a distinct cellular structure are observed. Two types of pores are found: on the one hand, long pores with a lamellar structure as imprints of frozen water and, on the other hand, prismatic channels, due to the freezing of t-BuOH.23,24,48 The lamellar structures seen in Fig. 5a are due to slow crystals growth at −20 °C, which allows fibre displacement and the formation of larger ice crystals.23,49 Similar structures were observed in the preparation of porous ceramics using 20% t-BuOH in water as freezing medium with to the formation of snowflakes crystals,50 as the t-BuOH concentration was close to the eutectic composition (22.5% t-BuOH).51 In addition, a slow freezing front is known to produce lamellar or cellular structures rather than dense materials.23 The translamellar bridges of perpendicular fibres found in Fig. 5c and e were previously described by Deville in porous ceramic structures prepared by ice templating and are due to overgrowing surface ridges crossing the space between adjacent crystals.52 In contrast, neither cellular structures nor ordered pores or translamellar bridges are observed in the sponge produced by CPD (Fig. 5b, d and f). In a conventional aerogel, which is produced by the sol–gel method, the pore structure is determined by the structure of the gel. Thus, the material used, the solvent in which the gel is formed, and the dispersion medium used for drying by scCO2 play an important role in the formation of the pores.53–55 In the case of nanofibres, the pore structure is determined by the random arrangement of the short individual nanofibres in the scCO2 suspension. We aimed for completely dispersed fibres (ESI,† Fig. S4) without floc formation through the choice of dispersion medium. Depending on the surface energy and wettability of the fibres, we observed aggregation of the dispersed nanofibres. Floc formation and the density of the dispersion medium have an effect on nanofibre sedimentation, which affects bulk density and thus the porosity of the nanofibre sponge.Compression tests
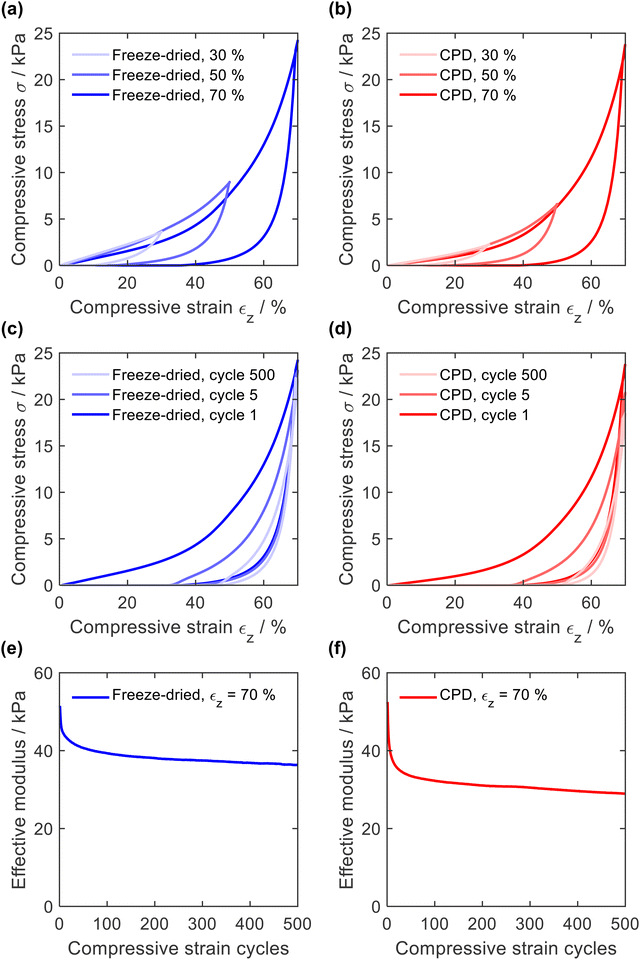
The resistance to mechanical stress and the elastic behaviour of the sponges were evaluated by compression tests in which the sponges were compressed 500 times with a longitudinal compressive strain (εz) of 30, 50, and 70%. In general, quasi-static stress–strain curves of open-cellular foams exhibit either two (linearly elastic and densification) or three (linearly elastic, plateau, and densification) distinctive regions.20,56–58 In the case of PA6 sponges (Fig. 6a for CPD sponge and Fig. 6b for freeze-dried sponges), two regions were identified from the σ-ε curve: a linearly elastic region (εz < 40%) due to porosity and cell compression, and a densification region (εz > 40%)59 where the curve increased exponentially. The absence of a plateau at high strain values confirms the absence of plastic deformation.With increasing compression, the hysteresis of decompression became more pronounced, caused by increasing deformation of smaller features, as demonstrated for PAN/BA-SiO2 based sponges.20 This behaviour was also observed with increasing number of compression cycles (Fig. 6c and d). After several cycles, the decompression curve finally reached the onset of the compression path and hysteresis remained constant. The elastic moduli were calculated for each cycle using the points between εz = 50% and εz = 60%, Fig. 6e and f. For the first compression cycle, the freeze-dried and CPD sponge behaved similarly regardless of whether they were compressed with a strain of εz = 30%, εz = 50%, or εz = 70%. The effective moduli of 51.5 kPa and 52.5 kPa were also nearly identical and within in a range typical for open-cell foams.58,60 However, differences were observed with increasing number of cycles. After only five compression cycles, the maximum compressive stress as well as the elastic modulus of the CPD sponge were more reduced than those for the sponge prepared by freeze-drying (40.9 kPa and 45.4 kPa). This can be explained by the cellular nature of sponges prepared by freeze-drying, which are gradually compacted until they are densely packed before the network of smaller pores is compressed and which is mainly responsible for plastic deformation.20 Since sponges produced by CPD have randomly oriented fibres without cellular pores, the compression of the network of smaller pores and plastic deformation are more pronounced.
Permeability
The microscopic structure of the nanofibre sponges, especially their pore architecture, should also be reflected in macroscopic properties such as air permeability. Therefore, we measured the axial airflow in terms of face velocity as a function of the applied differential pressure Δp. Sealing was achieved by radial compression of the cylindrical sponges to a diameter of approx. 16.3 mm (εr = 30%), see ESI,† Fig. S2. To account for the different height of the nanofibre sponges, which averaged 26.3 mm for freeze-dried and 24.5 mm for CPD sponges, the face velocities in Fig. 7 were normalized to a sample height of 25.4 mm.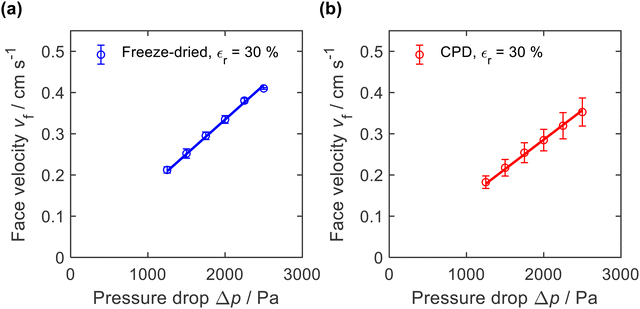 | ||
| Fig. 7 Air permeability of (a) freeze-dried (−20 °C) and (b) CPD-processed nanofibre sponges measured with a radial compression εr = 30% and normalized to a height of 25.4 mm. | ||
The freeze-dried sponges exhibited a lower air resistance than the CPD-processed sponges. This is also reflected in their permeability k, which was calculated using the Hagen–Poiseuille equation for compressible fluids.61 For the freeze-dried sponges we found k = 0.79 ± 0.10 × 10⁻¹² m2 and for the CPD sponges k = 0.67 ± 0.13 × 10⁻¹² m2. These values were an order of magnitude lower than reported for PVA/pullulan-based nanofibre sponges,13,19 but were in the same range as those reported by Seuba et al. for ice templated ceramics.62 The higher permeability of the freeze-dried sponge can be explained by its lamellar structure and long pores that facilitate air flow. However, there are other factors such as orientation and frequency of the pores and the permeability of the remaining volume of the freeze-dried sponge that are also relevant for the observed permeability.
Filtration
Due to their high porosity and their tuneable pore architecture, one of the most important applications of nanofibre sponges is filtration, either from liquid or from gas.13,15,20,22,35,63 Here, we studied filtration efficiency for suspended particles under hydrostatic condition with a constant hydrostatic pressure of ≈5 kPa. The constant pressure was provided by a filtration setup with a constant liquid level (ESI,† Fig. S3). Filtration was performed using a microplastics suspension (particle size of 4.9 ± 1.1 μm, narrow particles size distribution, ESI,† Fig. S8) with a mass concentration of γ = 1.0 g L−1 and an Arizona Test Dust suspension (particle size 8.1 ± 4.6 μm, broad particles size distribution, ESI,† Fig. S8) with a mass concentration of γ = 10 g L−1. Prior to each measurement, water was passed through the sponges to condition the fibres and perform a blank filtration.Fig. 8 shows the filtrate volume per unit area of the sponge in relation to the filtration time. The correlation is linear in case of water, but for suspensions causing clogging, the filtrate flux decreases with time. In addition, the water permeability of the freeze-dried sponge was higher than that for the CPD sponge. This is consistent with the air permeability measurements, which showed a higher permeability for the freeze-dried sponge. When filtering microplastics or Arizona Test Dust suspensions, the observed flow rate was identical to the water flow at the beginning of filtration but decreased significantly with increasing filtration time.
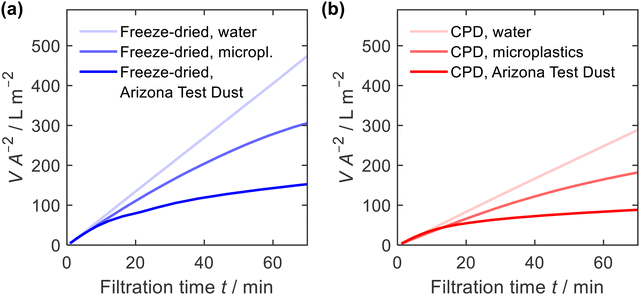 | ||
| Fig. 8 Filtrate volume V, per unit area of sponge A, and filtration time t, for water, microplastics and Arizona Test Dust suspensions; (a) freeze-dried and (b) CPD-processed sponge. | ||
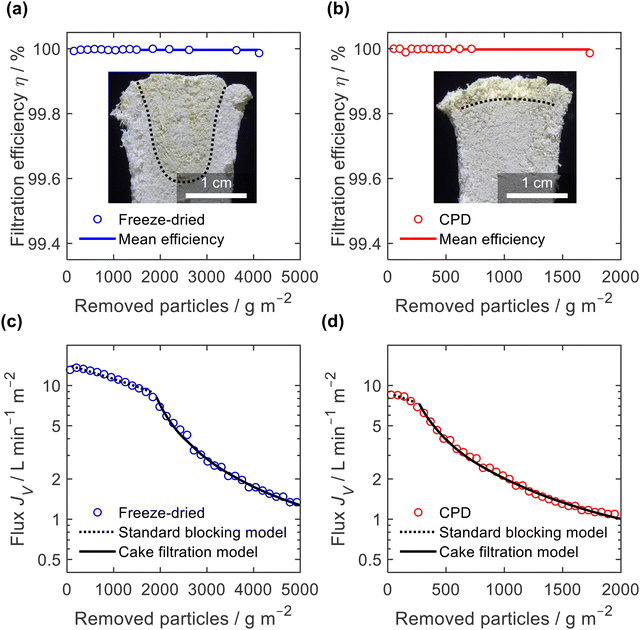
The filtration efficiency η (Fig. 9a and b) was determined by turbidity measurement and we found values of η = 99.996 ± 0.003% and η = 99.998 ± 0.005% for the freeze-dried and the CPD-processed sponge, respectively. While this difference is small in terms of efficiency, it becomes important when considering the remaining microplastics in the filtrate. This was twice as clean for the CPD-processed sponge (0.002% remaining microplastics) as for the freeze-dried sponge (0.004%). The insets in Fig. 9a and b show the penetration of the filtered microplastics at the endpoint of filtration. While the microplastics penetrated up to 2 cm into the freeze-dried sponge, the penetration was lower for the CPD sponge. Penetration into the freeze-dried sponge was limited to the centre of the cylindrical sponge, while the edge remained free of particles. This can be explained by the radial compression of εr = 30% that was necessary to seal the rim and thereby close the pores near the rim. In both cases, there was a filter cake on the sponges.
To better understand the mechanism of filtration and blockage, the filtrate flux JV was plotted against the mass of particles removed (Fig. 9c and d), also corresponding to the filtrate volume by mass concentration of the suspended particles and filtration efficiency. The sponges had an initial volumetric flux JV = 13 L min−1 m−2 for the freeze-dried sponge and JV = 8.5 L min−1 m−2 for the CPD sponge, which is comparable to commercial membrane filters35 but approximately four times smaller than the PA6 nanofibre sponges optimized for clarification of yeast cell suspensions.35 The initial drop in volumetric flux was linear up to 1690 g m−2 microplastics removed, followed by an exponential drop (Fig. 9c). In case of the CPD-processed sponge, the behaviour was similar, but with a shorter linear phase of 200 g m−2. Regarding the mechanism of pore blocking, a linear decrease in flux can be explained by standard blocking (= particle deposition on the inner walls of the filter media), while the exponential decay would indicate the formation of a filter cake. To confirm the nature of pore blocking mechanism, we fitted the experimental data using the filter blocking model proposed by Hermia,64eqn (1), and linearized as described by Mousavi and Konieczny.35,65
 | (1) |
A similar filtration behaviour was observed for the filtration of the Arizona Test Dust suspension with its larger particles and a wider size span, (ESI,† Fig. S9). Filtration efficiency against Arizona Test Dust was lower than against microplastics, but still high with η = 99.6 ± 0.2% for the freeze-dried sponge and η = 99.89 ± 0.08% for the CPD-processed sponge. Again, when considering the remaining dust load in the filtrate, the CPD-processed sponge is almost four times more effective (0.11%) than the freeze-dried sponge (0.4%). Interestingly, the filtration efficiency of the freeze-dried sponge was particularly low (η = 99.4%) during the standard blocking phase, while it increased to η = 99.8% during cake filtration. Overall, the filtration tests confirm the exciting potential of nanofibre sponges as filters. Filtration applications are not limited to microplastics,11 since NFS filters show already better performance than commercial solutions such as nanofibre sheet filters in aerosol filtration (99.998% over 98.55% efficiency)13 or depth filtration sheets used in beverage filtration (10 fold flux at equal efficiency).35 The CPD instead of the freeze-drying process is an important step forward since manufacturing time of NFS is reduced while their filtration efficiency is further increased.
Conclusion
Research interest for electrospun nanofibre sponges has increased in recent years due to their wide range of applications such as filtration, thermal insulation, tissue engineering, or drug delivery. There are many materials with excellent properties that are unfortunately difficult to produce on a large scale due to lack of scalability or prohibitive cost. For this reason, the development of alternative production techniques is an important success factor for the commercial breakthrough of these materials. Here, we produced highly porous nanofibre sponges using a technique currently used for the preparation of classical silica aerogels: critical point drying reduced the processing time of the drying step to 1 h, compared to about 48 h required for conventional freeze-drying. Both techniques allowed the preparation of PA6 nanofibre sponges with similar macroscopic properties such as high porosity (about 98%), low bulk density (about 20 mg cm−3), effective moduli (about 52 kPa), but their microscopic architecture was completely different. While the freezing step induced the formation of oriented lamellar and prismatic pores, the CPD-processed sponges showed anisotropic pores determined by the random arrangement of the short individual nanofibres in the suspension. These microscopic differences led to different macroscopic properties such as air permeability and in particularly filtration behaviour, with standard blocking dominating in the freeze-dried sponges, while cake filtration was already observed in the CPD sponges at the early stage of filtration. Filtration efficiency was in favour of the CPD-processed sponges. Values of η = 99.4% to η = 99.998% for each type of investigated PA6 nanofibre sponge and each type of suspension confirm the exciting potential of nanofibre sponges as filters.Depending on the desired application, nanofibre sponges can be processed either by conventional freeze-drying or by the rapid CPD process. Since the CPD process is scalable and supercritical CO2 is widely used in industry, CPD could become the method of choice for large-scale production of porous nanofibre-based materials.
Author contributions
Gioele Mol: conceptualization, methodology, investigation, writing – original draft, visualization. Christina Fialová: methodology, validation, investigation. Christian Adlhart: conceptualization, formal analysis, writing – review & editing, visualization, supervision, funding acquisition.Conflicts of interest
There are no conflicts to declare.Acknowledgements
Open access funding provided by ZHAW Zurich University of Applied Sciences.References
- S. Jiang, G. Duan, U. Kuhn, M. Mörl, V. Altstädt, A. L. Yarin and A. Greiner, Angew. Chem., Int. Ed., 2017, 56, 3285–3288 CrossRef CAS PubMed.
- M. Dilamian, M. Joghataei, Z. Ashrafi, C. Bohr, S. Mathur and H. Maleki, Appl. Mater. Today, 2021, 22, 100964 CrossRef.
- T. Xu, Y. Ding, Z. Liang, H. Sun, F. Zheng, Z. Zhu, Y. Zhao and H. Fong, Prog. Mater. Sci., 2020, 112, 100656 CrossRef CAS.
- S. Zhao, O. Emery, A. Wohlhauser, M. M. Koebel, C. Adlhart and W. J. Malfait, Mater. Des., 2018, 160, 294–302 CrossRef CAS.
- M. Merk, O. Chirikian and C. Adlhart, Materials, 2021, 14, 2006 CrossRef CAS PubMed.
- L. Weidenbacher, E. Müller, A. G. Guex, M. Zündel, P. Schweizer, V. Marina, C. Adlhart, L. Vejsadová, R. Pauer, E. Spiecker, K. Maniura-Weber, S. J. Ferguson, R. M. Rossi, M. Rottmar and G. Fortunato, ACS Appl. Mater. Interfaces, 2019, 11, 5740–5751 CrossRef CAS PubMed.
- N. Awang, A. M. Nasir, M. A. M. Yajid and J. Jaafar, J. Environ. Chem. Eng., 2021, 9, 105437 CrossRef CAS.
- E. Barrios, D. Fox, Y. Y. Li Sip, R. Catarata, J. E. Calderon, N. Azim, S. Afrin, Z. Zhang and L. Zhai, Polymers, 2019, 11, 726 CrossRef CAS PubMed.
- C. Xu, J. Y. Cheong, X. Mo, V. Jérôme, R. Freitag, S. Agarwal, R. Gharibi and A. Greiner, Macromol. Biosci., 2023, 2300143 CrossRef CAS PubMed.
- W. Xia, C. Qu, Z. Liang, B. Zhao, S. Dai, B. Qiu, Y. Jiao, Q. Zhang, X. Huang, W. Guo, D. Dang, R. Zou, D. Xia, Q. Xu and M. Liu, Nano Lett., 2017, 17, 2788–2795 CrossRef CAS PubMed.
- P. Risch and C. Adlhart, ACS Appl. Polym. Mater., 2021, 3, 4685–4694 CrossRef CAS.
- F. Deuber, S. Mousavi, L. Federer and C. Adlhart, Adv. Mater. Interfaces, 2017, 4, 1700065 CrossRef.
- F. Deuber, S. Mousavi, L. Federer, M. Hofer and C. Adlhart, ACS Appl. Mater. Interfaces, 2018, 10, 9069–9076 CrossRef CAS PubMed.
- S. Mousavi, F. Deuber, S. Petrozzi, L. Federer, M. Aliabadi, F. Shahraki and C. Adlhart, Colloids Surf., A, 2018, 547, 117–125 CrossRef CAS.
- S. Jiang, S. Agarwal and A. Greiner, Angew. Chem., Int. Ed., 2017, 56, 15520–15538 CrossRef CAS PubMed.
- Z. Qian, Z. Wang, N. Zhao and J. Xu, Macromol. Rapid Commun., 2018, 39, 1700724 CrossRef PubMed.
- J. Song, Z. Li and H. Wu, ACS Appl. Mater. Interfaces, 2020, 12, 33447–33464 CrossRef CAS PubMed.
- T. Xu, J. M. Miszuk, Y. Zhao, H. Sun and H. Fong, Adv. Healthcare Mater., 2015, 4, 2238–2246 CrossRef CAS PubMed.
- F. Deuber and C. Adlhart, Chimia, 2017, 71, 236 CrossRef CAS PubMed.
- Y. Si, J. Yu, X. Tang, J. Ge and B. Ding, Nat. Commun., 2014, 5, 5802 CrossRef PubMed.
- G. Duan, S. Jiang, V. Jérôme, J. H. Wendorff, A. Fathi, J. Uhm, V. Altstädt, M. Herling, J. Breu, R. Freitag, S. Agarwal and A. Greiner, Adv. Funct. Mater., 2015, 25, 2850–2856 CrossRef CAS.
- F. Deuber, S. Mousavi, M. Hofer and C. Adlhart, ChemistrySelect, 2016, 1, 5595–5598 CrossRef CAS.
- S. Deville, Adv. Eng. Mater., 2008, 10, 155–169 CrossRef CAS.
- M.-A. Shahbazi, M. Ghalkhani and H. Maleki, Adv. Eng. Mater., 2020, 22, 2000033 CrossRef CAS.
- A. Soleimani Dorcheh and M. H. Abbasi, J. Mater. Process. Technol., 2008, 199, 10–26 CrossRef CAS.
- V. D. Land, T. M. Harris and D. C. Teeters, J. Non-Cryst. Solids, 2001, 283, 11–17 CrossRef CAS.
- Abdullah, Y. Zou, S. Farooq, N. Walayat, H. Zhang, M. Faieta, P. Pittia and Q. Huang, Crit. Rev. Food Sci. Nutr., 2023, 63, 6687–6709 CrossRef CAS PubMed.
- S. Zhao, W. J. Malfait, N. Guerrero-Alburquerque, M. M. Koebel and G. Nyström, Angew. Chem., Int. Ed., 2018, 57, 7580–7608 CrossRef CAS PubMed.
- R. Al-Oweini and H. El-Rassy, J. Mol. Struct., 2009, 919, 140–145 CrossRef CAS.
- X. Zhang, Z. Sui, B. Xu, S. Yue, Y. Luo, W. Zhan and B. Liu, J. Mater. Chem., 2011, 21, 6494–6497 RSC.
- Z. Wang, W. Zhu, R. Huang, Y. Zhang, C. Jia, H. Zhao, W. Chen and Y. Xue, Polymers, 2020, 12, 2583 CrossRef CAS PubMed.
- D. Ciftci, A. Ubeyitogullari, R. R. Huerta, O. N. Ciftci, R. A. Flores and M. D. A. Saldaña, J. Supercrit. Fluids, 2017, 127, 137–145 CrossRef CAS.
- E. Haimer, M. Wendland, K. Schlufter, K. Frankenfeld, P. Miethe, A. Potthast, T. Rosenau and F. Liebner, Macromol. Symp., 2010, 294, 64–74 CrossRef CAS.
- W. S. Rasband, ImageJ U. S. National Institutes of Health, Bethesda, Maryland, USA, 1997 Search PubMed.
- S. Mousavi, L. Filipová, J. Ebert, F. J. Heiligtag, R. Daumke, W. Loser, B. Ledergerber, B. Frank and C. Adlhart, Sep. Purif. Technol., 2022, 284, 120273 CrossRef CAS.
- A. Aulova, M. Bek, L. Kossovich and I. Emri, Stroj. Vestn. – J. Mech. Eng., 2020, 66, 421–430 Search PubMed.
- T. Adrian and G. Maurer, J. Chem. Eng. Data, 1997, 42, 668–672 CrossRef CAS.
- M. Décultot, A. Ledoux, M.-C. Fournier-Salaün and L. Estel, J. Chem. Thermodyn., 2019, 138, 67–77 CrossRef.
- J. Gliński, G. Chavepeyer and J. Platten, J. Chem. Phys., 1995, 102, 2113–2117 CrossRef.
- G. Gurato, A. Fichera, F. Z. Grandi, R. Zannetti and P. Canal, Makromol. Chem., 1974, 175, 953–975 CrossRef CAS.
- V. K.-H. Illers and H. Haberkorn, Makromol. Chem., 1971, 142, 31–67 CrossRef.
- C. Millot, L.-A. Fillot, O. Lame, P. Sotta and R. Seguela, J. Therm. Anal. Calorim., 2015, 122, 307–314 CrossRef CAS.
- X.-Y. Zhao and B.-Z. Zhang, J. Appl. Polym. Sci., 2010, 115, 1688–1694 CrossRef CAS.
- R. Nirmala, R. Navamathavan, M. H. El-Newehy and H. Y. Kim, Polym. Int., 2011, 60, 1475–1480 CrossRef CAS.
- N. Vasanthan, N. S. Murthy and R. G. Bray, Macromolecules, 1998, 31, 8433–8435 CrossRef CAS.
- P. D. Frayer, J. L. Koenig and J. B. Lando, J. Macromol. Sci., Part B: Phys., 1972, 6, 129–149 CrossRef CAS.
- Y. Zhang, Y. Zhang, S. Liu, A. Huang, Z. Chi, J. Xu and J. Economy, J. Appl. Polym. Sci., 2011, 120, 1885–1891 CrossRef CAS.
- M. M. Porter, J. Mckittrick and M. A. Meyers, JOM, 2013, 65, 720–727 CrossRef CAS.
- S. Deville, E. Saiz, R. K. Nalla and A. P. Tomsia, Science, 2006, 311, 515–518 CrossRef CAS PubMed.
- Y. Tang, S. Qiu, C. Wu, Q. Miao and K. Zhao, J. Eur. Ceram. Soc., 2016, 36, 1513–1518 CrossRef CAS.
- B. S. Bhatnagar, J. Sonje, E. Shalaev, S. W. H. Martin, D. L. Teagarden and R. Suryanarayanan, Phys. Chem. Chem. Phys., 2020, 22, 1583–1590 RSC.
- S. Deville, Freezing Colloids: Observations, Principles, Control, and Use: Applications in Materials Science, Life Science, Earth Science, Food Science, and Engineering, Springer International Publishing, Cham, 2017 Search PubMed.
- M. Schwan, S. Nefzger, B. Zoghi, C. Oligschleger and B. Milow, Front. Mater., 2021, 8, 662487 CrossRef.
- İ. Şahin, Y. Özbakır, Z. İnönü, Z. Ulker and C. Erkey, Gels, 2018, 4, 3 CrossRef PubMed.
- K. Kanamori and K. Nakanishi, Chem. Soc. Rev., 2011, 40, 754–770 RSC.
- H. Wang, X. Zhang, N. Wang, Y. Li, X. Feng, Y. Huang, C. Zhao, Z. Liu, M. Fang, G. Ou, H. Gao, X. Li and H. Wu, Sci. Adv., 2017, 3, e1603170 CrossRef PubMed.
- H. Schwarts-Givli and Y. Frostig, Compos. Struct., 2001, 53, 87–106 CrossRef.
- L. J. Gibson and M. F. Ashby, Cellular Solids: Structure and Properties, Cambridge University Press, 2nd edn, 1997 Search PubMed.
- Y. Yang, Y. Liu, Y. Li, B. Deng, B. Yin and M. Yang, J. Mater. Chem. A, 2020, 8, 17257–17265 RSC.
- L. J. Gibson, Mater. Sci. Eng., A, 1989, 110, 1–36 CrossRef.
- M. A. Sanjuán and R. Muñoz-Martialay, Build. Environ., 1997, 32, 51–55 CrossRef.
- J. Seuba, S. Deville, C. Guizard and A. J. Stevenson, Sci. Technol. Adv. Mater., 2016, 17, 313–323 CrossRef CAS PubMed.
- P. Risch and C. Adlhart, Chimia, 2022, 76, 354 CrossRef CAS PubMed.
- J. Hermia, Trans IChemE, 1982, vol. 60, pp. 183–187 Search PubMed.
- K. Konieczny, Desalination, 2002, 143, 123–139 CrossRef CAS.
Footnote |
| † Electronic supplementary information (ESI) available. See DOI: https://doi.org/10.1039/d3ma00781b |
| This journal is © The Royal Society of Chemistry 2024 |

