DOI:
10.1039/D3MA00723E
(Paper)
Mater. Adv., 2024,
5, 1726-1735
Synthesis and characterization of O-PDI for futuristic optoelectronic and rectifier applications†
Received
18th September 2023
, Accepted 29th December 2023
First published on 10th January 2024
Abstract
A non-fullerene organic semiconductor, N,N′-di(cis-9-octadecen-1-yl)perylene-3,4,9,10-tetracarboxylic diimide (O-PDI), was synthesized and characterized for its optoelectronic and rectifier applications. O-PDI, derived from the well-known dye perylene-3,4,9,10-tetracarboxylic dianhydride (PTCDA), was spectroscopically characterized for its structure and optical properties using NMR, Fourier-transform infrared (FT-IR), and MALDI-TOF. UV-Vis absorption and fluorescence spectroscopy techniques were employed to study its photophysical properties. Cyclic voltammograms of O-PDI were investigated, and the HOMO and LUMO energy levels of O-PDI were estimated to be −5.86 and −3.57 eV, respectively. Thermal properties were also studied by thermo-gravimetric analysis (TGA). Electrochemical analysis was performed to study its redox behaviour, and the lowest unoccupied molecular orbital and highest occupied molecular orbital energy levels were calculated. The electrical properties of the Al/P-C-Si/O-PDI/Ag device were investigated. The device's dark current–voltage (I–V) characteristics were measured at room temperature. Rectifying behaviour was observed in the device at room temperature with a rectification ratio of ∼3470@ ± 2 V. The device parameters, including the ideality factor, barrier height, series, and shunt resistances, were extracted using the conventional I–V characterization method. The parameters, such as cut-off voltage (∼0.79 V), reverse saturation current (I0) (∼2.59 nA cm−2), barrier height (ϕb) (∼0.89 eV), ideality factor (n) (∼2.55), shunt resistance (Rsh) (∼24.21 MΩ), and series resistance (Rs) (∼2823 Ω), were determined at room temperature.
1. Introduction
Over the past few decades, organic semiconductors, widely acknowledged as essential electronic components, have undergone thorough investigation driven both by market demands and the potential for advancements. This exploration has led to the creation of various applications, such as organic light-emitting diodes (OLEDs), organic solar cells (OSCs), and organic field effect transistors (OFETs).1–3 Organic semiconductors are categorized into two types: p-type and n-type. Comparatively, there are fewer n-type materials than the p-type, focusing predominantly on fullerene and non-fullerene-based materials. Fullerenes have certain drawbacks, including a rigid bandgap, limited chemical reactivity, and elevated costs, thereby impacting their practical application. Consequently, there has been a shift towards non-fullerene materials (NFMs). Among the array of NFMs, perylene and its derivatives have garnered significant attention due to their noteworthy properties, encompassing high molar absorptivity, adjustable absorption ranges, elevated quantum yields of fluorescence, robust electron affinity, and impressive photochemical and thermal stabilities.4–6
Perylene diimides (PDIs) exhibit promising properties such as strong molar absorptivity in the range of ∼400–450 nm (B band) and ∼500–700 nm (Q band) due to their extended conjugated π systems.7,8 The properties of PDIs have been tuned by modifying the substituents at the imide nitrogen and bay positions of the perylene core.9,10 Researchers have reported various types of amine substitutions at the imide position to enhance solubility and morphology, such as the long aliphatic chain shown in Fig. 1. For instance, 1-dodecyl amine helps enhance solubility, leading to 1D nanofiber formation. However, due to the 1D structure, there is significant π–π stacking between them.11N-(3-Aminopropyl) imidazole reduces crystallinity and aggregation but improves charge transport.12 The small secondary amine 2,4-dimethylpent-3-ylamine does not exhibit good solubility but enhances fluorescence in solids and liquids.13 Consequently, researchers employed much larger secondary amine molecules such as 2-ethylhexan-1-amine, 1-pentylhexyl, and 1-hexylheptyl at the imide position to disrupt intermolecular π–π stacking between PDI molecules and improve solubility in organic solvents such as chloroform (CHCl3), dichloromethane (DCM), toluene, dimethyl sulfoxide (DMSO), and tetrahydrofuran (THF).14–16 Additionally, 3-(dimethylamino)-1-propylamine favours π–π stacking out of the plane and is associated with lamellar orientation. Its oxide also helps tune PDI's work function.17,18 Based on the literature, as discussed above, optimizing the side chain is a widely adopted strategy in organic semiconductor materials to enhance solubility and solid-state properties.
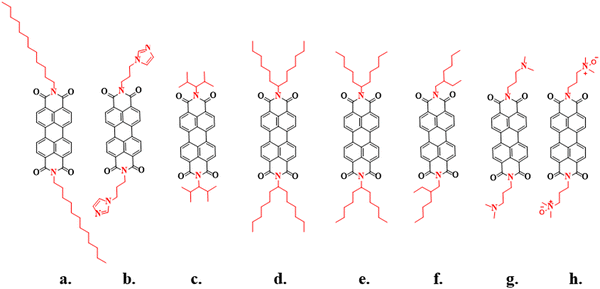 |
| | Fig. 1 Previously reported imide substituted PDI small molecules. | |
Schottky diodes, represent fundamental and ubiquitous electronic components in semiconductor applications, exhibiting rectifying behavior.19 These diodes encompass p-type and n-type semiconductors, and a pn-junction is formed at the interface of the n-and p-type semiconductors, which meticulously govern the unidirectional current flow.20 The inherent properties of Schottky diodes crucially depend upon the interface properties of n- and p-type semiconductors at the junction, exerting a profound impact on characteristics parameters such as the ideality factor (n), barrier height (ϕb), and series resistance (Rs) of the Schottky diodes. Heterojunction devices wherein organic semiconductors are deposited on silicon, forming a pn-junction have been reported previously.21,22 This modification influences certain electrical parameters of rectifying devices. Numerous efforts have been undertaken to achieve the modification and continuous control of the barrier height using organic semiconductors. The heterojunction device is expected to provide a flexible choice of emitter and carrier transport materials, offering a distinctive approach to constructing high-performance electronic devices that capitalize on the advantages of both inorganic and organic semiconductors.23
Herein, a novel n-type organic semiconductor (perylene derivative) was synthesized for the fabrication of a heterojunction diode. An aliphatic chain (fatty amine long chain) was introduced at the imide position, inspired by the previous report on introducing aromatic systems at the imide position to increase solubility. The synthesis and characterization of N,N′-di(cis-9-octadecen-1-yl)perylene-3,4,9,10-tetracarboxylic diimide (O-PDI) are being reported. Ag/O-PDI/p-Si/Al Schottky barrier diode was fabricated, and the heterojunction was formed between p-type crystalline silicon and n-type organic semiconductor (O-PDI). Current–voltage (I–V) characteristics were measured at room temperature under dark conditions. Moreover, electrical parameters such as ideality factor (n), barrier height (ϕb), and series resistance (Rs) were evaluated from I–V characteristics.
2. Experiment section
2.1 Chemicals and instruments
All chemicals and reagents were purchased from Alfa-Asher, and Sigma-Aldrich, and solvents were purified by distillation before use. UV-visible absorption spectra were recorded on a UV-2401PC SHIMADZU spectrometer in different solvents using 1 mg/3 ml solution. For the film fabrication, 3 mg ml−1 solution was spin-coated at ∼1000 rpm for ∼30 s on 2 × 2 cm clean glass substrates and annealed at ∼100 °C for 10 min. Fourier transform infrared spectroscopy (FT-IR) was recorded on a PerkinElmer FT-IR instrument using KBr pallets and a spectrum range from 4000 to 400 cm−1. 1H NMR and 13C NMR were recorded, CDCl3 was used as the solvent, and tetramethylsilane (TMS) was used as the reference material. The electrochemical nature was analysed by cyclic voltammetry (CV) through three electrochemical cell configurations, and a glassy carbon disc electrode was used as the working electrode while a thin gold wire was used as a counter electrode, a non-aqueous Ag/AgCl reference electrode was employed as the reference electrode. The electrochemical measurements were carried out using 0.1 M tetrabutylammoniumhexafluorophosphate (Bu4NPF6) as the electrolyte in anhydrous dichloromethane used as the solvent at room temperature under the scan rate ∼100 mV−1.
2.2 Synthesis procedure of N,N′-di(cis-9-octadecen-1-yl)perylene-3,4,9,10-tetracarboxylic diimide (O-PDI)
500 mg (1.27 mmol) of 3,4:9,10-perylene tetracarboxylic dianhydride (PTCDA) was placed in a vial with 2.5 g of imidazole. Approximately ∼800 mg (2.99 mmol) of oleylamine (cis-9-octadecen-1-amine) was then added to the mixture. The vial was sealed, and nitrogen gas was purged into the reaction mixture. The reaction was stirred at approximately ∼120 °C for about 7 hours,11 resulting in the formation of a dark red solid. The reaction mixture was subsequently washed four times with 50 ml of methanol (since imidazole and oleylamine are highly soluble in methanol) using a centrifuge. A red solid product was obtained with a yield of 1.0 g (88% yield) as shown in Fig. 2. FT-IR (![[small nu, Greek, tilde]](https://www.rsc.org/images/entities/i_char_e0e1.gif) cm−1) = 2922 (C–H), 2850 (C–H), 1693 (–C
cm−1) = 2922 (C–H), 2850 (C–H), 1693 (–C![[double bond, length as m-dash]](https://www.rsc.org/images/entities/char_e001.gif) O), 1651 (–C
O), 1651 (–C![[double bond, length as m-dash]](https://www.rsc.org/images/entities/char_e001.gif) O), 1591 (–C
O), 1591 (–C![[double bond, length as m-dash]](https://www.rsc.org/images/entities/char_e001.gif) C–), 1577 (–C
C–), 1577 (–C![[double bond, length as m-dash]](https://www.rsc.org/images/entities/char_e001.gif) C–), 1465 (CH3 bend), 1438 (CH2 bend), 1404 (C–Nstr), 1377 (CH3 sym), 746 (C
C–), 1465 (CH3 bend), 1438 (CH2 bend), 1404 (C–Nstr), 1377 (CH3 sym), 746 (C![[double bond, length as m-dash]](https://www.rsc.org/images/entities/char_e001.gif) Ccis alkene), 727 (C
Ccis alkene), 727 (C![[double bond, length as m-dash]](https://www.rsc.org/images/entities/char_e001.gif) Ccis alkene), 630 (–N–C
Ccis alkene), 630 (–N–C![[double bond, length as m-dash]](https://www.rsc.org/images/entities/char_e001.gif) Obend), 435 (C–N–Cbend). 1H NMR (400 MHz, chloroform-D) δ 8.4 (d, 4H), 8.2 (d, 4H), 5.35 (m, 4H), 4.14 (t, 4H), 1.98 (m, 8H), 1.77 (m, 4H), 1.42 (m, 4H), 1.25–1.29 (m, 40H), 0.86 (t, 6H). 13C NMR (101 MHz, CDCl3) δ 161.84, 132.70, 129.73, 129.34, 128.91, 128.83, 127.75, 124.58, 122.00, 121.55, 58.50, 39.68, 37.12, 31.60, 30.88, 30.77, 30.22, 28.76, 28.71, 28.67, 28.65, 28.60, 28.51, 28.40, 28.36, 28.30, 28.18, 27.05, 26.21, 26.18, 21.66, 13.10. MALDI-TOF: m/z = 890.2427 g calculated for C60H78N2O4 = 890.640.
Obend), 435 (C–N–Cbend). 1H NMR (400 MHz, chloroform-D) δ 8.4 (d, 4H), 8.2 (d, 4H), 5.35 (m, 4H), 4.14 (t, 4H), 1.98 (m, 8H), 1.77 (m, 4H), 1.42 (m, 4H), 1.25–1.29 (m, 40H), 0.86 (t, 6H). 13C NMR (101 MHz, CDCl3) δ 161.84, 132.70, 129.73, 129.34, 128.91, 128.83, 127.75, 124.58, 122.00, 121.55, 58.50, 39.68, 37.12, 31.60, 30.88, 30.77, 30.22, 28.76, 28.71, 28.67, 28.65, 28.60, 28.51, 28.40, 28.36, 28.30, 28.18, 27.05, 26.21, 26.18, 21.66, 13.10. MALDI-TOF: m/z = 890.2427 g calculated for C60H78N2O4 = 890.640.
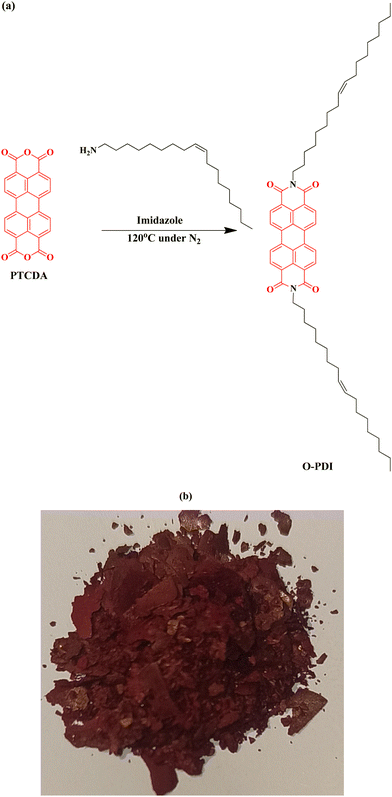 |
| | Fig. 2 (a) Synthetic route of O-PDI, (b) synthesized powder. | |
2.3 Device fabrication
P-Crystalline silicon wafer was sonicated in a diluted solution of HF (1![[thin space (1/6-em)]](https://www.rsc.org/images/entities/char_2009.gif) :
:![[thin space (1/6-em)]](https://www.rsc.org/images/entities/char_2009.gif) 10) for 5 minutes for the removal of the oxide layer on the surface of the silicon wafer, then with acetone for ∼5 min and later dried with a purging by the stream of N2 gas. Al was thermally deposited on the back surface of the dried silicon wafer by thermal evaporation. On the front surface, ∼120 nm of O-PDI was thermally deposited at the rate of ∼0.1 nm s−1 under the ∼10−5 mbar pressure, and the thickness of the film was monitored using the quartz crystal. Further, ∼100 nm of silver (Ag) fingers were thermally deposited on the O-PDI for the top contact.
10) for 5 minutes for the removal of the oxide layer on the surface of the silicon wafer, then with acetone for ∼5 min and later dried with a purging by the stream of N2 gas. Al was thermally deposited on the back surface of the dried silicon wafer by thermal evaporation. On the front surface, ∼120 nm of O-PDI was thermally deposited at the rate of ∼0.1 nm s−1 under the ∼10−5 mbar pressure, and the thickness of the film was monitored using the quartz crystal. Further, ∼100 nm of silver (Ag) fingers were thermally deposited on the O-PDI for the top contact.
3. Results and discussion
In this work, we synthesized a small molecule consisting of perylene diimide substituted with a fatty amine through a nucleophilic substitution reaction at the imide position. We studied its optical properties, thermal stability, electrochemical characteristics, and self-assembly properties. It should be noted that PTCDA has two active imide substitution positions. In response, oleylamine (ω−9 long aliphatic fatty amine) serves as an excellent nucleophile, attacking the anhydride group present in PTCDA and forming perylene diimide as the final product, O-PDI (depicted in Fig. 2a). This product was isolated in the solid form, displaying a dark red color, as shown in Fig. 2b. Structural properties were characterized using FT-IR and NMR spectroscopy. Fig. S1 (ESI†) illustrates the FT-IR spectra of O-PDI, revealing two major and sharp peaks at ∼2922 cm−1 and ∼2850 cm−1, which were not present in the parent molecule (PTCDA) and are indicative of alkyl C–H stretching. This suggests the attachment of the long aliphatic chain of carbon from oleylamine. Perylene diimide showed the disappearance of the dianhydride C![[double bond, length as m-dash]](https://www.rsc.org/images/entities/char_e001.gif) O stretching peak of the parent molecule at ∼1772 cm−1 and ∼1754 cm−1, with the appearance of new peaks at ∼1693 cm−1 and ∼1651 cm−1, which belong to the imide C
O stretching peak of the parent molecule at ∼1772 cm−1 and ∼1754 cm−1, with the appearance of new peaks at ∼1693 cm−1 and ∼1651 cm−1, which belong to the imide C![[double bond, length as m-dash]](https://www.rsc.org/images/entities/char_e001.gif) O group. This confirmed the introduction of the imide group into the perylene molecule. NMR spectroscopy was used to validate the plausible structure of O-PDI. Fig. S2a (ESI†) depicts the 1H NMR spectra, and Fig. S2b (ESI†) shows the 13C NMR spectra. The proton NMR spectrum revealed highly deshielded eight protons at ∼8.4 ppm and ∼8.2 ppm due to the carbonyl group and the perylene core, with outer field protons being more deshielded. The alkyl group protons exhibit chemical shift values ranging from ∼2.0 ppm to ∼0.80 ppm. Solubility is a critical factor for potential applications, and we prepared a ∼3 mg ml−1 solution in various solvents to assess the solubility of O-PDI. Our observations, shown in Table 1, indicate that O-PDI is readily soluble in benzene-based and halo-group solvents, with further details discussed in the table. We found that O-PDI is soluble in benzene-based solvents (chlorobenzene, toluene, o-xylene, and diphenyl ether) as well as polar aprotic solvents (dichloromethane, THF, 1,4-dioxane, MIBK, NMP, DMF, and DMSO) but insoluble in polar protic solvents (n-butanol, isopropyl alcohol, ethanol, methanol, and water) as well as non-polar solvents (n-hexane and n-heptane).
O group. This confirmed the introduction of the imide group into the perylene molecule. NMR spectroscopy was used to validate the plausible structure of O-PDI. Fig. S2a (ESI†) depicts the 1H NMR spectra, and Fig. S2b (ESI†) shows the 13C NMR spectra. The proton NMR spectrum revealed highly deshielded eight protons at ∼8.4 ppm and ∼8.2 ppm due to the carbonyl group and the perylene core, with outer field protons being more deshielded. The alkyl group protons exhibit chemical shift values ranging from ∼2.0 ppm to ∼0.80 ppm. Solubility is a critical factor for potential applications, and we prepared a ∼3 mg ml−1 solution in various solvents to assess the solubility of O-PDI. Our observations, shown in Table 1, indicate that O-PDI is readily soluble in benzene-based and halo-group solvents, with further details discussed in the table. We found that O-PDI is soluble in benzene-based solvents (chlorobenzene, toluene, o-xylene, and diphenyl ether) as well as polar aprotic solvents (dichloromethane, THF, 1,4-dioxane, MIBK, NMP, DMF, and DMSO) but insoluble in polar protic solvents (n-butanol, isopropyl alcohol, ethanol, methanol, and water) as well as non-polar solvents (n-hexane and n-heptane).
Table 1 Solubility of O-PDI in different solvents
| S. no. |
Solvent |
O-PDI |
| 1 |
Dichloromethane |
Soluble |
| 3 |
Chlorobenzene |
Soluble |
| 4 |
o-Xylene |
Soluble with dispersed particles |
| 5 |
Toluene |
Soluble with dispersed particles |
| 6 |
THF |
Soluble with dispersed particles |
| 7 |
Diphenyl ether |
Soluble |
| 8 |
1,4-Dioxane |
Slightly soluble |
| 9 |
Methyl iso-butyl ketone |
Partially soluble |
| 10 |
NMP |
Dispersed particles |
| 11 |
DMF |
Dispersed particles |
| 12 |
DMSO |
Dispersed particles |
| 13 |
Ethyl acetate |
Insoluble |
| 14 |
Acetonitrile |
Insoluble |
| 15 |
Ethanol |
Insoluble |
| 16 |
Methanol |
Insoluble |
| 17 |
Isopropyl alcohol |
Insoluble |
| 18 |
n-Butyl alcohol |
Insoluble |
| 19 |
n-Hexane |
Insoluble |
| 20 |
n-Heptane |
Insoluble |
| 21 |
Water |
Insoluble |
3.1 Ultraviolet spectroscopy (UV)
To determine the optical properties of O-PDI, we need to understand the molecule's solubility in different solvents, as discussed in Table 1. However, the solubility table does not indicate which solvent exhibits superior solubility. Therefore, we employed the Beer–Lambert law, as shown in eqn (1) (absorbance of a material depends on both the path length and the concentration of the species)| |  | (1) |
In eqn (1), A represents absorbance (the amount of light absorbed by the sample at a particular wavelength), c is the molar concentration of the absorbing material, l is the path length through which light passes in the solution, and  is the molar extinction coefficient, which describes how strongly a chemical species absorbs incident light at a specific wavelength. This coefficient is an intrinsic property of the chemical species. Due to its intrinsic nature, the molar extinction coefficient is considered constant, and the path length is fixed. Consequently, the material's light absorption is directly proportional to its molar concentration in a given solvent, as shown in eqn (2).15,16 This implies that a higher hyperchromic shift corresponds to a higher concentration, indicating better solubility of the solvent.
Absorption spectra of O-PDI were recorded at a concentration of approximately ∼0.187 μM in various solvents. The solvent selection was based on Table 1, and Fig. 3a displays that O-PDI exhibited superior solubility in the investigated solvents such as dichloromethane, chlorobenzene, o-xylene, toluene, and tetrahydrofuran. Chlorobenzene displayed the highest hyperchromic shift and molar extinction coefficient  as shown in Table 2. Other solvents, including o-xylene
 dichloromethane
  toluene
  THF
THF  N-methyl 2-pyrrolidone (ε = 23
![[thin space (1/6-em)]](https://www.rsc.org/images/entities/char_2009.gif) 260 M−1 cm−1), diphenyl ether (ε = 10
260 M−1 cm−1), diphenyl ether (ε = 10![[thin space (1/6-em)]](https://www.rsc.org/images/entities/char_2009.gif) 033 M−1 cm−1), methyl iso-butyl ketone
033 M−1 cm−1), methyl iso-butyl ketone  1,4-dioxane
  and dimethylformamide
  exhibited varying molar extinction coefficients for O-PDI. The molar extinction coefficient of PDI can vary with different solvents due to a combination of factors, including solute–solvent interactions, aggregation, conformational changes, and concentration.
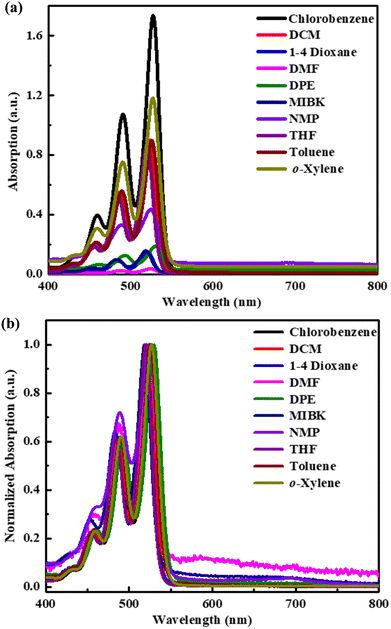 |
| | Fig. 3 (a) Absorption spectra with different solvents. (b) Normalized absorption spectra with other solvents. | |
Table 2 Tabulated optical absorption data
| Solvent |
λ
abs (nm) |

(M−1 cm−1) |
Band gap (eV) |
| Chlorobenzene |
527, 490, 459 |
92![[thin space (1/6-em)]](https://www.rsc.org/images/entities/char_2009.gif) 731 731 |
∼2.29 |
|
o-Xylene |
526, 490, 458 |
63![[thin space (1/6-em)]](https://www.rsc.org/images/entities/char_2009.gif) 109 109 |
∼2.29 |
| Dichloromethane |
523, 486, 456 |
48![[thin space (1/6-em)]](https://www.rsc.org/images/entities/char_2009.gif) 140 140 |
∼2.31 |
| Toluene |
525, 489, 457 |
47![[thin space (1/6-em)]](https://www.rsc.org/images/entities/char_2009.gif) 974 974 |
∼2.30 |
| Tetrahydrofuran |
520, 484, 453 |
46![[thin space (1/6-em)]](https://www.rsc.org/images/entities/char_2009.gif) 242 242 |
∼2.33 |
|
N-Methyl 2-pyrrolidone |
524, 489, 460 |
23![[thin space (1/6-em)]](https://www.rsc.org/images/entities/char_2009.gif) 260 260 |
∼2.30 |
| Diphenyl ether |
529, 493, 461 |
10![[thin space (1/6-em)]](https://www.rsc.org/images/entities/char_2009.gif) 033 033 |
∼2.28 |
| Methyl iso-butyl ketone |
518, 482, 451 |
8345 |
∼2.33 |
| 1,4-Dioxane |
520, 485, 453 |
8056 |
∼2.33 |
| Dimethylformamide |
524, 488, 457 |
414 |
∼2.30 |
In the case of benzene-based solvents, they can easily interact with O-PDI due to π–π interactions (solute–solvent interactions), which occur between the conjugated systems. These interactions can lead to more pronounced aggregation and hyperchromic shift. On the other hand, polar aprotic solvents (DMF, 1,4-dioxane, and MIBK) exhibited lower molar extinction coefficients due to the dispersed particles, as discussed in Table 1. We chose chlorobenzene as the base solvent due to its excellent solubility.
Fig. 3b illustrates the normalized absorption spectrum of O-PDI in different solvents. We observed slight shifts in the peaks of O-PDI in different solvents, which can be attributed to the solvatochromic effect. These shifts depend on how the solvent interacts with the solute or the polarity of the solvent. Among the solvents listed in Table 2, diphenyl ether exhibited the highest bathochromic shift (red shift). Notably, benzene-based solvents displayed the highest bathochromic shifts, with the order being diphenyl ether > chlorobenzene > o-xylene > toluene, owing to π–π interactions (solute–solvent interactions).15 In these solvents, the spectrum of O-PDI featured three typical absorption peaks, confirming that there were no significant structural changes in the core structure of perylene diimide due to imide substitution.
The absorption peaks of O-PDI (Fig. 4) were observed at approximately 527 nm, 490 nm, and 459 nm, corresponding to the vibronic absorption bands for the 0 → 0, 0 → 1, and 0 → 2 transitions, respectively. These transitions are associated with the π–π* electronic transition of monomeric perylene diimide in chlorobenzene. In the electronic absorption of perylene diimide, there was a notable coupling with vibronic features corresponding to υ = 0 → υ′ = 0, 1 and 2 transitions, where υ and υ′ represent quantum vibrational numbers for the ground and excited states, respectively. However, as the monomer begins to self-aggregate, we observed a hyperchromic shift in the 0 → 2 and 0 → 1 transitions, accompanied by a loss of fine vibronic structure and a broadening of the spectra.17 This phenomenon indicates that the perylene diimide molecular scaffolds facilitate π–π intermolecular interactions between neighbouring molecules.18 In the case of the film, the absorption spectrum is broadened, and the absorption peak undergoes a bathochromic shift of ∼39 nm compared to that in the solution, as shown in Fig. 4. This broader spectrum suggests stronger π–π interchain associations in the film compared to those in the solution.24
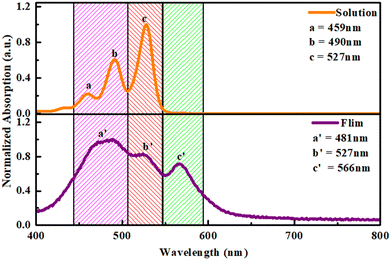 |
| | Fig. 4 Comparative absorption spectra of the solution and film of O-PDI. | |
3.2 Tauc plot
The band gap energy is essential for predicting the photochemical and photophysical properties of a material. The band gap energy of organic materials is used to determine the energy required to excite an electron from the higher occupied molecular orbital (HOMO) to the lower unoccupied molecular orbital (LUMO). In particular, Tauc introduced a method in 1966 to calculate the band gap energy using optical absorption spectra. The absorption spectra of O-PDI were employed to calculate the band gap energy with the help of Tauc's relation:25| |  | (4) |
By comparing eqn (3) and (4), we obtain:In these equations, A represents the absorption of O-PDI, α is the absorption coefficient of O-PDI, E is the energy of the photon, Eg is the band gap energy, d is the thickness of O-PDI (film or solution), and m is a factor that depends on the electronic transition between the highest occupied molecular orbital (HOMO) and the lowest unoccupied molecular orbital (LUMO). Two types of transitions are direct transition (m = 1/2) and indirect transition (m = 2). The perylene diimide family mostly follows the direct transition model to determine the value of Eg. Hence, (αhυ)2 is plotted against E, as shown in Fig. 5(a). However, the band gap of O-PDI is determined by extrapolating the linear portion of the (αhυ)2versus E to zero, resulting in an energy band gap value of approximately 2.29 eV. On the other hand, in Fig. 5(b), we discuss the Tauc plot of O-PDI with different solvents and find that the solvent also affects the band gap value. It follows the same pattern as the absorption spectrum of the different solvents. All the band gap values and λmax are discussed in Table 2.
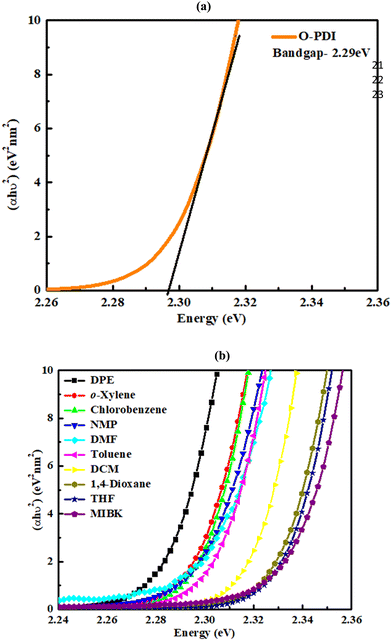 |
| | Fig. 5 (a) Tauc plot of O-PDI in chlorobenzene. (b) Tauc plot of the solution of O-PDI with different solvents. | |
3.3 Photoluminescence spectroscopy
Emission spectra (Fig. 6) were acquired under low chlorobenzene concentrations, revealing that O-PDI displayed a mirror image of the absorption spectra, indicating the absence of aggregation.26 Three distinct emission bands were observed with peaks at ∼541 nm, ∼578 nm, and ∼627 nm, corresponding to the 0 → 0, 1 → 0, and 2 → 0 electron transitions, respectively. An evident, Stokes shift of ∼14 nm was observed, which could be attributed to the π–π interactions occurring between the aromatic solvent and O-PDI molecules.
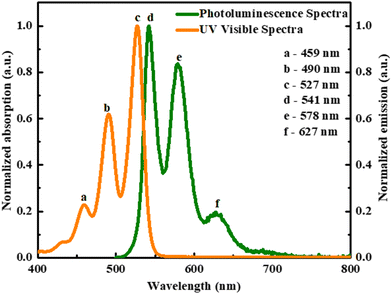 |
| | Fig. 6 Comparison of photoluminescence spectrum (PL) and absorption spectrum of O-PDI. | |
3.4 Cyclic voltammetry
The electrochemical nature of electron and hole transport materials was investigated by cyclic voltammetry (CV), which is used to study the reversible redox characteristics and electrochemical stability and calculate the HOMO–LUMO energy levels. The cyclic voltammetry curve of O-PDI is shown in Fig. 7, where O-PDI did not show any observable oxidation potential, as such, the HOMO energy level was not calculated from cyclic voltammetry and indicated the reduction potential (Eredonset − 0.59 V). The equation, ELUMO = −[Eredonset − EFc/Fc+ + 4.8] eV,27 was used to calculate the LUMO energy level, and the onsets of the oxidation and reduction potentials were determined against Fc/Fc+ as the internal standard. Assuming the absolute energy level of Fc/Fc+ to be 4.8 eV below a vacuum, and Ehalf of ferrocene to be 0.633 V in dichloromethane and the LUMO level was calculated to be −3.57 eV for O-DPI and the HOMO level was calculated using the equation EHOMO = ELUMO − bandgap was determined with the help of the absorption spectra. Hence the HOMO level of OPDI was −5.86 eV.
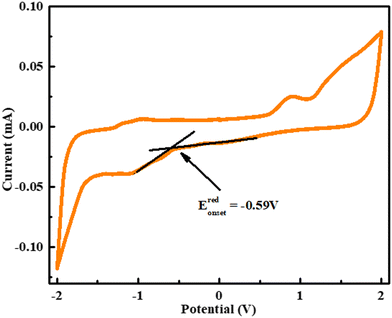 |
| | Fig. 7 Cyclic voltamentric graph of O-PDI. | |
3.5 Thermal gravimetric analysis (TGA)
The TGA thermogram of O-PDI is shown in Fig. 8. The measured temperature characteristics, such as Ton (decomposition temperature onset), and T10 (temperature for 10% loss), were determined from TGA. We observed that Ton of O-PDI was up to ∼200 °C, which showed that O-PDI is thermally stable, and there is no weight loss in the range of 100–175 °C, which indicates the absence of moisture in the material,28 showing ∼10% weight loss up to T10 ∼ 400 °C, after that its started losing its characteristics properties, indicating very high thermal stability, confirming that OPDI is a very suitable candidate for electronic devices.
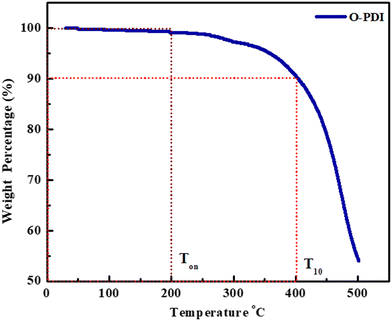 |
| | Fig. 8 Thermal-gravimetric analysis of O-PDI. | |
3.6 X-ray diffraction patterns (XRD)
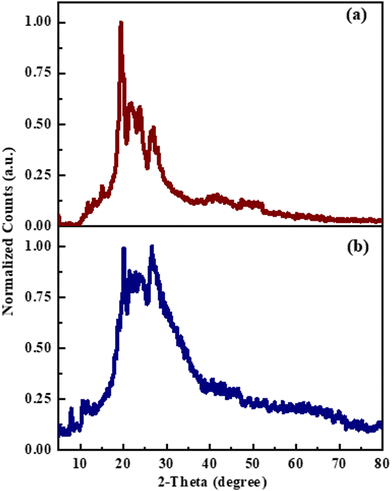
We performed XRD studies on the solid (a) and thin film (b) samples, as depicted in Fig. 9. The thin film samples were drop-cast onto cleaned glass substrates from a chlorobenzene solution and annealed at 120 °C for 30 minutes. The diffractograms displayed distinct features. Curve (a) showed characteristic peaks at 2θ = 20°–30°, indicating the low crystallinity of solid O-PDI. In contrast, curve (b) exhibited a halo pattern, suggesting that the film was amorphous, with a highly disordered arrangement of molecules.11 This amorphous nature is most likely due to the drop-casting process, where the rapid drying of the film leads to increased disorder.
 |
| | Fig. 9 Comparative X-ray diffraction of O-PDI in (a) solid and (b) film. | |
3.7. Rectifier application
Current–voltage (I–V) measurement helps in the study of p–n junction properties. Furthermore, the mechanism of conduction through the device can be analysed through I–V measurements. The reverse (–3 to 0 V) and forward (0–3 V) bias I–V characteristics are shown in Fig. 10(b) for Al/P-c-Si/O-PDI/Ag. The nonlinear/asymmetric behaviour observed from the I–V curves indicates the rectifying behaviour of the device resulting from the formation of a pn-junction between p-type silicon and O-PDI. The rectification ratio (RR), the ratio of the forward current to the reverse current,29 was calculated at room temperature, showing the value ∼3470@ ± 2 V, as shown in Fig. 10(c), which is higher than that reported so far for other PDI-based devices (Table 3). The thermionic emission (TE) theory is used to comprehend the behaviour of the hetero-junction, and current can be expressed as per eqn (8).30,31| |  | (8) |
| |  | (9) |
The barrier height is obtained from eqn (9), and can be written as| |  | (10) |
The equation incorporates several variables and constants: q represents the elementary charge (electron), V signifies the applied voltage across the hetero-junction, k denotes Boltzmann's constant (1.38 × 10⁻²³ J K−1), T represents the absolute temperature in kelvin, A represents the effective area of the device (approximately ∼1.5 cm2), A* is the Richardson constant specific to p-c-silicon and is equal to 32 A cm−2 K−2, and m* represents the effective mass for holes perpendicular to the layer.22,32,33I0 can be determined from the y-intercept of the ln![[thin space (1/6-em)]](https://www.rsc.org/images/entities/char_2009.gif) I vs. V plot at V = 0, as shown in Fig. 10(d). Solving eqn 8 allows for the derivation of the expression for the ideality factor (n).
I vs. V plot at V = 0, as shown in Fig. 10(d). Solving eqn 8 allows for the derivation of the expression for the ideality factor (n).| |  | (11) |
The ideality factor (n) of a diode can be determined by analysing the slope of the linear region in the forward bias current of the ln![[thin space (1/6-em)]](https://www.rsc.org/images/entities/char_2009.gif) I vs. V curve. In an ideal diode, n is expected to be unity, indicating ideal behaviour. n is a parameter that reflects the uniformity of the Schottky barrier in the hetero-junction. A more uniform interface between materials will result in the n value closer to unity. However, the device of O-PDI shows the ideality factor of ∼2.55, reverse saturation current (I0) of ∼2.59 nA cm−2, and barrier height (ϕb) of the diode was calculated as ∼0.89 eV. Junction resistances are critical for understanding the electrical parameters of heterojunction devices. In particular, series resistance (Rs) and shunt resistance (Rsh) are widely studied in these devices. The values of Rs and Rsh were determined by analyzing the junction resistance (Rj = ∂V/∂I) versus the bias voltage curve, as shown in Fig. 10(e). In the forward bias region, the minima of the Rjvs. V curve corresponds to the series resistance (Rs) ∼2823 Ω, in the reverse bias region, the maxima of the Rjvs. V curve represents the shunt resistance (Rsh) ∼ 24.21 MΩ.
I vs. V curve. In an ideal diode, n is expected to be unity, indicating ideal behaviour. n is a parameter that reflects the uniformity of the Schottky barrier in the hetero-junction. A more uniform interface between materials will result in the n value closer to unity. However, the device of O-PDI shows the ideality factor of ∼2.55, reverse saturation current (I0) of ∼2.59 nA cm−2, and barrier height (ϕb) of the diode was calculated as ∼0.89 eV. Junction resistances are critical for understanding the electrical parameters of heterojunction devices. In particular, series resistance (Rs) and shunt resistance (Rsh) are widely studied in these devices. The values of Rs and Rsh were determined by analyzing the junction resistance (Rj = ∂V/∂I) versus the bias voltage curve, as shown in Fig. 10(e). In the forward bias region, the minima of the Rjvs. V curve corresponds to the series resistance (Rs) ∼2823 Ω, in the reverse bias region, the maxima of the Rjvs. V curve represents the shunt resistance (Rsh) ∼ 24.21 MΩ.
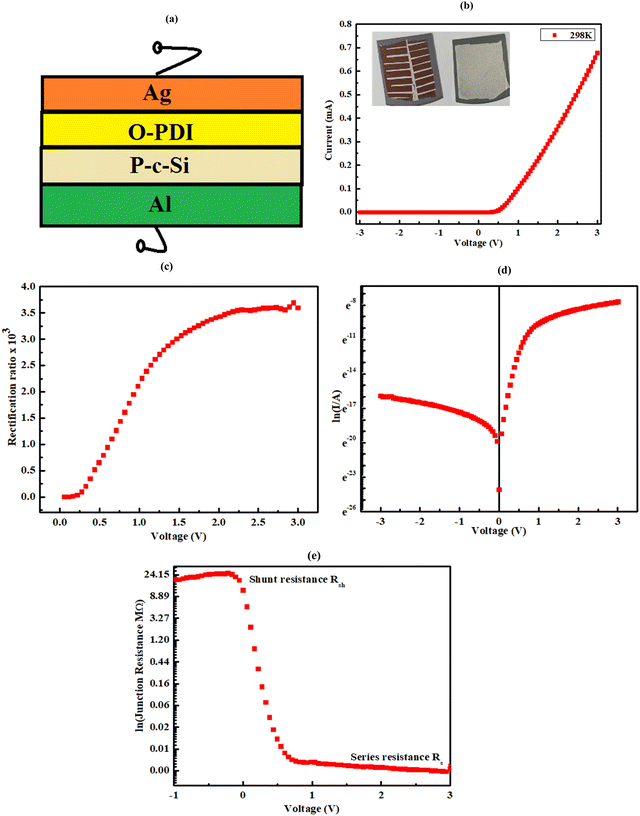 |
| | Fig. 10 Heterojunction device Al/P-c-Si/O-PDI/Ag fabricated using synthesized O-PDI and all the analysis carried out at room temperature under the dark condition, (a) schematic of the heterojunction device, (b) I–V characteristics at room temperature and the inset shows the actual device from the back and front side, (c) rectification curve of device, (d) semi-logarithmic (I–V) characteristics, and (e) junction resistance vs. voltage. | |
Table 3 Comparison of electrical properties of various heterojunction devices
| Rectifier device structure |
Used molecule |
Device parameters |
| Ideality factor (n) |
Reverse saturation current (I0) (nA cm−2) |
Barrier height (ϕb) (eV) |
Shunt resistance (Rsh) |
Series resistance (Rs) |
Rectification ratio |
Ref. |
| Al/P-C-Si/O-PDI/Ag |
O-PDI |
∼2.55 |
∼2.590 |
∼0.890 |
24.21 MΩ |
2823 Ω |
3470 @ ± 2 V |
Present report |
| Al/N-BuHHPDI/P-Si |
N-BuHHPDI |
∼12.00 |
∼1.310 |
∼0.830 |
64.4 MΩ |
1.61 MΩ |
51.5 @ ± 6.8 V |
34
|
| Au/PDI/p-Si/Al |
PDI |
∼1.77 |
— |
∼0.584 |
— |
324.7 Ω |
— |
22
|
| Au/polypyrrole/p-Si/Al |
Polypyrrole |
∼1.88 |
— |
∼0.780 |
— |
4.35 kΩ |
— |
35
|
| Au/p-VOPc/n-Si/Au |
p-VOPc |
∼3.42 |
∼60 |
∼0.770 |
100 kΩ |
1.4 kΩ |
405@± 1 V |
36
|
| Au/dimethylanilino-aza[C60]-fullerene/Au |
Dimethylanilino-aza[C60]-fullerene |
— |
— |
— |
— |
— |
2 × 10⁴ @ 1 V |
37
|
Herein, it is essential to mention that the demonstration of the use of O-PDI in rectifiers is a part of the motivation for hybrid nanoelectronics, mainly based on observing nonlinear charge transport in organic molecules grafted on a silicon substrate. This is the basis of molecular electronics, such as molecular diodes, tunnel diodes, and molecular transistors. Various techniques, such as self-assembled monolayers, Langmuir–Blodgett, or metal/molecule/metal, can deposit the assembly of organic molecules on a solid substrate. Silicon is better as one can tailor the surface potential for promising hybrid molecular devices. The threshold voltage for rectification can be controlled by changing the electronic structure of organic molecules. The rectification ratio decides the quality of the rectifier fabricated in hybrid structures. The rectification property is the consequence of resonant transport between the silicon conduction band and homo levels of the molecules. The pinning of the Fermi level at the interface of metal/molecule plays a critical role in the electrical behaviour of the organic-based rectifying junctions. However, developing stable rectifying devices that can be easily processed, and have the ability for high electron mobility is challenging. The high band gap and ionization energies are the main qualities of PDI-based molecules for rectifying applications.
4. Conclusions
A small fatty amine-substituted perylene diimide (O-PDI) molecule can be subjected to nucleophilic substitution reactions. The synthesized molecules were characterized through various experimental techniques, including FT-IR, NMR spectroscopy, UV-visible, Tauc–Plot, thermal gravimetric analysis, and X-ray diffraction pattern (XRD), confirming the formation of O-PDI through this technique. Absorption bands of O-PDI were observed at ∼527, ∼490, and ∼459 nm, representing the vibronic absorption bands 0–0, 0–1, and 0–2 transitions, respectively, of the monomeric perylene diimide solution. The bandgap (Eg), calculated using the Tauc plot, is ∼2.29 eV in the visible region, supported by cyclic voltammetric measurements. Furthermore, stability of up to 2000 °C was confirmed by TGA analysis, and the XRD measurements indicated the O-PDI phase. In addition, the rectifying behaviour exhibited by the Al/P-c-Si/O-PDI/Ag device, with a rectification ratio of ∼3470@ ± 2 V, was observed, indicating a considerably good performance compared to other PDI-based rectifiers reported thus far. Thus, pronounced current rectification was revealed by the I–V characteristics. To our knowledge, such high rectification ratio values are rare in devices fabricated using non-PDI molecules.
Conflicts of interest
There are no conflicts to declare.
Acknowledgements
Akash is grateful to the Council of Scientific and Industrial Research (CSIR) for his SRF scholarship, and Dr J. P. Tiwari, is thankful to Director Professor Venu Gopal Achanta for his support. Herein, all data is collected by author Akash for his PhD thesis. Dr J. P. Tiwari supervised the work and helped in writing and publishing it.
References
- B. Lüssem, M. Riede and K. Leo, Phys. Status Solidi Appl. Mater. Sci., 2013, 210, 9–43 CrossRef.
- A. Facchetti, M. H. Yoon and T. J. Marks, Adv. Mater., 2005, 17, 1705–1725 CrossRef CAS.
- J. D. Myers and J. Xue, Polym. Rev., 2012, 52, 1–37 CrossRef CAS.
- K. Wang, P. Xia, K. Wang, X. You, M. Wu, H. Huang, D. Wu and J. Xia, ACS Appl. Mater. Interfaces, 2020, 12, 9528–9536 CrossRef CAS PubMed.
- Y. Ma, M. Zhang, S. Wan, P. Yin, P. Wang, D. Cai and F. L. Joule, Joule, 2021, 5, 197–209 CrossRef CAS.
- Z. Luo, T. Liu, Z. Chen, Y. Xiao, G. Zhang, L. Huo, C. Zhong, X. Lu, H. Yan, Y. Sun and C. Yang, Adv. Sci., 2019, 6, 1802065 (1-7) Search PubMed.
- F. Tang, K. Wu, Z. Zhou, G. Wang, B. Zhao and S. Tan, ACS Appl. Energy Mater., 2019, 2, 3918–3926 CrossRef CAS.
- X. Zhan, A. Facchetti, S. Barlow, T. J. Marks, M. A. Ratner, M. R. Wasielewski, S. R. Marder, X. Zhan, A. Facchetti, T. J. Marks, A. Ratner, M. R. Wasielewski, S. Barlow and S. R. Marder, Adv. Mater., 2011, 23, 268–284 CrossRef CAS PubMed.
- S. G. Liu, G. Sui, R. A. Cormier, R. M. Leblanc and B. A. Gregg, J. Phys. Chem. B, 2002, 106, 1307–1315 CrossRef CAS.
- C. Zhao, J. Wang, J. Jiao, L. Huang and J. Tang, J. Mater. Chem. C, 2019, 8, 28–43 RSC.
- G. Boobalan, P. K. M. Imran, C. Manoharan and S. Nagarajan, J. Colloid Interface Sci., 2013, 393, 377–383 CrossRef CAS PubMed.
- M. Liu, Y. Jiang, D. Liu, J. Wang, Z. Ren, T. P. Russell and Y. Liu, ACS Energy Lett., 2021, 6, 3228–3235 CrossRef CAS.
- H. Langhals, O. Krotz, K. Polborn and P. Mayer, Angew. Chem., Int. Ed., 2005, 44, 2427–2428 CrossRef CAS PubMed.
- D. W. Kuo, G. Z. Liu and R. H. Lee, Dyes Pigm., 2019, 170, 107562 CrossRef CAS.
- F. Kong, M. Lin and T. Qiu, Luminescence, 2018, 33, 1209–1216 CrossRef CAS PubMed.
- J. A. H. Kaeswurm, A. Scharinger, J. Teipel and M. Buchweitz, Molecules, 2021, 26, 1–15 CrossRef PubMed.
- Y. S. Ma, C. H. Wang, Y. J. Zhao, Y. Yu, C. X. Han, X. J. Qiu and Z. Shi, Supramol. Chem., 2007, 19, 141–149 CrossRef CAS.
- Y. Ma, X. Li, X. Wei, T. Jiang, J. Wu and H. Ren, Korean J. Chem. Eng., 2015, 32, 1427–1433 CrossRef CAS.
- M. Wautelet, Eur. J. Phys., 1999, 20, L29–L30 CrossRef.
- Y. Chu, C. Qian, P. Chahal and C. Cao, Adv. Sci., 2018, 1801653 (1–29) Search PubMed.
- Ö. F. Yüksel, M. Kuş, N. Şimşir, H. Şafak, M. Şahin and E. Yenel, J. Appl. Phys., 2011, 110, 024507 (1–7) CrossRef.
- Ö. F. Yüksel, N. Tuǧluoǧlu, H. Şafak and M. Kuş, J. Appl. Phys., 2013, 113, 044507 (1–9) CrossRef.
- Ş. Aydoğan, Ü. İncekara b, A. R. Deniz and A. Türüt, Microelectron. Eng., 2010, 87, 2525–2530 CrossRef.
- H. Liu, Z. Zhang, M. Huang, B. Zhao, J. Zhang and S. Tan, Synth. Met., 2017, 227, 122–130 CrossRef CAS.
- M. Tahir, Muddusir, D. N. Khan, S. Gul, F. Wahab and S. M. Said, J. Mater. Sci.: Mater. Electron., 2019, 30, 19463–19470 CrossRef CAS.
- Y. Chen, Y. Feng, J. Gao and M. Bouvet, J. Colloid Interface Sci., 2012, 368, 387–394 CrossRef CAS PubMed.
- K. Y. Chen, T. C. Fang and M. J. Chang, Dyes Pigm., 2012, 92, 517–523 CrossRef CAS.
- S. Matsumura, A. R. Hlil, C. Lepiller, J. Gaudet, D. Guay, Z. Shi, S. Holdcroft and A. S. Hay, J. Polym. Sci., Part A: Polym. Chem., 2008, 46, 7207–7224 CrossRef.
- S. Sherif, G. Rubio-Bollinger, E. Pinilla-Cienfuegos, E. Coronado, J. C. Cuevas and N. Agraït, Nanotechnology, 2015, 26, 2910019 (1–6) CrossRef PubMed.
- V. Janardhanam, A. Ashok Kumar, V. Rajagopal Reddy and P. Narasimha Reddy, J. Alloys Compd., 2009, 485, 467–472 CrossRef CAS.
- Z. Ahmad and M. H. Sayyad, Optoelectron. Adv. Mater., Rapid Commun., 2009, 3, 509–512 CAS.
- M. Bhaskar Reddy, A. Ashok Kumar, V. Janardhanam, V. Rajagopal Reddy and P. Narasimha Reddy, Curr. Appl. Phys., 2009, 9, 972–977 CrossRef.
- M. Saǧlam, A. Ateş, M. A. Yildirim, B. Güzeldir and A. Astam, Curr. Appl. Phys., 2010, 10, 513–520 CrossRef.
- M. Tahir, M. H. Sayyad, F. Wahab, F. Aziz, M. Shahid and M. A. Munawar, Phys. B, 2013, 426, 6–12 CrossRef CAS.
- Ş. Aydoǧan, M. Saǧlam, A. Türüt and Y. Onganer, Mater. Sci. Eng., C, 2009, 29, 1486–1490 CrossRef.
- S. M. Khan, M. H. Sayyad and K. S. Karimov, Ionics, 2011, 17, 307–313 CrossRef CAS.
- R. M. Metzger, J. W. Baldwin, W. J. Shumate, I. R. Peterson, P. Mani, G. J. Mankey, T. Morris, G. Szulczewski, S. Bosi, M. Prato, A. Comito and Y. Rubin, J. Phys. Chem. B, 2003, 107, 1021–1027 CrossRef CAS.
|
| This journal is © The Royal Society of Chemistry 2024 |
Click here to see how this site uses Cookies. View our privacy policy here.  Open Access Article
 *ab
*ab
![[small nu, Greek, tilde]](https://www.rsc.org/images/entities/i_char_e0e1.gif) cm−1) = 2922 (C–H), 2850 (C–H), 1693 (–C
cm−1) = 2922 (C–H), 2850 (C–H), 1693 (–C![[double bond, length as m-dash]](https://www.rsc.org/images/entities/char_e001.gif) O), 1651 (–C
O), 1651 (–C![[double bond, length as m-dash]](https://www.rsc.org/images/entities/char_e001.gif) O), 1591 (–C
O), 1591 (–C![[double bond, length as m-dash]](https://www.rsc.org/images/entities/char_e001.gif) C–), 1577 (–C
C–), 1577 (–C![[double bond, length as m-dash]](https://www.rsc.org/images/entities/char_e001.gif) C–), 1465 (CH3 bend), 1438 (CH2 bend), 1404 (C–Nstr), 1377 (CH3 sym), 746 (C
C–), 1465 (CH3 bend), 1438 (CH2 bend), 1404 (C–Nstr), 1377 (CH3 sym), 746 (C![[double bond, length as m-dash]](https://www.rsc.org/images/entities/char_e001.gif) Ccis alkene), 727 (C
Ccis alkene), 727 (C![[double bond, length as m-dash]](https://www.rsc.org/images/entities/char_e001.gif) Ccis alkene), 630 (–N–C
Ccis alkene), 630 (–N–C![[double bond, length as m-dash]](https://www.rsc.org/images/entities/char_e001.gif) Obend), 435 (C–N–Cbend). 1H NMR (400 MHz, chloroform-D) δ 8.4 (d, 4H), 8.2 (d, 4H), 5.35 (m, 4H), 4.14 (t, 4H), 1.98 (m, 8H), 1.77 (m, 4H), 1.42 (m, 4H), 1.25–1.29 (m, 40H), 0.86 (t, 6H). 13C NMR (101 MHz, CDCl3) δ 161.84, 132.70, 129.73, 129.34, 128.91, 128.83, 127.75, 124.58, 122.00, 121.55, 58.50, 39.68, 37.12, 31.60, 30.88, 30.77, 30.22, 28.76, 28.71, 28.67, 28.65, 28.60, 28.51, 28.40, 28.36, 28.30, 28.18, 27.05, 26.21, 26.18, 21.66, 13.10. MALDI-TOF: m/z = 890.2427 g calculated for C60H78N2O4 = 890.640.
Obend), 435 (C–N–Cbend). 1H NMR (400 MHz, chloroform-D) δ 8.4 (d, 4H), 8.2 (d, 4H), 5.35 (m, 4H), 4.14 (t, 4H), 1.98 (m, 8H), 1.77 (m, 4H), 1.42 (m, 4H), 1.25–1.29 (m, 40H), 0.86 (t, 6H). 13C NMR (101 MHz, CDCl3) δ 161.84, 132.70, 129.73, 129.34, 128.91, 128.83, 127.75, 124.58, 122.00, 121.55, 58.50, 39.68, 37.12, 31.60, 30.88, 30.77, 30.22, 28.76, 28.71, 28.67, 28.65, 28.60, 28.51, 28.40, 28.36, 28.30, 28.18, 27.05, 26.21, 26.18, 21.66, 13.10. MALDI-TOF: m/z = 890.2427 g calculated for C60H78N2O4 = 890.640.
![[thin space (1/6-em)]](https://www.rsc.org/images/entities/char_2009.gif) :
:![[thin space (1/6-em)]](https://www.rsc.org/images/entities/char_2009.gif) 10) for 5 minutes for the removal of the oxide layer on the surface of the silicon wafer, then with acetone for ∼5 min and later dried with a purging by the stream of N2 gas. Al was thermally deposited on the back surface of the dried silicon wafer by thermal evaporation. On the front surface, ∼120 nm of O-PDI was thermally deposited at the rate of ∼0.1 nm s−1 under the ∼10−5 mbar pressure, and the thickness of the film was monitored using the quartz crystal. Further, ∼100 nm of silver (Ag) fingers were thermally deposited on the O-PDI for the top contact.
10) for 5 minutes for the removal of the oxide layer on the surface of the silicon wafer, then with acetone for ∼5 min and later dried with a purging by the stream of N2 gas. Al was thermally deposited on the back surface of the dried silicon wafer by thermal evaporation. On the front surface, ∼120 nm of O-PDI was thermally deposited at the rate of ∼0.1 nm s−1 under the ∼10−5 mbar pressure, and the thickness of the film was monitored using the quartz crystal. Further, ∼100 nm of silver (Ag) fingers were thermally deposited on the O-PDI for the top contact.
![[double bond, length as m-dash]](https://www.rsc.org/images/entities/char_e001.gif) O stretching peak of the parent molecule at ∼1772 cm−1 and ∼1754 cm−1, with the appearance of new peaks at ∼1693 cm−1 and ∼1651 cm−1, which belong to the imide C
O stretching peak of the parent molecule at ∼1772 cm−1 and ∼1754 cm−1, with the appearance of new peaks at ∼1693 cm−1 and ∼1651 cm−1, which belong to the imide C![[double bond, length as m-dash]](https://www.rsc.org/images/entities/char_e001.gif) O group. This confirmed the introduction of the imide group into the perylene molecule. NMR spectroscopy was used to validate the plausible structure of O-PDI. Fig. S2a (ESI†) depicts the 1H NMR spectra, and Fig. S2b (ESI†) shows the 13C NMR spectra. The proton NMR spectrum revealed highly deshielded eight protons at ∼8.4 ppm and ∼8.2 ppm due to the carbonyl group and the perylene core, with outer field protons being more deshielded. The alkyl group protons exhibit chemical shift values ranging from ∼2.0 ppm to ∼0.80 ppm. Solubility is a critical factor for potential applications, and we prepared a ∼3 mg ml−1 solution in various solvents to assess the solubility of O-PDI. Our observations, shown in Table 1, indicate that O-PDI is readily soluble in benzene-based and halo-group solvents, with further details discussed in the table. We found that O-PDI is soluble in benzene-based solvents (chlorobenzene, toluene, o-xylene, and diphenyl ether) as well as polar aprotic solvents (dichloromethane, THF, 1,4-dioxane, MIBK, NMP, DMF, and DMSO) but insoluble in polar protic solvents (n-butanol, isopropyl alcohol, ethanol, methanol, and water) as well as non-polar solvents (n-hexane and n-heptane).
O group. This confirmed the introduction of the imide group into the perylene molecule. NMR spectroscopy was used to validate the plausible structure of O-PDI. Fig. S2a (ESI†) depicts the 1H NMR spectra, and Fig. S2b (ESI†) shows the 13C NMR spectra. The proton NMR spectrum revealed highly deshielded eight protons at ∼8.4 ppm and ∼8.2 ppm due to the carbonyl group and the perylene core, with outer field protons being more deshielded. The alkyl group protons exhibit chemical shift values ranging from ∼2.0 ppm to ∼0.80 ppm. Solubility is a critical factor for potential applications, and we prepared a ∼3 mg ml−1 solution in various solvents to assess the solubility of O-PDI. Our observations, shown in Table 1, indicate that O-PDI is readily soluble in benzene-based and halo-group solvents, with further details discussed in the table. We found that O-PDI is soluble in benzene-based solvents (chlorobenzene, toluene, o-xylene, and diphenyl ether) as well as polar aprotic solvents (dichloromethane, THF, 1,4-dioxane, MIBK, NMP, DMF, and DMSO) but insoluble in polar protic solvents (n-butanol, isopropyl alcohol, ethanol, methanol, and water) as well as non-polar solvents (n-hexane and n-heptane).

 is the molar extinction coefficient, which describes how strongly a chemical species absorbs incident light at a specific wavelength. This coefficient is an intrinsic property of the chemical species. Due to its intrinsic nature, the molar extinction coefficient is considered constant, and the path length is fixed. Consequently, the material's light absorption is directly proportional to its molar concentration in a given solvent, as shown in eqn (2).15,16 This implies that a higher hyperchromic shift corresponds to a higher concentration, indicating better solubility of the solvent.
 as shown in Table 2. Other solvents, including o-xylene
 dichloromethane
  toluene
  THF
THF  N-methyl 2-pyrrolidone (ε = 23
![[thin space (1/6-em)]](https://www.rsc.org/images/entities/char_2009.gif) 260 M−1 cm−1), diphenyl ether (ε = 10
260 M−1 cm−1), diphenyl ether (ε = 10![[thin space (1/6-em)]](https://www.rsc.org/images/entities/char_2009.gif) 033 M−1 cm−1), methyl iso-butyl ketone
033 M−1 cm−1), methyl iso-butyl ketone  1,4-dioxane
  and dimethylformamide
  exhibited varying molar extinction coefficients for O-PDI. The molar extinction coefficient of PDI can vary with different solvents due to a combination of factors, including solute–solvent interactions, aggregation, conformational changes, and concentration.
![[thin space (1/6-em)]](https://www.rsc.org/images/entities/char_2009.gif) 731
731![[thin space (1/6-em)]](https://www.rsc.org/images/entities/char_2009.gif) 109
109![[thin space (1/6-em)]](https://www.rsc.org/images/entities/char_2009.gif) 140
140![[thin space (1/6-em)]](https://www.rsc.org/images/entities/char_2009.gif) 974
974![[thin space (1/6-em)]](https://www.rsc.org/images/entities/char_2009.gif) 242
242![[thin space (1/6-em)]](https://www.rsc.org/images/entities/char_2009.gif) 260
260![[thin space (1/6-em)]](https://www.rsc.org/images/entities/char_2009.gif) 033
033


![[thin space (1/6-em)]](https://www.rsc.org/images/entities/char_2009.gif) I vs. V plot at V = 0, as shown in Fig. 10(d). Solving eqn 8 allows for the derivation of the expression for the ideality factor (n).
I vs. V plot at V = 0, as shown in Fig. 10(d). Solving eqn 8 allows for the derivation of the expression for the ideality factor (n).
![[thin space (1/6-em)]](https://www.rsc.org/images/entities/char_2009.gif) I vs. V curve. In an ideal diode, n is expected to be unity, indicating ideal behaviour. n is a parameter that reflects the uniformity of the Schottky barrier in the hetero-junction. A more uniform interface between materials will result in the n value closer to unity. However, the device of O-PDI shows the ideality factor of ∼2.55, reverse saturation current (I0) of ∼2.59 nA cm−2, and barrier height (ϕb) of the diode was calculated as ∼0.89 eV. Junction resistances are critical for understanding the electrical parameters of heterojunction devices. In particular, series resistance (Rs) and shunt resistance (Rsh) are widely studied in these devices. The values of Rs and Rsh were determined by analyzing the junction resistance (Rj = ∂V/∂I) versus the bias voltage curve, as shown in Fig. 10(e). In the forward bias region, the minima of the Rjvs. V curve corresponds to the series resistance (Rs) ∼2823 Ω, in the reverse bias region, the maxima of the Rjvs. V curve represents the shunt resistance (Rsh) ∼ 24.21 MΩ.
I vs. V curve. In an ideal diode, n is expected to be unity, indicating ideal behaviour. n is a parameter that reflects the uniformity of the Schottky barrier in the hetero-junction. A more uniform interface between materials will result in the n value closer to unity. However, the device of O-PDI shows the ideality factor of ∼2.55, reverse saturation current (I0) of ∼2.59 nA cm−2, and barrier height (ϕb) of the diode was calculated as ∼0.89 eV. Junction resistances are critical for understanding the electrical parameters of heterojunction devices. In particular, series resistance (Rs) and shunt resistance (Rsh) are widely studied in these devices. The values of Rs and Rsh were determined by analyzing the junction resistance (Rj = ∂V/∂I) versus the bias voltage curve, as shown in Fig. 10(e). In the forward bias region, the minima of the Rjvs. V curve corresponds to the series resistance (Rs) ∼2823 Ω, in the reverse bias region, the maxima of the Rjvs. V curve represents the shunt resistance (Rsh) ∼ 24.21 MΩ.


