
 Open Access Article
 This Open Access Article is licensed under a Creative Commons Attribution-Non Commercial 3.0 Unported Licence
Strengthening polylactic acid (PLA) composites with poly(methyl methacrylate)-functionalized cellulose nanofibrils created through grafting-through emulsion polymerization†
Hathaithep
Senkum
ab,
Peter V.
Kelly
ab,
Ahmad A. L.
Ahmad
 ab,
Siamak
Shams Es-haghi
bc and
William M.
Gramlich
*abd
ab,
Siamak
Shams Es-haghi
bc and
William M.
Gramlich
*abd
aDepartment of Chemistry, University of Maine, Orono, ME 04469, USA. E-mail: william.gramlich@maine.edu
bAdvanced Structures and Composites Center, University of Maine, Orono, ME 04469, USA
cDepartment of Chemical and Biomedical Engineering, University of Maine, Orono, ME 04469, USA
dForest Bioproducts Research Institute, University of Maine, Orono, ME 04469, USA
First published on 19th January 2024
Abstract
Cellulose nanofibrils (CNFs) were surface modified with poly(methyl methacrylate) (PMMA) in water by a grafting-through surfactant free emulsion polymerization scheme resulting in reinforcements that could be straightforwardly dried while maintaining a high specific surface area. These PMMA modified CNFs contained 40 wt% PMMA, could be filtered to remove most the of water, and subsequently dried under vacuum to yield powders that could be directly used as reinforcements for composites. The PMMA modification prevented fibrillar collapse upon drying yielding high specific surface area (ca. 50 m2 g−1) and surface energy similar to PMMA. Once melt compounded into PLA, PMMA modified CNFs led to composites with a tensile strength of 79 MPa, a nearly 30% increase over neat PLA, at 20 wt% loading of the reinforcement. The mechanism of improvement was attributed to the improved interfacial compatibility between the PMMA modified CNFs and the PLA as confirmed by surface energy measurements and the ability of the reinforcement to disperse within the PLA matrix as confirmed by imaging and rheological measurements. Overall, this work demonstrates that a scalable water-based modification can be used to create CNF reinforcements for PLA composites that significantly improve mechanical properties without complex drying and solvent exchange processes.
1. Introduction
Polylactic acid (PLA) is derived from naturally renewable resources and due to its biocompatibility and degradability it has been used in packaging materials, textiles, biomedical devices, and as a resin for additive manufacturing (AM) or 3D printing.1 However, its mechanical properties are not always sufficient for durable goods and structural applications where materials such as carbon fibre reinforced acrylonitrile-butadiene-styrene copolymer (ABS) are often used. To address the tensile strength and Young's modulus limitations, PLA has been compounded with other materials, yielding composites,2 to help improve the mechanical performance. For example, glass fibre3,4 and carbon fibre5,6 reinforced PLA composites demonstrate excellent thermal-resistance and mechanical properties. While PLA is industrially compostable and sourced from renewable sources, glass fibre and carbon fibre are not, reducing the sustainability and recyclability of the composite.7,8Cellulose nanomaterials (CNMs) are naturally sourced and have rapidly drawn attention as reinforcements in polymer composites due to their abundance, biodegradability, and sustainability. Such reinforcement properties are attributed to their high aspect ratio, high specific strength, and modulus; thus, they have been investigated extensively as reinforcements for PLA composites.9–12 Mechanically refined cellulose nanofibrils (CNFs) are a class of CNMs produced under high shear that exhibit a branched hierarchical architecture with fibril diameters ranging from the tens of nanometers to a few micrometers.13 CNFs have a hydrophilic character due to the prevalence of hydroxyl groups on their surfaces. As a result, CNFs tend to aggregate into dense monoliths or particles using drying techniques like oven drying and spray drying due to capillary forces and hydrogen bonding.14 These materials do not significantly improve composite properties as expected for a nano-reinforcement.15–17 Freeze drying and supercritical CO2 drying can preserve the fibril structure although industrial application is challenging due to costly energy consumption.14 Methods such as solvent casting (i.e., dissolving the polymer in a good solvent to mix in the CNFs) have also been used to create reinforced CNF/PLA composites,18–21 but environmental and scalability issues exist due to the use of organic solvents. If the fibrillar morphology of CNFs could be retained through an industrially relevant process like convection drying at high solids, CNF thermoplastic composites could become more scalable through typical compounding techniques.
In addition to drying challenges, the agglomeration of hydrophilic CNFs in a hydrophobic polymer matrix reduces the mechanical properties of the resultant polymer composites. Thus, CNFs have been modified through numerous methods to change their surface chemistry22 and compatibilize their interface with the PLA thermoplastic matrix.23,24 These surface modifications help mitigate the aggregation from hydrogen bonding and favour uniform dispersion of the CNMs in the polymer matrix.25,26 The surface coating of CNFs with polymeric materials, either through covalent attachment or adsorption, has been shown to improve the dried morphology of CNFs as well, retaining more of the desired fibrillar architecture.27–30 In recent work by Kelly et al., the grafting-through polymerization of water-soluble polymers to CNFs was demonstrated to improve the fibrillar morphology of spray dried powders along with the mechanical properties of subsequent melt-mixed PLA composites.31 These polymeric surface coatings can control the surface chemistry and thickness of the interface between the reinforcement and the matrix through variations in the polymerization techniques, demonstrating a high degree of tunability. Furthermore, the polymer coating can be tuned to match the desired thermoplastic matrix. For example, PLA,32,33 poly(ethylene oxide) (PEO),26 and poly(methyl methacrylate) (PMMA)25 polymer coatings have been employed to compatibilize CNMs with PLA. However, an ongoing challenge to employ polymer grafted CNMs in practice is developing chemistry that can be performed in the aqueous environment in which CNFs are produced, is compatible with scalable drying techniques in water such as convection and spray drying, and provides a significant improvement in mechanical properties using industrially relevant methods for production and compounding.
Herein, we report a method to reinforce PLA with CNFs produced through mechanical refinement using a completely aqueous polymer grafting-through technique that enables industrially relevant purification and compounding methods. PMMA was selected to coat the surface of CNFs because its monomers undergo surfactant free emulsion and grafting polymerizations to coat CNFs in their native suspension. Furthermore, due to the hydrophobicity of PMMA, it was expected to increase the contact angle of water significantly compared to cellulose, reducing the capillary forces that cause irreversible fibril collapse and aggregation while drying. Irreversible fibril collapse must be prevented for efficient mixing in the PLA matrix. Additionally, PMMA demonstrates miscibility in PLA, so it was expected to improve the compatibility and improve dispersion in the PLA matrix.
To this end, the CNF surfaces were functionalized with PMMA through a grafting-through surfactant free emulsion polymerization after initial methacrylation of the CNF surface to reinforce PLA.30 Since previous work with polystyrene modified CNFs indicated that the polymerization conditions affected the morphology of the collected reinforcement,30 we hypothesized that changing the initiator concentration would lead to reinforcements with different properties. Thus, we explored how the polymerisation initiator concentrations affected the chemical composition of the PMMA modified CNFs (PMMA-MetCNFs) and subsequent properties of the reinforcement and composites. The increased hydrophobicity of the PMMA-MetCNFs facilitated dewatering by vacuum filtration, which significantly reduced the amount of water that needed to be evaporated. Furthermore, this coating preserved the fibrillar CNF morphologies after vacuum drying with limited aggregation, which was expected to lead to improved mechanical properties. These dried reinforcements could be ground into smaller macroscopic particles and then melt compounded into PLA. These PMMA-MetCNF reinforced PLA composites demonstrated significant improvements in tensile performance at higher reinforcement loading. Changing the polymerization conditions to synthesize PMMA-MetCNFs influenced the corresponding composite morphology and tensile behaviour.
2 Experimental
2.1 Materials
Polylactic acid (PLA) (Ingeo Biopolymer 4043D) with the properties of 94% L-lactic acid content, a melting point in a range of 145–160 °C, a number average molecular weight (Mn) of 67![[thin space (1/6-em)]](https://www.rsc.org/images/entities/char_2009.gif) 000 g mol−1, and a density of 1.24 g cm−3 was purchased from NatureWorks LLC (Minnesota) and used as received. Cellulose nanofibrils (CNFs) with 90% fines and 3 wt% in water suspension were received from the Product Development Center (PDC), University of Maine.34 The CNFs were prepared from northern bleached softwood kraft pulp following a patented process. The chemical and dimensional properties of these CNFs have been reported.13,35 Potassium persulfate (KPS), methacrylic anhydride, and sodium hydroxide were purchased from commercial sources and used as received unless otherwise noted. Methyl methacrylate monomer (MMA) was purified to remove the inhibitors by vacuum distillation before use. Methacrylate-modified cellulose nanofibrils (MetCNFs) were synthesized as previously reported.36
000 g mol−1, and a density of 1.24 g cm−3 was purchased from NatureWorks LLC (Minnesota) and used as received. Cellulose nanofibrils (CNFs) with 90% fines and 3 wt% in water suspension were received from the Product Development Center (PDC), University of Maine.34 The CNFs were prepared from northern bleached softwood kraft pulp following a patented process. The chemical and dimensional properties of these CNFs have been reported.13,35 Potassium persulfate (KPS), methacrylic anhydride, and sodium hydroxide were purchased from commercial sources and used as received unless otherwise noted. Methyl methacrylate monomer (MMA) was purified to remove the inhibitors by vacuum distillation before use. Methacrylate-modified cellulose nanofibrils (MetCNFs) were synthesized as previously reported.36
2.2 Synthesis of poly(methyl methacrylate) grafted MetCNFs (PMMA-MetCNFs) by surfactant free emulsion polymerization
Surfactant free emulsion polymerization was conducted under a nitrogen atmosphere. The reaction was performed using molar ratios of MMA to anhydrocellobiose to KPS of 50:1:0.06 and 50:1:0.12 with the MetCNF dispersion at 0.3 wt% (solids basis) in reverse osmosis (RO) water. In a typical reaction for the 50:1:0.06 molar ratio, a 0.3 wt% MetCNF dispersion was prepared by dispersing 12.78 g MetCNFs (solid basis) in RO water in a 5000 mL three-neck round bottom flask (RBF) equipped with rubber septa. The stirring setup consisted of a glass adaptor equipped with a Teflon stirrer bearing, a glass stirrer shaft, and a PTFE stirrer blade connected to an overhead mixer. The MetCNF dispersion was sparged with nitrogen for 1.5 h to eliminate oxygen dissolved in water. After that, the suspension was heated to 80 °C in an oil bath. Then, 198 mL of purified MMA (0.440 M) was injected into the preheated suspension and followed with 18.5 mL KPS solution from a 0.129 M freshly prepared stock solution of KPS in RO water to give 0.571 mM KPS in the suspension to start the emulsion polymerization. For the 50:1:0.12 MMA:anhydrocellobiose:KPS conditions, the KPS stock solution concentration was increased to 0.258 M, giving a 1.14 mM KPS concentration in the suspension. The reaction was run for 3 h and terminated by exposing the reaction to the air for 30 minutes. The milky suspension and particulate cellulose products (PMMA-MetCNFs) were vacuum filtered to collect the PMMA-MetCNFs and the milky suspension was kept for further analysis of the PMMA homopolymers. The collected PMMA-MetCNFs were washed with RO water by mixing the materials in about 500 mL RO water, stirring it for 10 minutes, and vacuum filtering again. These washing steps were repeated until the filtered liquid was no longer cloudy and subsequent aliquots showed no changes in the FTIR spectra of the powder. The collected PMMA-MetCNFs were then dried under a vacuum in a freeze-dryer without initial freezing. After drying for approximately 4 days, the particulate PMMA-MetCNF products were ground into powders using a laboratory mortar and pestle.
2.3 Composite preparation by melt compounding and tensile bar fabrication
To prepare the PLA composites with fibril reinforcements, the PLA pellets and reinforcements were dried in a vacuum oven at 50 °C at least 24 h before use. First, the PLA pellets were melted inside an Intelli-Torque Plasti-Corder half-size mixer (C.W. Brabender Instruments, New Jersey) at 175 °C and mechanically mixed at 60 RPM until the torque and temperature stabilized after approximately 3 minutes. Second, the corresponding amount of ground PMMA-MetCNF (50:1:0.06 or 50:1:0.12 conditions) reinforcement was added to yield the target reinforcement loading (5, 10, 20, or 30 wt%). The mechanical melt mixing was carried out for approximately 5 minutes until the torque and temperature stabilized, indicating that the compound had been well mixed. Last, the resulting composites were collected and kept under ambient conditions until further testing.
Following the specifications of ASTM standard D638-14, type V dog-bone tensile samples of the PMMA-MetCNF composites were made through compression molding using a Qixing (Wuhan, CN) Laboratory Mini Hot Press. A thin sheet of composite was generated from melting the composite samples in a square mold (100 mm × 100 mm × 1.8 mm) under heat at 175 °C by contacting with platens without applied force for 5 minutes, then compressing the molten samples at 5 MPa for 5 minutes, and cooling down to approximately 30 °C with the internal water-cooling system under compression. Then, the composite sheets were cut into strips that were compressed into the Type V dog-bone tensile molds (ASTM standard D638-14), following the same pressing procedure as mentioned above. The composite bars were left under ambient conditions to equilibrate at least 24 h before tensile testing.
2.4 Characterization
 | (1) |
:1:0.06) materials were measured with a mobile surface analyser (Kruss), using a 1 μL droplet of water at 20 °C. The spray-dried CNFs were prepared by spraying a 0.35 wt% solids CNF suspension through a nozzle with a compressed air flow rate of 540 L h−1, a liquid feed rate of 7.5 mL min−1, and nozzle temperature of 170 °C, using a B-290 Buchi Mini Spray Dryer (New Castle, Deleware).31 The samples were prepared by compressing the CNF sample powders on a clean glass slide at room temperature at approximately 500 psi for 5 minutes. Prior to measurement, the water droplets were equilibrated on the sample surfaces for 15 s and 4 spots were analyzed and averaged by using the measured angles from the left and the right sides of the droplets.
:1:0.06 and 50:1:0.12 conditions) using an inverse gas chromatography (iGC) system (iGC-SEA, Surface Measurement Systems, London, UK). PLA pellets were ground using an IKA MultiDrive Control (Wilmington, North Carolina) to yield a powder for analysis. Samples were packed in 4 mm silanized glass columns sealed with silanized glass wool. Octane was used for the Brunauer–Emmett–Teller (BET) analysis of the dried samples. The BET constant (c) was found by plotting absorbed octane moles (n) at different equilibrium vapor pressures (p) and fitting to eqn (2): | (2) |
:1:0.06 and 50:1:0.12) using the same iGC system and packed columns as described above. Surface energy measurements were carried out at 50 °C with a flow rate of 15 standard cm3 per min, utilizing four nonpolar probes (hexane, heptane, octane, and nonane) and two polar probes (ethyl acetate and dichloromethane). Ethyl acetate served as an electron donating probe while dichloromethane served as an electron accepting probe. To calculate the surface energy heterogeneities, methane injections were employed to measure the dead volume within the system, which was then subtracted from the retention volume of each probe's elution curve to compute a net retention volume for analysis. The elution curves of each probe were fit by the instrument's software to find the peak centre of mass which was used to calculate retention times. The probes were run at five different surface coverages (0.01, 0.02, 0.03, 0.05, and 0.10 n/n0), where (n) represents the number of moles of probe gas on the surface, and (n0) represents the number of moles required to form a surface monolayer.
The surface energetics were calculated using the Good-van Oss-Chaudhury method to generate the dispersive (γd) and acid–base (γsp) components of the surface energy, which were reported on the Della Volpe scale and used to calculate the total surface energy (γ). The γsp was further divided into the donor (γ−) and acceptor (γ+) pairs. The works of cohesion (Wcoh) and a work of adhesion (Wadh) with PLA were calculated for both PMMA-MetCNFs using eqn (3) and (4) respectively:
 | (3) |
 | (4) |
 | (5) |
3. Results and discussion
3.1 Synthesis of PMMA-MetCNFs
The functionalization of PMMA onto CNFs was performed through a grafting-through surfactant free emulsion polymerization (SFEP) (Fig. 1), building upon our previous work using methacrylate-functionalized CNFs (MetCNFs) as the reactive handles.31,36 In previous work, the SFEP of methyl methacrylate (MMA) was carried out in a 0.5 wt% suspension of MetCNFs in water, but we hypothesized that lower monomer and CNF concentrations during the reaction would help retain the fibrillar architecture to a greater extent. In this work, the reactions were carried out at 0.3 wt% MetCNFs (Fig. 1a). This polymerization method generated three populations of material: free PMMA homopolymer particles as an emulsion, covalently grafted copolymers of PMMA with the reactive methyl methacrylate handles on the MetCNF surfaces, and noncovalently bound PMMA homopolymer that coated the PMMA-MetCNF particles. During polymerization, the initial MetCNF suspension transformed into a mixture of PMMA-MetCNF solid particles and PMMA latex. The resulting mixture was filtered by vacuum filtration to separate PMMA-MetCNFs from the stable PMMA polymer particles in the suspension. The PMMA-MetCNFs could be collected at up to 14% solids after vacuum filtration, which is a significant amount of dewatering from the original 0.3 wt% suspension. This significant water reduction (∼98%) provides a potential energy savings because less water needs to be evaporated as compared to spray drying that often operates at 0.35–2 wt% solids.14,31,40 After water washing and collection by vacuum filtration, the resulting granule-like products were dried under vacuum and retained their original morphology after the initial filtration. The dry PMMA-MetCNFs could be ground into powders without aggregation, which was significantly different from the dry aggregated unmodified CNFs after filtration, drying, and grinding (Fig. 1b). This suggests that the functionalization of PMMA onto the MetCNF surfaces could mitigate the hydrogen bonding between fibrils and reduce the capillary forces that agglomerate fibrils during drying.41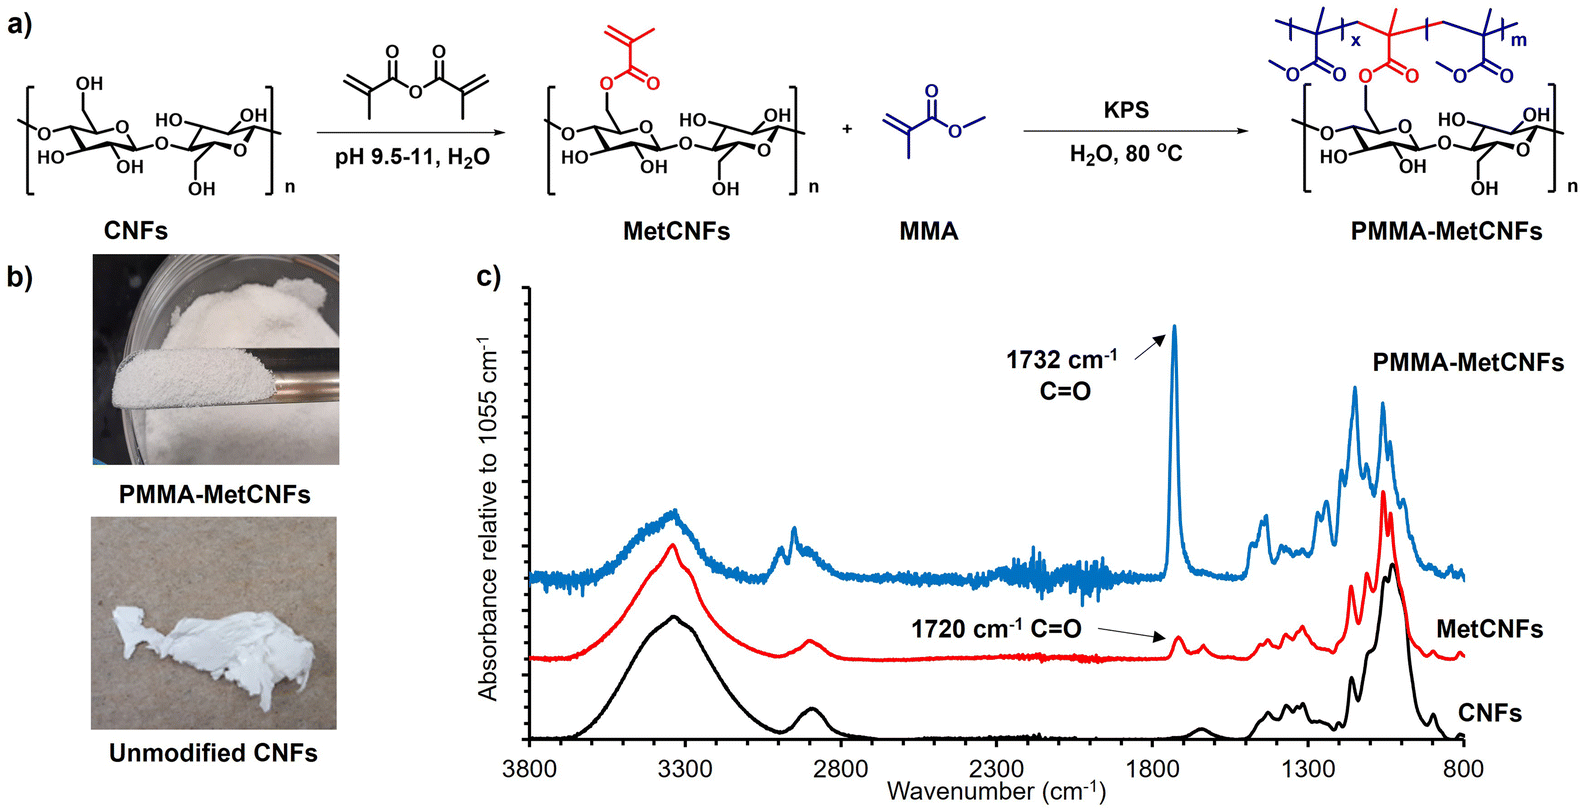 | ||
| Fig. 1 (a) Synthetic pathway for the functionalization of cellulose nanofibrils (CNFs) with poly(methyl methacrylate) (PMMA-MetCNFs) in water. (b) Images of unmodified CNFs and PMMA-MetCNFs (50:1:0.06) (MMA:anhydrocellobiose:KPS molar ratio) after vacuum drying and grinding. (c) ATR-IR spectra of unmodified CNFs, MetCNFs, and PMMA-MetCNFs (50:1:0.06). Spectra are normalized to the C–O stretching band of the cellulose at 1055 cm−1 and shifted vertically to improve clarity. | ||
Upon functionalization of CNFs with the methacrylate group to produce MetCNFs, a new band was visible at 1720 cm−1, corresponding to the carbonyl group of the methacrylate group. ATR-IR spectra of PMMA-MetCNFs exhibited new bands that overlapped with those with MetCNFs. For example, new overlapping bands were visible at 1732 cm−1 and 3100–2800 cm−1, corresponding to the ester carbonyl groups and C–H stretching, respectively. These bands are consistent with PMMA,42 highlighting the successful PMMA functionalization (Fig. 1c). The amount of PMMA on the CNF surfaces was quantified by comparing the relative band intensities between the methacrylate carbonyl at 1732 cm−1 and the C–O stretch in the cellobiose backbone at 1055 cm−1 to an FTIR calibration curve for poly(methyl methacrylate) modified CNFs reported previously.36 For the 50:1:0.06 conditions, PMMA was 39 ± 6 wt% of the collected sample. This polymer grafting result is comparable to previously reported grafting-from polymerizations of MMA off CNFs.43 A higher radical initiator concentration (50:1:0.12) was also used for the polymerization to probe whether more radicals during the polymerization would change the morphology of the PMMA-CNFs due to changes to polymerization kinetics and the molecular weight of the PMMA. This higher initiator concentration yielded PMMA-CNFs with 41 ± 6 wt% PMMA, which was similar to the lower radical concentration polymerization conditions and suggests that these changes do not significantly affect the amount of PMMA on the CNFs.
Previous work modifying CNFs with polystyrene using this same grafting-through process (PS-CNFs) demonstrated that the SFEP process and subsequent water washing of the product led to polymer coating the CNFs that was both covalently and non-covalently attached.30 We hypothesized that the SFEP with MMA could also create these two populations of polymer on the surface of the reinforcement. After extracting the non-covalently bound using DCM, the 50:1:0.06 and 50:1:0.12 conditions had 32 ± 5 and 32 ± 5 wt% covalently bound PMMA, respectively (Table S1 and Fig. S1, S2†). The identical amount of covalently bound PMMA indicates that the higher initiator concentration also did not affect the degree of grafting-through polymerization on the MetCNFs. Similarly, the dry PMMA-MetCNFs (50:1:0.12) could be ground into powder without aggregation after vacuum drying, suggesting that the increased initiator concentration still prevented fibril aggregation (Fig. S2†) likely due to both PMMA-MetCNFs having the same amount of PMMA. Interestingly, since the amount of total and covalently bound PMMA on both PMMA-MetCNFs were relatively similar, any impact of the initiator concentration on the subsequent composite tensile properties would likely be due to the polymer chain architecture and PMMA-MetCNF reinforcement structure and not the overall PMMA content.
SEC analysis of the free PMMA particles (i.e., filtrate from the purification) originated from the SFEP reaction for each polymerization indicate that different initial initiator concentrations had small and insignificant effects on the overall molecular weight of polymer in these free particles as demonstrated by similar elution curves (Fig. S3†). The peak of the higher initiator conditions (50:1:0.12) elution curve did shift slightly to lower molecular weight as compared to the lower initiator conditions, which is consistent with the higher initiator concentration initiating more polymer chains at a constant monomer concentration (Table S2†). The noncovalently bound PMMA was extracted from the surface of the PMMA-MetCNFs and analysed by SEC as well (Fig. S3†) yielding similar results for both polymerization conditions. This noncovalently bound polymer is expected to be from polymer particles from the suspension trapped in the CNF network and polymer that formed through polymerization in the monomer swollen grafted polymer layer on the CNFs.30 The noncovalently bound polymer had a lower peak molecular weight than the free polymer particles confirming that it is not only free polymer particles trapped in the CNF network, but also polymer polymerized on the monomer swollen surface of the PMMA-MetCNFs. The polymer covalently bound to the surface of the PMMA-MetCNFs could not be removed easily through hydrolysis of the ester bond nor enzymatic degradation of the cellulose and thus, could not be analysed. The difficulty in removing the covalently bond PMMA is likely due to multiple methacrylates off the CNFs being incorporated into a single PMMA chain, which would all need to be hydrolysed to be removed from the surface, along with the protective effects of the PMMA coating which could make reactions with the surface bound esters difficult.
3.2 Properties of dried PMMA-MetCNFs
After the functionalization of the CNF surfaces and drying, the PMMA-MetCNFs were expected to be hydrophobic due to prevalent PMMA on the CNF surfaces. Static water contact angles on PMMA-MetCNFs surfaces were on average above 90° (99° ± 7°), whereas the spray-dried unmodified CNF surfaces could not be imaged in the 15 s timeframe (Fig. S4†). A more thorough surface energy analysis of the two PMMA-MetCNFs was performed by inverse gas chromatography (iGC) (Fig. 2 and Table S3†). At low surface coverage of the probe molecule (n/n0), both PMMA-MetCNFs had similar surface energy components and overall surface energy that then plateaued as the probe coverage increases. This behaviour is expected because at low surface coverages molecules preferentially bind to the highest energy sites and as the amount of probe molecules increases, more of the lower energy remaining sites interact with the probe molecules and contribute to the measured surface energy, consequently at high coverage the data is more representative of the total surface.44 Interestingly, the dispersive component (γd) energies deviated for the two reaction conditions at about 0.05 n/n0 with the γd for the 50:1:0.06 condition decreasing below that of the 50:1:0.12 conditions (Fig. 2a). Similarly, the acid–base component (γsp) of the two samples deviated at this coverage as well (Fig. 2b), which consequently led to the 50:1:0.06 condition having the lowest total surface energy (Fig. 2c). At all surface coverages measured both PMMA-MetCNF samples had lower total surface energies than has been reported in literature for spray-dried particles of the CNF starting material, demonstrating that this surface modification significantly increases the hydrophobicity of the material.31
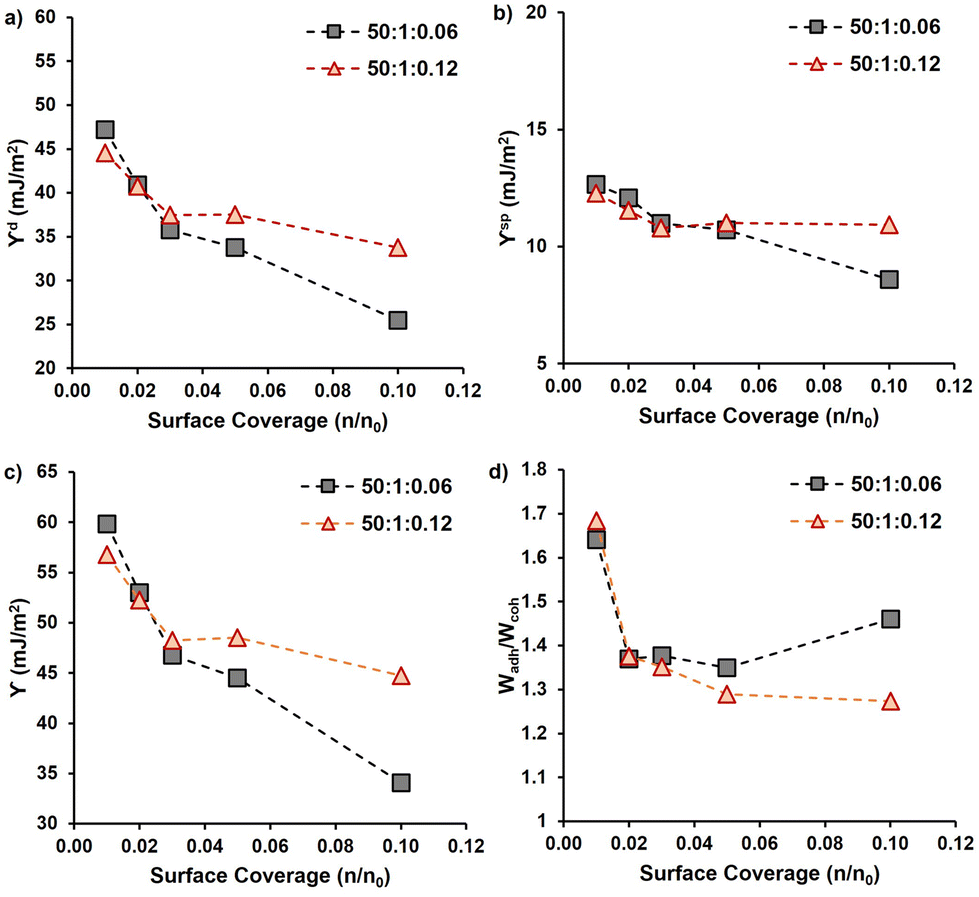 | ||
| Fig. 2 (a) Dispersive components (γd) and (b) polar components (γsp) of surface energy as well as (c) total surface energy (γ) and (d) the calculated ratio of the work of adhesion to PLA (Wadh) to work of cohesion (Wcoh) for PMMA-MetCNFs (50:1:0.06 and 50:1:0.12) samples at different total fractional surface coverages of probe gasses (n/n0). | ||
The different surface energy behaviours of the two PMMA-MetCNFs is interesting since the ATR-FTIR analysis indicated that the functionalization of PMMA was the same for both samples, which could be expected to lead to both materials having the same surface energetics that are close to that of PMMA. Literature reports the γd of PMMA to be 27–40 mJ m−2 under similar iGC conditions to this study and using contact angle measurements.45–47 Both PMMA-MetCNF samples had values in this range suggesting that the probe molecules only interact with PMMA and not the cellulose, suggesting that the CNFs are completely covered with PMMA. However, the deviation of the surface energetics of the two suggests that differences do exist at the surface of these two materials. If the surface coverage of the higher energy cellulose (γd ∼ 50 mJ m−2)31 by the lower surface energy PMMA is incomplete, the measured surface energies would be a root mean squared combination of those of the two compounds weighted by the surface fractions of each component, resulting in higher surface energy for that sample.48 Thus, the 50:1:0.06 condition may have more complete coverage of the cellulose surface than the 50:1:0.12 condition, reducing the surface energy. Additionally, the higher concentration of initiator for the 50:1:0.12 condition could have incorporated more hydrophilic initiator fragments into the PMMA, increasing the observed surface energy of this material as well.
Using the measured surface energy values, the work of cohesion (Wcoh), which is the work required to generate two new surfaces from a single material, and the work of adhesion (Wadh), which is the work required to separate the interface between two different materials, could be calculated (Fig. 2d). Previous work has demonstrated that when the Wadh is greater than the Wcoh (Wadh/Wcoh > 1), preferential interactions exist between the two materials. Additionally, improved composite behaviour has been observed in these cases.31,49 Both PMMA-MetCNF samples had Wadh/Wcoh values greater than one when compared to PLA, with the 50:1:0.06 condition ratio being greater than that of the 50:1:0.12 condition due to its lower surface energy. Consequently, we predicted that both reinforcements should interact favourably with the PLA matrix.
The addition of PMMA to the surface of CNFs significantly reduced the fibril aggregation during drying and grinding. The SEM images of unmodified CNFs after vacuum drying and grinding indicated large particle sizes and tightly aggregated fibrillar morphologies from interfibrillar hydrogen-bonds and capillary forces (Fig. S5a and b†).41,50 In comparison, the images of both ground PMMA-MetCNFs (50:1:0.06 and 50:1:0.12) had smaller apparent particle sizes, more fibrillar morphologies, and sub-micrometre fibrillar structures (Fig. 3 and S5c–f†). Spherical PMMA polymer particles were observed in the SEM images (Fig. 3), confirming our hypothesis that some of the free PMMA particles were trapped in the network and contribute to the noncovalently bound PMMA measured. The fibrillar morphologies suggest that PMMA located on the fibril surfaces helped mitigate hydrogen bonding and capillary forces during drying, consequently favouring grindable and separatable fibrils.
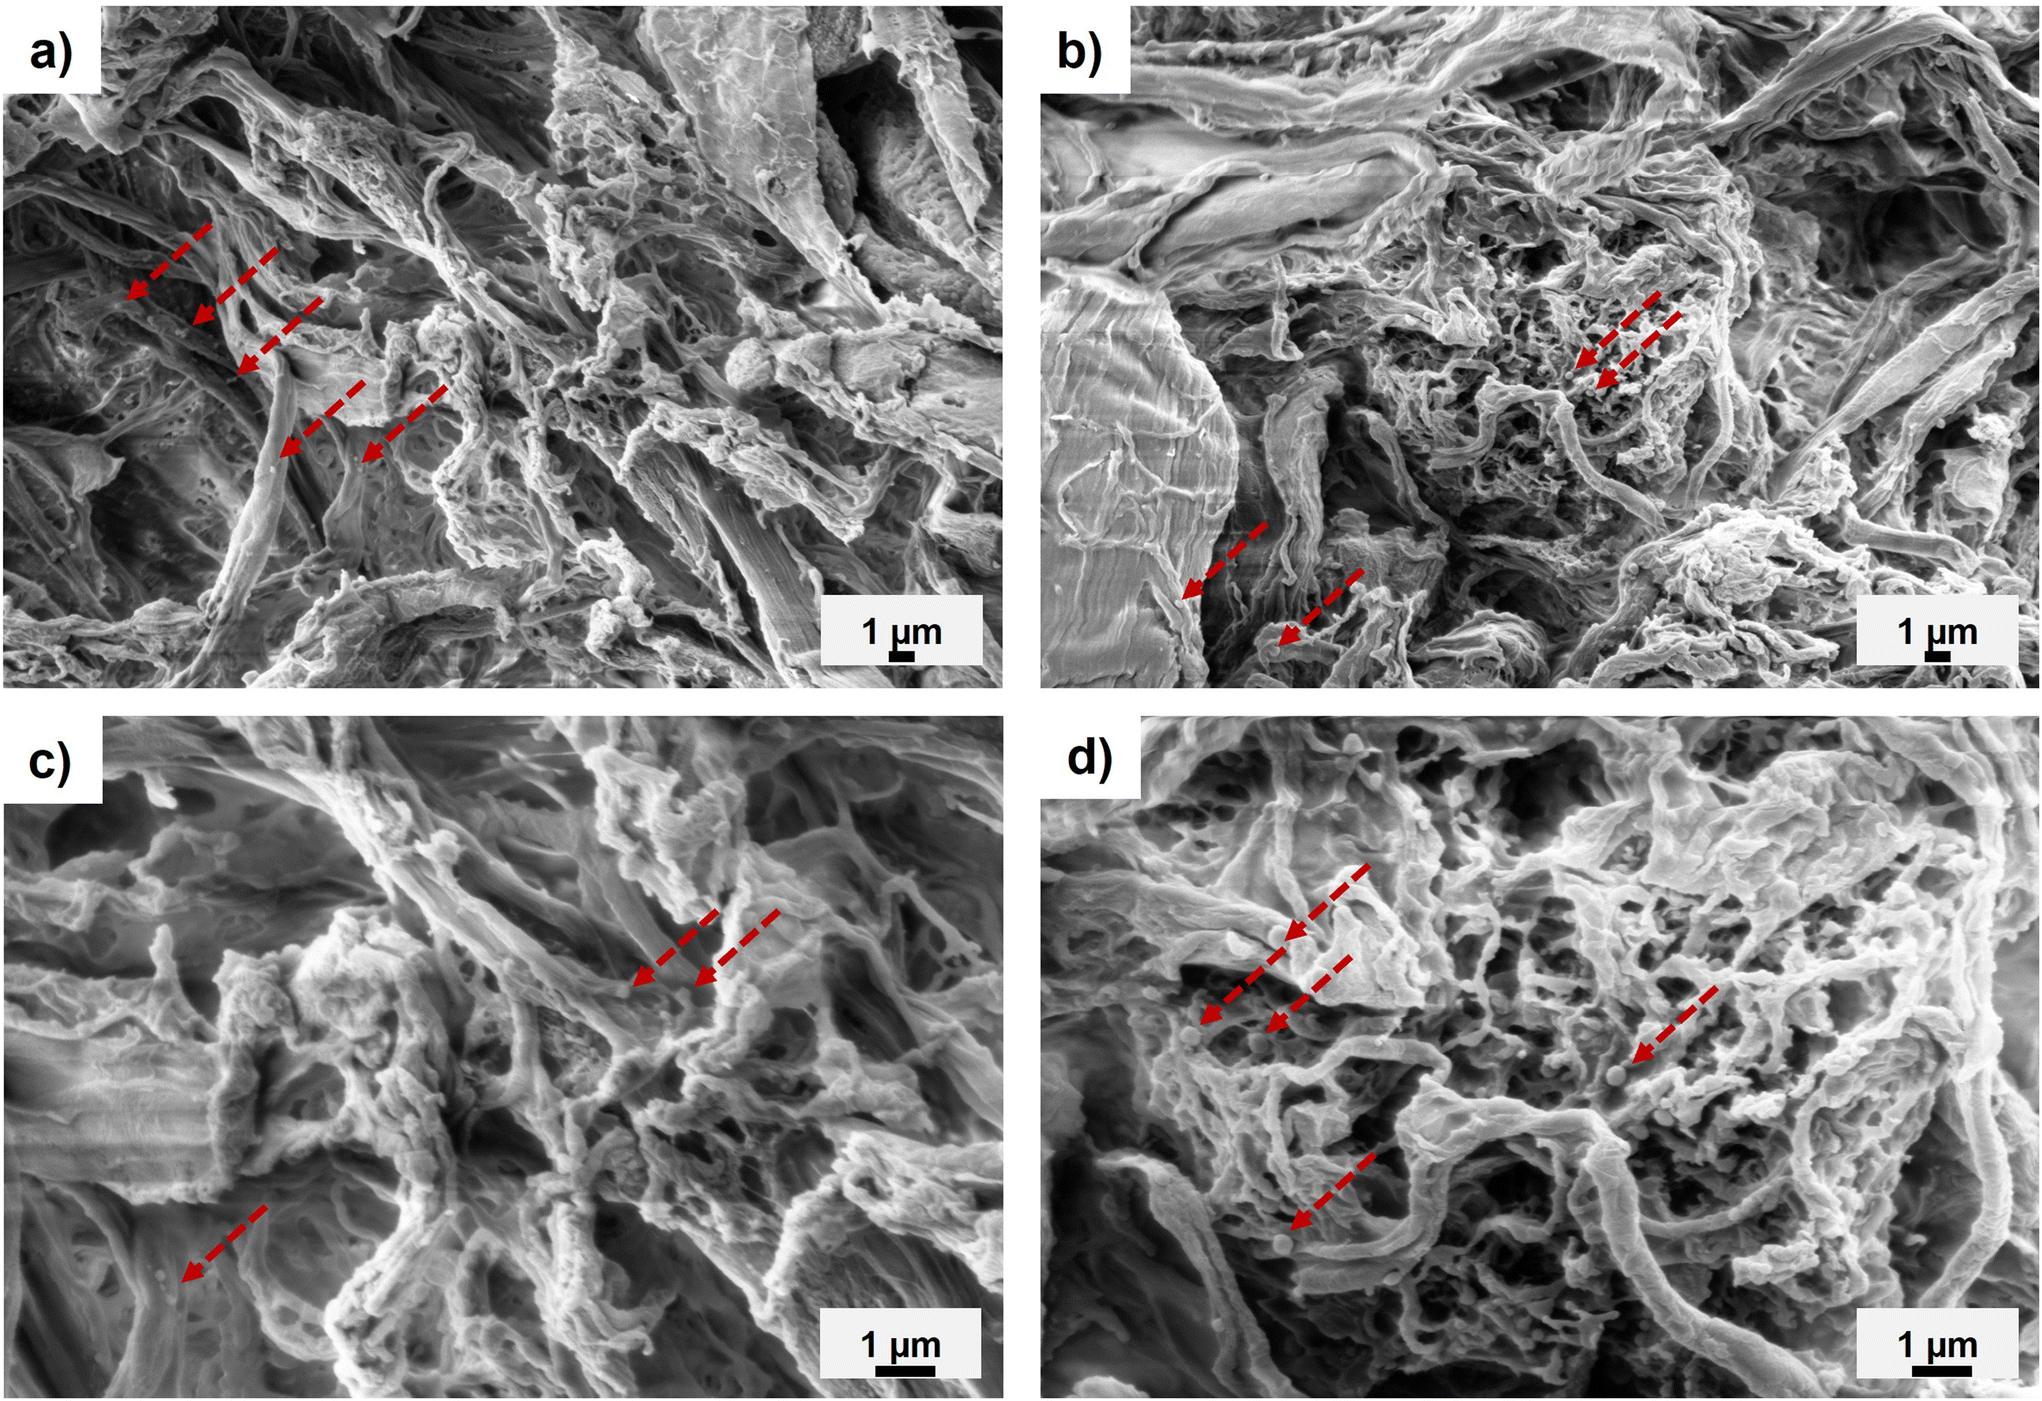 | ||
| Fig. 3 Representative SEM images of the PMMA-MetCNFs at 3000× magnification (top) and 7000× magnification (bottom) for (a & c) PMMA-MetCNFs (50:1:0.06) and (b & d) PMMA-MetCNFs (50:1:0.12). Red arrows point to example PMMA particles on the CNF surfaces. | ||
While the SEM images (Fig. 3) provide a qualitative analysis of the microstructure of the dried PMMA-MeCNFs, quantifying the distribution of fibril sizes is challenging due to the difficulty identifying a singular fibril and avoiding selection bias. Using iGC, BET specific surface area (SSA) measurements can provide a quantitative analysis of the free surface area in the material, which should correspond to the degree of fibrillation in the dry sample. The PMMA-MetCNF samples (50:1:0.06) and (50:1:0.12) were found to have SSA values of 48.6 and 50.7 m2 g−1, respectively. These SSA values are significantly higher than the 4.1 m2 g−1 SSA reported for spray dried CNFs made from the same CNF suspension,31 indicating that significantly more fibrillar structure is retained by the PMMA modification without relying on spray drying. Comparisons with other drying literature is challenging since the suspension morphology of mechanically refined CNFs can vary significantly due to processing and starting material. However, some comparisons can be made. Reported SSA values for mechanically produced CNFs dried through freeze-drying in water or “cryogels” range from 20 to 30 m2 g−1.51,52 The SSA of these cryogels can be increased to ca. 70 m2 g−1 with “cryogenic freeze drying”51 and 100 m2 g−1 with solvent exchange and then freeze drying.52 The ca. 50 m2 g−1 observed for the PMMA-MetCNFs without freeze drying places their SSA between traditional cryogels and those made from cryogenic freeze drying.
After removing the non-covalently bound PMMA, the PMMA-MetCNFs retained their sub-micrometre, fibrillar morphology (Fig. S6†). The surface appeared smoother and no PMMA particles were observed, suggesting that the noncovalently bound PMMA led to some of the original roughness observed (Fig. 3). The PMMA-MetCNF particles were still retained and not dispersed into individual fibrils after DCM treatment (Fig. S6†) suggesting that each PMMA-MetCNF particle has high interfibrillar connectivity. This connectivity could be due to physical fibril-fibril connections and PMMA polymer chains essentially crosslinking fibrils to each other. Since the fibrils of the PMMA-MetCNFs did not collapse into dense monoliths upon removal of the non-covalently bound PMMA, the covalently bound PMMA on the fiber surfaces is sufficient to reduce interfibrillar hydrogen bonding and capillary interactions when removing organic solvents as well.
3.3 Tensile properties of PLA composites with PMMA-MetCNF reinforcements
The PMMA-MetCNF powders were hypothesized to disperse uniformly in the PLA matrix during melt compounding because of their small particle sizes, high surface area, and the preferential surface interactions between PMMA and PLA.53 To test how the PMMA-MetCNFs influence the tensile strength of PLA as reinforcement fillers, both ground PMMA-MetCNFs (50:1:0.06 and 50:1:0.12) without DCM treatment were melt compounded into PLA at 175 °C with varying reinforcement loadings: 5, 10, 20, and 30 wt%. TGA data indicated no degradation of the PMMA-MetCNFs below 200 °C (Fig. S7†), indicating that significant degradation should not occur during composite preparation. Compounding the PMMA-MetCNFs in PLA did not decrease the thermal stability of the PLA matrix (Fig. S8 and S9†). Peak degradation rates were observed around 335 °C, which is consistent with reported PLA degradation at the same heating rates used here.54
The PMMA-MetCNF composites demonstrated improved tensile strengths relative to pure PLA (62 ± 3 MPa) (Fig. 4a). The strengths of the PMMA-MetCNF (50:1:0.06) composites increased with higher reinforcement loadings, plateauing at 20 wt% and demonstrating an ultimate tensile strength of 79 ± 3 MPa, a 27% improvement from pure PLA (Table S4†). This dramatic enhancement was only observed at 20 and 30 wt% PMMA-MetCNFs (Fig. 4a), suggesting that an interconnected network was formed in the PLA matrix at these higher reinforcement levels. These results are consistent with the fibrillar structures of the PMMA-CNFs being preserved by favourable compatibility with the PLA matrix during melt blending. Conversely, the PMMA-MetCNF (50:1:0.12) composites had a modest 9% improvement of the tensile strength at 5 wt% reinforcement (68 ± 2 MPa) that was consistent to 20 wt% reinforcement (68 ± 3 MPa) and even reduced at 30 wt% (59 ± 7 MPa). The larger standard deviation of the 30 wt% tensile data and reduced properties suggest a worse dispersion of the fibrils in the PLA matrix as compared to the PMMA-MetCNF (50:1:0.06) composites. These results are consistent with other natural fibre reinforcements that have an optimal reinforcement loading. These reinforcements act as defect sites at higher loading because of issues with dispersion and interfacial adhesion.55
 | ||
| Fig. 4 (a) Tensile strength and (b) tensile modulus of PMMA-MetCNF composites with varying reinforcement content for both higher (50:1:0.12) and lower (50:1:0.06) values of KPS initiator used during synthesis. Error bars indicate one-standard deviation (n ≥ 3). The black solid lines indicate the average value for neat PLA and the black dashed lines indicate the standard deviation of this value. | ||
The modulus of all PMMA-MetCNF composites increased compared to neat PLA (3.2 ± 0.1 GPa) (Fig. 4b), demonstrating a systematic increase with reinforcement loading (Table S4†). Interestingly, at 20 and 30 wt% reinforcement content, the PMMA-MetCNFs made with a lower KPS concentration (50:1:0.06) had significantly higher modulus values compared to the other PMMA-MetCNF reinforcement (50:1:0.12). This result is consistent with the likely improved dispersion of the PMMA-MetCNFs (50:1:0.06) in the PLA led to the improved tensile strength. As expected with fibre reinforcement, the PMMA-MetCNF composites were more brittle than pure PLA as evidenced by lower elongation at break of the PMMA-MetCNF composites (Fig. S10†).56 As seen in Fig. 4, the PMMA-MetCNF (50:1:0.65) composites exhibited superior reinforcement than the PMMA-MetCNF (50:1:0.12) composites at the same reinforcement content. This result is interesting considering both materials had similar amounts of PMMA on their surface (Table S1†), but it is consistent with the surface energy analysis (Fig. 2) that indicated that PMMA-MetCNFs synthesized at the 50:1:0.06 condition had more preferential interaction with the PLA. The different surface energies and mechanical properties indicate that the reaction conditions used to make the PMMA-MetCNFs changed their ability to disperse in the PLA matrix and thereby reinforce the PLA composite.
Challenges exist comparing these mechanical property results to those in literature since CNF production and drying methods vary greatly in addition to changes in compounding practices. Our previous work using spray dried CNFs provides perhaps the closest comparison possible using mechanically refined CNFs, where we observed that adding unmodified spray dried CNFs at 20 wt% loading reduced the tensile strength compared to PLA (59 MPa).31 With aqueous polymer modification and spray drying, the tensile strength could be increased by 9% as compared to neat PLA (68 MPa). The PMMA-MetCNFs used in this work demonstrated significantly higher tensile strength (79 MPa), yielding a 27% increase as compared to neat PLA, with the additional benefit of not requiring energy intensive spray drying. This tensile strength is approximately the same as that reported by Tekinalp et al. at 20 wt% CNF loading, where CNFs were freeze dried and solvent mixed into PLA.19 The ability of PMMA-MetCNFs to achieve this level of reinforcement using straightforward vacuum drying and melt mixing suggests they are a potentially scalable route to high strength PLA composites.
The fracture surfaces of the fibre-reinforced composites were characterized by SEM to see how the modified CNFs dispersed and behaved as reinforcement in the PLA matrix. The fracture surfaces of the neat PLA demonstrated a smooth morphology (Fig. S11†), while those of the PMMA-MetCNF (50:1:0.06 and 50:1:0.013) composites demonstrated rough surfaces (Fig. 5 and Fig. S12†). For the lowest wt% fibril loading (5 wt%), individual modified fibrils were observed in the PLA matrix, suggesting fibril aggregation (Fig. 5). These separated reinforcements could not generate a reinforcing network, which correlated with the tensile strength of the 5 wt% PMMA-MetCNF composite being similar to the neat PLA (Fig. 4a). As the PMMA-MetCNF content increased, the surfaces became rougher and in general the observable aggregates decreased in size (Fig. 5 and Fig. S12†). At 20 and 30 wt% reinforcement, the fracture surfaces for the 50:1:0.06 sample appeared relatively homogeneous with sub-micrometre particles, suggesting favourable dispersion in the PLA matrix to form a network of fibrils (Fig. 5 and Fig. S12†). For the 50:1:0.12 sample, larger particles and aggregates were observed at a higher reinforcement content than with the 50:1:0.06 sample, indicating a worse dispersion of the reinforcement (Fig. 5 and Fig. S12†). These differences in the observed fibril network are consistent with the mechanical property improvements of the PMMA-MetCNF composites at high filler loadings, where improved dispersion and fibril network formation are key, and that poor dispersion can create defects leading to premature failure.
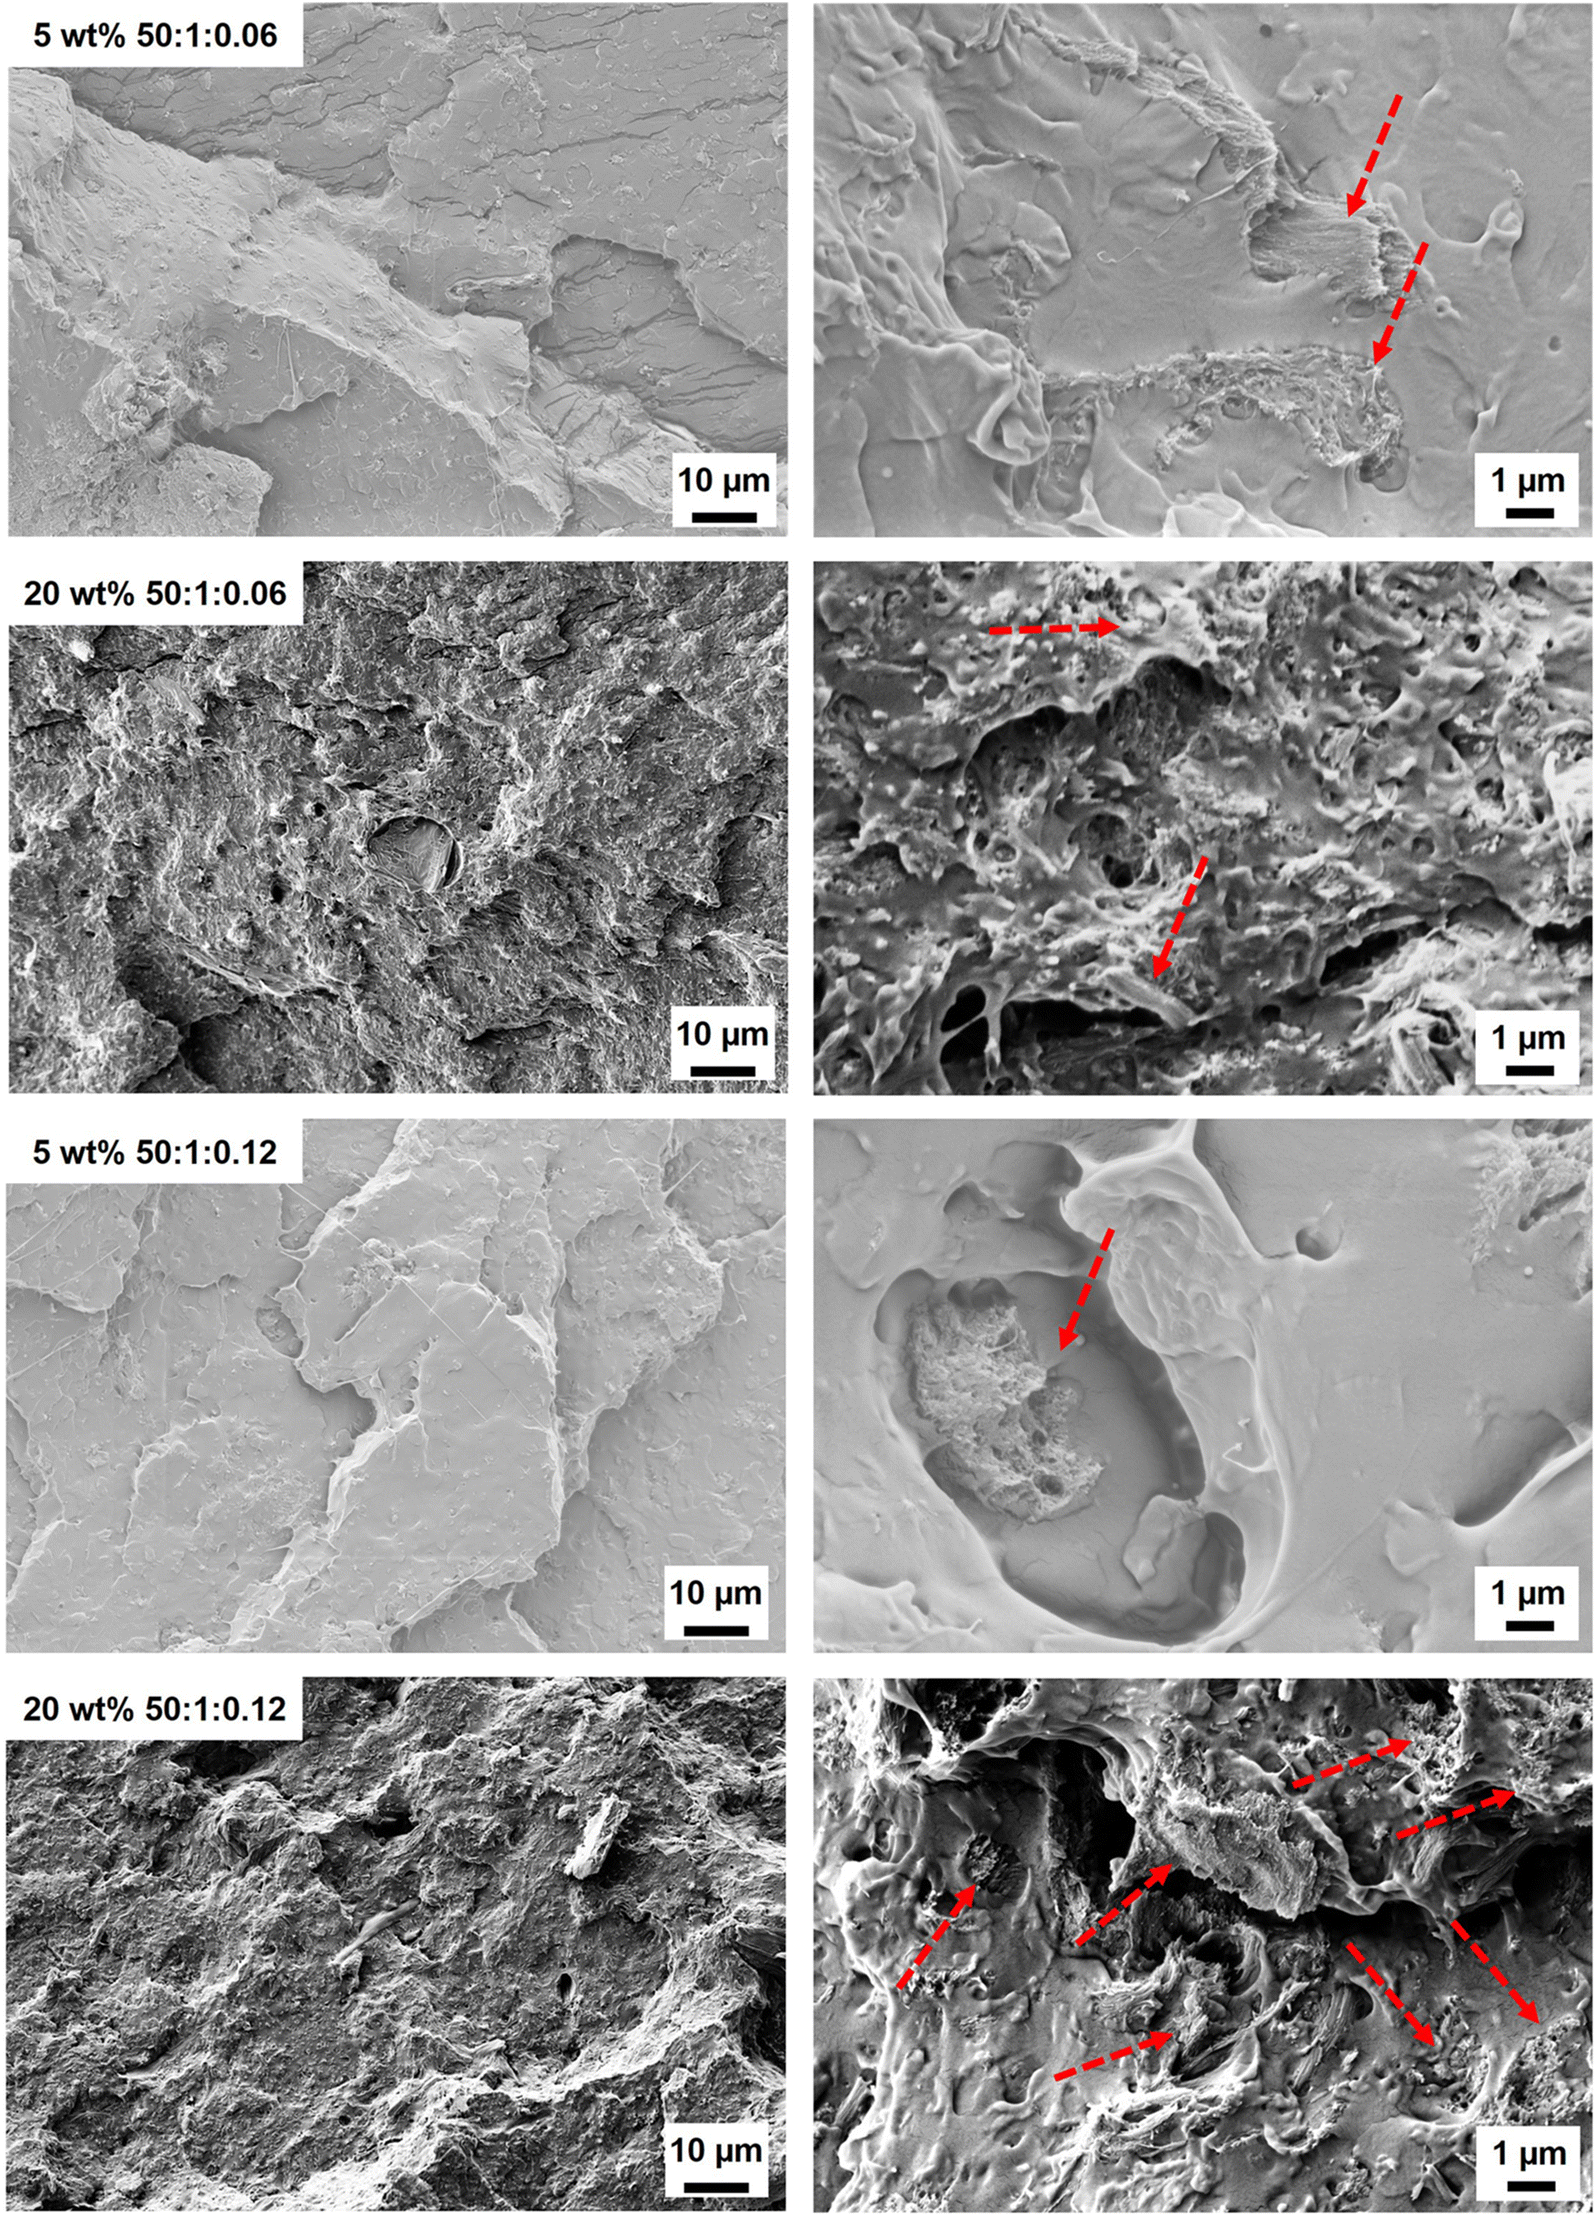 | ||
| Fig. 5 Representative SEM images of tensile bar fracture surfaces of the PMMA-MetCNF composites with 5 wt% and 20 wt% PMMA-MetCNF reinforcements at 1000× (left images) and 7000× magnification (right images). The red dashed arrows indicate example visible fibril reinforcements on the surfaces. | ||
The large increase in mechanical properties at 20 wt% reinforcement loading could be due to several factors. Poor adhesion between the reinforcement and the PLA matrix is likely not an issue because minimal voids created from fibre and fibril pull-out were observed in the SEM images (Fig. 5 and Fig. S12†). Additionally, the surface energy data also suggests adhesion is preferred (Fig. 2). A potential mechanism for this behaviour is that once a preliminary network of reinforcements is formed from the more individualized fibrils of the reinforcement sample during melt mixing the increased viscosity of the melt and subsequent shear forces further break up the larger reinforcement particles (Fig. S5†) into their individual fibrils further increasing the reinforcement effect. The 50:1:0.12 PMMA-MetCNF composites lack of significant mechanical property improvement is likely because these particles did not break up as easily during melt mixing, creating larger particles (see Fig. 5 and Fig. S12†) that could act as defects. The lower surface energy and improved interaction of the 50:1:0.06 PMMA-MetCNFs with PLA could have led to improved adhesion with the PLA and improved the breakup of these materials as compared to the 50:1:0.12 condition. Another possible explanation is that the higher initiator concentration (50:1:0.12) caused more interfibrillar crosslinking in the covalently bound polymer. As discussed above, after treatment with DCM (Fig. S6†) the fibrils of the particles remained interconnected, suggesting that covalent linkages exist between fibrils. These chemical crosslinks would prevent the efficient separation of the fibrils, the poor dispersion, and ultimately the worse mechanical properties.
The enhancement of crystallization of the polymer matrix could have improved the mechanical properties and thermal resistance as well. However, the levels of crystallinity were low in the neat PLA and all composites, indicating that increased crystallinity was not the cause of the improved mechanical properties (Table S5†). Similarly, the Tg of cellulose-reinforced PLA did not change significantly as compared to that of PLA (Table S5†). When heating slowly in the DSC, the cold crystallization temperature (Tcc) of the PLA in the composites with 5 and 10 wt% reinforcement reduced, which may be due to the PMMA-MetCNFs nucleating crystallization in the PLA.57 At higher reinforcement (30 wt%), the Tcc increased, which was likely due to cellulose network formation inhibiting chain mobility.58 The inhibition of crystallization could also be observed in the significantly lower enthalpy of crystallization (Table S5†). The effects of crystallization also could be observed in the PLA melting behaviour. At 5 and 10 wt%, the melting temperature (Tm) decreased and clear double melting peaks were observed, resulting from the different size crystallites caused by the enhanced nucleation (Fig. 6a). Consequently, when nucleation and growth were suppressed with the 30 wt% reinforcement, the Tm was similar to neat PLA. In total, the thermal properties of the composites indicate that the improvement of the mechanical performance of the PLA composites resulted from the PMMA-MetCNF network in the PLA matrix and not changes to crystallinity.
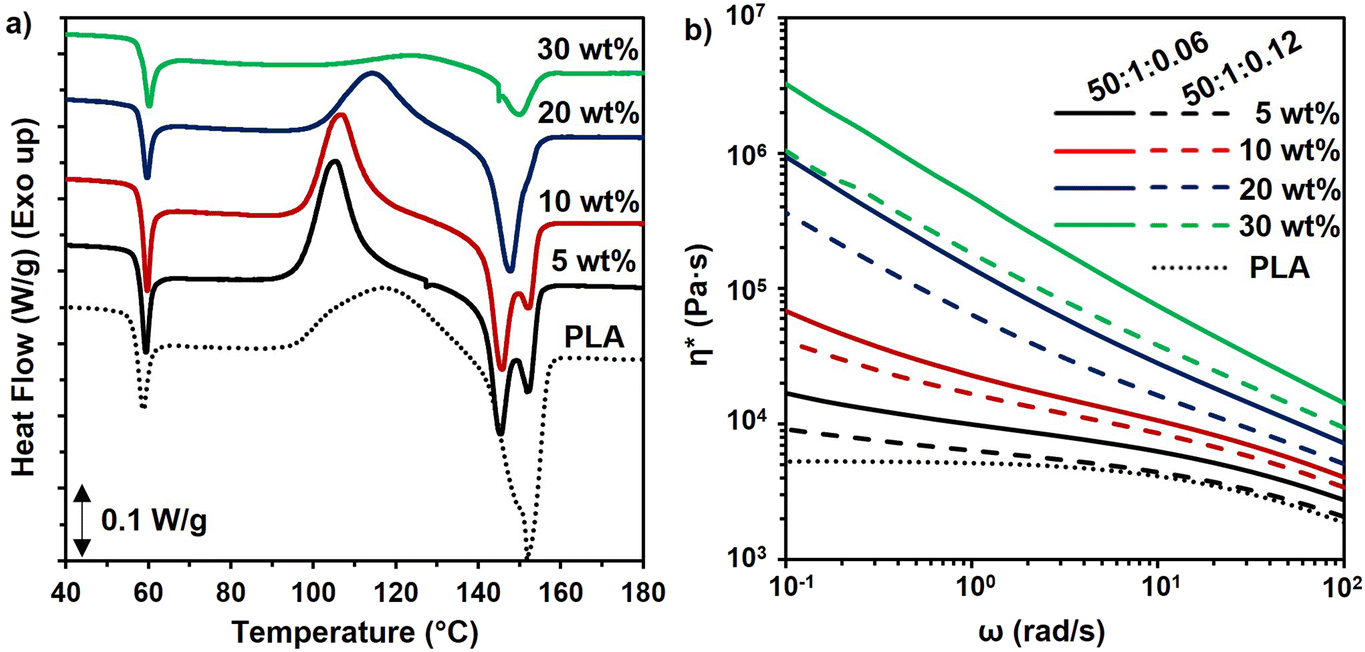 | ||
| Fig. 6 (a) DSC thermograms of the first heating cycle for PLA composites with the PMMA-MetCNF (50:1:0.06) sample at different reinforcement loadings. (b) Complex viscosity (η*) as a function of angular frequency (ω) of pure PLA and PMMA-MetCNF composites with a variety of wt% fiber contents; neat PLA (dotted line), PMMA-MetCNFs (50:1:0.06, solid lines), and PMMA-MetCNFs (50:1:0.12, dashed lines). The 20 wt% and 30 wt% reinforced samples were tested at 200 °C due to challenges with the relaxation of the samples, all other samples were tested at 180 °C. | ||
Rheological characterization of samples was utilized to confirm the network formation of fibres within the PLA matrix corresponding to the varied wt.% fibre contents and synthetic parameters. The complex viscosities of the PLA composites were higher than that of the pure PLA and increased with higher fibre content, particularly at low frequency (ω) (Fig. 6b). While a plateau was observed at low frequencies for pure PLA, all the composite samples exhibited an upturn and deviation from plateau at low frequencies. This upturn at low frequencies is the manifestation of network formation of the fillers within the polymer matrix, and it becomes more pronounced by increasing the concentration of the fibre content. This observation is consistent with observations in other composites.59 These results confirm that due to the favoured interfacial interaction between the PMMA coating and the PLA matrix the fibres have been distributed throughout the matrix and they formed a network structure. The complex viscosities of the samples also provide some insight into the origin of the inferior tensile strength of the PLA composites with PMMA-MetCNFs made at the 50:1:0.12 condition as compared to those made with the 50:1:0.06 condition. The PMMA-MetCNFs made with the higher initiator concentration (50:1:0.12) had consistently lower complex viscosity as compared to the other PMMA-MetCNFs (Fig. 6b), confirming the lower fibre–matrix interaction and consequently worse dispersion of the 50:1:0.12 sample in the PLA matrix that was indicated by the fracture surfaces and tensile data.
4. Conclusions
In this work CNFs were grafted with PMMA through an aqueous-based surfactant free emulsion polymerization involving the polymerization of monomer through a reactive methacrylate handle. Two different initiator concentrations yielded PMMA-MetCNFs with the same total amount, and covalently attached fraction, of PMMA that blocked hydrogen bonding and reduced capillary forces during vacuum drying to generate dried reinforcements that retained their microscale fibrillar structure as evidenced by a high specific surface area. The preferential interfacial interactions between the PMMA-MetCNF reinforcements and PLA led to tensile strength and modulus improvements at 20 and 30 wt% reinforcement loading. The PMMA-MetCNFs made with a lower initiator concentration (50:1:0.06) demonstrated superior dispersion of the fibrils in the PLA matrix due to their lower surface energy and potential reduction in interfibrillar crosslinking. Analysis of fracture surfaces and rheological measurements confirmed that the 50:1:0.06 PMMA-MetCNFs were better dispersed in the matrix, leading to the superior mechanical properties. The successful hydrophobic surface modification of CNFs in an aqueous-medium and scalable drying approach method allows for scalable synthesis for larger-scale applications. Moreover, the significant mechanical property differences observed between the two different reaction conditions that only vary by the initiator concentration indicate that seemingly minor changes to synthetic conditions can have significant downstream effects on the final composite properties.
Author contributions
H. S. contributed to conceptualization of the experiments, investigation, methodology, formal analysis, visualization, writing – original draft, and writing – review & editing. P. K. contributed to validation, investigation, formal analysis, and writing – review & editing. A. A. contributed to conceptualization of the iGC experiments, iGC investigation, iGC formal analysis, and writing – review & editing. S. E. contributed to conceptualization of the rheology experiments, rheology investigation, rheology formal analysis, and writing – review & editing. W. G. contributed to conceptualization, formal analysis, funding acquisition, methodology, project administration, resources, supervision, visualization, writing – review & editing.Conflicts of interest
There are no conflicts to declare.Acknowledgements
This work was supported in part by funding from UT-Battelle LLC with the U.S. Department of Energy under contract DEAC05-00OR22725 (subcontract number 4000174848).References
- T. A. Swetha, A. Bora, K. Mohanrasu, P. Balaji, R. Raja, K. Ponnuchamy, G. Muthusamy and A. A. Arun, Int. J. Biol. Macromol., 2023, 234, 123715 CrossRef CAS PubMed.
- X. Li, Y. Lin, M. Liu, L. Meng and C. Li, J. Appl. Polym. Sci., 2023, 140, e53477 CrossRef CAS.
- G. Wang, D. Zhang, B. Li, G. Wan, G. Zhao and A. Zhang, Int. J. Biol. Macromol., 2019, 129, 448–459 CrossRef CAS PubMed.
- G. Wang, D. Zhang, G. Wan, B. Li and G. Zhao, Polymer, 2019, 181, 121803 CrossRef CAS.
- E. A. Papon and A. Haque, Addit. Manuf., 2019, 26, 41–52 CAS.
- N. Maqsood and M. Rimašauskas, Composites, Part C, 2021, 4, 100112 CAS.
- S. J. Pickering, Composites, Part A, 2006, 37, 1206–1215 CrossRef.
- S. R. Naqvi, H. M. Prabhakara, E. A. Bramer, W. Dierkes, R. Akkerman and G. A. Brem, Resour., Conserv. Recycl., 2018, 136, 118–129 CrossRef CAS.
- E. Vatansever, D. Arslan and M. Nofar, Int. J. Biol. Macromol., 2019, 137, 912–938 CrossRef CAS PubMed.
- T. C. Mokhena, J. S. Sefadi, E. R. Sadiku, M. J. John, M. J. Mochane and A. Mtibe, Polymer, 2018, 10, 1363 Search PubMed.
- T. Montrikittiphant, M. Tang, K.-Y. Lee, C. K. Williams and A. Bismarck, Macromol. Rapid Commun., 2014, 35, 1640–1645 CrossRef CAS PubMed.
- J. Tian, Z. Cao, S. Qian, Y. Xia, J. Zhang, Y. Kong, K. Sheng, Y. Zhang, Y. Wan and J. Takahashi, Nanotechnol. Rev., 2022, 11, 2469–2482 CrossRef CAS.
- P. V. Kelly, D. J. Gardner and W. M. Gramlich, Carbohydr. Polym., 2021, 273, 118566 CrossRef CAS PubMed.
- Y. Peng, D. J. Gardner and Y. Han, Cellulose, 2012, 19, 91–102 CrossRef CAS.
- L. Wang, J. Palmer, M. Tajvidi, D. J. Gardner and Y. Han, J. Therm. Anal. Calorim., 2019, 136, 1069–1077 CrossRef CAS.
- L. Wang, A. W. Roach, D. J. Gardner and Y. Han, Cellulose, 2018, 25, 439–448 CrossRef CAS.
- D. Aydemir and D. J. Gardner, Carbohydr. Polym., 2020, 250, 116867 CrossRef CAS PubMed.
- C. M. Clarkson, S. M, E. A. Azrak, R. Chowdhury, S. N. Shuvo, J. Snyder, G. Schueneman, V. Ortalan and J. P. Youngblood, ACS Appl. Polym. Mater., 2019, 1, 160–168 CrossRef CAS.
- H. L. Tekinalp, X. Meng, Y. Lu, V. Kunc, L. J. Love, W. H. Peter and S. Ozcan, Composites, Part B, 2019, 173, 106817 CrossRef.
- Z. Ying, D. Wu, Z. Wang, W. Xie, Y. Qiu and X. Wei, Cellulose, 2018, 25, 3955–3971 CrossRef CAS.
- M. Jonoobi, J. Harun, A. P. Mathew and K. Oksman, Compos. Sci. Technol., 2010, 70, 1742–1747 CrossRef CAS.
- F. Rol, M. N. Belgacem, A. Gandini and J. Bras, Prog. Polym. Sci., 2019, 88, 241–264 CrossRef CAS.
- Y. Lu, M. C. Cueva, E. Lara-Curzio and S. Ozcan, Carbohydr. Polym., 2015, 131, 208–217 CrossRef CAS PubMed.
- K. Li, D. Mcgrady, X. Zhao, D. Ker, H. Tekinalp, X. He, J. Qu, T. Aytug, E. Cakmak, J. Phipps, S. Ireland, V. Kunc and S. Ozcan, Carbohydr. Polym., 2021, 256, 117525 CrossRef CAS PubMed.
- S. Spinella, C. Samuel, J.-M. Raquez, S. A. McCallum, R. Gross and P. Dubois, ACS Sustainable Chem. Eng., 2016, 4, 2517–2527 CrossRef CAS.
- N. Macke, C. M. Hemmingsen and S. J. Rowan, J. Polym. Sci., 2022, 60, 3318–3330 CrossRef CAS.
- J. Velásquez-Cock, H. B. Gómez, P. Posada, G. Serpa, H. C. Gómez, C. Castro, P. Gañán and R. Zuluaga, Carbohydr. Polym., 2018, 179, 118–125 CrossRef PubMed.
- N. Butchosa and Q. Zhou, Cellulose, 2014, 21, 4349–4358 CrossRef CAS.
- T. Kaldéus, M. R. Telaretti Leggieri, C. Cobo Sanchez and E. Malmström, Biomacromolecules, 2019, 20, 1937–1943 CrossRef PubMed.
- M. E. Driscoll, P. V. Kelly and W. M. Gramlich, Langmuir, 2023, 39, 7079–7090 CrossRef CAS PubMed.
- P. V. Kelly, S. S. Es-haghi, M. E. Lamn, K. Copenhaver, S. Ozcan, D. J. Gardner and W. M. Gramlich, ACS Appl. Polym. Mater., 2023, 5, 3661–3676 CrossRef CAS.
- R. A. Lafia-Araga, R. Sabo, O. Nabinejad, L. Matuana and N. Stark, Biomolecules, 2021, 11, 1346 CrossRef CAS PubMed.
- C. A. Rodríguez-Ramírez, A. Dufresne, N. D'Accorso and N. L. Garcia, Int. J. Biol. Macromol., 2022, 211, 626–638 CrossRef PubMed.
- M. Bilodeau and M. Paradis, High Efficiency Production of Nanofibrillated Cellulose. WO2015171714A1, 2015.
- S. Christau, E. Alyamac-Seydibeyoglu, K. Thayer and W. M. Gramlich, Cellulose, 2023, 30, 901–914 CrossRef CAS.
- P. V. Kelly, P. Cheng, D. J. Gardner and W. M. Gramlich, Macromol. Rapid Commun., 2021, 42, 2000531 CrossRef CAS PubMed.
- M. Bui, K. Nagapudi and P. Chakravarty, AAPS PharmSciTech, 2022, 23, 237 CrossRef CAS PubMed.
- K. Adamska, M. Sandomierski, Z. Buchwald and A. Voelkel, Polym. Test., 2020, 90, 106697 CrossRef CAS.
- S. Farah, D. G. Anderson and R. Langer, Adv. Drug Delivery Rev., 2016, 107, 367–392 CrossRef CAS PubMed.
- Y. Peng, Y. Han and D. J. Gardner, Wood Fiber Sci., 2012, 44, 448–461 CAS.
- M. Wohlert, T. Benselfelt, L. Wågberg, I. Furó, L. A. Berglund and J. Wohlert, Cellulose, 2022, 29, 1–23 CrossRef CAS.
- S. Jitian and I. Bratu, AIP Conf. Proc., 2012, 1425, 26–29 CrossRef CAS.
- K. Littunen, U. Hippi, L.-S. Johansson, M. Österberg, T. Tammelin, J. Laine and J. Seppälä, Carbohydr. Polym., 2011, 84, 1039–1047 CrossRef CAS.
- I. A. Sacui, R. C. Nieuwendaal, D. J. Burnett, S. J. Stranick, M. Jorfi, C. Weder, E. J. Foster, R. T. Olsson and J. W. Gilman, ACS Appl. Mater. Interfaces, 2014, 6, 6127–6138 CrossRef CAS PubMed.
- M. M. Chehimi, M.-L. Abel, C. Perruchot, M. Delamar, S. F. Lascelles and S. P. Armes, Synth. Met., 1999, 104, 51–59 CrossRef CAS.
- B. Riedl and P. D. Kamdem, J. Adhes. Sci. Technol., 1992, 6, 1053–1067 CrossRef CAS.
- M. Ahmadi, T. Behzad, R. Bagheri, M. Ghiaci and M. Sain, Cellulose, 2017, 24, 2139–2152 CrossRef CAS.
- C. Sun and J. C. Berg, J. Colloid Interface Sci., 2003, 260, 443–448 CrossRef CAS PubMed.
- G. S. Oporto, D. J. Gardner, A. Kiziltas, D. J. Neivandt and J. Adhes, Sci. Technol., 2011, 25, 1785–1801 CAS.
- A. Abdulkhani, J. Hosseinzadeh, A. Ahori, S. Dadashi and Z. Takzare, Polym. Test., 2014, 35, 73–79 CrossRef CAS.
- C. Darpentigny, G. Nonglaton, J. Bras and B. Jean, Carbohydr. Polym., 2020, 229, 115560 CrossRef CAS PubMed.
- M. Pääkkö, J. Vapaavuori, R. Silvennoinen, H. Kosonen, M. Ankerfors, T. Lindström, L. A. Berglund and O. Ikkala, Soft Matter, 2008, 4, 2492–2499 RSC.
- G. Zhang, J. Zhang, S. Wang and D. Shen, J. Polym. Sci., Part B: Polym. Phys., 2003, 41, 23–30 CrossRef CAS.
- H. Zou, C. Yi, L. Wang, H. Liu and W. Xu, J. Therm. Anal. Calorim., 2009, 97, 929–935 CrossRef CAS.
- H. Ku, H. Wang, N. Pattarachaiyakoop and M. Trada, Composites, Part B, 2011, 42, 856–873 CrossRef.
- Z. Yang, X. Feng, Y. Bi, Z. Zhou, J. Yue, M. Xu and J. Appl, Polym. Sci., 2016, 133, 44241 Search PubMed.
- M. B. Alanalp, B. Ozdemir, M. Nofar, A. Durmus and J. Therm, Anal. Calorim., 2022, 147, 14211–14227 CrossRef CAS.
- J. Kratochvíl, I. Kelnar and J. Therm, Anal. Calorim., 2017, 130, 1043–1052 CrossRef.
- L. Cui, L. Yi, Y. Wang, Y. Zhang, P. Polyák, X. Sui and B. Pukánszky, Mater. Des., 2021, 206, 109774 CrossRef CAS.
Footnote |
| † Electronic supplementary information (ESI) available: Spectra of modified cellulose nanofibrils, size exclusion chromatographs, surface energy data, scanning electron microscopy images, thermogravimetric analysis, tensile property data of composites, and tabulated differential scanning calorimetry data. See DOI: https://doi.org/10.1039/d3lp00248a |
| This journal is © The Royal Society of Chemistry 2024 |