Efficient peroxymonosulfate activation by Fe–BiOCl hollow microspheres for carbamazepine removal†
Received
17th February 2024
, Accepted 5th April 2024
First published on 6th April 2024
Abstract
The preparation of highly effective and stable photocatalysts for visible-light-driven activation of peroxymonosulfate (PMS) to remove refractory organic contaminants is an attractive study. Herein, a series of Fe–BiOCl photocatalysts with a hollow structure were prepared through a regular one-step solvothermal approach and applied to activate PMS for carbamazepine (CBZ) degradation. Benefiting from the synergistic effect of photocatalysis and PMS activation, the 3% Fe–BiOCl/PMS system exhibits a higher CBZ removal ability under visible irradiation, with the corresponding apparent rate constant (k = 0.0449 min−1) being 12 times higher than that of individual BiOCl (k = 0.0037 min−1). Further experiments verify that the doping of Fe and the construction of the hollow structure of BiOCl can improve light absorption and utilization efficiency. More importantly, the introduced Fe3+ can facilitate the fast separation of photogenerated carriers and the activation of PMS. Capture experiments and EPR tests demonstrate that multiple active species (OH˙, SO4˙−, 1O2 and O2˙−) participate in the PMS activation for the CBZ degradation process, with SO4˙− being the primary active species. Furthermore, the effects of photocatalyst amount, PMS concentration, initial solution pH, and co-existing anions on CBZ removal were explored. A possible mechanism for the photocatalytic removal of CBZ is also proposed. In addition, the 3% Fe-BOC displays outstanding photocatalytic activity over four consecutive cycles, indicating that it could be a reliable PMS activator for CBZ elimination in practical application. This work provides new ideas for constructing efficient and stable BiOCl-based catalytic systems for visible-light-driven removal of emerging contaminants.
1. Introduction
Recently, the continuous detection of pharmaceuticals and personal care products (PPCPs) in aquatic ecosystems and their possible hazards have aroused widespread attention.1–4 Carbamazepine (CBZ), a commonly used psychotherapeutic drug, is considered one of the most detected representative PPCPs in natural water due to its negligible biodegradation or photodegradation in the environment.5–7 To date, several strategies for removing CBZ from wastewater have been established, including adsorption, biodegradation, pyrolysis, photolysis, advanced oxidation processes, etc.8–11 Because of its environmentally friendly nature and high removal efficiency, photocatalytic oxidation is regarded as a promising method.12
As a significant bismuth-based semiconductor, BiOCl possesses advantages such as an adjustable bandgap, photochemical stability, non-toxicity, etc. However, due to the rapid recombination of photogenerated carriers and a limited light response range, its widespread application is severely restricted.13,14 Some attempts have been undertaken to address these shortcomings, including ion doping, precious metal deposition, defect engineering, etc. Of particular note is the interfacial modulation method involving the doping of transition metals (such as Cu, Fe, etc.) to enhance light absorption and facilitate the efficient separation of photoinduced charge carriers, thereby improving photocatalytic properties.15–22 For instance, the introduction of Fe dopants can modify the electronic structure of the photocatalyst, narrowing the bandgap or shifting the position of energy levels. These alterations can affect the absorption of light and the redox properties of the photocatalyst.23 Generally, the modification of transition metals on the photocatalyst surface can be divided into lattice doping and surface anchoring. For lattice doping, metal ions can be inserted into the lattice of the host semiconductor to form a doping energy level between the bandgaps.24,25 The latter approach can efficiently promote interfacial charge transfer through surface-anchored transition metal clusters.26 In previous studies, the multiple variable valence states and 3d orbitals of transition metals have been proposed to affect the photo-electrochemical properties of semiconductors.27–30 For example, Guan et al.31 revealed that the introduction of Sn into BiOCl can strengthen the internal polarization of atoms along the [001] direction and facilitate the carrier separation induced by the intrinsic electric field, thereby realizing the efficient degradation of the organic dye RhB. In another study, Di et al.26 pointed out that Fe3+, Cu2+ and Mn2+ may reduce the bandgap and extend the light absorption region to visible light.
Furthermore, the activation of peroxymonosulfate (PMS) shows significant potential for removing toxic and persistent pharmaceutical pollutants from water. However, since the catalytic effectiveness of PMS activation through a single method is greatly restricted, combining photocatalysis with PMS activation can be viewed as a viable approach.9,32–34 In the photocatalysis and PMS activation synergistic system, the free radicals with high redox potential (SO4˙− and OH˙) are generated by the breakage of O–O bonds of PMS, where the half-life of SO4˙− (30–40 μs) is significantly higher than that of OH˙ (less than 1 μs), meaning that SO4˙− can better touch and react with the specific contaminant.35,36 Furthermore, photoinduced electrons (e−) and holes (h+) can activate PMS to produce other active species (1O2 and O2˙−). Therefore, PMS activation not only engenders more free radicals, but also effectively reduces the recombination of e− and h+, thereby promoting photocatalytic efficiency.37–40
As we know, PMS can usually be activated by metal or non-metallic catalysts, ultraviolet, microwave, ultrasonic, and photocatalysis.41 Among them, Fe is favored by researchers due to its redox properties and low cost, making it a commonly used and effective activator for PMS.42–44 As an illustration, Sun et al.35 prepared a Co2FeAl-LDO catalyst with multiple metal modification for carbamazepine removal through catalytic activation of PMS. The synergistic effect between Fe, Co and Al on PMS activation enabled higher CBZ elimination efficiency. Tian et al.45 found that the effectively separated photogenerated electrons in the IO WO3 catalyst can accelerate the circulation of Fe3+/Fe2+ in Fe/PMS and Fe/PDS systems, leading to an enhanced norfloxacin removal rate. Furthermore, the construction of hollow structures is not only conducive to increasing the specific surface area of the photocatalyst and adding more active sites, but also enhances light absorption through light scattering and reflection, thereby improving light utilization.46 Therefore, by properly combining PMS activation and photocatalysis, along with the construction of Fe–BiOCl hollow microspheres, they are expected to exhibit synergistically enhanced CBZ removal performance, but few examples are available.
In this study, we used a straightforward one-step solvothermal approach to synthesize Fe-doped BiOCl photocatalysts with a hollow structure for studying CBZ removal via the synergistic effect of photocatalysis and PMS activation. As a result, the 3% Fe–BiOCl/PMS system exhibited significantly enhanced CBZ degradation activity and good reusability. The increased capacity for photocatalytic CBZ degradation is ascribed to Fe modification combined with the hollow structure, which partly overcomes the limitation of the BiOCl's light response range, thereby improving light absorption and utilization. On the other hand, the introduced Fe3+ acts as an electron acceptor and peroxymonosulfate activator. In addition, the catalytic performance of 3% Fe–BiOCl/PMS under different conditions and the possible reaction mechanism were also explored. This study will stimulate more interest in constructing an efficient and stable photocatalytic system to remove emerging contaminants.
2. Experimental section
More information about the detailed synthesis process of Fe–BiOCl (denoted as Fe-BOC), photocatalytic performance, and characterization details can be found in the ESI.†
3. Results and discussion
3.1. Morphological and structural analysis
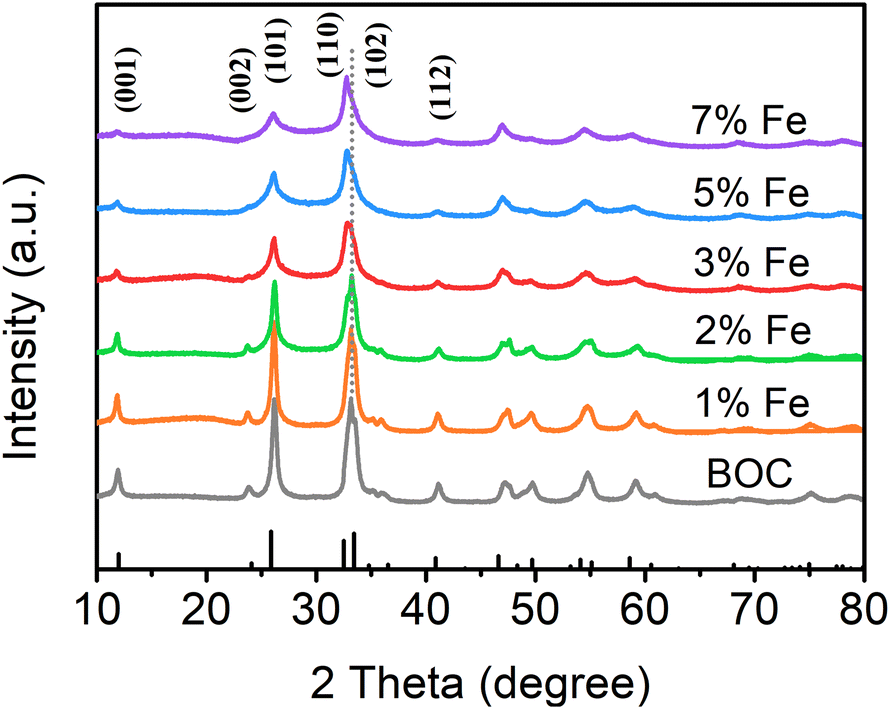
Fig. 1 depicts the X-ray diffraction (XRD) patterns of the samples with different Fe doping amounts. All characteristic diffraction peaks are easily ascribed to the tetragonal phase of BiOCl, indicating that the crystal structure of BiOCl remains unchanged by doping modification.47–49 On account of the low loading and large dispersion of Fe, no diffraction peaks of Fe2O3 or FeOOH are detected. The diffraction peak intensity decreases with the increase of Fe doping indicating the change in crystallinity, which will affect the adsorption ability of the catalyst.50,51 It is worth noting that the diffraction peak of the (110) crystal plane is slightly moved to a smaller angle in 3% Fe-BOC, and the offset angle gradually increases with the increase of Fe doping. This change might be related to the lattice expansion produced by the inclusion of Fe into the lattice.52
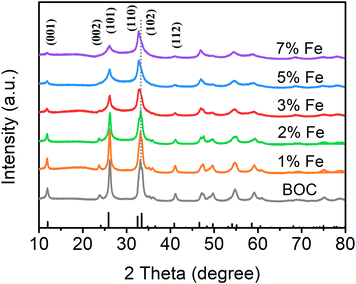 |
| | Fig. 1 XRD patterns of samples with different Fe doping amounts, BOC, 1% Fe-BOC, 2% Fe-BOC, 3% Fe-BOC, 5% Fe-BOC, and 7% Fe-BOC. | |
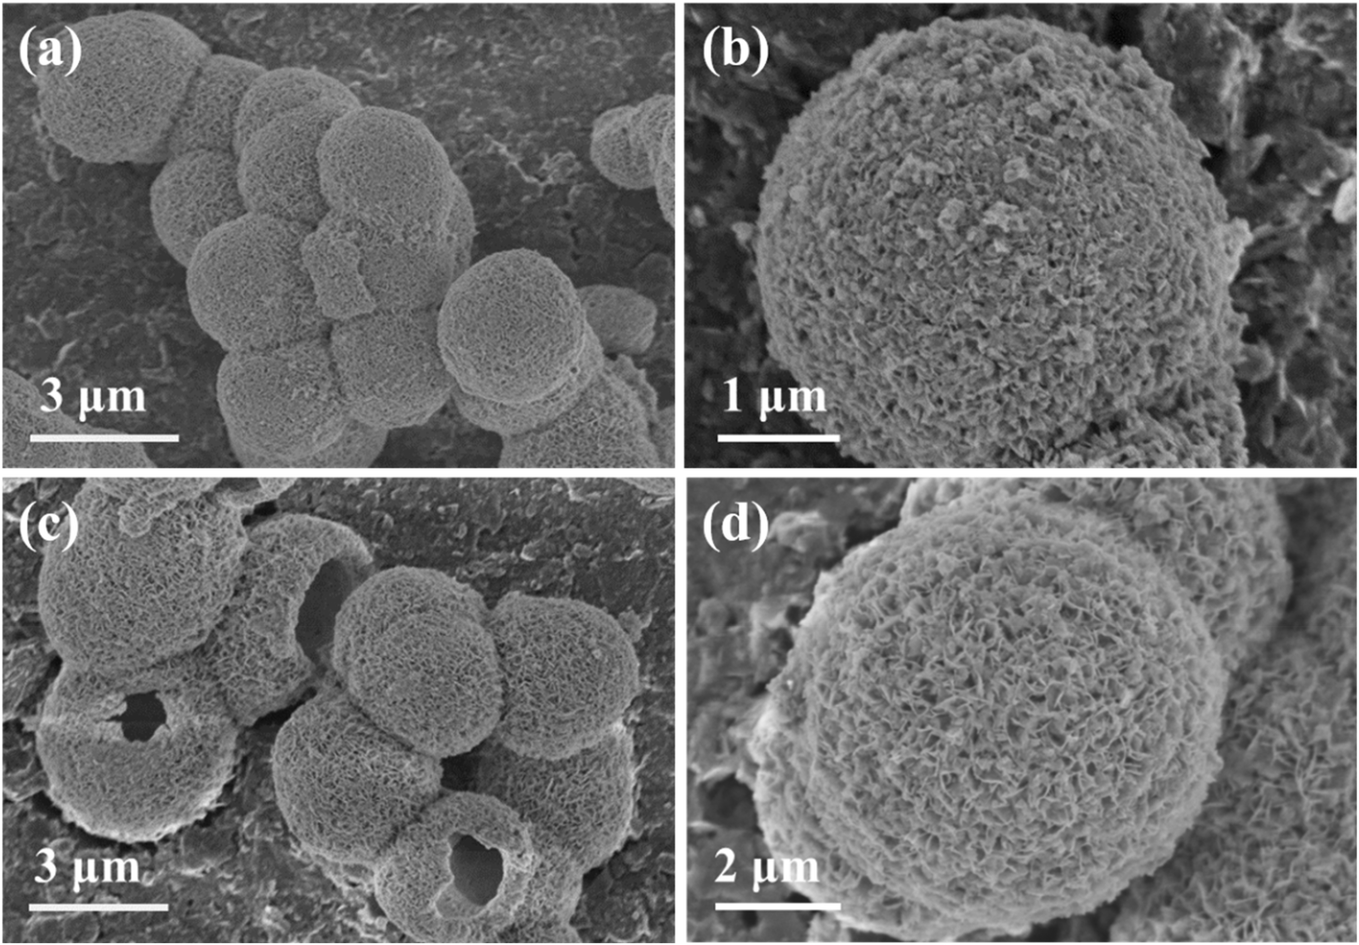
Scanning electron microscopy (SEM) was utilized to explore the morphological features of BOC and 3% Fe-BOC. Due to the low iron-doping levels, the magnetic properties of our samples are very weak, with 3% Fe-BOC being almost non-magnetic. Fig. 2a and c display that hollow microspheres with an average size of roughly 3 μm are formed in both samples, and no additional iron oxides are found in 3% Fe-BOC. BiOCl nanosheets of uniform size grew vertically on the surfaces of BOC and 3% Fe-BOC microspheres, as presented in Fig. 2b and d. The morphology of Fe-BOC with different Fe doping amounts is shown in Fig. S1;† it is clear that the surface nanosheets of 5% and 7% Fe-BOC are well grown and fully exposed compared to lower Fe-doping (1% and 2%), indicating that the amount of Fe doping affects the crystallinity of the samples.
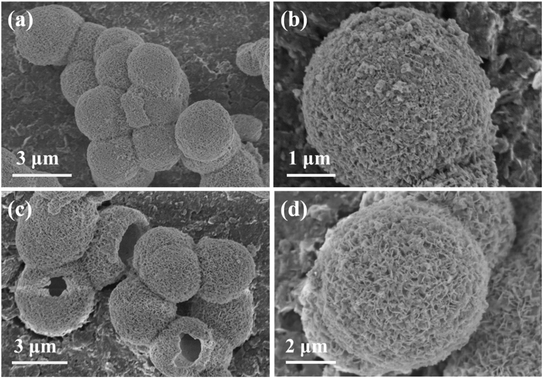 |
| | Fig. 2 SEM images of (a and b) BOC and (c and d) 3% Fe-BOC samples. | |
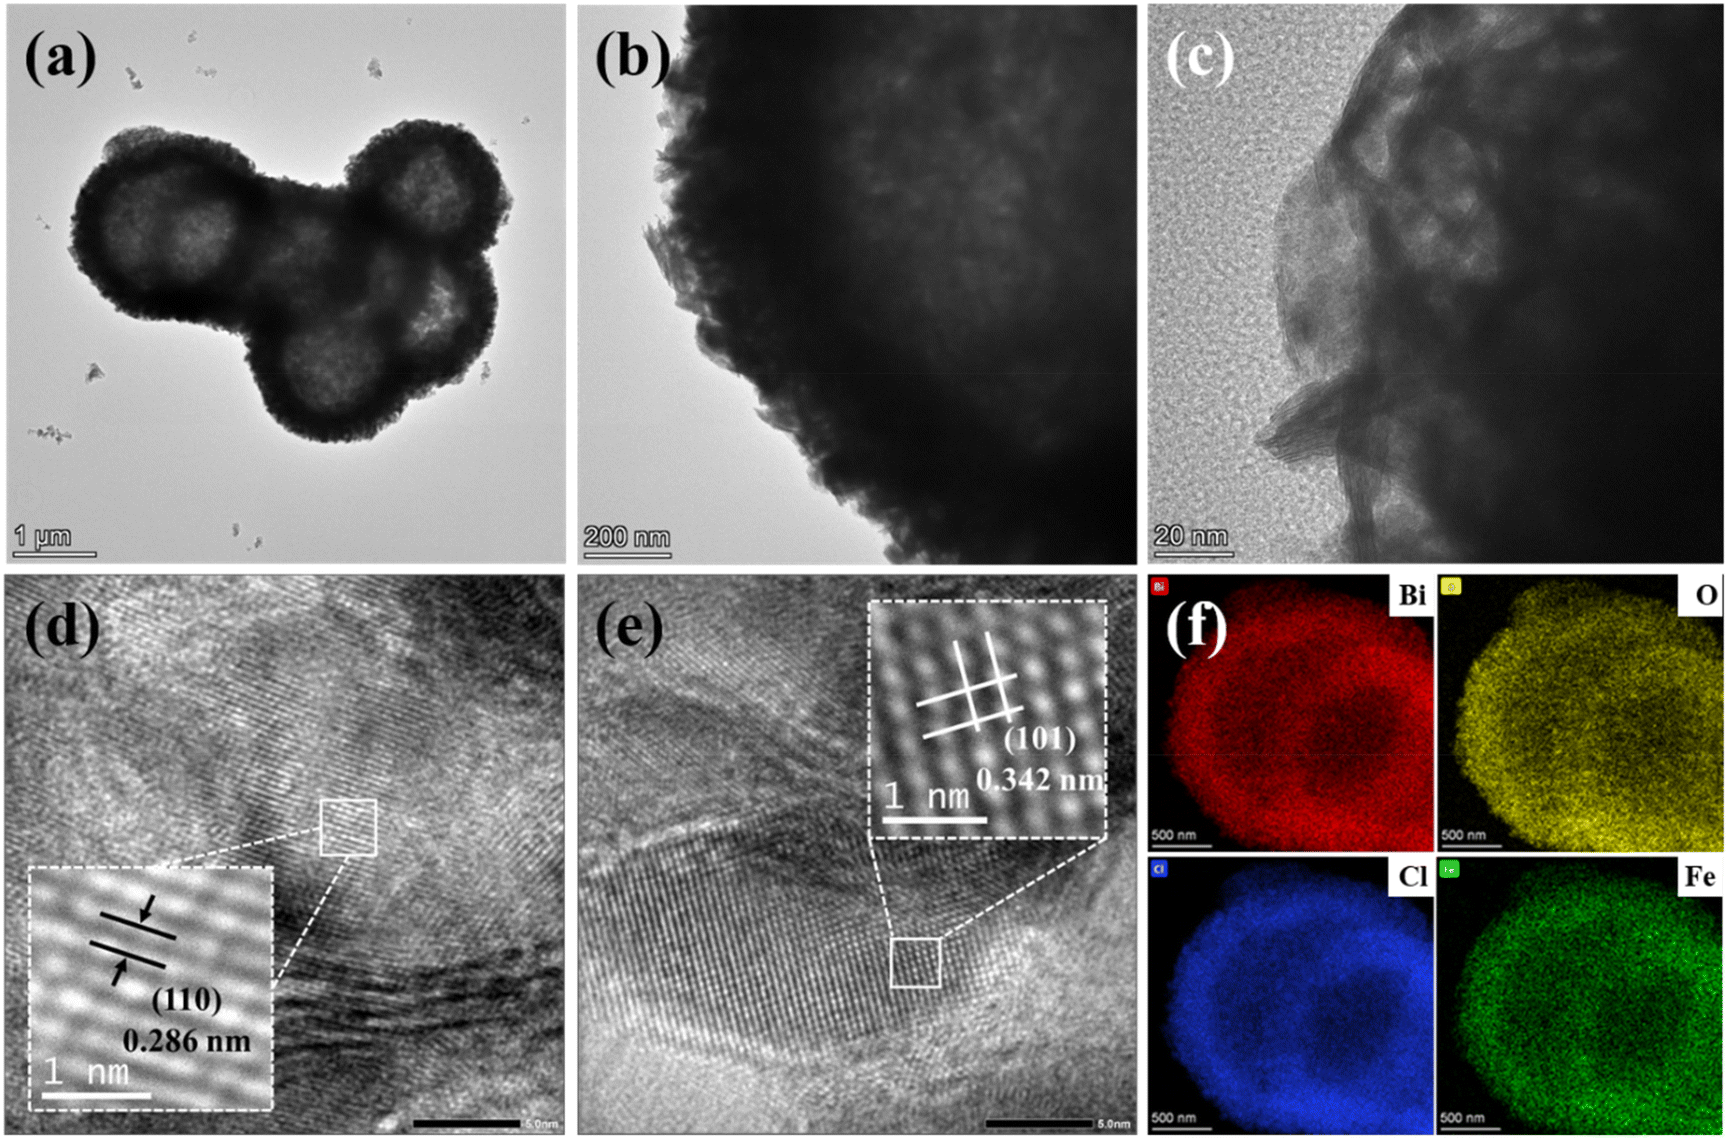
Transmission electron microscopy (TEM) was used to further explore the morphology and microstructure of 3% Fe-BOC. As seen in Fig. 3a and b, the hollow structure of 3% Fe-BOC is well maintained and the thickness of the spherical shell is 300–400 nm. This hollow structure is beneficial for improving the light-trapping efficiency and thus improves the photocatalytic degradation ability for CBZ removal. The growth of nanosheets on the surface of BiOCl microspheres is displayed in Fig. 3c. In addition, Fig. 3d and e reveal the HRTEM images of 3% Fe-BOC, where the stripe spacings of 0.286 and 0.342 nm can correspond to the lattice spacing of the (110) and (101) crystal planes in tetragonal BiOCl, respectively. The EDS elemental mappings (Fig. 3f) show a homogeneous distribution of the elements Bi, O, Cl and Fe on the sample surface.
 |
| | Fig. 3 (a–c) TEM, (d and e) HRTEM and (f) elemental mapping images of the 3% Fe-BOC sample. | |
X-ray photoelectron spectroscopy (XPS) was used to examine the elemental composition and valence state of BOC and 3% Fe-BOC. The survey spectra reveal the presence of Bi, O and Cl elements in both samples (Fig. 4a), while the Fe element of 3% Fe-BOC cannot be observed in the full spectrum because of the low doping content. The high-resolution spectrum of Bi 4f is shown in Fig. 4b, with two prominent peaks at 159.6 and 164.9 eV attributed to Bi 4f7/2 and 4f5/2 of Bi3+.53 The XPS spectrum of O 1s is split into two peaks at 530.5 and 531.7 eV (Fig. 4c), which can be ascribed to the lattice oxygen in [Bi2O2]2+ and the surface hydroxyl group.54 Peaks arise in the Cl 2p spectrum at binding energies of 198.3 and 199.9 eV (Fig. 4d), which correspond to Cl 2p3/2 and Cl 2p1/2. As shown in Fig. 4e, the distinctive peaks of Fe 2p3/2 and Fe 2p1/2 may be assigned to the two peaks at 710.9 and 725.8 eV, confirming the existence of Fe3+ in 3% Fe-BOC.55–57 The peak positions of Bi, Cl and O in the 3% Fe-BOC sample shift towards a higher binding energy compared to pure BiOCl. It has been reported that the increased binding energy of Bi is linked to the generation of the Fe–O bond, which reduces the electron density of the outer Bi atom and weakens the electron shielding effect.58,59
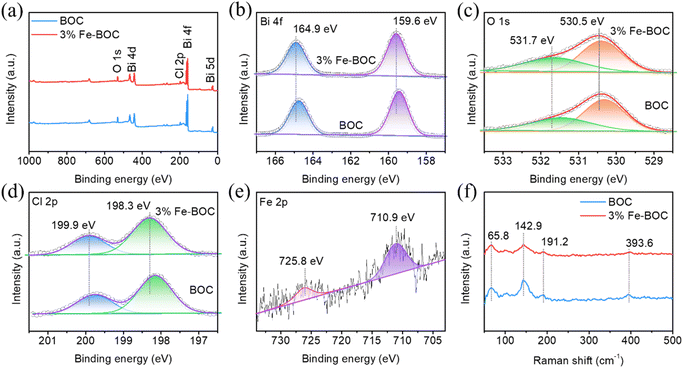 |
| | Fig. 4 (a) XPS survey, (b) Bi 4f, (c) O 1s, (d) Cl 2p, and (e) Fe 2p spectra, and (f) Raman spectra of BOC and 3% Fe-BOC samples. | |
Raman spectra were used to evaluate the crystal structure alterations before (BOC) and after the doping treatment (3% Fe-BOC). As seen in Fig. 4f, the peak at 142.9 cm−1 is ascribed to the A1g stretching mode, whereas the peaks at 65.8 and 191.2 cm−1 are ascribed to the external A1g and inherent Eg stretching modes of Bi–Cl, correspondingly.60 In addition, the weak peak at 393.6 cm−1 is related to B1g and Eg bands caused by the motion of O atoms.60,61 There is no change in the peak position after Fe doping, while the peak at 393.6 cm−1 almost disappears, which may be caused by the vibration of local O atoms. It can be inferred from XRD and Raman results that the introduction of Fe forms Fe–O bonds rather than Fe–Cl bonds.62
3.2. Photocatalytic activity evaluation
3.2.1. Effects of doping amounts.
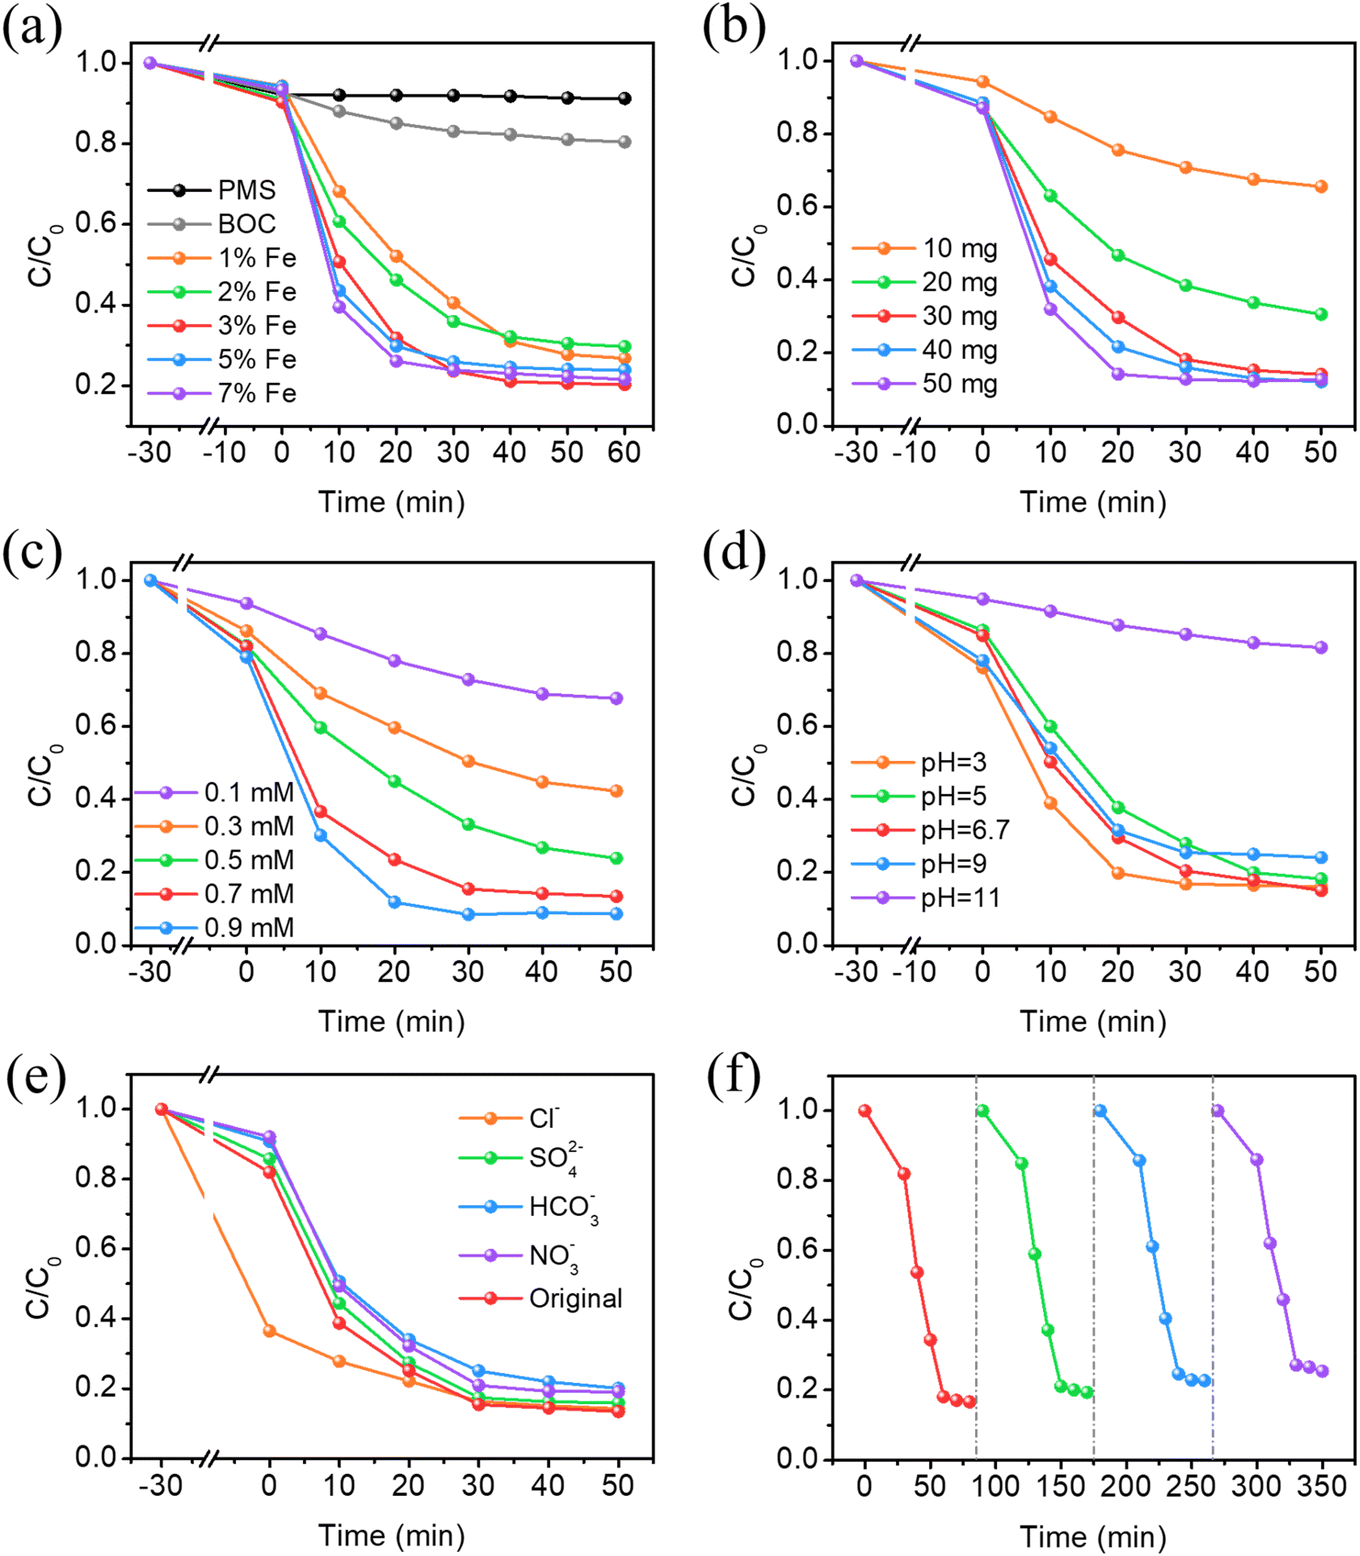
Degradation studies under visible light with CBZ as the target contaminant were performed to assess the photocatalytic activity of the materials. As shown in Fig. 5a, several rounds of comparative studies were performed to assess the photocatalytic activity of the materials with different doping amounts. In the individual PMS system, the removal rate does not change significantly after illumination, showing that visible light irradiation is insufficient to activate PMS in the absence of the catalyst. The slight elimination of CBZ is attributed to adsorption. Therefore, the self-photolysis process of CBZ is negligible. In addition, 19.6% of CBZ is degraded under visible light within 60 min in PMS–BiOCl systems due to the UV light response properties of BiOCl. Additionally, it is important to note that Fe doping significantly improved PMS activation and CBZ degradation efficiency; the CBZ removal rates of different photocatalysts under visible irradiation are 76.2% (1% Fe-BOC), 70.9% (2% Fe-BOC), 79.7% (3% Fe-BOC), 76.1% (5% Fe-BOC) and 77.5% (7% Fe-BOC), respectively. As described in Fig. S2a and Table S1,† the apparent rate constants are 2.80 × 10⁻², 3.06 × 10⁻², 4.49 × 10⁻², 4.33 × 10⁻², and 4.62 × 10⁻² min−1, respectively. Among them, 3% Fe-BOC exhibits relatively better degradation activity.
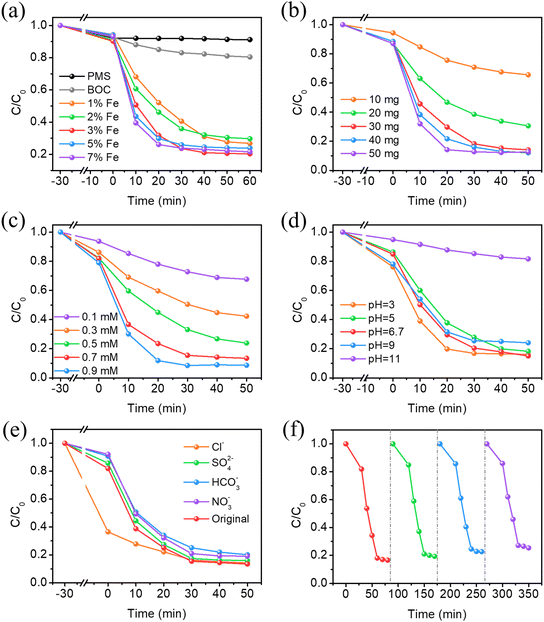 |
| | Fig. 5 Effects of (a) Fe doping amount, (b) catalyst dosage, (c) PMS concentrations, (d) initial pH values, (e) co-existing inorganic anions on the removal of CBZ and (f) cycling tests of 3% Fe-BOC (experimental conditions: (a) 30 mg catalyst, 0.5 mM PMS, pH = 6.7; (b) 3% Fe-BOC, 0.7 mM PMS, pH = 6.7; (c) 30 mg 3% Fe-BOC, pH = 6.7; (d) 30 mg 3% Fe-BOC, 0.7 mM PMS; (e) and (f) 30 mg 3% Fe-BOC, 0.7 mM PMS, pH = 6.7). | |
3.2.2. Effects of the catalyst dosage.
As shown in Fig. 5b, 3% Fe-BOC was chosen to investigate the impact of different dosages on CBZ removal. When the catalyst dosage is in the range of 10–30 mg, the amount of dark adsorption changes with the increase of catalyst addition, and the CBZ removal rates of BOC and 3% Fe-BOC are 34.4% and 83.9%, respectively (Fig. S2b†). This is generally ascribed to the huge quantity of catalysts providing more active sites, thus enhancing the oxidation of CBZ. This also indicates that the surface reaction is the main rate-limiting step. When the catalyst dosage is increased to 50 mg, 80% of CBZ can be removed in 20 min, but the CBZ elimination rate is not enhanced. This is probably due to the scavenging of SO4˙− by the excess catalyst.35,44 Therefore, a 30 mg catalyst is chosen as the optimal dosage for the next trials.
3.2.3. Effects of the PMS concentration.
Fig. 5c and S2c† reveal the influence of the PMS concentration on the degradation performance. The response rate constant of CBZ removal rises as the PMS concentration rises, demonstrating that the PMS concentration is the most important factor influencing the removal efficiency. Under low PMS concentration conditions (≤0.3 mM), the unsatisfactory catalytic performance may be caused by insufficient oxidizing active substances in the reaction. On the other hand, as the concentration of PMS continued to increase, the reaction rate constant of CBZ removal still increased, but the trend slowed down noticeably, which may be ascribed to the photogenerated electrons being insufficient for activating higher concentrations of PMS.32,63 It has been reported that the excess of HSO5− will consume a portion of SO4˙− and OH˙ to generate SO5˙− with lower oxidative activity.64 Besides, excessive PMS concentration may lead to self-annihilation of free radicals (eqns (1)–(3)). Taking the removal rate of CBZ and the price factor of PMS into consideration, we finally chose a PMS dosage of 0.7 mM for the degradation reaction.| | | OH˙/SO4˙− + HSO5− → SO5˙− + HSO4−/H2O | (1) |
| | | SO4˙− + SO4˙− → S2O82− | (3) |
3.2.4. Effects of initial pH.
The initial pH of the solution also acts as an important determinant in catalytic efficiency. We studied the photocatalytic removal of CBZ at pH = 3, 5, 6.7 (original solution), 9 and 11 to reveal the effect of pH on the Fe-BOC/PMS system, respectively. As shown in Fig. 5d and S2d,† the reaction rate constant of CBZ removal increases with the increase of the initial pH of the solution in the pH range from 3.0 to 6.7, and the removal rate of CBZ is beyond 82%. But when the pH increases from 6.7 to 11, the reaction rate constant decreases. This phenomenon may be clarified via the two aspects listed below: firstly, the pKa value of PMS (pKa = 9.4) determines that it exists in the form of HSO5− in a solution environment of 0 < pH < 9.65 It is reported that the main decomposition product of HSO5− in acidic solutions is SO4˙− and OH˙ predominates in the alkaline solutions,43 while SO4˙− usually exhibits a stronger oxidation capacity and longer lifetime than OH˙. Besides, acidic conditions promote the formation and reaction of Fe2+, thereby promoting the activation of PMS.44 Under strong alkaline conditions, PMS will self-decompose in a non-radical way and the formation of active free radicals will be inhibited.65,66 Meanwhile, Fe ions easily form hydroxides or metal-complexes, which hinder the contact and reaction with PMS.67 These two factors work together to reduce the degradation efficiency of CBZ in an alkaline environment. Thus, higher CBZ removal rates and degradation efficiencies can be achieved in neutral and acidic solutions.
3.2.5. Effects of co-existing anions.
We also investigated the effects of several common inorganic anions (Cl−, SO42−, HCO3− and NO3−) on the catalytic degradation capacity of the 3% Fe-BOC/PMS system. The existence of SO42− has no impact on the degradation efficiency of CBZ in the system (Fig. 5e and S2e†). The elimination rates of CBZ are 79.9% and 80.6% after the introduction of HCO3− and NO3−, respectively, and the corresponding reaction rate constant also decreased slightly. This can be attributed to the partial consumption of active radicals by HCO3− and NO3− in solution. Furthermore, the weakly alkaline environment formed by the hydrolysis of HCO3− also inhibits the degradation process.64,68 It is important to point out that the adsorption ability of CBZ is greatly increased in the presence of Cl− and the removal rate reaches 85.8%. On the one hand, this phenomenon is caused by CBZ reacting with high concentrations of Cl− to produce a series of chlorine-containing organic by-products.42 On the other hand, the reaction between PMS and Cl− will produce various secondary reactive radicals, which can directly oxidize CBZ.33,69 Consequently, the CBZ concentration decreases significantly during dark adsorption.| | | NO3− + SO4˙−/OH˙ → NO3˙ + SO42−/OH− | (4) |
| | | HCO3− + SO4˙−/OH˙/(O2˙− + H+) → CO3˙− + (SO42− + H+)/H2O/2OH˙ | (5) |
| | | Cl− + SO4˙− → Cl˙ + SO42− | (6) |
| | | Cl− + HSO5− → HOCl + SO42− | (8) |
Recycling studies for CBZ photodegradation were conducted to establish the stability of the 3% Fe-BOC/PMS system. The results are shown in Fig. 5f. After four degradation cycles, the loss of catalytic activity is negligible, demonstrating that the sample is stable and reusable. To further investigate the structural stability of the photocatalyst, the SEM and XRD images of pristine and used 3% Fe-BOC were obtained. As shown in Fig. S3,† there is no obvious difference in the morphology of 3% Fe-BOC before and after the CBZ degradation process. The XRD pattern also shows no obvious change in the crystal phase structure (Fig. S4†). These results reveal that the 3% Fe-BOC hollow microsphere possesses excellent stability and recyclability, which is especially important for CBZ removal by PMS activation under visible light.
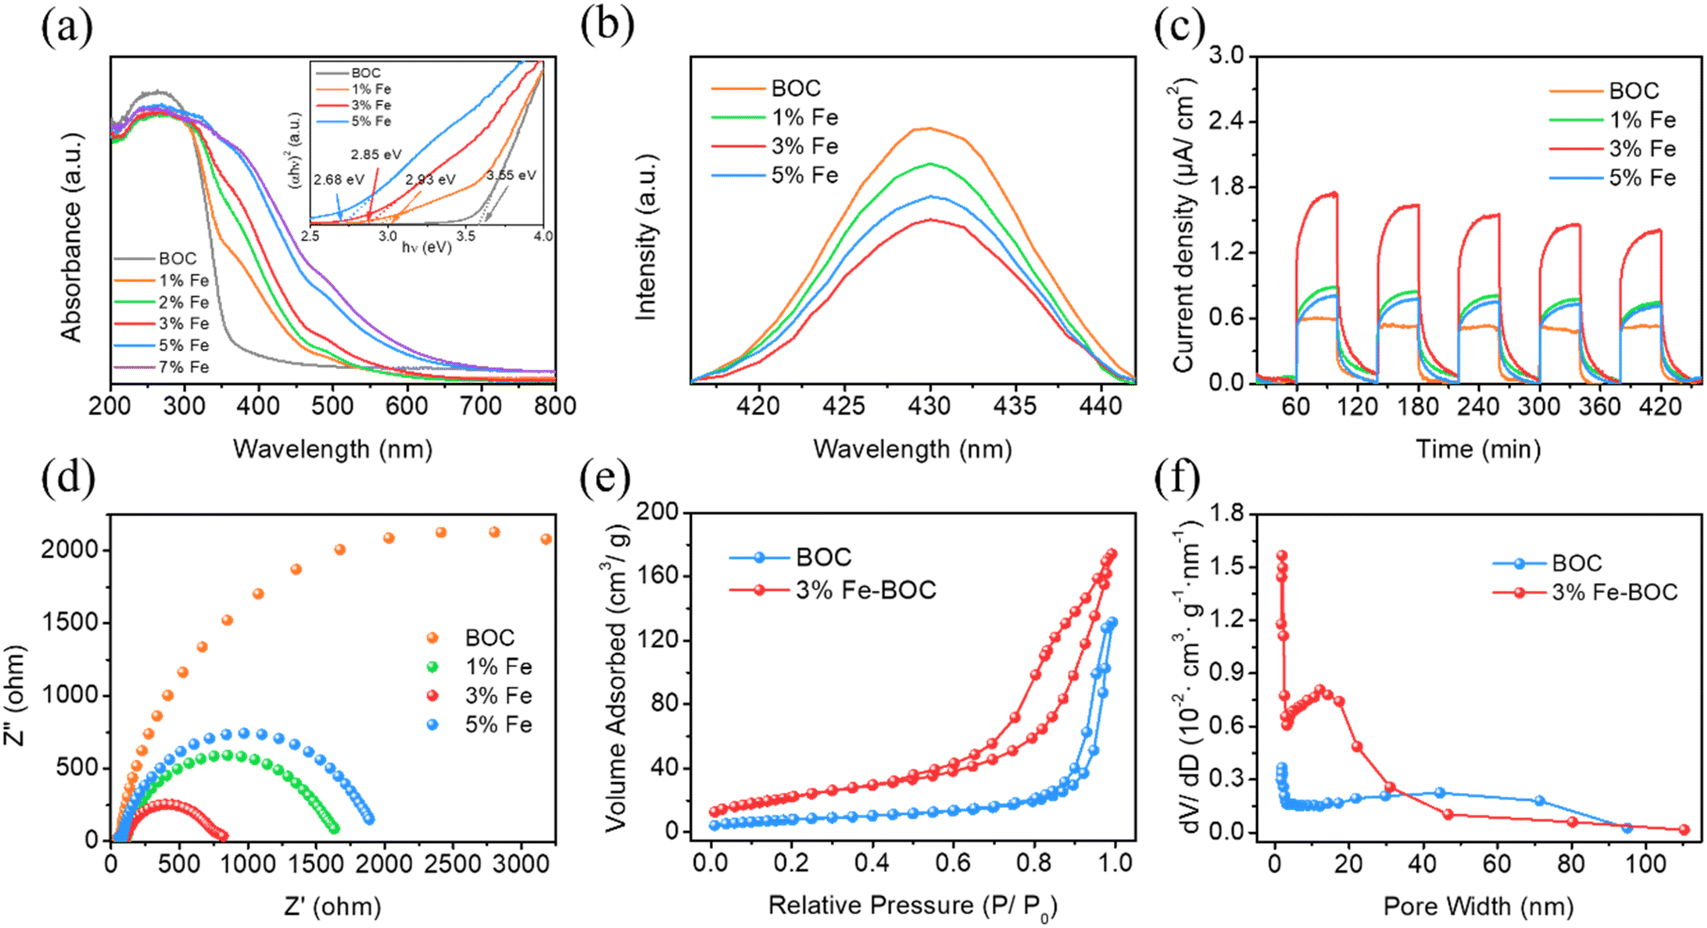
UV-vis diffuse reflectance spectra were utilized to analyze the optical absorption capabilities of different samples. As shown in Fig. 6a, the absorption edge of the individual BiOCl sample lies around 380 nm, which is consistent with the values reported in the literature.70 The composite's absorption edge progressively redshifts with the increase of Fe doping, and the light response range expands to the visible light region, which is possibly explained by the formation of impurity energy levels after Fe incorporation.71 The bandgap energies of BOC, 1% Fe-BOC, 3% Fe-BOC, and 5% Fe-BOC are determined to be 3.52, 2.90, 2.75, and 2.66 eV, correspondingly (Fig. 6a, inset). These results show that the introduction of Fe extends the optical response range of BiOCl, thereby effectively improving the light absorption ability.
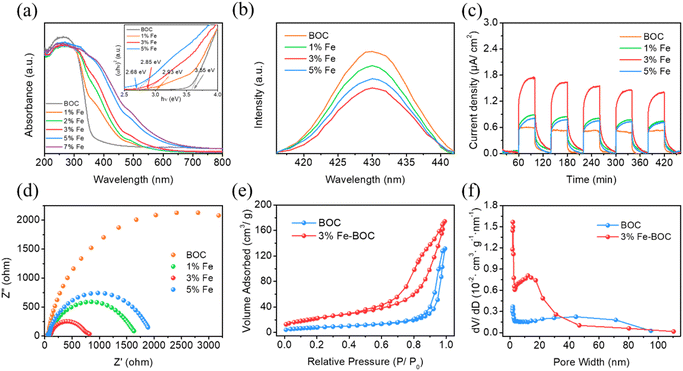 |
| | Fig. 6 (a) UV–vis diffuse reflectance spectra and the calculated bandgap spectra (inset), (b) photoluminescence spectra, (c) transient photocurrent response, (d) Nyquist plots, (e) N2 adsorption–desorption isotherms and (f) pore diameter distribution curves of different samples. | |
Moreover, PL spectroscopy was employed to evaluate the separation performance of photogenerated e−–h+ pairs. Fig. 6b shows that the fluorescence emission peak intensity of all composites is weaker than that of pure BiOCl, indicating that Fe-modified BiOCl successfully inhibits the photogenerated e−–h+ pair recombination. Photoelectrochemical studies were conducted to better investigate the separation and migration performance of photogenerated carriers. Fig. 6c displays that the 3% Fe-BOC sample has the strongest photocurrent response, which confirms the effective separation and migration of photogenerated electrons and holes. Fig. 6d shows that 3% Fe-BOC has the smallest Nyquist radius, which convincingly demonstrates that it has a smaller charge transfer resistance and facilitates fast migration of photogenerated carriers. Based on the results of the aforementioned investigation, it is possible to deduce that Fe doping enhances the light absorption ability of BiOCl and promotes the effective separation and transfer of photogenerated carriers, thereby achieving an enormous boost in the catalytic degradation ability under visible irradiation.
N2 adsorption–desorption tests were performed to investigate the specific surface areas and porous structures of BOC and 3% Fe-BOC, and the related data are summarized in Table S2.† Pure BiOCl and 3% Fe-BOC have specific surface areas of 28.7 and 82.5 m2 g−1, respectively. Both have similar pore volumes, while pure BiOCl exhibits a relatively large average pore size. In general, the increase of the specific surface area promotes the exposure of more reactive sites on the catalyst's surface, which is a significant component in improving photocatalytic performance. As shown in Fig. 6e, both BOC and 3% Fe-BOC display type IV isotherms and H3-type hysteresis loops in the relative pressure ranges of P/P0 = 0.8–1.0 (BOC) and P/P0 = 0.5–1.0 (3% Fe-BOC), which are characteristic of slit-like mesopores produced by lamellar aggregation.72 In 3% Fe-BOC, the shape of the desorption branch isotherm and hysteresis loop suggests the existence of interstitial pores formed by spherical particle accumulation, implying that the sample has a uniform pore structure.73,74 Furthermore, the pore size distribution of the samples (Fig. 6f) show that the pore diameter of 3% Fe-BOC is concentrated in the 10–20 nm range, while BOC has a wider mesopore size distribution. Therefore, we can conclude that the significantly increased specific surface area and abundant pore structure of 3% Fe-BOC effectively promote the exposure of the reaction site and the adsorption of pollutant components, which is conducive to the occurrence of surface catalytic reactions.
3.3. Photocatalytic mechanism of the catalyst–PMS system
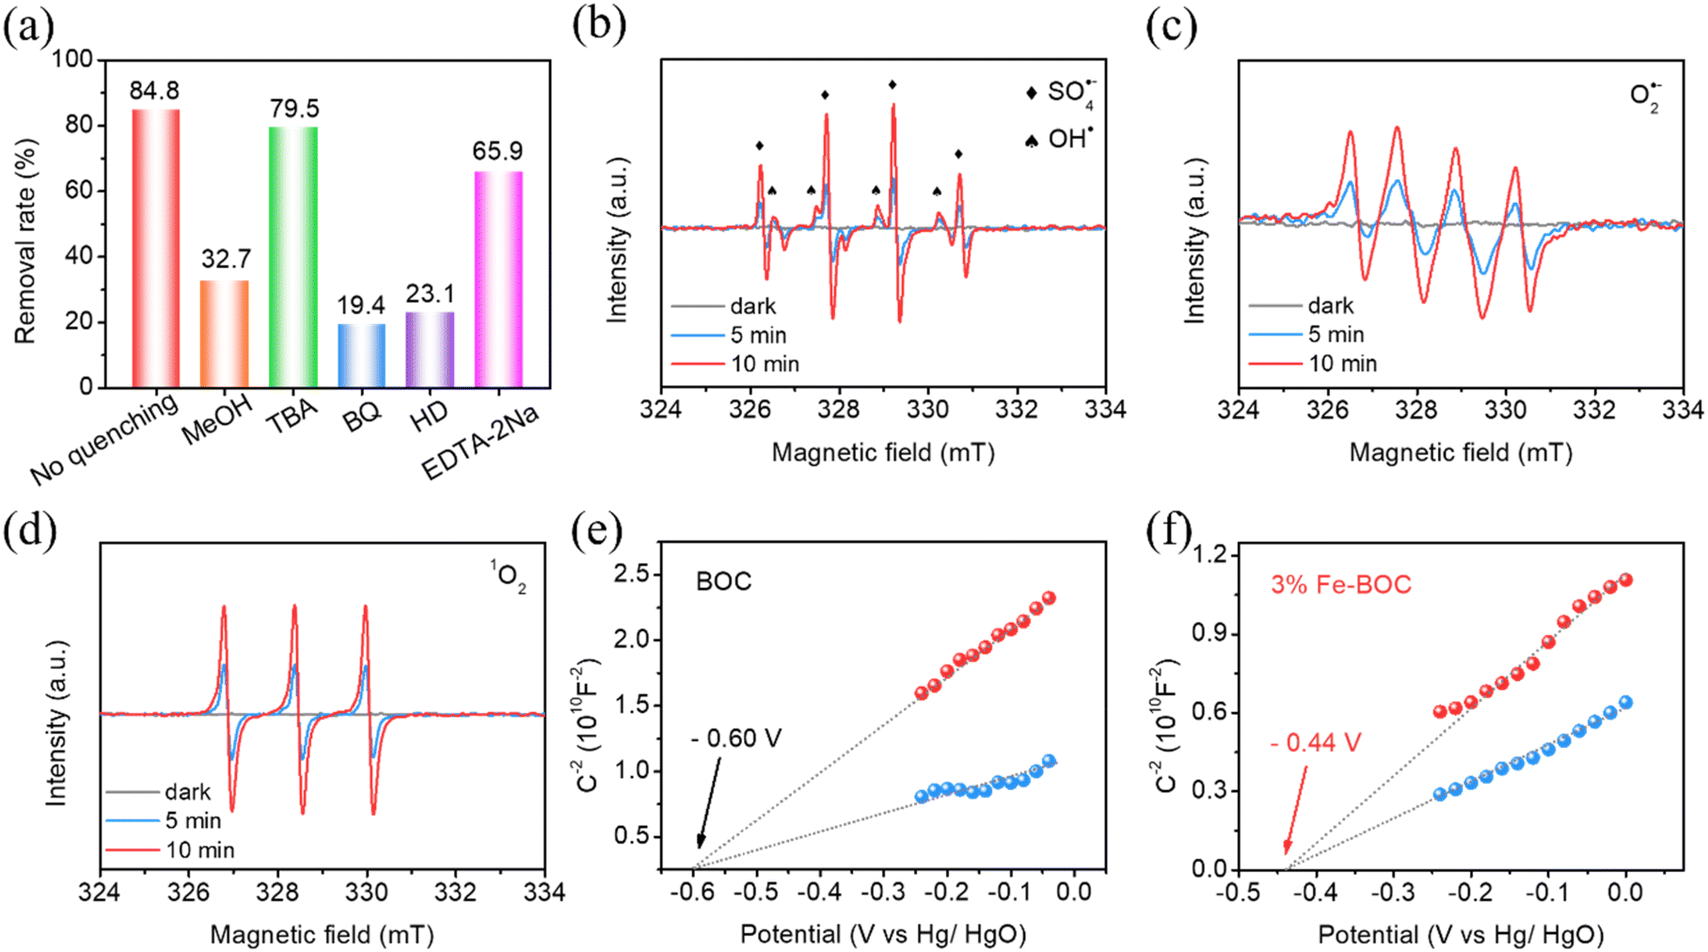
In the photocatalyst–PMS system, a variety of reactive species including OH˙, SO4˙−, 1O2 and O2˙− are likely to participate in CBZ degradation. To explore the corresponding photocatalytic reaction mechanism on the Fe-BOC/PMS system, we first studied the involvement of various active substances in the reaction through capture experiments. Methanol (MeOH), tert-butanol (TBA), p-benzoquinone (BQ), L-histidine (HD) and ethylenediaminetetraacetic acid disodium salt (EDTA-2Na) are used as scavengers to quench SO4˙−, OH˙, O2˙−, 1O2 and h+, correspondingly.75 As demonstrated in Fig. 7a, 34.7% and 71% of CBZ are removed after adding MeOH and TBA, suggesting that SO4˙− exhibits an essential function in the degradation process. The addition of BQ and HD also significantly inhibits the degradation efficiency; the removal rates of CBZ are 19.4% and 23.1%, respectively. Thus, it is reasonable to believe that O2˙− and 1O2 also participate in the CBZ degradation process.
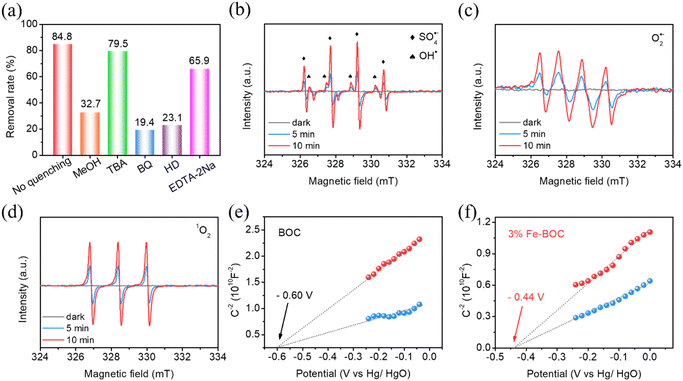 |
| | Fig. 7 Scavenging experiment of the active species (a), ESR spin-trapping spectra for the detection of (b) OH˙ and SO4˙−, (c) O2˙− and (d) 1O2, and Mott–Schottky plots of (e) BOC and (f) 3% Fe-BOC. | |
To acquire more insight into the reactive oxygen species, EPR spin-trap spectra were detected. In the absence of illumination, no EPR signal is recorded in either BOC or Fe-BOC samples (Fig. 7b). After 5 min of visible illumination, a number of peaks with strength ratios of 1![[thin space (1/6-em)]](https://www.rsc.org/images/entities/char_2009.gif) :2:2:1 and 1:1:1:1:1:1 become apparent, corresponding to the distinctive signal peaks of OH˙ and SO4˙−, respectively.32,45,76 The intensity of the signal peak increases when the illumination time extends to 10 min, indicating that 3% Fe-BOC could enhance PMS activation and the breaking of O–O bonds to form OH˙ and SO4˙−. Similarly, the presence of O2˙− and 1O2 is confirmed in Fig. 7c and d. Adsorbed O2 and photogenerated electrons can react to form O2˙−. 1O2 is mainly derived from the free radical reaction after PMS is added. Additionally, as seen in Fig. 7a, h+ is also involved in the oxidative reactions. Capture experiments and EPR tests demonstrate that multiple active species are involved in the photocatalytic removal process.
:2:2:1 and 1:1:1:1:1:1 become apparent, corresponding to the distinctive signal peaks of OH˙ and SO4˙−, respectively.32,45,76 The intensity of the signal peak increases when the illumination time extends to 10 min, indicating that 3% Fe-BOC could enhance PMS activation and the breaking of O–O bonds to form OH˙ and SO4˙−. Similarly, the presence of O2˙− and 1O2 is confirmed in Fig. 7c and d. Adsorbed O2 and photogenerated electrons can react to form O2˙−. 1O2 is mainly derived from the free radical reaction after PMS is added. Additionally, as seen in Fig. 7a, h+ is also involved in the oxidative reactions. Capture experiments and EPR tests demonstrate that multiple active species are involved in the photocatalytic removal process.
The band structures of BOC and 3% Fe-BOC were further studied by the Mott–Schottky test. Fig. 7e and f reveal that the flat band potentials of BOC and 3% Fe-BOC are −0.60 V and −0.44 V (vs. Hg/HgO), respectively. The positive slope indicates that both of them are n-type semiconductors. The potential relative to the standard reversible hydrogen electrode can be converted using the formula ERHE = EHg/HgO + 0.059 × pH − 0.098, by which the CB potentials of BOC and 3% Fe-BOC are −0.35 and −0.19 eV (vs. RHE), respectively. The VB positions of BOC and 3% Fe-BOC can be determined using UV–vis DRS and Mott–Schottky plots and are found to be 3.17 and 2.53 eV, respectively.
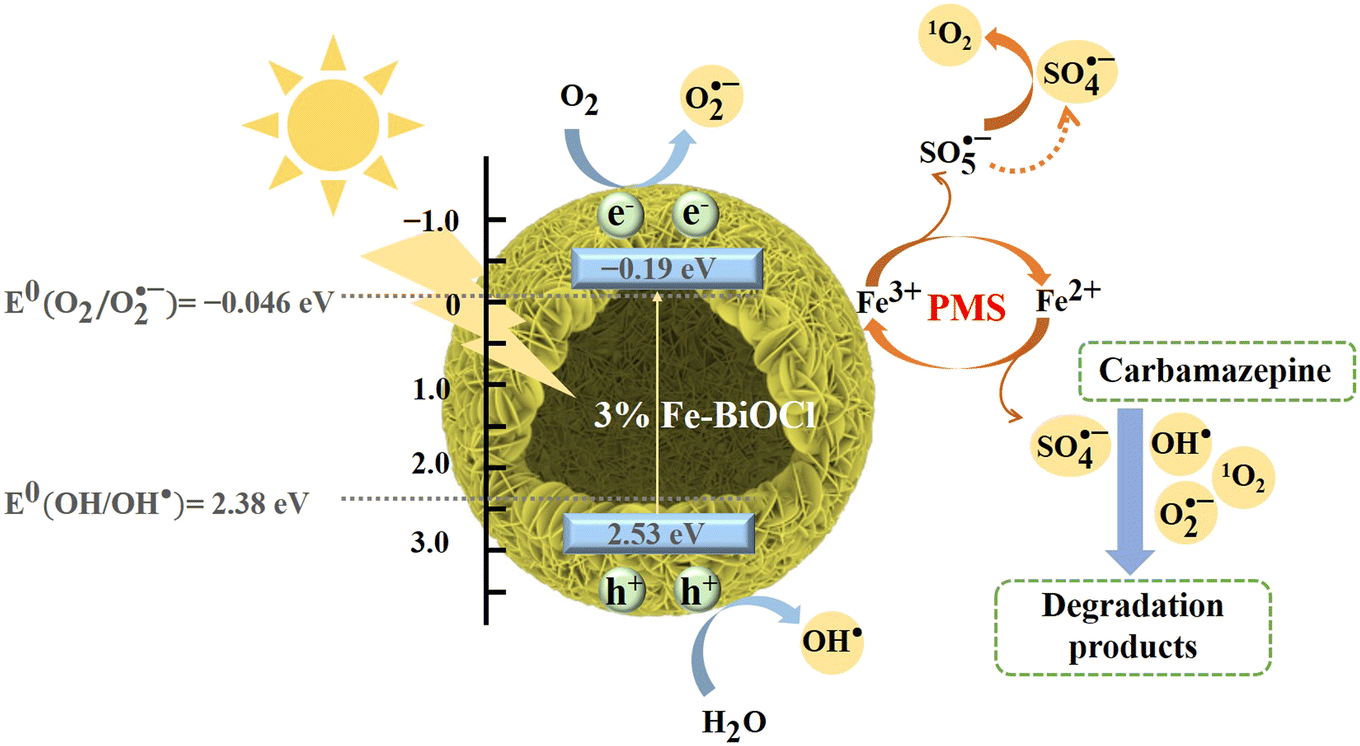
We propose the possible charge transfer paths and reaction mechanisms in the catalytic degradation of CBZ by 3% Fe-BOC based on the above discussion (Fig. 8). First, the e− in the valence band is easily stimulated by visible light and transitions into the impurity energy level, where the conversion of Fe3+ to Fe2+ will consume some e−, thereby limiting the photogenerated carrier recombination (eqns (9) and (10)). The e− of the doped energy level is subsequently injected into the conduction band, leaving an extensive amount of h+ in the valence band. The great number of e− and h+ can directly participate in the reaction to yield O2˙− and OH˙ (e− + O2 → O2˙−, h+ + H2O → OH˙), or be captured by PMS/adsorbed oxygen for further reactions to produce O2˙−, 1O2, SO4˙− and other kinds of active substances (eqns (11)–(14)), which will participate in the catalytic oxidation process of CBZ. Furthermore, Fe2+ can serve as active sites to destroy the O–O bonds of PMS and accelerate the formation of oxidative active radicals, while Fe3+ can also be converted to Fe2+ by HSO5− in the solution. The conversion of Fe3+ and Fe2+ ensures the continuous catalytic process (eqns (15) and (16)). As a result, the catalytic removal of CBZ is carried out by the combined action of h+, O2˙−, 1O2 and SO4˙− (eqn (17); the related reactions are simply summarized as follows:
| | | 3% Fe-BOC + hv → h+ + e− | (9) |
| | | HSO5− + e− → (SO4˙− + OH−) or (OH˙ + SO42−) | (11) |
| | | HSO5− + h+ → SO5˙− + H+ | (12) |
| | | e− + SO4˙− + 2HSO5− → 3SO42− + 1O2 + 2H+ | (14) |
| | | Fe2+ + HSO5− → Fe3+ + SO4˙− + OH− | (15) |
| | | Fe3+ + HSO5− → Fe2+ + SO5˙− + H+ | (16) |
| | | O2˙−, 1O2, SO4˙−, h+ + CBZ → CO2 + H2O, etc. | (17) |
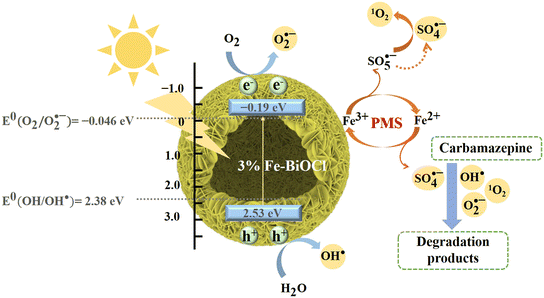 |
| | Fig. 8 Possible mechanism for the visible-light-driven CBZ degradation in the 3% Fe-BOC/PMS system. | |
4. Conclusions
In summary, we used a straightforward one-step solvothermal approach to prepare several kinds of Fe-doped BiOCl hollow microspheres. These hollow microspheres, with a thickness of approximately 300 nm, self-assembled from nanosheets. The resulting hollow structure enhances light absorption by inducing light scattering and reflection, thereby improving light utilization. Our results demonstrate that the incorporation of Fe substantially boosts the photocatalytic performance of BiOCl hollow microspheres. Among these, 3% Fe-BOC exhibits the highest degradation efficiency for CBZ, achieving an elimination rate of 84.6% within 30 min under visible light irradiation. The apparent rate constant is 12 times that of pure phase BiOCl. The increased photocatalytic efficiency can be attributed to the reduction of the bandgap energy of BiOCl by doped Fe, expanding the range of light response into the visible spectrum. Additionally, the incorporated Fe3+ acts as an e− acceptor, facilitating the separation of photogenerated carriers and activating PMS to produce reactive oxidizing substances, thus efficiently degrading CBZ. Capture experiments and EPR analysis confirm the participation of OH˙, SO4˙−, 1O2 and O2˙− in CBZ removal, with SO4˙− identified as the primary active species. Furthermore, 3% Fe-BOC shows outstanding photocatalytic activity over four consecutive cycles, indicating that it should be a reliable PMS activator for CBZ elimination in practical application. In the presence of PMS, a plausible mechanism for the photocatalytic removal of CBZ was also proposed. This work shows the application of visible-light-driven Fe–BiOCl hollow microspheres in the degradation of pollutants and introduces an innovative approach for the rational design and modification of BiOX-based photocatalysts.
Conflicts of interest
There are no conflicts to declare.
Acknowledgements
This work was supported by the National Natural Science Foundation of China (No. 22272207, 22106087), the Fundamental Research Funds for the Central Universities, South-Central MinZu University (No. CZZ23008), and the Joint Funds of the Zhejiang Provincial Natural Science Foundation of China (No. LZY22B070001).
References
- M. Qiao, G. G. Ying, A. C. Singer and Y. G. Zhu, Environ. Int., 2018, 110, 160–172 CrossRef CAS PubMed.
- A. M. Ali, H. T. Ronning, L. K. Sydnes, W. M. Alarif, R. Kallenborn and S. S. Al-Lihaibi, Sci. Total Environ., 2018, 621, 654–662 CrossRef CAS PubMed.
- Y. Yang, Y. S. Ok, K. H. Kim, E. E. Kwon and Y. F. Tsang, Sci. Total Environ., 2017, 596–597, 303–320 CrossRef CAS PubMed.
- N. Liu, X. Jin, C. Feng, Z. Wang, F. Wu, A. C. Johnson, H. Xiao, H. Hollert and J. P. Giesy, Environ. Int., 2020, 136, 105454 CrossRef CAS PubMed.
- P. Rodrigues, L. Guimaraes, A. P. Carvalho and L. Oliva-Teles, J. Hazard. Mater., 2023, 448, 130909 CrossRef CAS PubMed.
- Z. Ren, S. Chen, S.-F. Jiang, W.-F. Hu and H. Jiang, Ind. Eng. Chem. Res., 2021, 60, 2112–2122 CrossRef CAS.
- S. Li, Z. Wang, X. Zhao, X. Yang, G. Liang and X. Xie, Chem. Eng. J., 2019, 360, 600–611 CrossRef CAS.
- M. Patel, R. Kumar, K. Kishor, T. Mlsna, C. U. Pittman, Jr. and D. Mohan, Chem. Rev., 2019, 119, 3510–3673 CrossRef CAS PubMed.
- S. Feijoo, M. Kamali and R. Dewil, Chem. Eng. J., 2023, 455, 140589 CrossRef CAS.
- X. Yang, J. Yang, X. Liu, Q. Wang, D. Liu and D. Wang, Chem. Eng. J., 2023, 460, 141831 CrossRef CAS.
- M. B. Ahmed, J. L. Zhou, H. H. Ngo, W. Guo, N. S. Thomaidis and J. Xu, J. Hazard. Mater., 2017, 323, 274–298 CrossRef CAS PubMed.
- S. Li, Q. Ma, L. Chen, Z. Yang, M. Aqeel Kamran and B. Chen, Chem. Eng. J., 2022, 433, 134492 CrossRef CAS.
- L. Zhang, Y. Li, Q. Li, J. Fan, S. A. C. Carabineiro and K. Lv, Chem. Eng. J., 2021, 419, 129484 CrossRef CAS.
- M. Xu, J. Yang, C. Sun, L. Liu, Y. Cui and B. Liang, Chem. Eng. J., 2020, 389, 124402 CrossRef CAS.
- T. Xia, M. Ju, H. Qian, X. Bai, R. Lai, C. Xie, G. Yu, Y. Tang, C. Wang and Q. Hou, J. Catal., 2024, 429, 115257 CrossRef CAS.
- Y. Xing, X. Jiang, L. Han, X. Jin, G. Ni, Y. Peng, X. Yong and X. Wang, J. Cleaner Prod., 2023, 400, 136631 CrossRef CAS.
- V. Dutta, S. Sonu, P. Raizada, V. K. Thakur, T. Ahamad, S. Thakur, P. Kumar Verma, H. H. P. Quang, V. H. Nguyen and P. Singh, Environ. Sci. Pollut. Res., 2023, 30, 124530–124545 CrossRef CAS PubMed.
- M. Malhotra, A. Sudhaik, Sonu, P. Raizada, T. Ahamad, V.-H. Nguyen, Q. Van Le, R. Selvasembian, A. K. Mishra and P. Singh, Ind. Crops Prod., 2023, 202, 117000 CrossRef CAS.
- K. Sharma, A. Kumar, T. Ahamad, Q. V. Le, P. Raizada, A. Singh, L. H. Nguyen, S. Thakur, V.-H. Nguyen and P. Singh, J. Mater. Sci. Technol., 2023, 152, 50–64 CrossRef CAS.
- F. Tian, T. Tang, X. Di, X. Guo, D. Liu, Y. Shi, Z. Shen, X. Yu and X. Shao, Catal. Sci. Technol., 2024, 14, 62–65 RSC.
- S. Wang, L. Wang and W. Huang, J. Mater. Chem. A, 2020, 8, 24307–24352 RSC.
- M. Z. Shahid, R. Mehmood, M. Athar, J. Hussain, Y. Wei and A. Khaliq, ACS Appl. Nano Mater., 2020, 4, 746–758 CrossRef.
- K. Kalidasan, S. Mallapur, K. Munirathnam, H. Nagarajaiah, M. B. M. Reddy, R. R. Kakarla and A. V. Raghu, Chemosphere, 2024, 352, 141354 CrossRef CAS PubMed.
- X. Wei, M. U. Akbar, A. Raza and G. Li, Nanoscale Adv., 2021, 3, 3353–3372 RSC.
- S. Bai, N. Zhang, C. Gao and Y. Xiong, Nano Energy, 2018, 53, 296–336 CrossRef CAS.
- J. Di, J. Xia, H. Li, S. Guo and S. Dai, Nano Energy, 2017, 41, 172–192 CrossRef CAS.
- X. Gao, C. Gong, X. Wang, W. Zhu and Y. Luo, J. Solid State Chem., 2021, 298, 122131 CrossRef CAS.
- J. Cui, S. Tao, X. Yang, X. Yu, S. Sun, Q. Yang, W. Wei and S. Liang, Mater. Res. Bull., 2021, 138, 111208 CrossRef CAS.
- Y. Wang, C. Ban, J. Meng, J. Ma, H. Zou, Y. Feng, J. Ding, Y. Duan, L. Gan and X. Zhou, Sep. Purif. Technol., 2023, 312, 123379 CrossRef CAS.
- Z. He, H. Fareed, H. Yang, Y. Xia, J. Su, L. Wang, L. Kang, M. Wu and Z. Huang, J. Colloid Interface Sci., 2023, 629, 355–367 CrossRef CAS PubMed.
- C. Guan, T. Hou, W. Nie, Q. Zhang, L. Duan and X. Zhao, Appl. Surf. Sci., 2022, 604, 154498 CrossRef CAS.
- R. Li, M. Cai, Z. Xie, Q. Zhang, Y. Zeng, H. Liu, G. Liu and W. Lv, Appl. Catal., B, 2019, 244, 974–982 CrossRef CAS.
- S. Giannakis, K.-Y. A. Lin and F. Ghanbari, Chem. Eng. J., 2021, 406, 127083 CrossRef CAS.
- Z. Zheng and I. M. C. Lo, Appl. Catal., B, 2021, 299, 120636 CrossRef CAS.
- Q.-T. Sun, B.-D. Xu, J. Yang, T.-T. Qian and H. Jiang, Chem. Eng. J., 2020, 400, 125899 CrossRef CAS.
- C. Dong, Z. Wang, Z. Ye, J. He, Z. Zheng, X. Gong, J. Zhang and I. M. C. Lo, Appl. Catal., B, 2021, 296, 120223 CrossRef CAS.
- Z. Lian, T. Wu, X. Zhang, S. Cai, Y. Xiong and R. Yang, Chem. Eng. J., 2023, 469, 143774 CrossRef CAS.
- A. A. P. Khan, Sonu, A. Sudhaik, P. Raizada, A. Khan, M. A. Rub, N. Azum, M. M. Alotaibi, P. Singh and A. M. Asiri, Catal. Commun., 2023, 179, 106685 CrossRef CAS.
- K. Sharma, V. Hasija, M. Malhotra, P. K. Verma, A. A. Parwaz Khan, S. Thakur, Q. Van Le, H. H. Phan Quang, V.-H. Nguyen, P. Singh and P. Raizada, Int. J. Hydrogen Energy, 2024, 52, 804–818 CrossRef CAS.
- S. Sharma, V. Dutta, P. Raizada, V. Kumar Thakur, A. K. Saini, D. Mittal, V.-H. Nguyen, T. Ahamad, C. Chien Nguyen, S. Young Kim, Q. V. Le and P. Singh, Mater. Lett., 2022, 313, 131716 CrossRef CAS.
- W.-D. Oh, Z. Dong and T.-T. Lim, Appl. Catal., B, 2016, 194, 169–201 CrossRef CAS.
- M.-P. Zhu, J.-C. E. Yang, D. Delai Sun, B. Yuan and M.-L. Fu, Chem. Eng. J., 2022, 436, 135201 CrossRef CAS.
- Y. F. Rao, L. Qu, H. Yang and W. Chu, J. Hazard. Mater., 2014, 268, 23–32 CrossRef CAS PubMed.
- S. Xiao, M. Cheng, H. Zhong, Z. Liu, Y. Liu, X. Yang and Q. Liang, Chem. Eng. J., 2020, 384, 123265 CrossRef CAS.
- Y. Tian, N. Jia, L. Zhou, J. Lei, L. Wang, J. Zhang and Y. Liu, Chemosphere, 2022, 288, 132627 CrossRef CAS PubMed.
- X. Huang, P. Wang, Q. Jiang and J. Hu, Mater. Today Commun., 2023, 35, 105766 CrossRef CAS.
- T.-t. Cao, H. Cui, Q.-w. Zhang and C.-w. Cui, Appl. Surf. Sci., 2021, 559, 149938 CrossRef CAS.
- L. Ding, R. Wei, H. Chen, J. Hu and J. Li, Appl. Catal., B, 2015, 172–173, 91–99 CAS.
- L. Ding, C. Zhang, Q. Jiang, H. Chen, W. Sun and J. Hu, Mater. Lett., 2015, 158, 229–232 CrossRef CAS.
- H. Yu, D. Ge, Y. Wang, S. Zhu, X. Wang, M. Huo and Y. Lu, J. Alloys Compd., 2019, 786, 155–162 CrossRef CAS.
- C. Huang, S. Zou, Y. Liu, S. Zhang, Q. Jiang, T. Zhou, S. Xin and J. Hu, ACS Appl. Mater. Interfaces, 2021, 13, 5088–5098 CrossRef CAS PubMed.
- W. Wang, Q. Zhu, F. Qin, Q. Dai and X. Wang, Chem. Eng. J., 2018, 333, 226–239 CrossRef CAS.
- J. Sun, X. Li, Q. Zhao and B. Liu, Appl. Catal., B, 2021, 281, 119478 CrossRef CAS.
- Z. Long, H. Wang, K. Huang, G. Zhang and H. Xie, J. Hazard. Mater., 2022, 424, 127554 CrossRef CAS PubMed.
- Y. Mi, L. Wen, Z. Wang, D. Cao, R. Xu, Y. Fang, Y. Zhou and Y. Lei, Nano Energy, 2016, 30, 109–117 CrossRef CAS.
- Z. Shen, F. Li, J. Lu, Z. Wang, R. Li, X. Zhang, C. Zhang, Y. Wang, Y. Wang, Z. Lv, J. Liu and C. Fan, J. Colloid Interface Sci., 2021, 584, 174–181 CrossRef CAS PubMed.
- C. Huang, J. Hu, S. Cong, Z. Zhao and X. Qiu, Appl. Catal., B, 2015, 174–175, 105–112 CrossRef CAS.
- T. Zhang, L. Chen, T. Jiang, J. Hou, G. Zhang and A. Hussain, Mater. Today Commun., 2021, 26, 102145 CrossRef CAS.
- L. Wu, G. Jiang, X. Wang, Y. Wang, Y. Zhou and Z. Wu, J. Colloid Interface Sci., 2022, 622, 62–74 CrossRef CAS PubMed.
- J. Cao, W. Cen, Y. Jing, Z. Du, W. Chu and J. Li, Chem. Eng. J., 2022, 435, 134683 CrossRef CAS.
- H. Huang, C. Ma, Z. Zhu, X. Yao, Y. Liu, Z. Liu, C. Li and Y. Yan, Chem. Eng. J., 2018, 338, 218–229 CrossRef CAS.
- C.-Y. Wang, Y.-J. Zhang, W.-K. Wang, D.-N. Pei, G.-X. Huang, J.-J. Chen, X. Zhang and H.-Q. Yu, Appl. Catal., B, 2018, 221, 320–328 CrossRef CAS.
- Z. Wu, Y. Wang, Z. Xiong, Z. Ao, S. Pu, G. Yao and B. Lai, Appl. Catal., B, 2020, 277, 119136 CrossRef CAS.
- S. Fan, J. Shang, S. Kulan, X. He, X. Wang, B. Nasen, J. Nie, D. Feng and X. Cheng, Chem. Eng. J., 2022, 450, 138190 CrossRef CAS.
- Y. Gao, Z. Zhao, L. Song, D. Cao, S. Zhou, T. Gao, J. Shang and X. Cheng, Chem. Eng. J., 2023, 454, 140282 CrossRef CAS.
- L. Liang, S. Gao, J. Zhu, L. Wang, Y. Xiong, X. Xia and L. Yang, Chem. Eng. J., 2020, 391, 123599 CrossRef CAS.
- L. Ling, D. Zhang, C. Fan and C. Shang, Water Res., 2017, 124, 446–453 CrossRef CAS PubMed.
- S. Xiang, H. Dong, Y. Li, J. Xiao, Q. Dong, X. Hou and D. Chu, Sep. Purif. Technol., 2023, 305, 122487 CrossRef CAS.
- A. Wang, Z. Hua, C. Chen, W. Wei, B. Huang, S. Hou, X. Li and J. Fang, Chem. Eng. J., 2021, 426, 131276 CrossRef CAS.
- S. Zhong, X. Wang, Y. Wang, F. Zhou, J. Li, S. Liang and C. Li, J. Alloys Compd., 2020, 843, 155598 CrossRef CAS.
- Z. Mou, H. Zhang, Z. Liu, J. Sun and M. Zhu, Appl. Surf. Sci., 2019, 496, 143655 CrossRef CAS.
- L. Ding, H. Chen, Q. Wang, T. Zhou, Q. Jiang, Y. Yuan, J. Li and J. Hu, Chem. Commun., 2016, 52, 994–997 RSC.
- Y.-H. Lee, Y.-M. Dai, J.-Y. Fu and C.-C. Chen, Mol. Catal., 2017, 432, 196–209 CrossRef CAS.
- C. Chen, T. Jiang, J. Hou, T. Zhang, G. Zhang, Y. Zhang and X. Wang, J. Mater. Sci. Technol., 2022, 114, 240–248 CrossRef CAS.
- L. Wang, X. Lan, W. Peng and Z. Wang, J. Hazard. Mater., 2021, 408, 124436 CrossRef CAS PubMed.
- L. Ding, M. Li, Y. Zhao, H. Zhang, J. Shang, J. Zhong, H. Sheng, C. Chen and J. Zhao, Appl. Catal., B, 2020, 266, 118634 CrossRef CAS.
Footnotes |
| † Electronic supplementary information (ESI) available: ESI data include the detailed description of the photocatalytic activity data, SEM images and XRD patterns. See DOI: https://doi.org/10.1039/d4lf00051j |
| ‡ These authors contributed equally to this work. |
|
| This journal is © The Royal Society of Chemistry 2024 |
Click here to see how this site uses Cookies. View our privacy policy here. 
 Open Access Article
 This Open Access Article is licensed under a
  b and
Juncheng
Hu
b and
Juncheng
Hu