
 Open Access Article
 This Open Access Article is licensed under a Creative Commons Attribution-Non Commercial 3.0 Unported Licence
Engineering Pt nanoclusters on CeO2 surface with abundant point defects by in situ confined-domain encapsulation strategy for the catalytic elimination of VOCs†
Siyi
Ma
ab,
Fang
Dong
 ac,
Weiliang
Han
a,
Weigao
Han
a and
Zhicheng
Tang
*a
ac,
Weiliang
Han
a,
Weigao
Han
a and
Zhicheng
Tang
*a
aNational Engineering Research Center for Fine Petrochemical Intermediates, and State Key Laboratory for Oxo Synthesis and Selective Oxidation, Lanzhou Institute of Chemical Physics, Chinese Academy of Sciences, Lanzhou 730000, China. E-mail: tangzhicheng@licp.cas.cn; Tel: +86 931 4968083
bUniversity of Chinese Academy of Sciences, Beijing 100039, China
cDalian National Laboratory for Clean Energy, Dalian Institute of Chemical Physics, Chinese Academy of Sciences, Dalian, 116023, China
First published on 9th October 2023
Abstract
Pt nanoclusters are a promising catalyst for VOC catalytic combustion, but they have been rarely studied so far. Herein, Pt nanoclusters (Pt NCs) and Pt nanoparticles (Pt NPs) were constructed by an in situ confined-domain encapsulation strategy, and then the reaction mechanism of Pt species on the catalytic combustion of VOCs was studied systematically. Interestingly, the addition process of Pt and Ce components greatly affected the dispersion and surface states of Pt species. The catalytic performance over PtNC@CeO2 (0.01 wt% Pt loadings) was proved to be of outstanding activity and stability, and the reason was related to the contribution of Pt nanoclusters and more lattice oxygen and Ce3+ species, whose formation was inextricably linked to the strong interfacial effect between Pt and CeO2. Notably, the in situ introduction approach of Pt species can effectively build up the point defects on the surface of CeO2 to promote the dispersion and anchoring of Pt species. In situ DRIFT spectroscopy verified that the role of lattice oxygen was significant in accelerating the catalytic oxidation of VOCs, and the oxidation process of toluene followed the reaction path: toluene → benzyl alcohol → benzaldehyde → benzoic acid → phenol → maleic anhydride → carbon dioxide and water. Meanwhile, the rate-determining step in the oxidation of toluene may be the further decomposition of alcohol or carboxylic acid intermediates.
1. Introduction
Volatile organic compounds (VOCs) have a significant effect on the atmosphere. As one of the contaminants in the atmosphere, VOCs can also cause relatively serious damage to human health.1,2 In fact, VOCs are essential precursors to pollutants like ozone, photochemical smog, and PM2.5 and are mostly produced by the production activities of industrial and human sources. Therefore, it is of great importance to convert VOCs into environmentally friendly substances to minimize the impact on human health and the environment. Toluene, as one of the typical indoor VOCs, is mainly used in various common materials, including paints, furniture, adhesives, upholstery materials and chemical solvents.3,4 The most important point is that nowadays, people are exposed most of the time to toluene, so highly attentive efforts are required to eliminate toluene.5 Currently, catalytic oxidation is a more significant and effective method for VOC elimination.6,7 Moreover, as a key factor in the reaction process, the catalytic performance of catalysts has a positive relationship with the efficiency of VOC elimination.8 Obviously, designing a class of excellent and efficient catalysts can help promote the prevention and control of VOC pollutants.Compared with non-precious metal catalysts, precious metal catalysts9–12 are selected to promote the catalytic oxidation efficiency of VOCs by virtue of their high catalytic activity, strong anti-inactivation ability, and low reaction temperature. Among the noble metal catalysts, platinum-based catalysts have better catalytic effects for hydrocarbon and aromatic hydrocarbon VOCs.13–15 Naturally, the key to preparing highly active platinum-based catalysts is to improve the active centers, which requires the assistance of a carrier. The typical active carrier cerium dioxide (CeO2), with its unique characteristic of defect-prone structure and interconversion between different valence states of cerium,16 can act extensively in VOC catalytic combustion especially after the addition of the noble metal platinum (Pt).17,18 More importantly, this type of carrier has strong interactions with precious metal nanoparticles.19,20 Moreover, strong metal–support interactions (SMSIs), generally formed by chemical bonding and associated charge transfer in the active interface region, can significantly improve the catalytic performance of Pt/CeO2 catalysts. Undoubtedly, Pt/CeO2 catalysts stand out among the many catalysts used for VOC catalytic combustion.
However, in typical supported Pt/CeO2 catalysts, noble metal nanoparticles have an uneven size distribution that is not uniform enough to maximize the utilization of their active sites, and the catalysts are prone to agglomeration after a long reaction time and even high-temperature reactions, resulting in catalyst deactivation. These deficiencies have hindered the wide application of Pt/CeO2 catalysts to some extent.21 Therefore, in recent years, there has been a surge of research to improve the dispersion of Pt species (construction of nanoclusters or even atomic-level Pt)22,23 and study the connection between the distribution of the Pt species and catalytic activity.24 Nevertheless, the impact of Pt nanoclusters (Pt NCs) on the efficiency of VOC catalysis has not received much attention. Compared to ordinary metal nanoparticles (M NPs), metal nanoclusters (M NCs) are particularly suited for the field of catalysis because they have a distinct coordination environment, a smaller size, a greater specific surface area and a well-defined atomic structure.25,26 For example, Mostafa et al.27 studied the oxidation of 2-propanol by different shapes of Pt NCs with different reaction efficiencies. Xue et al.28 explored the combustion mechanism of methane with the help of Pt NCs. Likewise, M NCs, as transitions between nanoparticles and atoms, exhibit a more stable electronic energy band structure than single atoms29 and have more abundant catalytically active exposure sites than nanoparticles (NPs), which can significantly increase catalytic efficiency.30,31 Therefore, it is important to expose additional active sites by shrinking Pt species to nanoclusters, thus effectively boosting the catalytic performance. Commonly, the methods of catalyst synthesis also significantly affect their catalytic performance.32,33 For instance, Lai et al.34 enhanced hydrogen precipitation catalysis by modulating the electronic structure of Pt nanoclusters. In addition, SMSI is also a factor that cannot be neglected in the catalyst preparation process. To our knowledge, nonetheless, there have not been any studies on surface defect engineering on CeO2 to control the particle size of Pt species and their use in catalytic oxidation of VOCs.
Herein, Pt NCs and Pt NPs were constructed by an in situ confined-domain encapsulation strategy, and the reaction mechanism of the action of Pt species was systematically investigated. In order to carefully optimize Pt–CeO2 catalysts, the effects of Pt and Ce species on the catalytic performance of Pt–CeO2 catalysts were examined in this article. Scheme 1 shows the preparation process of each catalyst. Among them, adding sodium borohydride (NaBH4) in situ to generate more Ce3+ species was beneficial to promote the catalytic performance.35 With the aid of many characterization methods, the PtNC@CeO2 catalyst prepared by an in situ confined strategy demonstrated good catalytic performance. With more lattice oxygen and Ce3+ species over the PtNC@CeO2 catalyst, an abundance of oxygen vacancies could be generated, thus effectively regulating the electronic structure. The formation of the interfacial effect between Pt and Ce by PtNC@CeO2 was important, which caused changes in the surrounding coordination environment and also favored the anchoring of Pt nanoclusters. It was proved that the size and distribution of Pt species were impacted by the manner of the Pt and Ce introduction. In conclusion, we studied the toluene catalytic mechanism over PtNC@CeO2 employing an in situ confined-domain encapsulation strategy to achieve the precise construction of noble metal catalysts, which showed a remarkable low-temperature activity as well as low Pt loading and good stability. As a result, this work provides Pt nanocluster catalysts with high catalytic activity, which would inspire researchers to pursue in situ confined methods to improve the catalytic activity of nanoclusters and offer some implications for the precise construction of highly dispersed Pt nanoparticles.
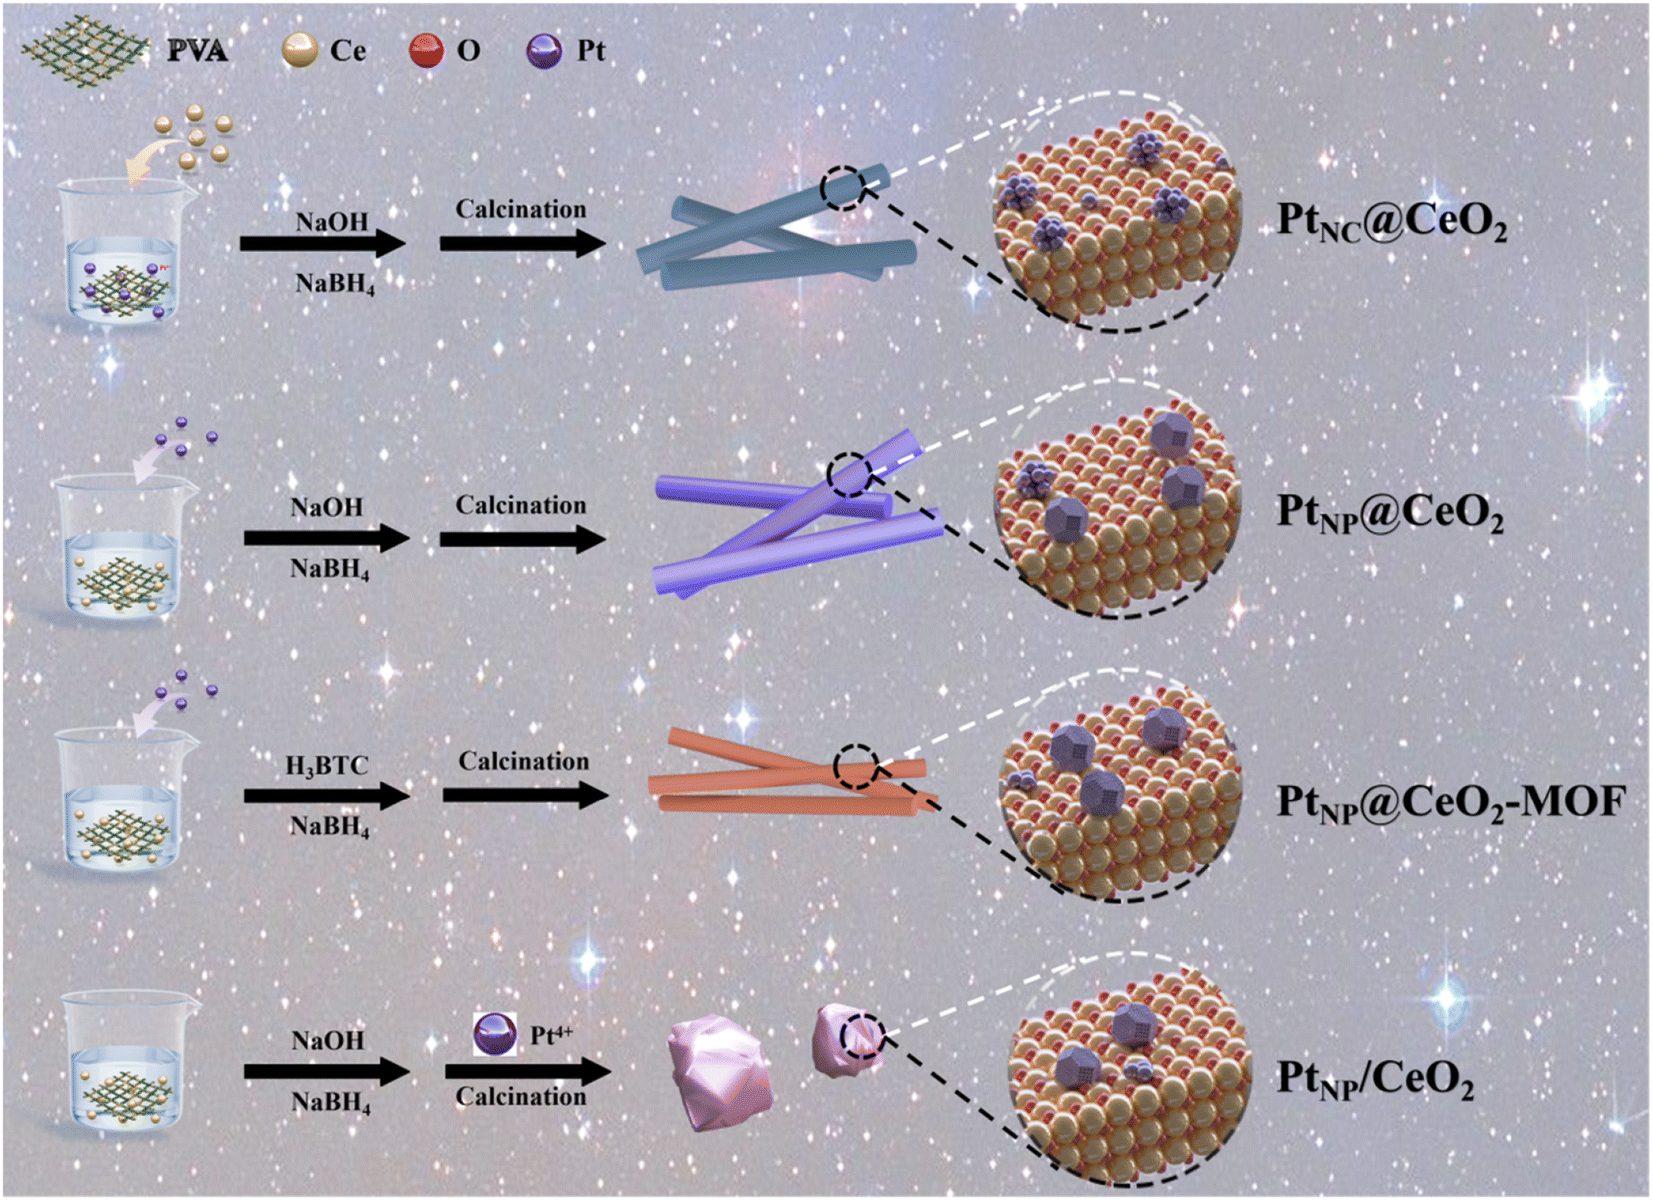 | ||
| Scheme 1 Schematic illustration of the synthetic process of Pt–CeO2 catalysts. | ||
2. Experimental contents
2.1 Chemical reagents
Cerous nitrate (Ce(NO3)3·6H2O), sodium hydroxide (NaOH), homophenic acid (H3BTC), chloroplatinic acid (H2PtCl6), polyvinyl alcohol (PVA), sodium borohydride (NaBH4), N,N-dimethylformamide (DMF) and other chemical reagents were used directly.2.2 Preparation of PtNP@CeO2 sample
In deionized water (20 mL) at 90 °C, Ce(NO3)3·6H2O (3.472 g) and a small quantity of PVA (PVA/noble metal mass ratio = 1.2![[thin space (1/6-em)]](https://www.rsc.org/images/entities/char_2009.gif) :1.0) were dissolved. After cooling, solution A was created by adding 0.037 mL H2PtCl6 (19.3 mmol L−1). 38.4 g of NaOH (6 mol L−1) was diluted in 140 mL deionized water to form solution B, and then solution B was combined with solution A to create solution C. Drops of dissolved NaBH4 (0.05 g) in deionized water were then added to solution C. After vigorous stirring for 30 min at ambient temperature, solution C was then added to a hydrothermal reactor (100 °C, 24 h). The resulting precipitate (PtNP@Ce(OH)3) was washed with distilled water before being vacuum-dried overnight at 80 °C and calcined in air for 4 h at 400 °C. The prepared sample was labeled as PtNP@CeO2. On this basis, a catalyst without NaBH4 incorporation was also synthesized, which is documented in the ESI.†
:1.0) were dissolved. After cooling, solution A was created by adding 0.037 mL H2PtCl6 (19.3 mmol L−1). 38.4 g of NaOH (6 mol L−1) was diluted in 140 mL deionized water to form solution B, and then solution B was combined with solution A to create solution C. Drops of dissolved NaBH4 (0.05 g) in deionized water were then added to solution C. After vigorous stirring for 30 min at ambient temperature, solution C was then added to a hydrothermal reactor (100 °C, 24 h). The resulting precipitate (PtNP@Ce(OH)3) was washed with distilled water before being vacuum-dried overnight at 80 °C and calcined in air for 4 h at 400 °C. The prepared sample was labeled as PtNP@CeO2. On this basis, a catalyst without NaBH4 incorporation was also synthesized, which is documented in the ESI.†
2.3 Preparation of PtNC@CeO2 sample
A small amount of PVA (PVA/noble metal mass ratio = 1.2:1.0) and a certain amount of H2PtCl6 (0.037 mL) were mixed with distilled water at 90 °C. After cooling, Ce(NO3)3·6H2O (3.472 g) was added to the chloroplatinic acid solution to form solution A. Meanwhile, 38.4 g of NaOH (6 mol L−1) was diluted in 140 mL of deionized water to make solution B. Then solution C was obtained by mixing solution B with solution A. Subsequently, 0.05 g of NaBH4 dissolved in distilled water was added dropwise to solution C. Next, solution C was stirred vigorously for 30 min (25 °C) and poured into a hydrothermal reactor for 24 h at a constant temperature of 100 °C. The precipitate was subsequently treated in the same way as the PtNP@Ce(OH)3 precipitate. The prepared sample was labeled as PtNC@CeO2.
2.4 Preparation of PtNP@CeO2-MOF sample
To verify the influence of Pt introduction methods on the catalysts, PtNP@CeO2-MOF catalyst was prepared. The catalyst was prepared using the same process as for the PtNP@CeO2 sample and the only difference was the composition of solution B. The main additions to solution B were 1.681 g H3BTC, 5 mL of deionized water and 20 mL of DMF. In addition, the dried PtNP@Ce-MOF sample was roasted at 400 °C.2.5 Preparation of PtNP/CeO2 sample
The PtNP/CeO2 sample was also synthesized in the same way as the PtNP@CeO2 sample, except that H2PtCl6 was added in a different way. The PtNP/CeO2 sample was impregnated with H2PtCl6 (0.023 mL) onto 0.861 g CeO2.2.6 Characterization technique
We used in situ diffuse reflectance infrared Fourier transform spectroscopy (DRIFTS) to probe the reaction mechanism. The results were obtained using a VERTEX 70 spectrometer which consists of an MCT detector and a CaF2 window in situ cell. The frequency range of the spectra is mainly from 4000 to 600 cm−1. For the adsorption of VOCs, the PtNC@CeO2 catalyst (200 mg) was pretreated for 30 min at 300 °C under N2. After cooling to 100 °C, the catalyst was exposed to VOCs/N2 (20 mL min−1) and reached adsorption saturation for some time. Subsequently, N2 was passed through and in situ DRIFTS spectra of the catalysts were collected at different temperatures (150 °C, 200 °C, 250 °C, 300 °C and 350 °C). Next, the same pretreatment and adsorption process was applied to the fresh PtNC@CeO2 catalyst, and then air with a flow rate of 20 mL min−1 was fed at 100 °C to obtain in situ DRIFTS results at different temperatures.The details of other characterization techniques, such as transmission electron microscopy (TEM), X-ray diffraction (XRD), Raman spectroscopy, N2 adsorption–desorption, inductively coupled plasma optical emission spectrometry (ICP-OES), X-ray photoelectron spectroscopy (XPS), O2 temperature-programmed desorption (O2-TPD), NH3 temperature-programmed desorption (NH3-TPD), and H2 temperature-programmed reduction (H2-TPR) are described in the ESI.†
3. Results and discussion
3.1 Catalytic performance
The catalysts were synthesized utilizing various methods. Fig. 1 displays the outcomes of the analysis. In Fig. 1a, the activity of the Pt–Ce catalysts showed a wide variation, highlighting the prominent influence of Pt and Ce introduction methods on the catalytic reactivity. First, the activity of the PtNC@CeO2 sample (T90 = 260 °C) was significantly better than that of the PtNP@CeO2 sample (T90 = 292 °C), demonstrating that the Pt species introduction method was preferable to the Ce species introduction approach for improving the catalytic activity. Second, the use of different substrates may have a significant impact on the catalytic activity. As an example, the activity of PtNP@CeO2-MOF did not exceed 90% conversion when compared to that of PtNC@CeO2 and PtNP@CeO2-MOF. Furthermore, compared to PtNP/CeO2 (T90 = 373 °C) synthesized by the impregnation method, the PtNC@CeO2 catalyst produced by the in situ confined-domain encapsulation approach was more practical for the catalytic combustion of VOCs. Moreover, the catalyst that had not been subjected to NaBH4 treatment was measured and the result is displayed in Fig. S1a.† The catalytic performance was significantly impacted by the addition of NaBH4. The activity of the PtNC@CeO2 catalyst was also relatively good as shown in Table S1.†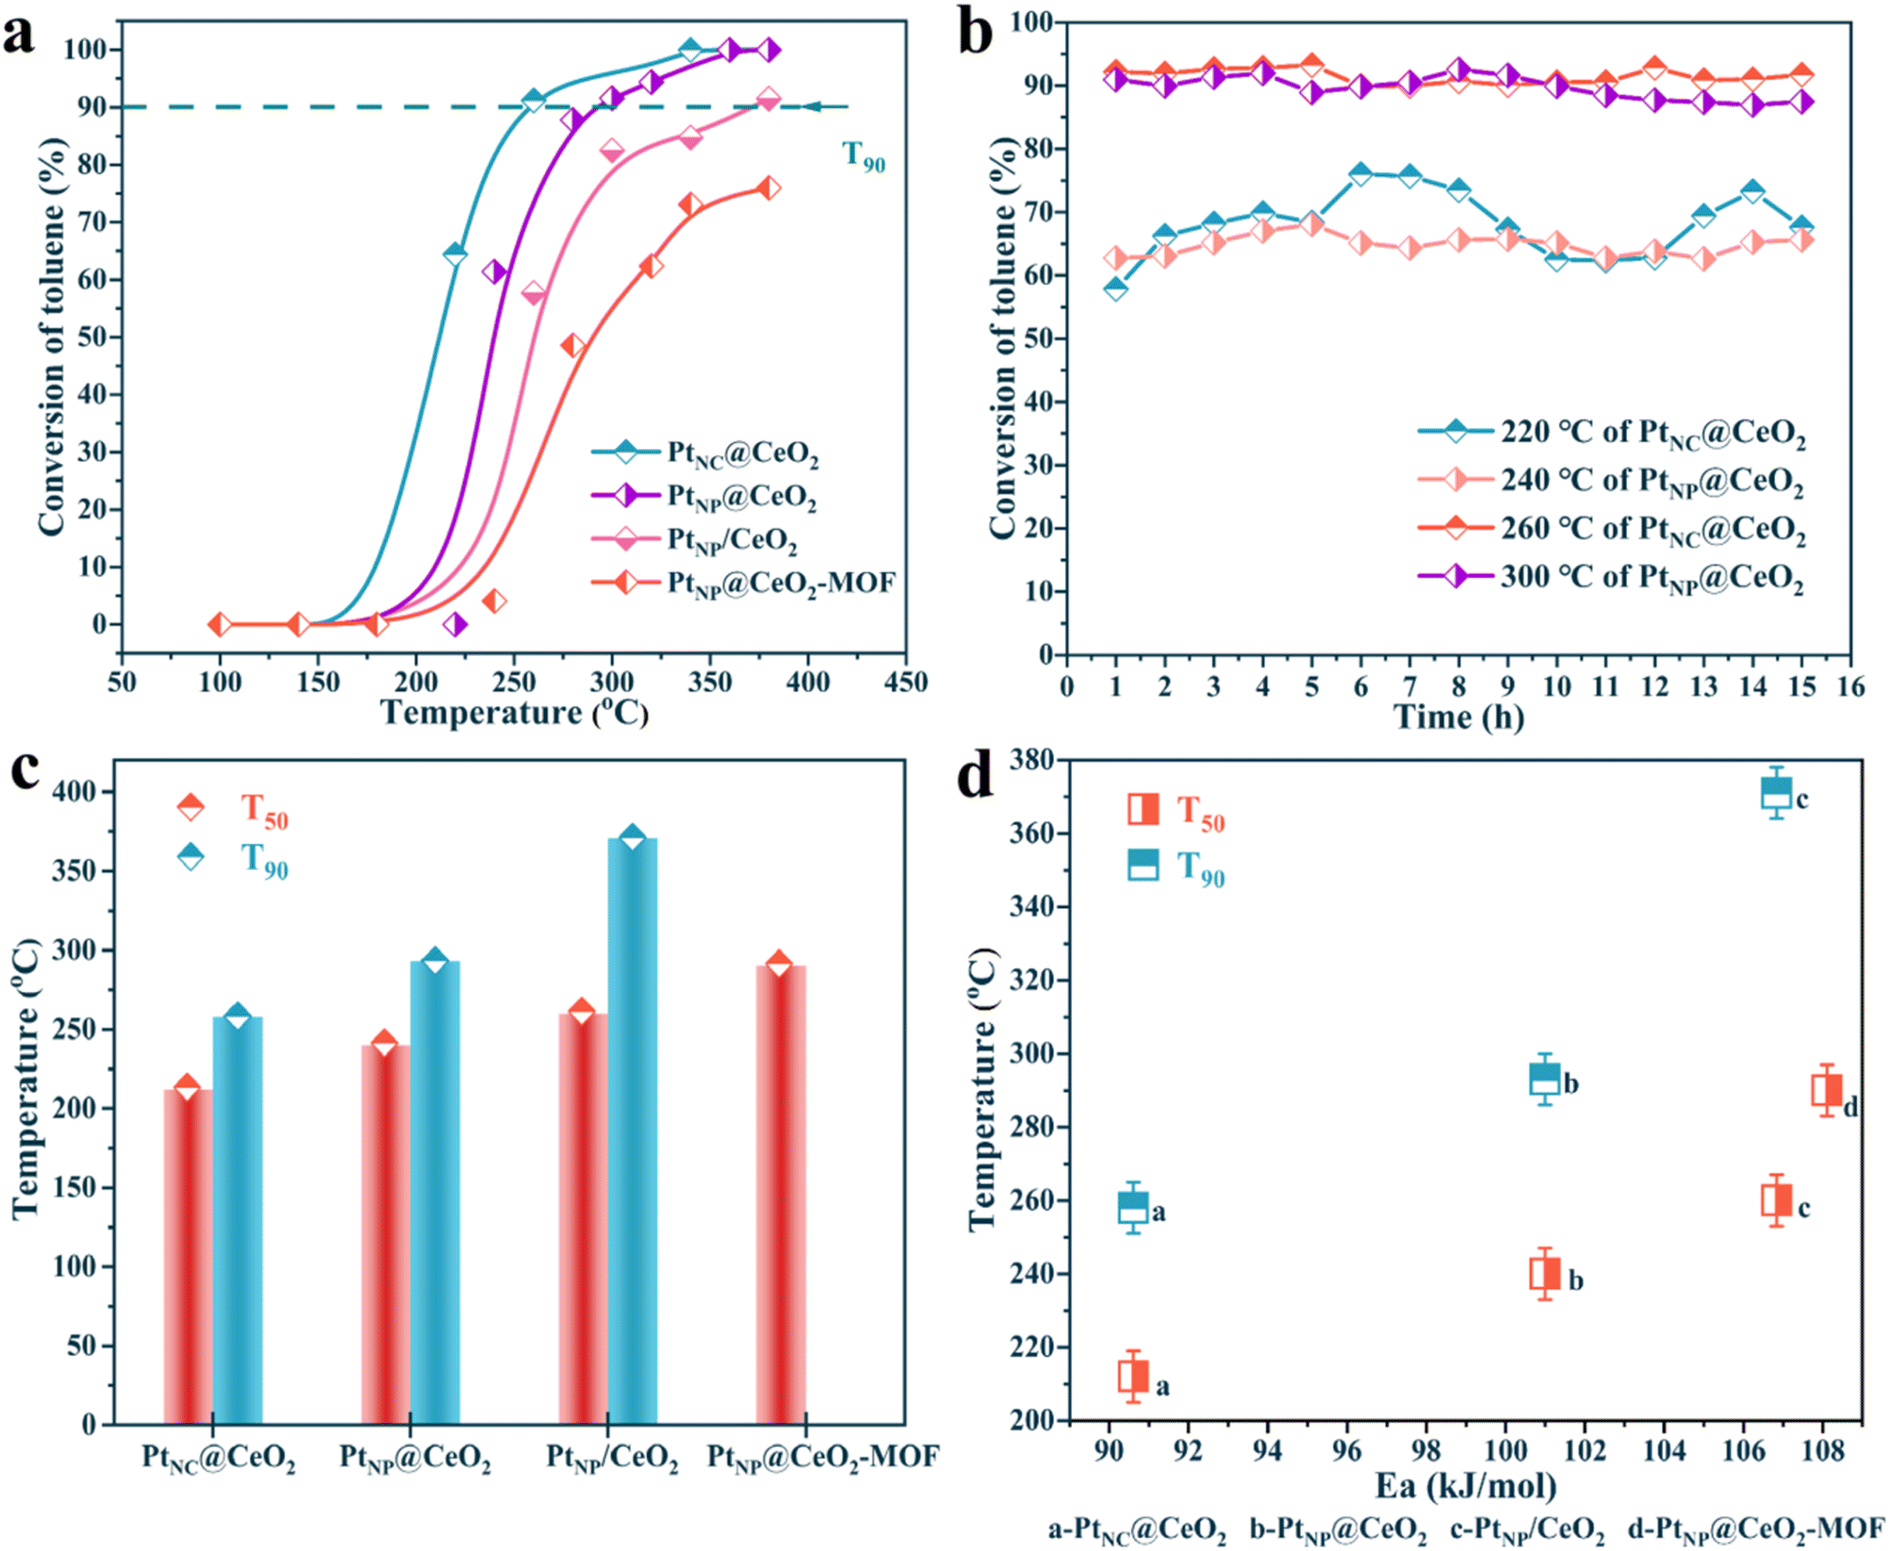 | ||
| Fig. 1 The activity plot of PtNC@CeO2, PtNP@CeO2, PtNP/CeO2 and PtNP@CeO2-MOF catalysts (a), the stability tests of PtNC@CeO2 and PtNP@CeO2 under dry conditions (b), the comparison of T50 and T90 of each catalyst (c) and the catalytic activity versus Ea over the catalysts (d). | ||
Subsequently, the thermal stability of PtNC@CeO2 and PtNP@CeO2 samples was tested under dry conditions at high and low conversions (Fig. 1b), respectively. For the PtNC@CeO2 catalyst, the toluene conversion remained at 60–70% for 15 h at 220 °C, while that was maintained essentially above 90% at 260 °C. As for the PtNP@CeO2 catalyst, the toluene conversion was kept between 60% and 65% for 15 h at 240 °C, while at 300 °C the toluene conversion was around 90% for 15 h, and slightly decreased after 10 h. Besides, we also performed stability tests (T90) on PtNC@CeO2 and PtNP@CeO2 catalysts for up to 40 h (Fig. S1b†). The PtNC@CeO2 sample still maintained 90% conversion, while the conversion of the PtNP@CeO2 sample was maintained above 85%. It was clear that the PtNC@CeO2 catalyst exhibited better durability at a high temperature than the PtNP@CeO2 catalyst. The strategy of in situ introduction of Pt species could effectively promote the catalytic activity as shown in Fig. 1a. In Fig. 1c, a comparison of T50 and T90 for each catalyst was drawn. The temperature order of the low conversions for each catalyst was similarly consistent with the order of the high conversions, and the PtNC@CeO2 catalyst demonstrated the best activity. In addition, the carbon balance based on the import and export concentration was calculated and the carbon balance of each catalyst was significantly better than 96%.
As shown in Fig. S2,† there was a certain linear relationship about the four samples of lnr and 1000/T, which was named as the Arrhenius curve, and the Ea value of each catalyst can be calculated. The results showed that the main order of the Ea value of each catalyst was PtNC@CeO2 (90.61 kJ mol−1) < PtNP@CeO2 (101.00 kJ mol−1) < PtNP/CeO2 (106.84 kJ mol−1) < PtNP@CeO2-MOF (108.11 kJ mol−1). It was also established that the PtNC@CeO2 catalyst had the highest activity, when the activity analysis was combined with the Ea value of each catalyst, which had an inverse pattern with regard to the activity. More importantly, the oxidation of toluene mainly depends on kinetics at low conversion (<20%), leading to the construction of the Arrhenius plot. Therefore, the credibility of the Ea value of this work was relatively high. In addition, both T50 and T90 of the catalysts were positively correlated with Ea (Fig. 1d), confirming that the PtNC@CeO2 catalyst had the most excellent catalytic performance.
3.2 Microstructure of the catalysts
Fig. 2 displays the micromorphology of each catalyst and the dispersion conditions of the Pt species by TEM. PtNC@CeO2 and PtNP@CeO2 exhibited short rod-shaped structures which have a length of 50–100 nm with a width of about 10 nm. The PtNP@CeO2-MOF sample displayed an elongated rod-like structure with a length of 50–100 nm, and the PtNP/CeO2 sample showed polyhedral structures of about 10 nm in diameter, demonstrating that the preparation methods had a massive effect on the morphology of catalysts. For PtNC@CeO2 and PtNP@CeO2, the differed introduction methods of Pt and Ce species did not affect the catalyst morphology but altered the size of Pt species over the Pt/CeO2 catalyst (Fig. 2e and f). Generally speaking, when the particle size is reduced to a nanocluster, the lattice is not easily identified and eventually disappears.36 Therefore, it is clear that PtNC@CeO2 had more Pt nanoclusters (Pt NCs) and the diameter of the nanoclusters was mainly less than 1 nm as seen by HRTEM.37 The PtNP@CeO2 sample exhibited the presence of nanoparticles (>1 nm) as shown in Fig. 2f, which could also be confirmed by Fig. S3.† In addition, the presence of Pt nanoparticles (Pt NPs) on PtNP@CeO2-MOF and PtNP/CeO2 samples is revealed in Fig. 2g and h. Combined with the catalytic performance, the production of Pt NCs was one of the crucial elements to enhance the catalytic activity. It may be because the metal atoms in nanoclusters were mainly located at the corners and edges with a large contact surface,38 which increased the active sites' exposure and thus promoted the catalytic activity. Moreover, the irregularity of the microstructure may be the reason for the poor activity of the PtNP/CeO2 catalyst.39,40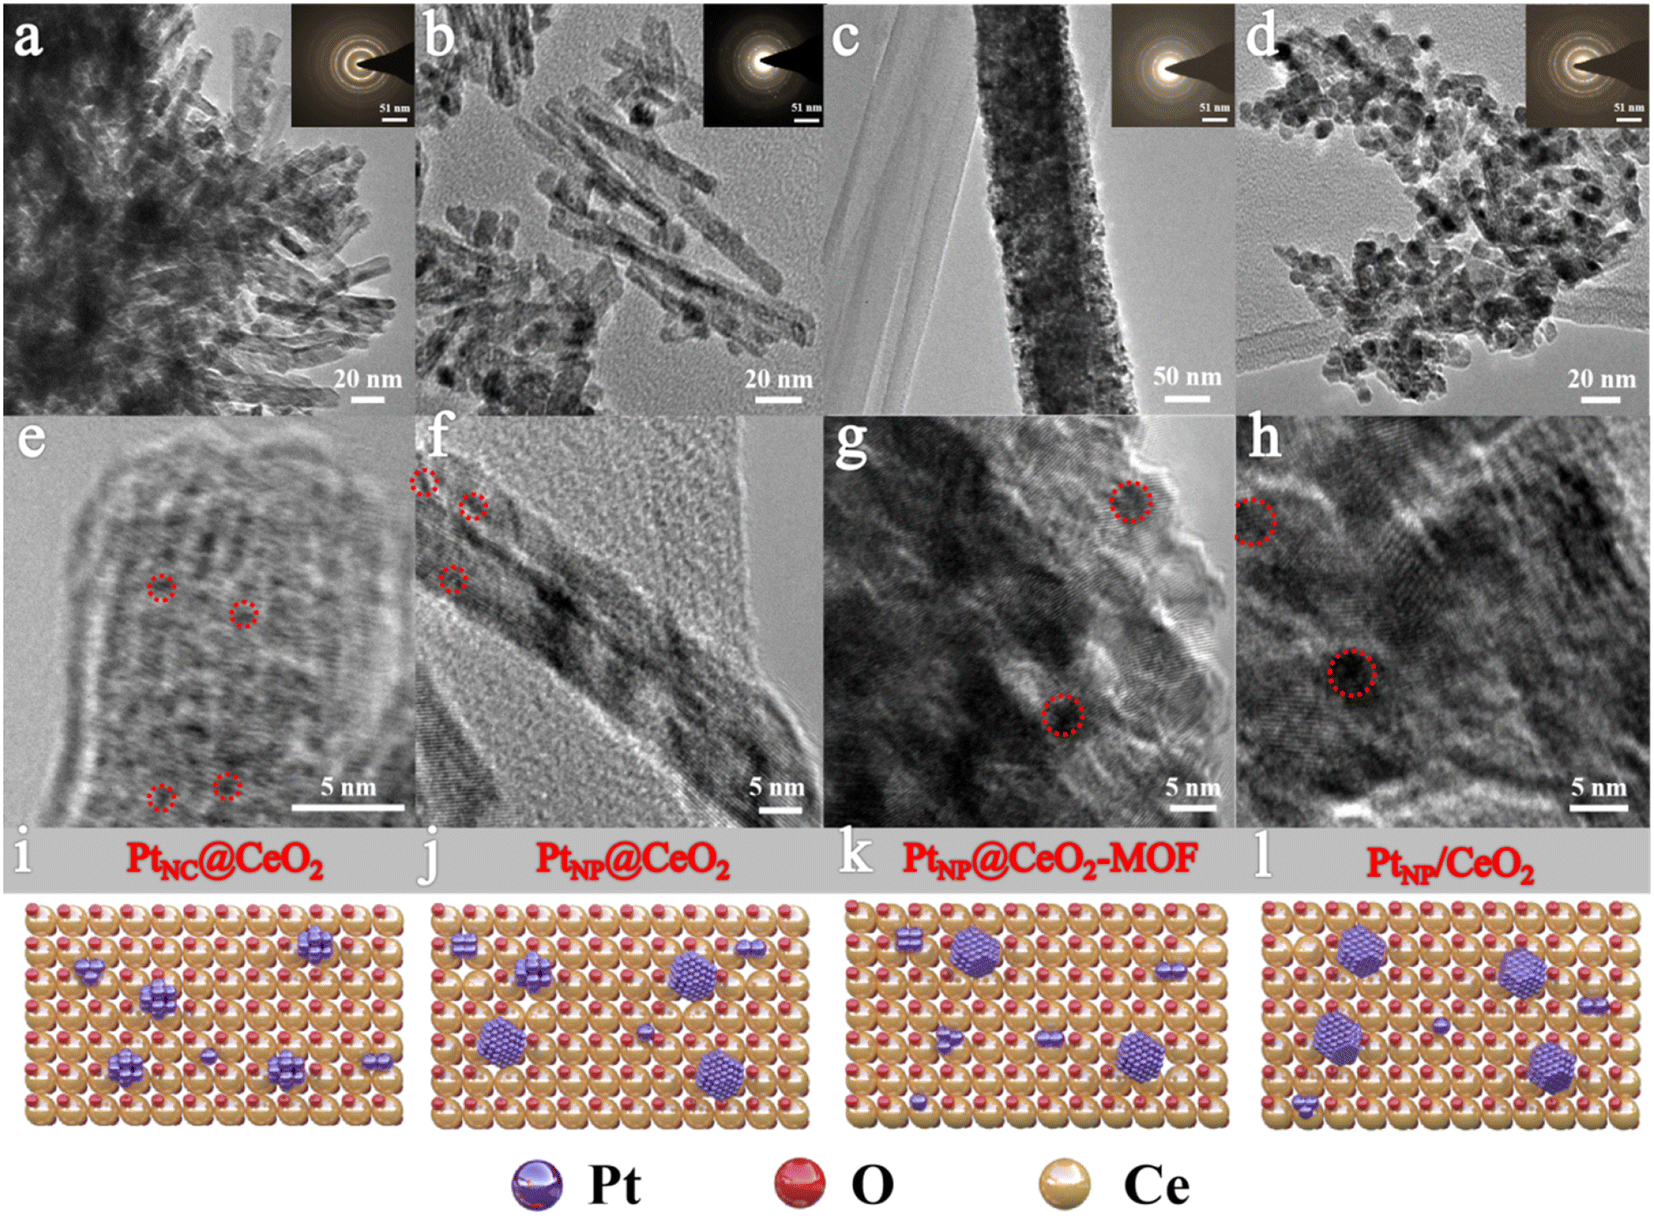 | ||
| Fig. 2 The TEM images of PtNC@CeO2 (a and e), PtNP@CeO2 (b and f), PtNP@CeO2-MOF (c and g) and PtNP/CeO2 (d and h) and the schematic structure of each catalyst (i–l). The inset shows the lattice diffraction rings of each catalyst. | ||
The XRD patterns are shown in Fig. 3. The derived peaks of 28.6°, 33.1°, 47.5°, 56.3°, 59.1°, 69.4°, and 76.7° (2θ) were attributed to the (111), (200), (220), (311), (222) and (331) crystal planes of CeO2 with face-centered cubic structure, respectively. The results could be compared with the XRD peaks of CeO2 (JCPDS 34-0394), indicating that the four catalysts contained primarily the crystal structure of CeO2. At the same time, the XRD patterns showed no Pt-related diffraction peak, which may be related with the low Pt content or the existence of highly dispersed Pt nanoparticles. In common, the presence of wider peaks in the XRD diffraction peaks indicated that the active metal components exhibited high dispersion,41 which facilitated the emergence of more active sites and thus promoted the catalytic oxidation process. In contrast to the PtNP@CeO2 sample, PtNC@CeO2 showed a border peak width, which implied that it had a smaller grain size contributing to the generation of lattice defects.42,43 The XRD results demonstrated that the different methods of Pt and Ce introduction had an impact on the crystal sizes of the catalysts.
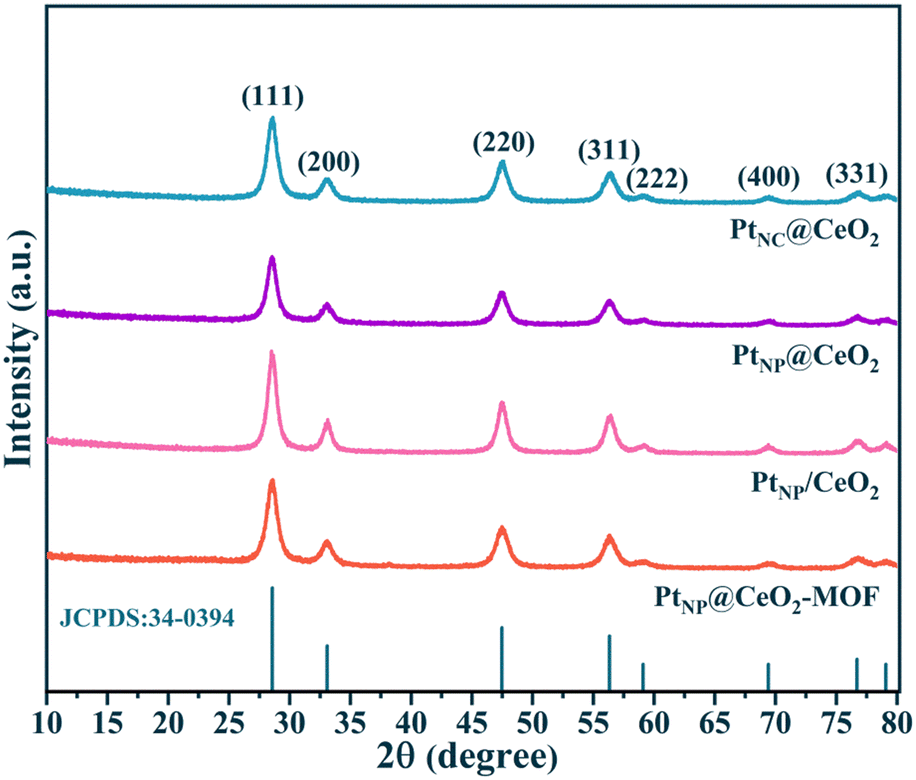 | ||
| Fig. 3 The XRD patterns of the four catalysts. | ||
To gain insight into the molecular structure, Raman measurement was performed on the catalysts (Fig. 4). There were two main peaks for each catalyst in the Raman spectrum. The peak at around 458–464 cm−1 could be attributed to the Ce–O–Ce mode of the fluorite-type CeO2 structure (F2g).31 The peak of 579 cm−1 was attributed to the defect-induced (D) mode, which was associated with Ce3+-induced oxygen vacancies. Metal–support interactions, in general, influenced the energy produced by the band in the D mode, implying that various amounts of oxygen vacancies were formed. It can be seen in Fig. 4a that more oxygen vacancies were exhibited in the PtNC@CeO2 catalyst, which may be related to the presence of Ce3+ or may be due to the vibrations generated when the highly dispersed PtO interacts with the cerium oxide carrier to form Pt–O–Ce bonds, thus creating defects in the cerium oxide lattice, which was also consistent with the XRD result. Apparently, the D-mode peak of the PtNP@CeO2-MOF sample was relatively weak compared to that of the other three catalysts, which may also be caused by the insignificant interaction between the precious metal (Pt) and the carrier (CeO2). More importantly, through the magnified schematic of Raman (Fig. 4b), compared with the PtNP@CeO2-MOF sample, we found that the F2g mode bands of PtNC@CeO2, PtNP@CeO2 and PtNP/CeO2 catalysts showed a certain degree of red shift and the peak intensity also decreased to a certain degree. This suggested that the structure of fluorite might have changed, which was confirmed to be due to the emergence of Pt–O–Ce bonds. It is possible that the introduction of the reducing agent promoted the construction of point defects in the carrier, thus contributing to the SMSI effect.44 The Raman result elucidated that the formation of the SMSI effect in the PtNC@CeO2 catalyst caused the production of additional Pt–O–Ce bonds. At the same time, the PtNC@CeO2 catalyst generated more oxygen vacancies, which provided the active centers and promoted the catalytic reaction of VOCs. It was also verified that the PtNC@CeO2 catalyst had the best activity, which was in agreement with the activity result.
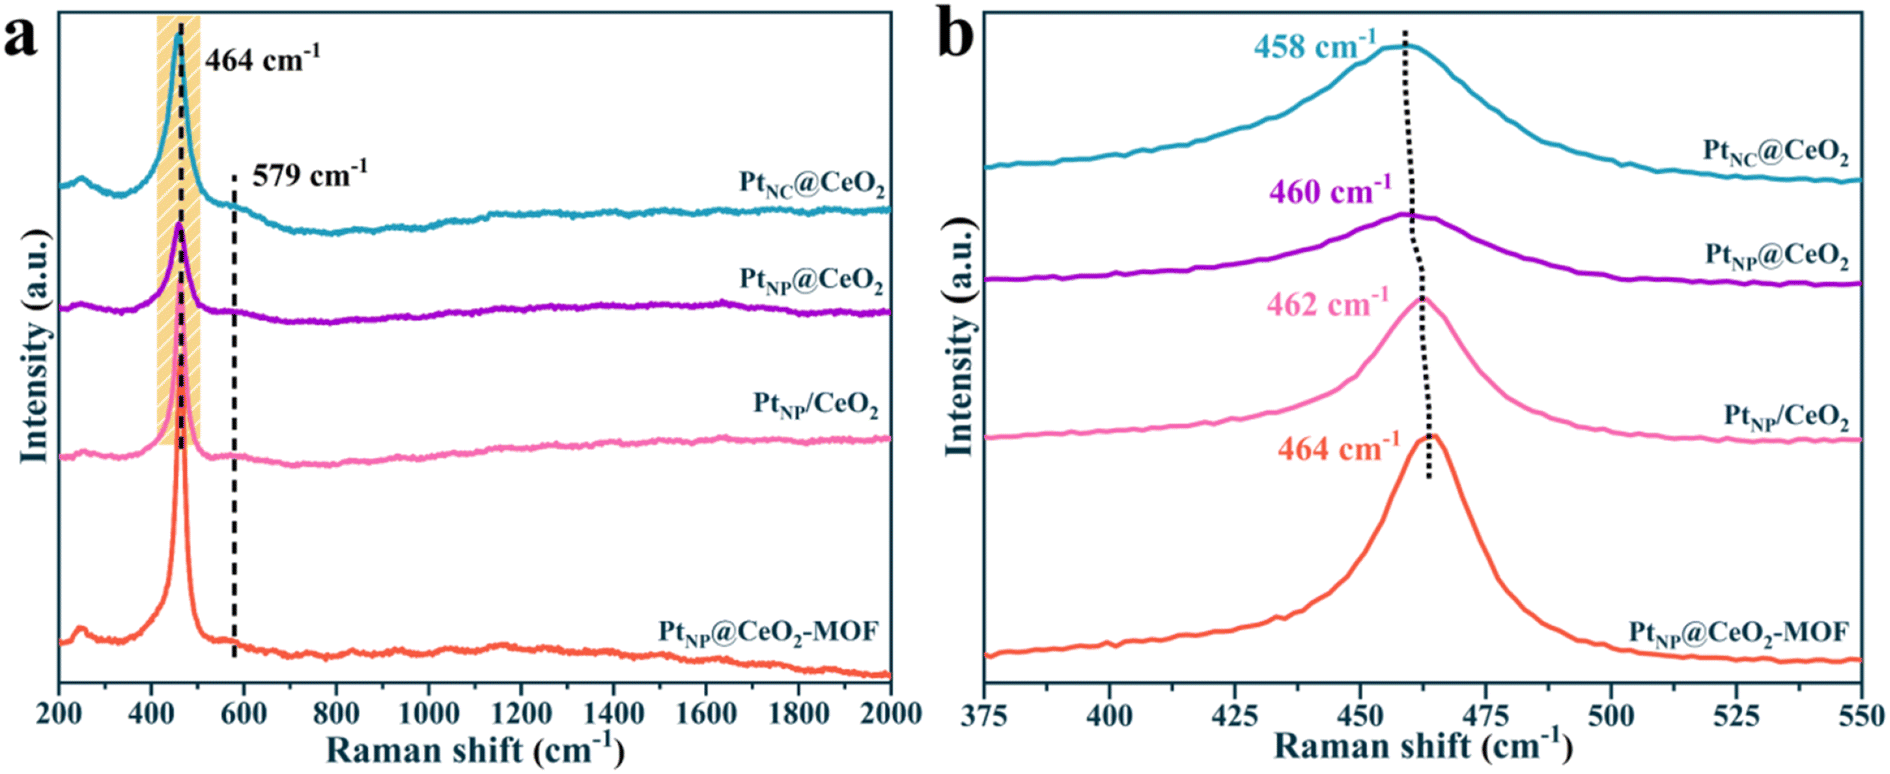 | ||
| Fig. 4 Raman diagrams of the catalysts. | ||
Furthermore, the molecular structure and chemical bonds in the catalysts can be identified in the range of 500–4000 cm−1 by Fourier transform infrared spectroscopy (FTIR). The FTIR results of PtNC@CeO2, PtNP@CeO2, PtNP/CeO2 and PtNP@CeO2-MOF are displayed in Fig. S4.† The broad peak at 3420 cm−1 was mainly attributable to the physically adsorbed water (H2O), while the band at 1578 cm−1 corresponded to the δ(OH) vibration of H2O molecules. The narrow band in the 2825–2990 cm−1 range was mainly associated with the incorporation of PVA. The presence of two broad bands within 990–1420 cm−1 was mainly related to the formation of “carbonate-like” materials on the surface of CeO2, possibly caused by residues in the catalysts,45 and the peak at 848 cm−1 corresponded to the metal–oxygen bond. Notably, the PtNP@CeO2, PtNP/CeO2 and PtNP@CeO2-MOF catalysts showed an asymmetric stretching vibration band of CO2 at 2352 cm−1, but the PtNC@CeO2 catalyst did not exhibit the corresponding peak. This indicated that CO2 from the calcination process was not easily adsorbed on the surface of the PtNC@CeO2 catalyst,46 suggesting that CO2 could be quickly desorbed. This may imply that the CO2 products during the catalytic reaction are easily desorbed, thus facilitating the catalytic reaction of VOCs.
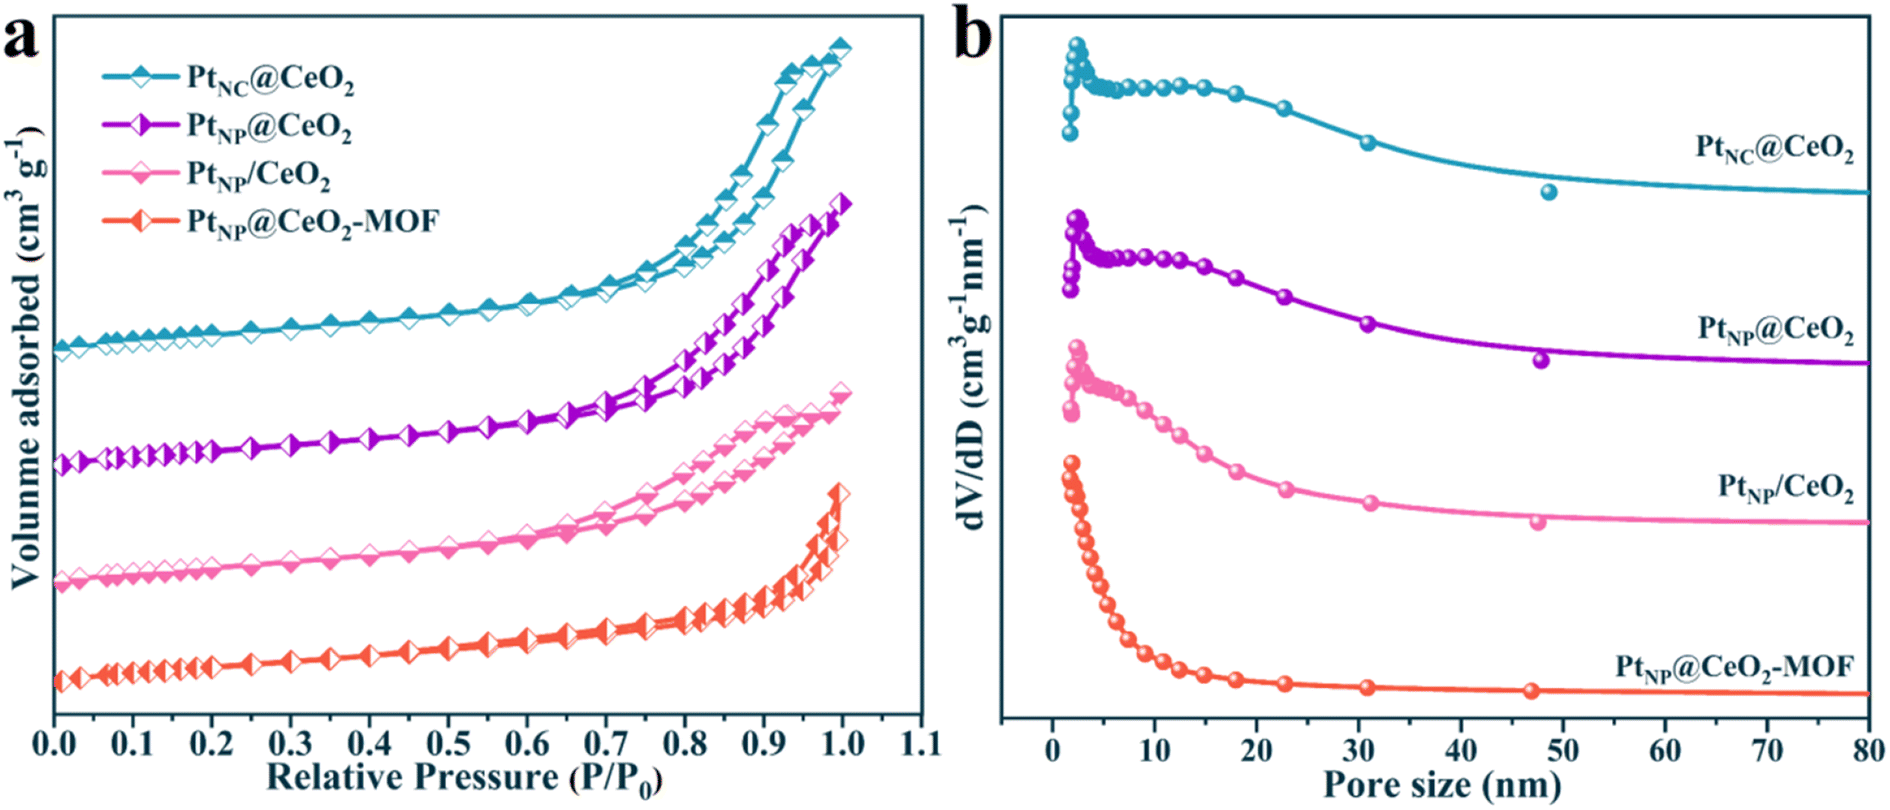
Naturally, the data on the pore structure and specific surface of each catalyst are also important parts of the analysis of catalytic microstructure. Thus, the BET data of each sample were calculated and the outcomes are presented in Fig. 5 and S5† and Table 1. According to the IUPAC classification, the N2 adsorption–desorption isotherms of each catalyst exhibited distinct type IV isotherms with H3-type hysteresis loops of elongated crack-like structures.47,48Table 1 shows the detailed BET data for PtNC@CeO2, PtNP@CeO2, PtNP/CeO2 and PtNP@CeO2-MOF catalysts. The BET surface area of PtNC@CeO2 with Pt nanoclusters was 112.22 m2 g−1, the pore volume was 0.37 cm3 g−1, and the average pore diameter was 13.04 nm. Most importantly, PtNC@CeO2 had a larger specific surface, pore volume and average pore size than PtNP@CeO2, PtNP/CeO2 and PtNP@CeO2-MOF samples. Moreover, the order of the specific surface area was PtNC@CeO2 (112.22 m2g−1) > PtNP@CeO2 (104.69 m2g−1) > PtNP/CeO2 (98.44 m2g−1) > PtNP@CeO2-MOF (97.13 m2g−1). It is worth noting that there was a direct relationship with the activity of the catalysts. In Fig. 5b and the enlarged schematic, it can be seen that there are two distinct peaks in the pore size between 0 and 50 nm and the PtNC@CeO2 catalyst has the largest average pore size (13.04 nm) according to the data in Table 1. The PtNC@CeO2 sample prepared by an in situ confined-domain encapsulation method with the larger pore size was more suitable for anchoring Pt, thus facilitating the active sites' exposure, and the larger pore size facilitated the diffusion of reactants, thus accelerating the catalytic oxidation of toluene. Obviously, the PtNC@CeO2 catalyst with larger pore size did well for molecular retention and diffusion. In conclusion, the methods of the introduction of Pt and Ce were crucial to the microscopic properties. In Table 1, the individual BET data of the catalysts well confirmed the relationship between the microstructure and the catalytic performance of the catalysts. Compared with those of the PtNP@CeO2-MOF and CeO2-MOF samples, the pore structure data of the PtNP@CeO2-MOF sample were decreased by the introduction of Pt species, which may be one of the causes of the poor activity of the PtNP@CeO2-MOF sample. However, the comparison between the PtNC@CeO2 and CeO2–OH samples showed that the method of in situ introduction of Pt species had a positive impact on the BET surface area, pore size, and pore volume of the PtNC@CeO2 sample. In short, the PtNC@CeO2 catalyst with large specific surface area would provide more active sites to promote the adsorption, which may be one of the factors for the superior catalytic performance. Furthermore, with the help of ICP-OES, we observed that the Pt contents of each catalyst were close to the theoretical value (Table 1).
 | ||
| Fig. 5 The N2 physisorption isotherms of catalysts (a) and the BJH pore size distributions of catalysts (b). | ||
| Catalysts | BET surface area (m2 g−1) | Pore size (nm) | Pore volume (cm3 g−1) | Pt content (wt%) |
|---|---|---|---|---|
| PtNC@CeO2 | 112.22 | 13.04 | 0.37 | 0.0075 |
| PtNP@CeO2 | 104.69 | 12.19 | 0.32 | 0.0113 |
| PtNP/CeO2 | 98.44 | 9.60 | 0.24 | 0.0073 |
| PtNP@CeO2-MOF | 97.13 | 7.49 | 0.18 | 0.0097 |
| CeO2–OH | 107.42 | 7.96 | 0.26 | — |
| CeO2-MOF | 87.03 | 8.33 | 0.23 | — |
3.3 Analysis of surface chemical properties and redox behaviors of catalysts
Importantly, the catalytic performance for VOC combustion is related to the elemental valence, redox ability, and adsorption capacity of the catalysts.49,50 Therefore, we need to detect the physicochemical properties of the catalysts. For XPS characterization, it can evaluate the chemical environment of each element on the surface of catalysts, and the results are shown in Fig. 6, S6–S9,† and Table 2. Fig. S6† shows that the Pt 4f spectrum and the Pt 4f curves for each catalyst did not have obvious peaks, which may be due to the low Pt content. The fine spectra of Ce 3d were deconvolved into eight major peaks (Fig. 6a). The peaks at u′ (884.8–885.4 eV) and v′ (904.1 eV) were assigned to Ce3+ species, and other fitted peaks were mainly attributed to Ce4+ species.42,51 As shown in Table 2, the order of the Ce3+ content was PtNC@CeO2 (19.90%) > PtNP@CeO2 (18.23%) > PtNP/CeO2 (16.57%) > CeO2–OH (16.38%) > PtNP@CeO2-MOF (14.08%) > CeO2-MOF (14.03%). The Ce 3d spectra of fresh and used PtNC@CeO2 and PtNP@CeO2 catalysts are also shown in Fig. S7† and Table 2. It is obvious that the content of Ce3+ species of the catalysts decreased significantly after use, indicating that the Ce3+ species promoted the catalytic combustion of VOCs as active species, and the addition of Pt species effectively promoted the generation of Ce3+ species, which contributed to the production of more oxygen vacancies, as seen in Table 2. It is worth mentioning that the introduction of reducing agents promoted the creation of Ce3+. Therefore, the presence of more reactive Ce3+ species in the catalyst implied the formation of more oxygen vacancies. Moreover, combined with the Raman results, it is clearly pointed out that oxygen vacancies were essential for toluene molecules. It meant that the PtNC@CeO2 sample contained more active Ce3+ species, which promoted the production of more oxygen vacancies and unsaturated chemical bonds. The PtNC@CeO2 catalyst had more outstanding activity than the other three catalysts. Thus, having more active Ce3+ species could effectively propel the activity at a lower temperature, and it was also confirmed that the presence of Ce3+ species was one of the beneficial factors to boost the catalytic reaction.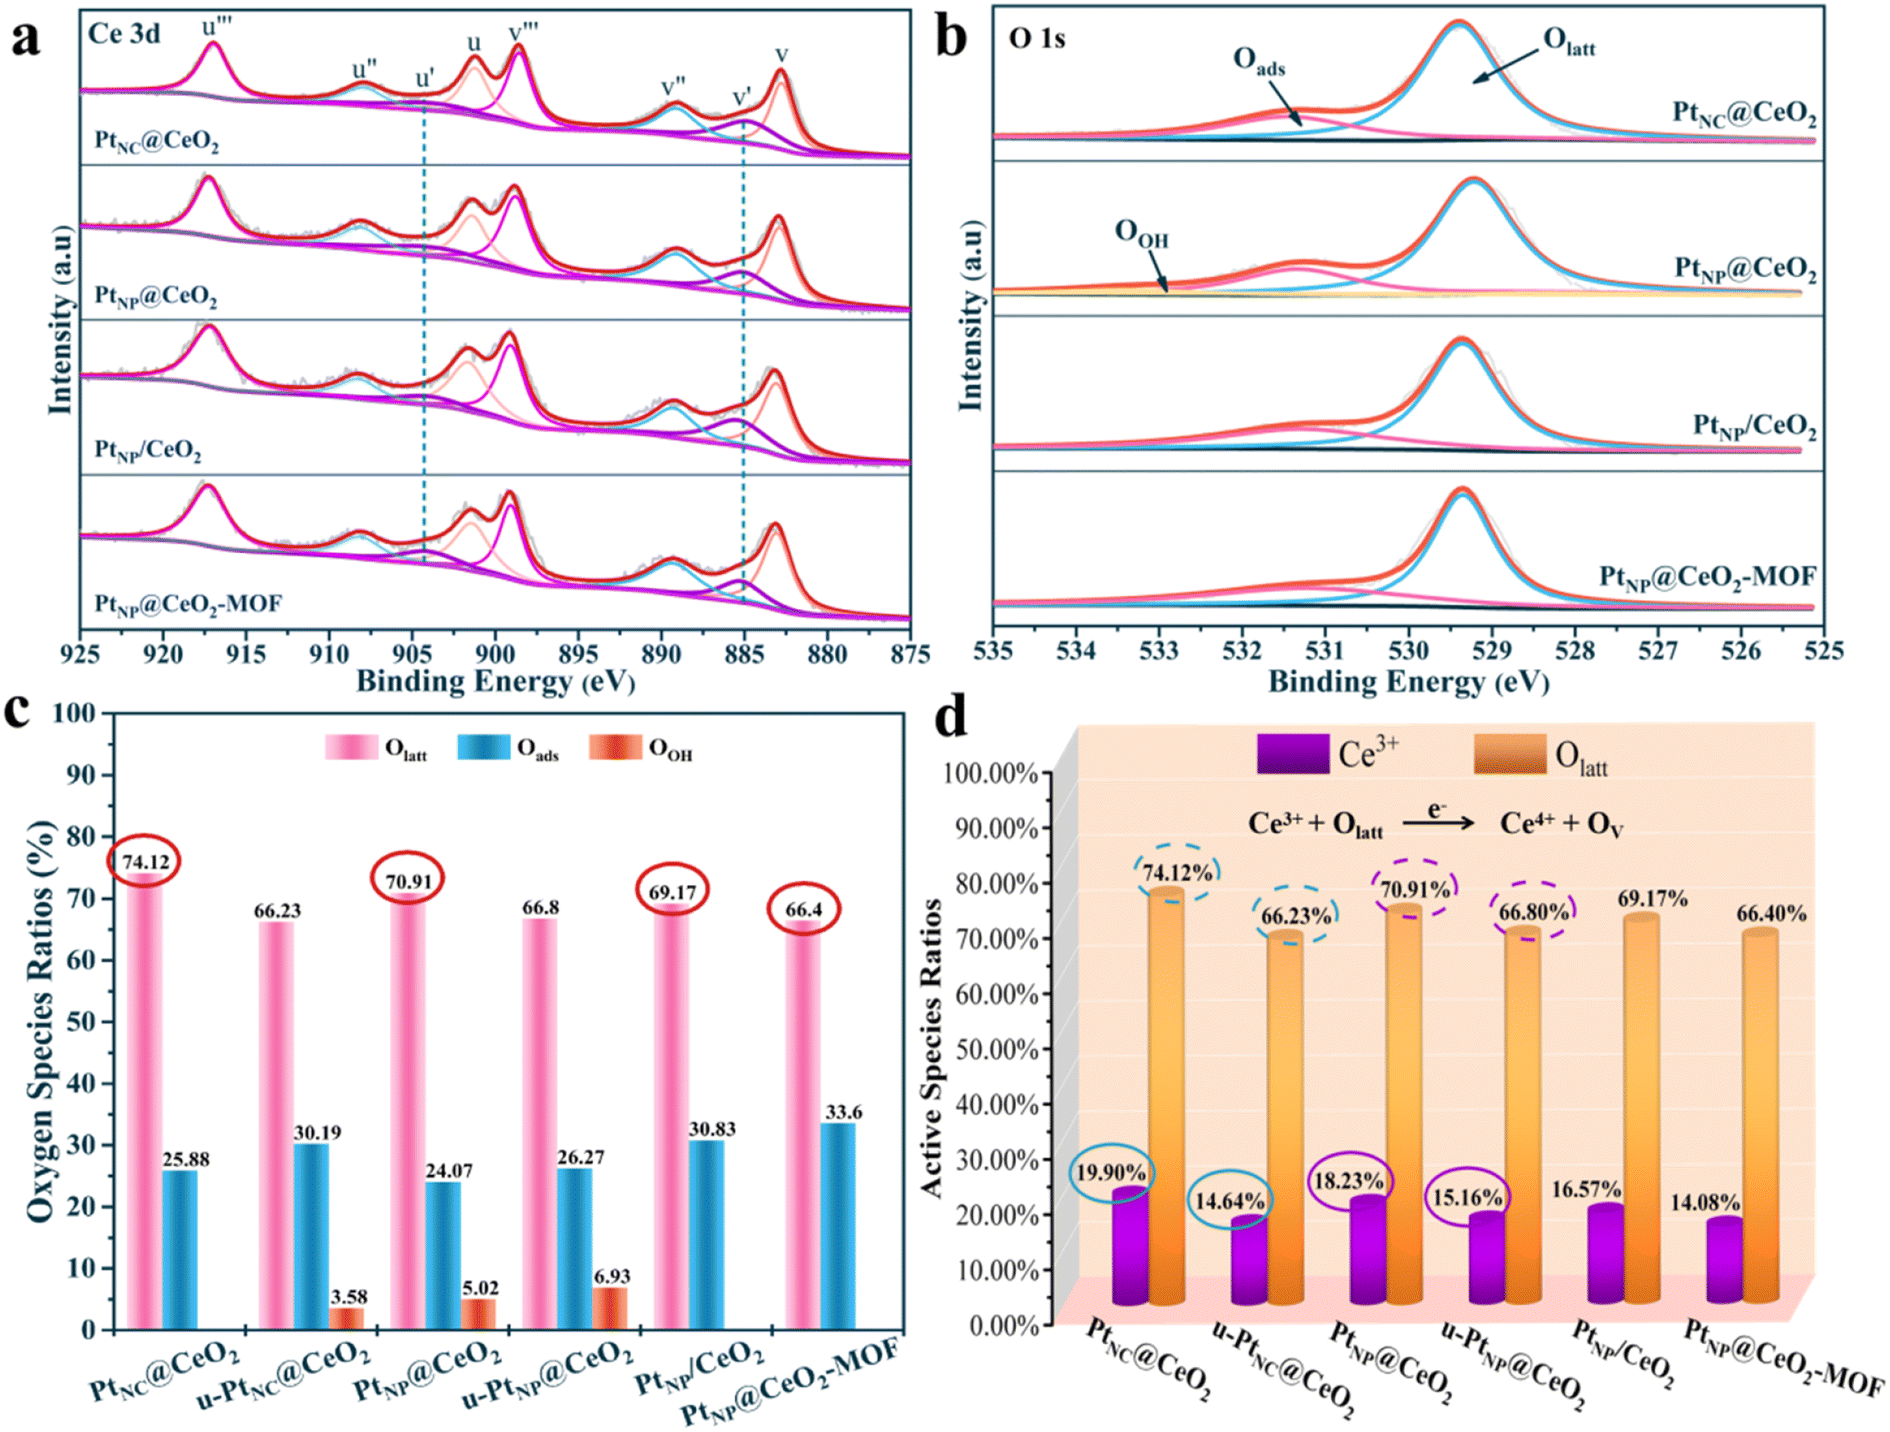 | ||
| Fig. 6 The XPS spectra about Ce 3d (a) and O 1s (b), the oxygen species ratios (c) and the active species ratios (d) of catalysts. | ||
| Catalysts | Ce3+/Cetotal | Ce4+/Cetotal | Olatt/Ototal | Oads/Ototal | OOH/Ototal |
|---|---|---|---|---|---|
| PtNC@CeO2 | 19.90 | 80.10 | 74.12 | 25.88 | — |
| u-PtNC@CeO2 | 14.64 | 85.36 | 66.23 | 30.19 | 3.58 |
| PtNP@CeO2 | 18.23 | 81.77 | 70.91 | 24.07 | 5.02 |
| u-PtNP@CeO2 | 15.16 | 84.84 | 66.80 | 26.27 | 6.93 |
| PtNP/CeO2 | 16.57 | 83.43 | 69.17 | 30.83 | — |
| PtNP@CeO2-MOF | 14.08 | 85.92 | 66.40 | 33.60 | — |
| CeO2–OH | 16.38 | 83.62 | 68.99 | 24.87 | 6.14 |
| CeO2-MOF | 14.03 | 85.97 | 65.57 | 34.43 | — |
Moreover, the O 1s spectra of each catalyst are displayed in Fig. 6. The fine peaks at 529.2–529.4 eV, 531.3–531.5 eV and 532.9 eV corresponded to lattice oxygen (Olatt), surface adsorbed oxygen (Oads) and surface hydroxyl (OOH), respectively.52,53 The four catalysts contained mainly Olatt and Oads with a small amount of OOH (Fig. 6b). We also performed XPS on the oxygen species content of fresh and used PtNC@CeO2 and PtNP@CeO2 catalysts, and the results are illustrated in Fig. S8;† there was a significant reduction of Olatt content in the used catalysts. Subsequently, the percentages of oxygen species for each catalyst were summarized and recorded in Table 2 and Fig. 6c for more visual analysis of the Olatt, Oads and OOH. Therefore, it is evident that the content of Olatt presented the following order: PtNC@CeO2 (74.12%) > PtNP@CeO2 (70.91%) > PtNP/CeO2 (69.17%) > CeO2–OH (68.99%) > PtNP@CeO2-MOF (66.40%) > CeO2-MOF (65.57%). Similarly, the introduction of Pt species favored the generation of lattice oxygen. According to previous studies,54,55 Olatt plays a key role in many thermocatalytic reactions. Olatt can oxidize the reducing molecules and then create oxygen vacancies, which are subsequently filled with the activation of molecular oxygen. The ratio of Olatt could explain that PtNC@CeO2 had the best catalytic performance. It has been proven that more Olatt generated sufficient oxygen vacancies, thus promoting toluene adsorption and activation. As shown in Fig. 6d, it can be concluded from the percentage of active species of each catalyst that Ce3+ and Olatt were the main active components to improve the activity of the PtNC@CeO2 catalyst. Also, the addition of Pt species effectively promoted the generation of Ce3+ species and lattice oxygen, which contributed to the production of more oxygen vacancies. Moreover, Ce3+ also facilitated the generation of unsaturated bonds and more Ce species would interact with Pt species, thus building Pt–Ce interfaces to promote the catalytic oxidation of VOCs.
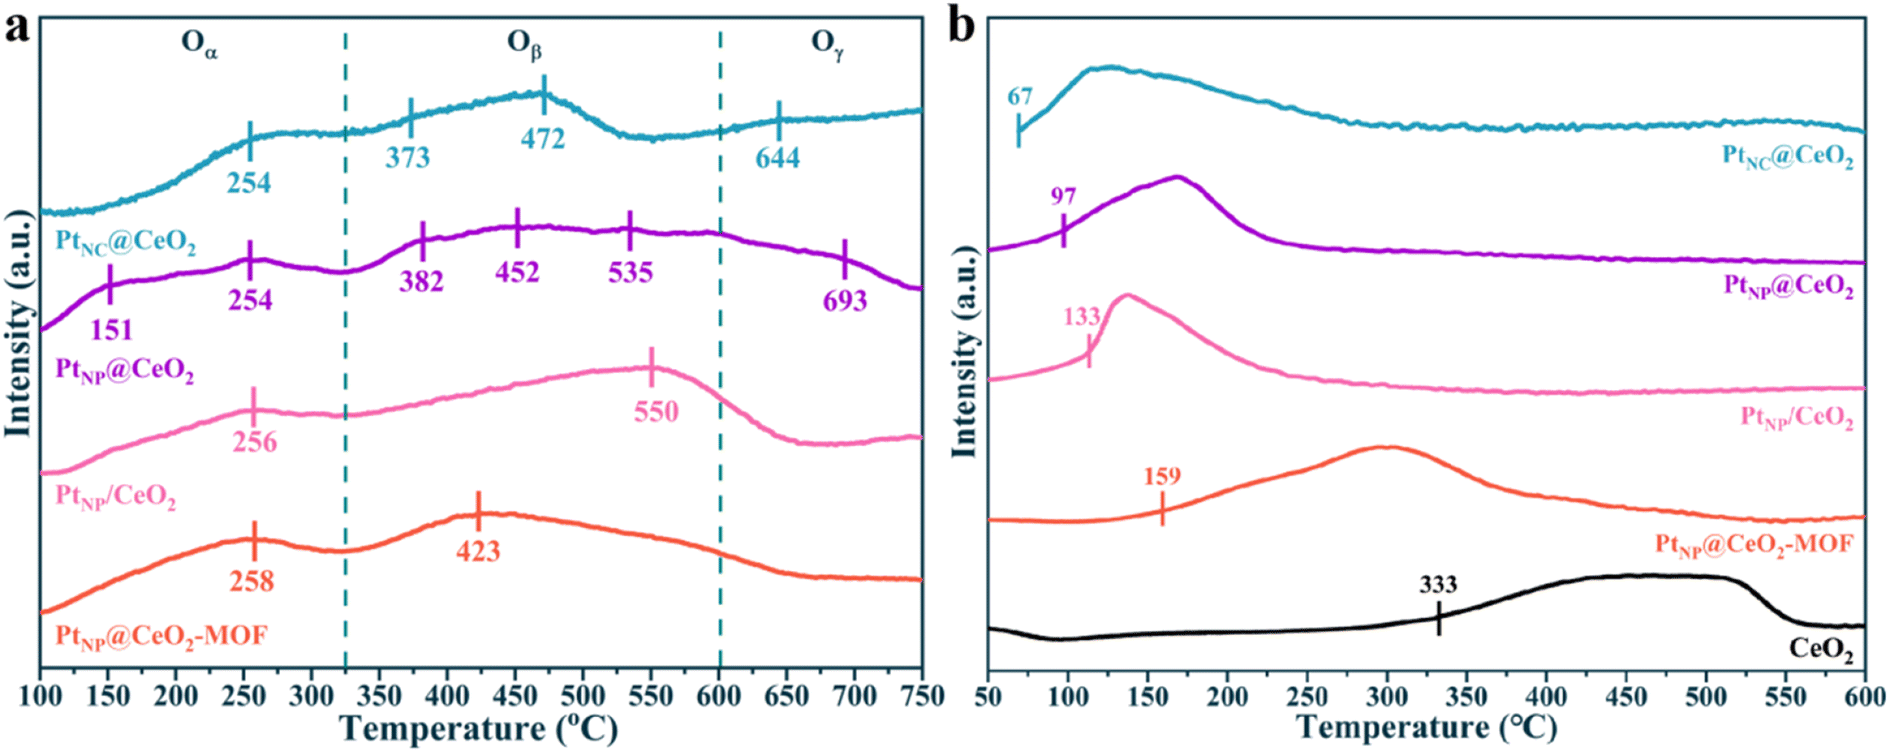
To determine the types of oxygen species for each catalyst, O2-TPD curves are recorded in Fig. 7a. The peak at 100–325 °C was considered to be Oα, which was mainly present at the surface oxygen vacancies. The peak between 325 and 600 °C was caused by the desorption of Oβ, and this oxygen species was distributed at the surface lattice. The peak above 600 °C corresponded to Oγ, which was mainly found in the lattice bulk phase.56 For PtNC@CeO2 and PtNP@CeO2, the types of oxygen species were essentially the same. However, the O2-TPD curve of the PtNC@CeO2 sample exhibited higher mobility of Oβ and Oγ. Combined with the results of activity, it was revealed that Oβ and Oγ transfer from the body to the catalyst surface was accelerated during the reaction process,57 thus promoting the activation of VOCs. It has been shown that the methods of in situ introduction of Pt and Ce could alter the mobility of oxygen species. It was discovered that the PtNC@CeO2 catalyst contained different types of oxygen species. This indicated that the method of Pt and Ce introduction also had a great influence on the type of oxygen species produced by Pt–Ce-based catalysts. In short, the lattice oxygen was significant for the catalytic performance of the PtNC@CeO2 catalyst and might be probably due to the interaction between Pt nanoclusters and the carrier. According to the results of the above work, we suggested that the presence of more Ce3+ species and a substantial amount of lattice oxygen species on the PtNC@CeO2 catalyst may be one of the key factors to enhance the catalytic performance.
 | ||
| Fig. 7 O2-TPD curves (a) and H2-TPR curves (b) of samples. | ||
The reducibility of each species in the catalysts was tested by H2-TPR, and the results are presented in Fig. 7b and S10.† Each catalyst showed a wide reduction temperature interval (Fig. 7b), and the H2 consumption of the catalysts is shown in Table S2.† The finely fitted peaks of each catalyst are displayed in Fig. S10.† In general, the first reduction peak was classified as the reduction of adsorbed oxygen on the surface of CeO2. The second peak belonged to the reduction of adsorbed oxygen on the subsurface of CeO2.58–60 It is obvious from Fig. 7b that the reduction peaks of CeO2 shifted toward lower temperatures after the addition of Pt, and the onset reduction temperatures of each catalyst were in the order PtNC@CeO2 (67 °C) < PtNP@CeO2 (97 °C) < PtNP/CeO2 (133 °C) < PtNP@CeO2-MOF (159 °C) < CeO2 (333 °C). In addition, the lower onset reduction temperature indicated that the Pt species in the catalysts were more likely to produce active hydrogen and transfer it to the CeO2 carrier, thus greatly decreasing the reduction temperature of CeO2.61 Obviously, the H2-TPR of each catalyst confirmed the existence of a hydrogen overflow phenomenon. It should be noted that the onset reduction temperature of each catalyst remained positively correlated with the activity of each catalyst, indicating that the PtNC@CeO2 catalyst established a strong Pt–O–Ce interaction and more Pt active sites, which facilitated the production of more active hydrogen, thus significantly reducing the reduction temperature of CeO2 and promoting the activation of VOCs.62 However, the difficulty in reaching 90% toluene conversion of the PtNP@CeO2-MOF sample may also be due to extremely poor redox ability, which did not establish a solid interfacial effect between Pt NPs and CeO2, thus resulting in a decrease in activity.63 In conclusion, H2-TPR confirmed that the PtNC@CeO2 catalysts had a strong interaction between Pt and CeO2, so the main reasons for the best activity of the PtNC@CeO2 sample could be the formation of the SMSI effect and the highly dispersed Pt nanoclusters. Combined with Fig. 1a and 7b, it can be visualized that the low-temperature reduction peaks had a significant impact on the activity of the catalysts.
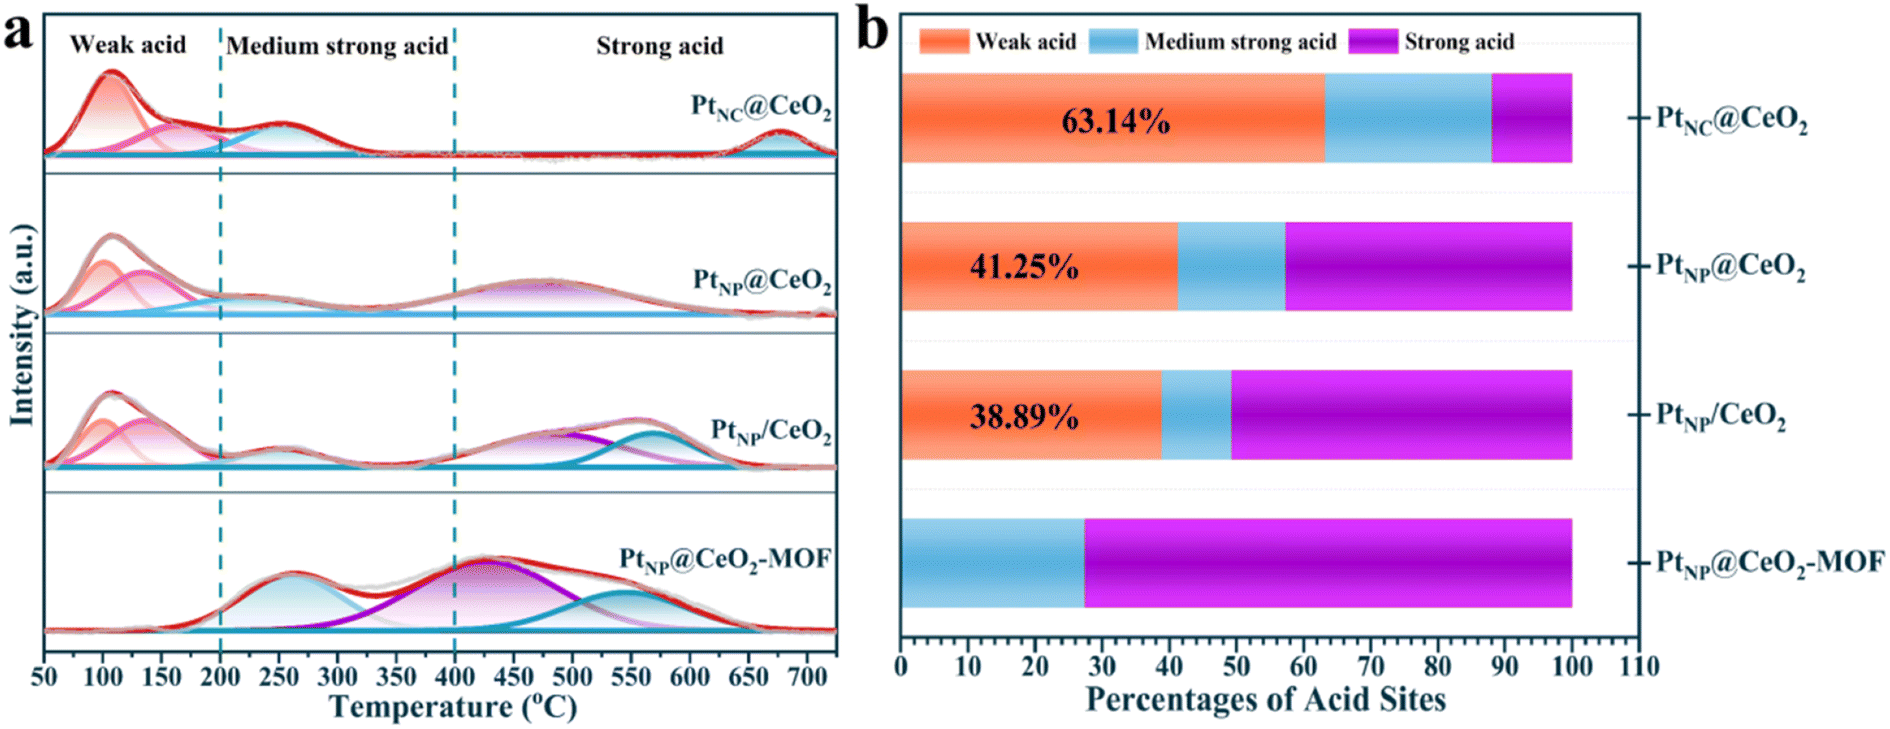
The results of NH3-TPD are exhibited in Fig. 8, S11,† and Table 3. The acid sites could be roughly divided into three types from Fig. 8a. The peaks below 200 °C belonged to weak acid sites, the peaks within 200–400 °C were assumed to be medium strong acid sites, and the peaks above 400 °C could be strong acid sites.64,65 Obviously, the PtNP@CeO2-MOF catalyst showed no significant peak in the range of 0–200 °C, while obvious weak acid sites were present in the other three catalysts. The NH3-TPD curves of PtNC@CeO2, PtNP@CeO2, and PtNP/CeO2 catalysts showed similar peak shapes within 400 °C. In addition, weak acid sites were useful for the adsorption of toluene molecules,42 which can effectively promote the oxidation of VOCs. As shown in Fig. 8b and Table 3, the content of each acid site could be clearly seen and the percentage of weak acid sites on the catalyst surface mainly followed the order PtNC@CeO2 (63.14%) > PtNP@CeO2 (41.25%) > PtNP/CeO2 (38.89%) > PtNP@CeO2-MOF. In addition, the PtNC@CeO2 catalyst with the largest amount of weak acid sites had the best activity, indicating that the weak acid sites were the main active sites, and the weak acid sites could strengthen and accelerate the adsorption of the reacting molecules, thus making it have excellent activity. Interestingly, the addition of Pt species decreased the number and intensity of weak acid sites on the CeO2 surface, but the method of in situ introduction of Pt species could effectively suppress the reduction of weak acid sites (Table 3). Therefore, it was revealed that the Pt and Ce introduction methods had different effects on the number and intensity of acid sites. Overall, the good activity of the PtNC@CeO2 catalyst may be due to the joint action of Pt nanoclusters and weak acid sites to promote the catalytic combustion reaction of VOCs.
 | ||
| Fig. 8 NH3-TPD profiles (a) and percentages of surface acid sites (b) of catalysts. | ||
| Catalyst | Weak acid (%) | Medium strong acid (%) | Strong acid (%) |
|---|---|---|---|
| PtNC@CeO2 | 63.14 | 24.90 | 11.96 |
| PtNP@CeO2 | 41.25 | 16.04 | 42.71 |
| PtNP/CeO2 | 38.89 | 10.36 | 50.75 |
| PtNP@CeO2-MOF | — | 27.44 | 72.56 |
| CeO2–OH | 67.34 | 24.30 | 8.36 |
| CeO2-MOF | 46.47 | 6.38 | 47.15 |
3.4 Investigation of reaction mechanism
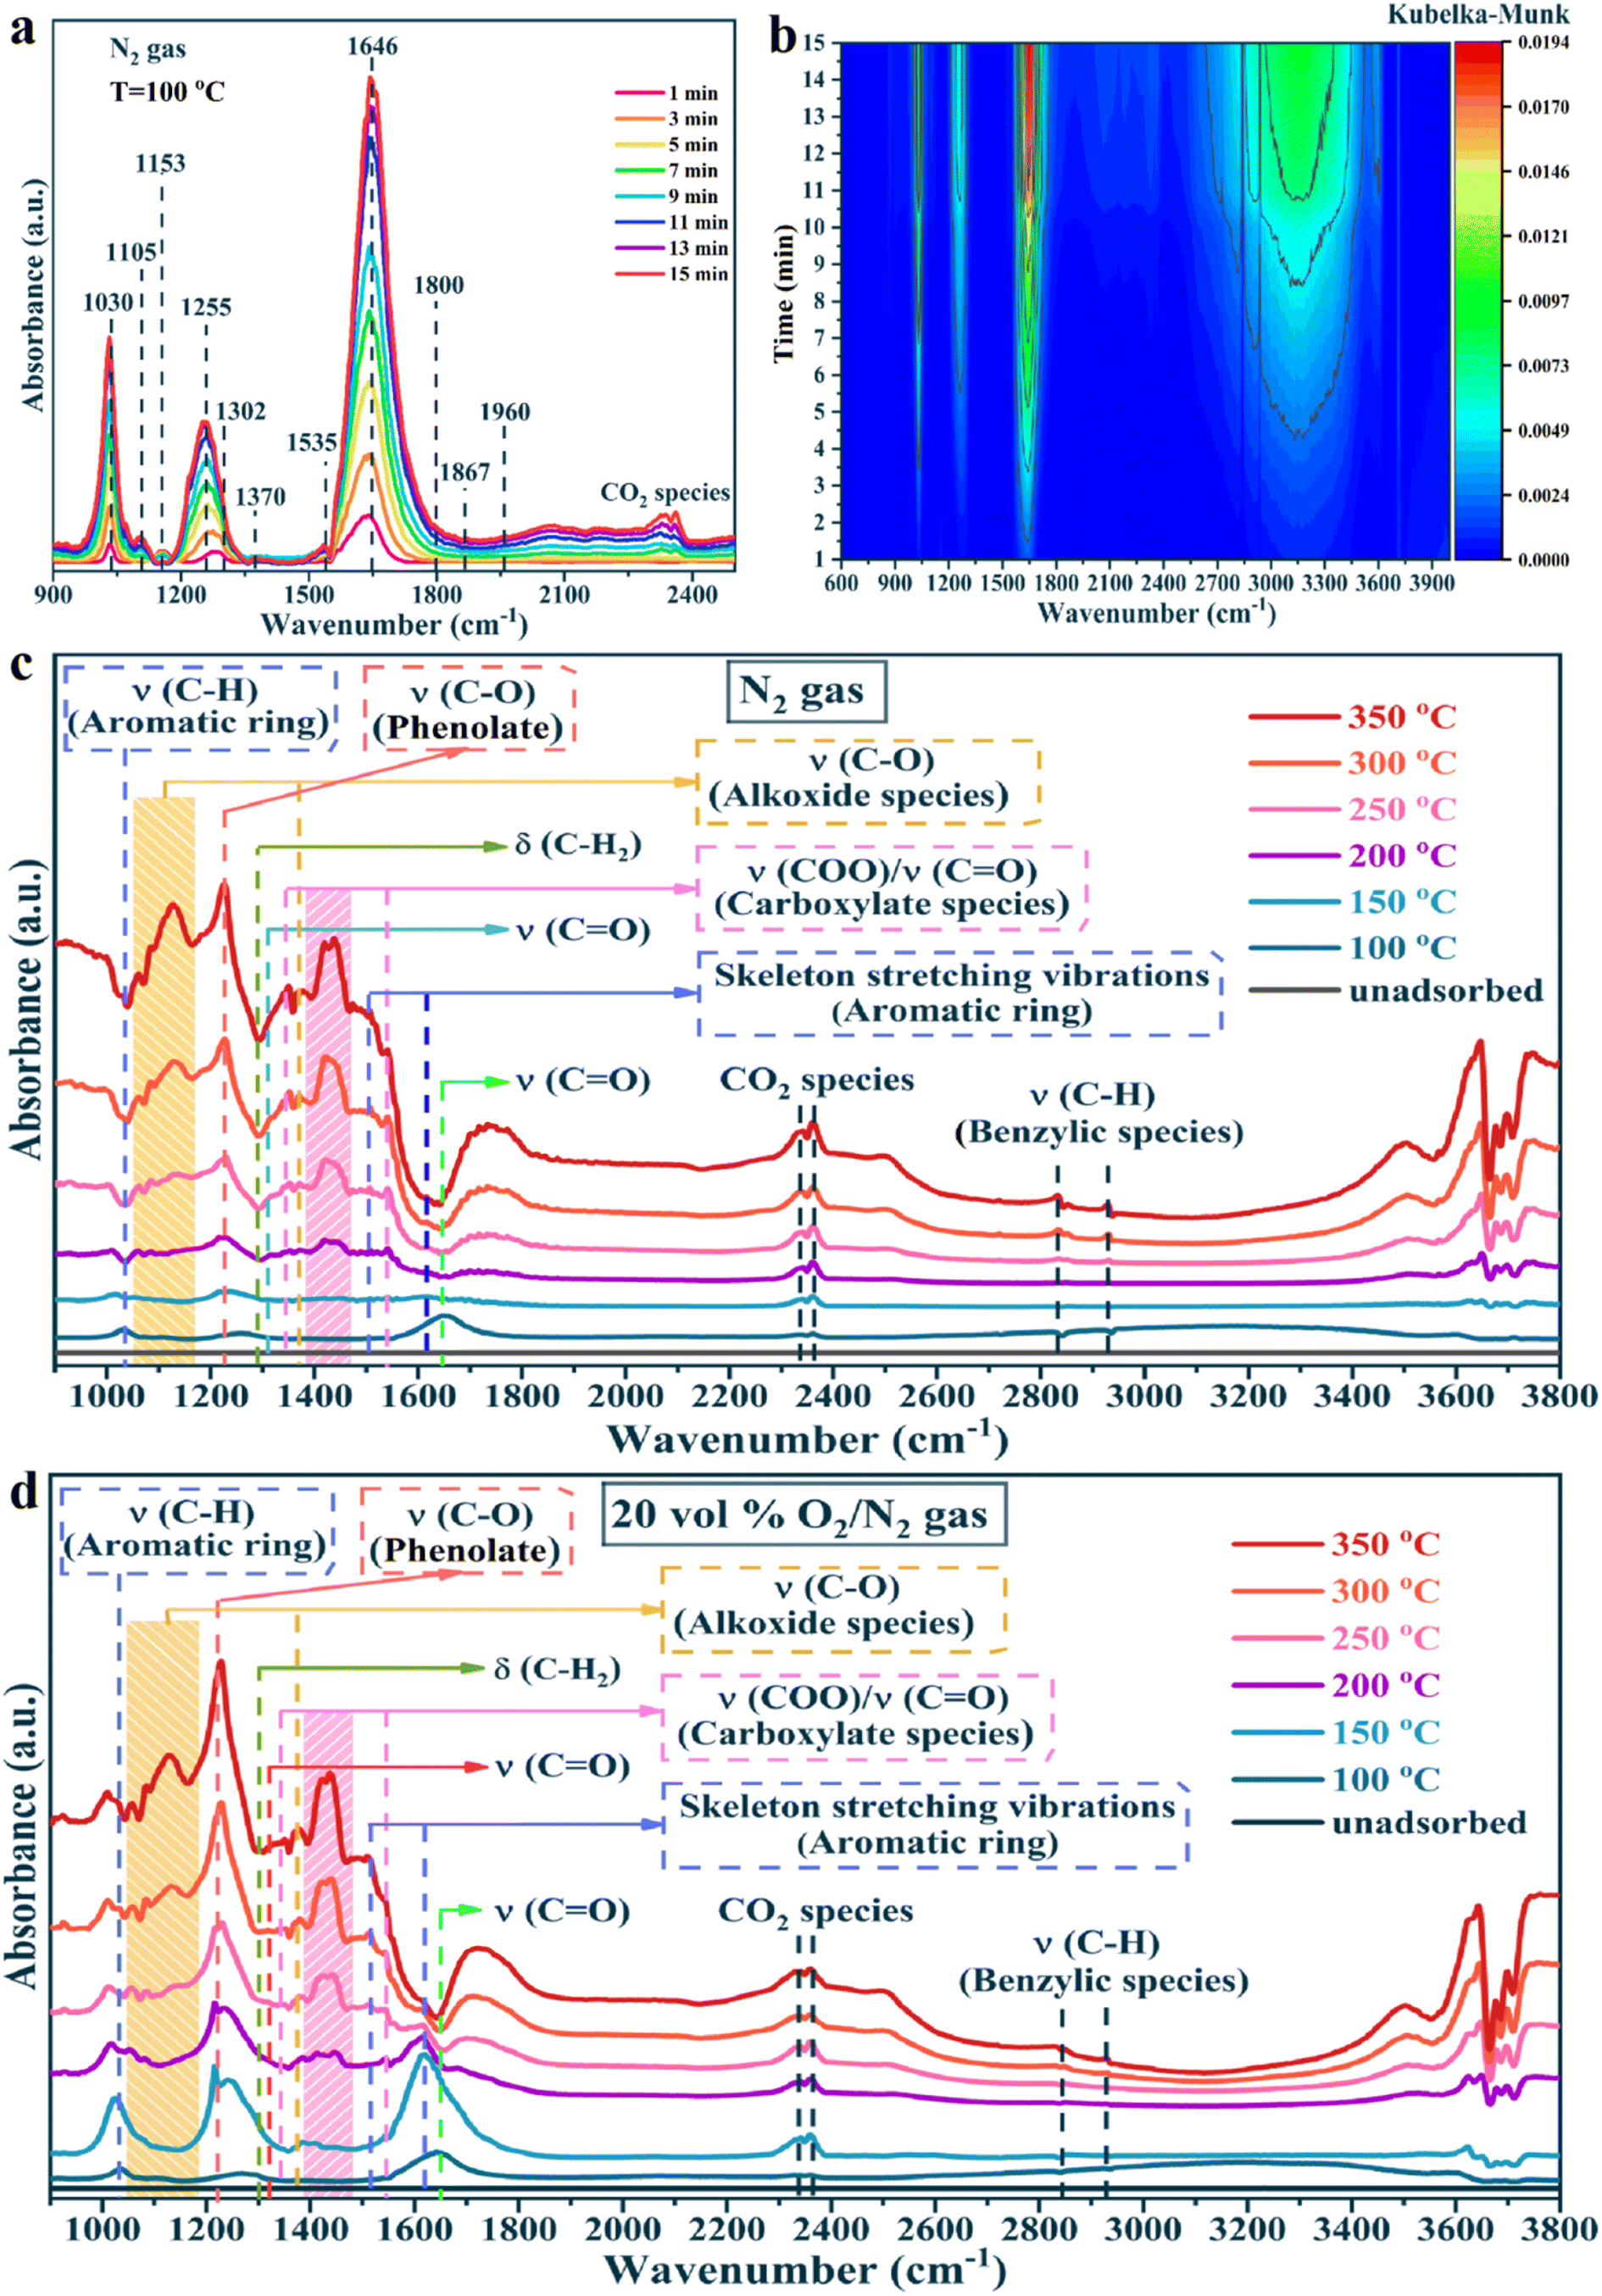
To clarify the oxidation process of toluene, the formation of intermediates, and the reaction mechanism over the PtNC@CeO2 catalyst, in situ DRIFTS tests were carried out. The toluene adsorption of the PtNC@CeO2 catalyst was conducted at 100 °C (Fig. 9). In Fig. 9a and b, in situ DRIFTS results are presented by toluene adsorption of PtNC@CeO2 at pure N2 conditions. The peak at 1030 cm−1 corresponded to the υ(C–H) in-plane bending vibration of the aromatic ring.66 The bands at 1105 cm−1 and 1153 cm−1 were attributable to the υ(C–O) stretching vibration of alkoxy species and the υ(C–O) stretching vibration of benzyl alcohol, respectively. It may be speculated that the breakage of the C–H bond of methyl (–CH3) in adsorbed toluene generated benzyl alcohol (C6H5–CH2O–) species or even short-chain alkoxy species.67 The strong bands at 1255 cm−1 and 1646 cm−1 were classified as C–H in-plane bending vibrations and classical aldehyde bands (stretching vibrations of the C![[double bond, length as m-dash]](https://www.rsc.org/images/entities/char_e001.gif) O bond), respectively. This affirmed that benzaldehyde species could accumulate rapidly and be converted to important intermediates in the adsorption process.68,69 In addition, peaks at 1302 cm−1, 1800 cm−1, 1867 cm−1 and 1960 cm−1 were correlated with maleic anhydride species.69,70 The details of each adsorption band are listed in Table S3.† The most important point is that the PtNC@CeO2 catalyst was capable of adsorbing and activating toluene at 100 °C and allowed toluene to interact with oxygen species at low temperatures to form various intermediates (benzoic acid, benzyl alcohol, maleic anhydride, etc.). It is worth mentioning that various intermediates were generated under a toluene/N2 atmosphere, indicating that lattice oxygen was present on the surface of the catalyst.
O bond), respectively. This affirmed that benzaldehyde species could accumulate rapidly and be converted to important intermediates in the adsorption process.68,69 In addition, peaks at 1302 cm−1, 1800 cm−1, 1867 cm−1 and 1960 cm−1 were correlated with maleic anhydride species.69,70 The details of each adsorption band are listed in Table S3.† The most important point is that the PtNC@CeO2 catalyst was capable of adsorbing and activating toluene at 100 °C and allowed toluene to interact with oxygen species at low temperatures to form various intermediates (benzoic acid, benzyl alcohol, maleic anhydride, etc.). It is worth mentioning that various intermediates were generated under a toluene/N2 atmosphere, indicating that lattice oxygen was present on the surface of the catalyst.
 | ||
| Fig. 9 In situ DRIFTS spectra of toluene adsorption (a and b) for PtNC@CeO2 catalyst at 100 °C for different times under pure N2 gas flow and the in situ DRIFTS spectra of PtNC@CeO2 catalyst for different reaction temperatures with toluene/N2 gas (c) and toluene/air gas (d). | ||
Besides, to investigate the mechanism of action of oxygen species, the toluene oxidation process on the PtNC@CeO2 catalyst was exposed to toluene/N2 and O2/N2 atmosphere at different temperatures (Fig. 9c and d), respectively. Fig. 9c and d presented similar spectra and also confirmed that lattice oxygen could be involved in the catalytic process of toluene without the need for gaseous oxygen. Additionally, a detailed control of the in situ DRIFTS spectra for different atmospheres at various temperatures (100 °C, 200 °C, 300 °C) was performed and the results are shown in Fig. 10a–f. Interestingly, the peak intensity in toluene/air was higher than that in toluene/N2 gas. It is possible that toluene molecules may not only be adsorbed by the metal active sites but also interacted with already adsorbed oxygen species to yield other substances. Moreover, sufficient gaseous oxygen can supplement the lattice oxygen to rebuild the reactive oxygen species.66 The features corresponding to each spectral band are also summarized in Table S3.† The original adsorption bands at 1030 cm−1, 1255 cm−1 and 1646 cm−1 gradually disappeared with increasing temperature, but the characteristic bands of benzoate species and alcohol salt species were significantly enhanced, revealing that these species were the essential intermediates in the catalytic process of toluene.71 Moreover, the carbonate species could be preferentially converted to CO2 and H2O on the surface. It is reasonably concluded that in the reaction of toluene over PtNC@CeO2 catalyst, the rate-determining step may be the further decomposition of the alcohol or carboxylic acid intermediate. Based on the analysis of results and Table S3,† it is clearly illustrated that the reaction process of toluene followed the following pathway: toluene → benzyl alcohol → benzaldehyde → benzoic acid → phenol → maleic anhydride → carbon dioxide and water.
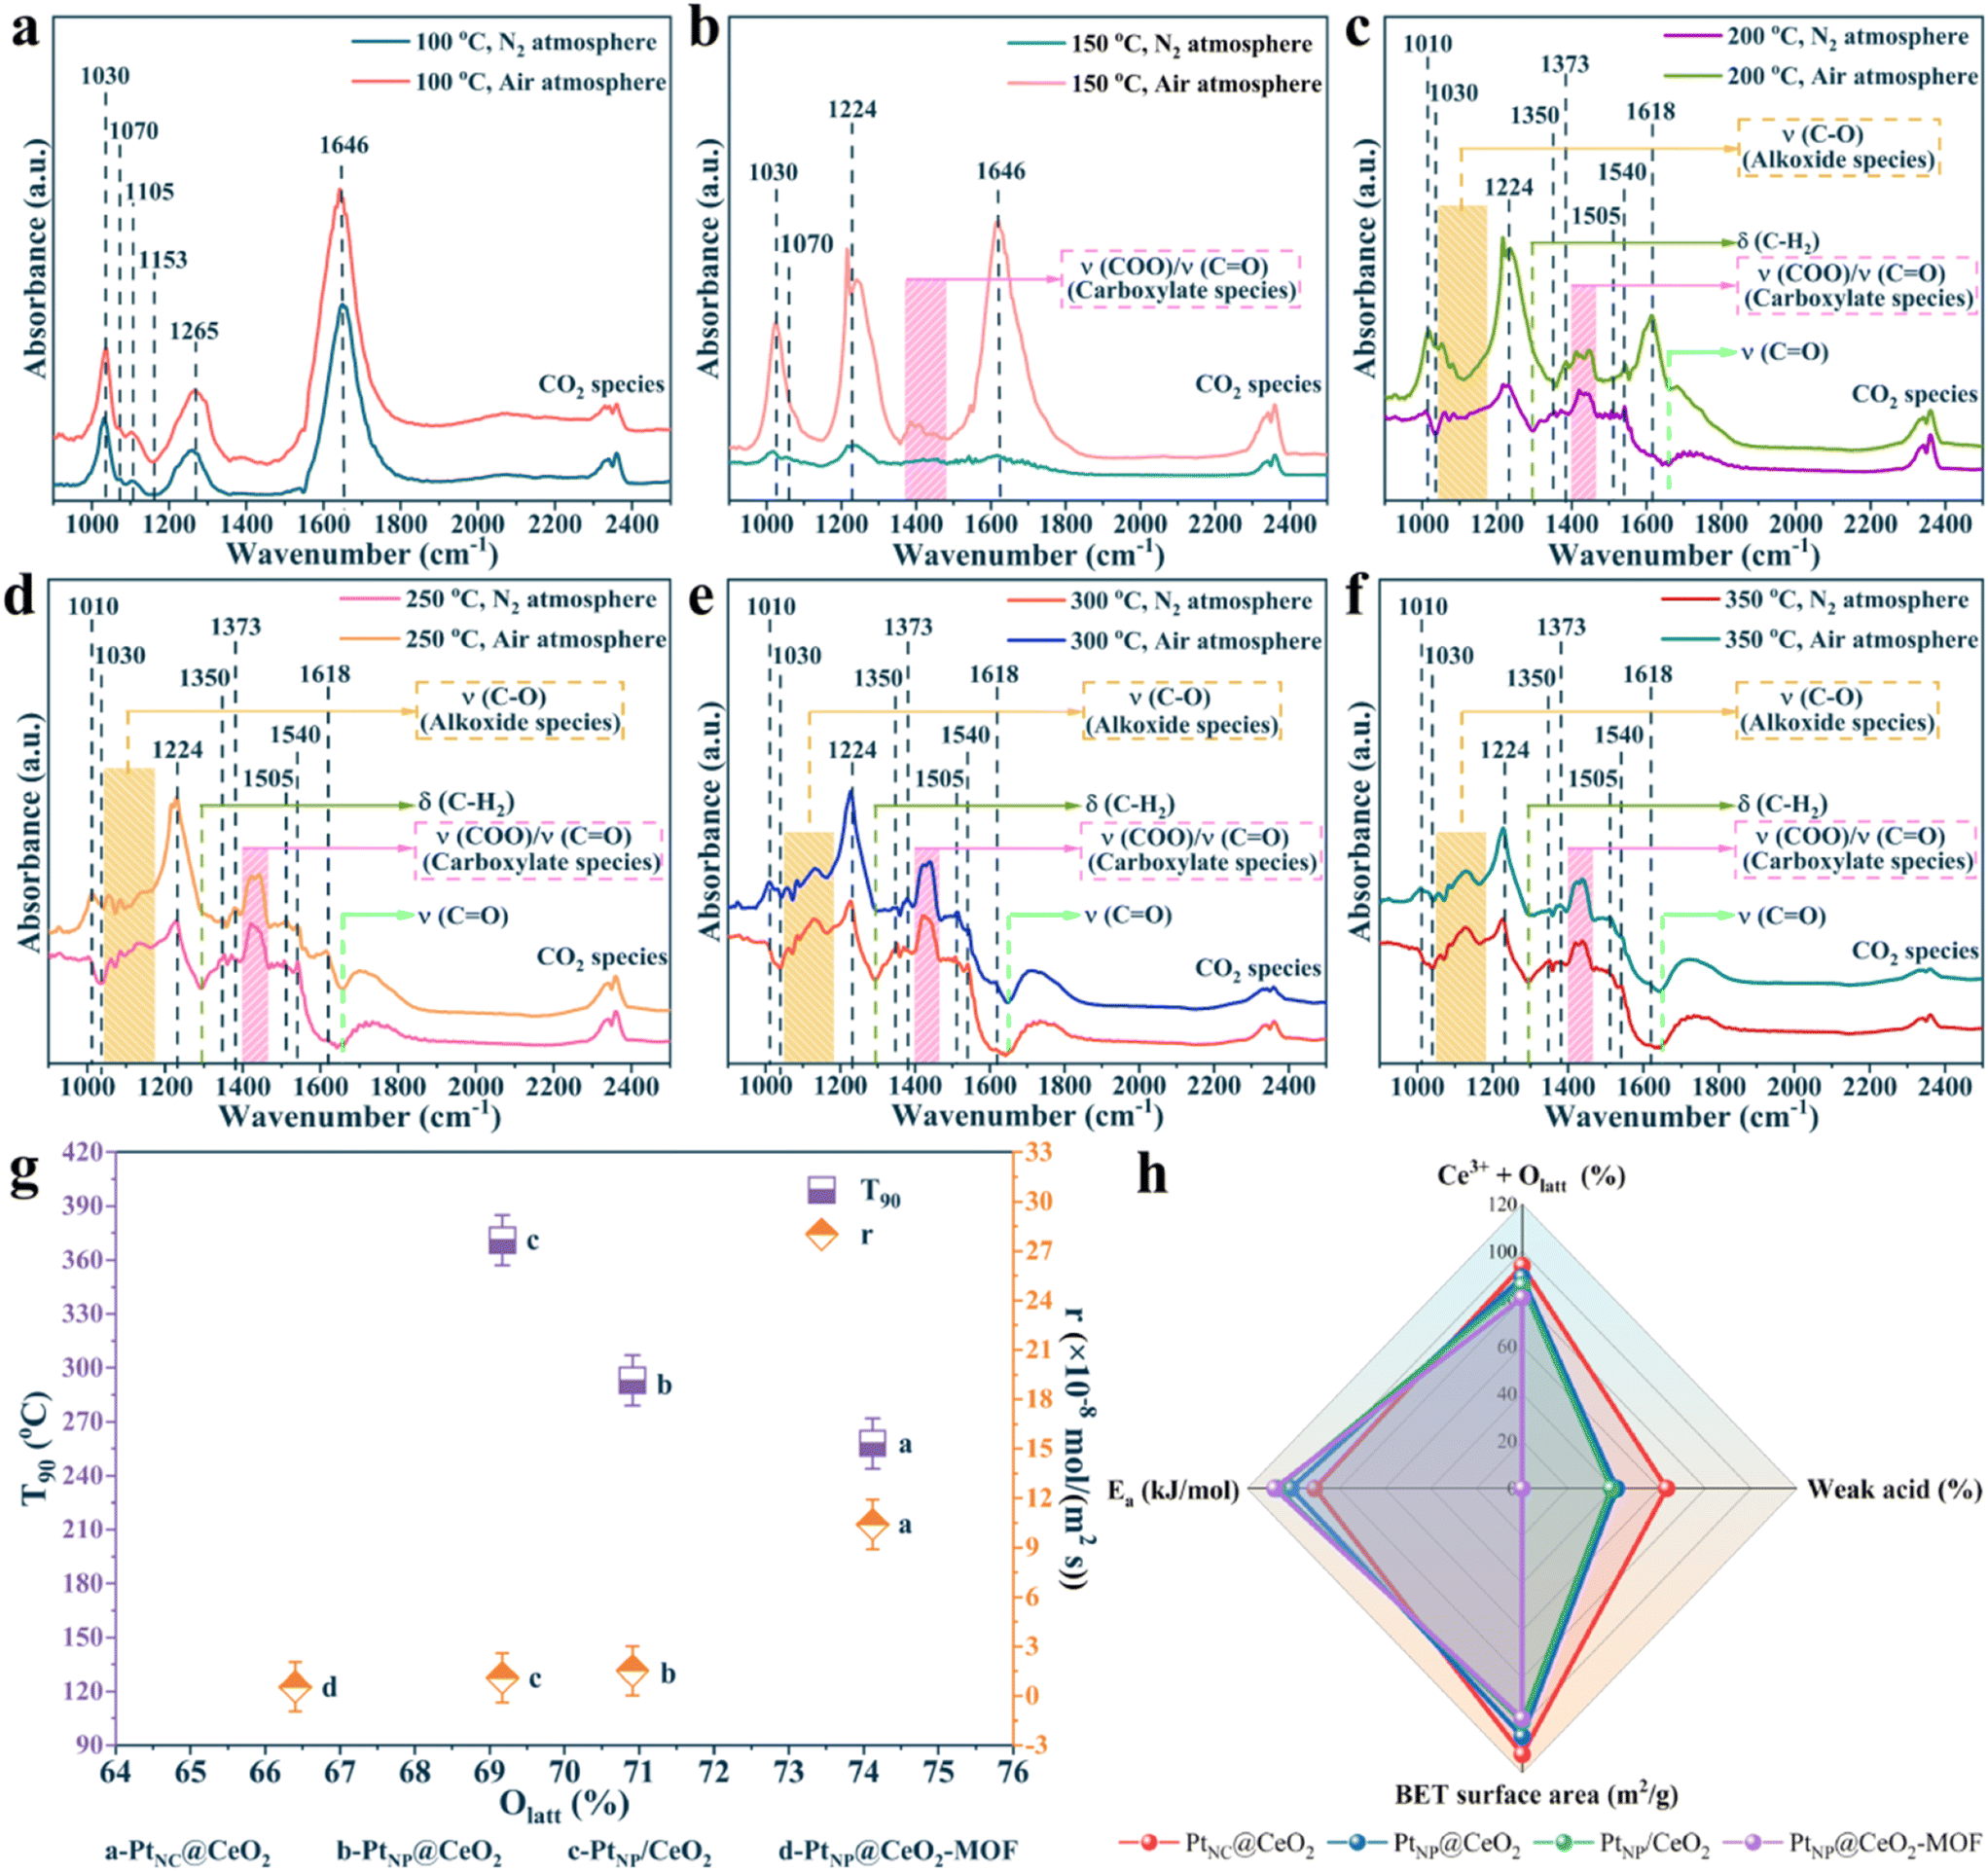 | ||
| Fig. 10 In situ DRIFTS spectra under different atmospheres at different temperatures (a–f), the reaction rate and T90versus Olatt (g), and the schematic diagram of Ea and frame of active sites over the catalysts (h). | ||
In summary, we discovered that lattice oxygen was thought to serve the leading role in the removal of toluene compared to adsorbed oxygen. Therefore, the Mars–van Krevelen (MvK) mechanism was present in the toluene oxidation reaction over the PtNC@CeO2 catalyst. Scheme 2 describes the reaction pathways of toluene catalytic oxidation over the PtNC@CeO2 catalyst. After the passage of toluene, reactant molecules were adsorbed onto the oxygen vacancies, active species or active sites of the PtNC@CeO2 catalyst.43 Subsequently, the activated oxygen species interact with the C–H bonds of the methyl groups in toluene to form benzyl groups and further benzyl alcohol (C6H5–CH2O–). Then, the reactive oxygen species would further interact with C6H5–CH2O– to produce intermediates such as maleic anhydride, phenolate, and so on, and finally to generate carbon dioxide and water, which was well consistent with the MvK mechanism. During the catalytic process, abundant oxygen vacancies were generated due to the consumption of lattice oxygen which was continuously replenished with the help of gas-phase oxygen, thus achieving a reciprocal cycle of reactions.72 It is of interest that the relationship between the lattice oxygen and the reaction rate and the relationship between T90 and lattice oxygen (Fig. 10g) both confirmed well the critical effect of lattice oxygen in the toluene elimination. Furthermore, the highly dispersed Pt nanoclusters in the PtNC@CeO2 catalyst could be beneficial for adsorbing and becoming activated for the reactants, which may also be the reason for the ability of this type of catalyst to produce various intermediates at 100 °C. Hence, the PtNC@CeO2 catalyst promoted the emission reduction of toluene due to the formation of Pt nanoclusters, which could expose more metal active sites derived from the rich Pt–O–Ce interface.
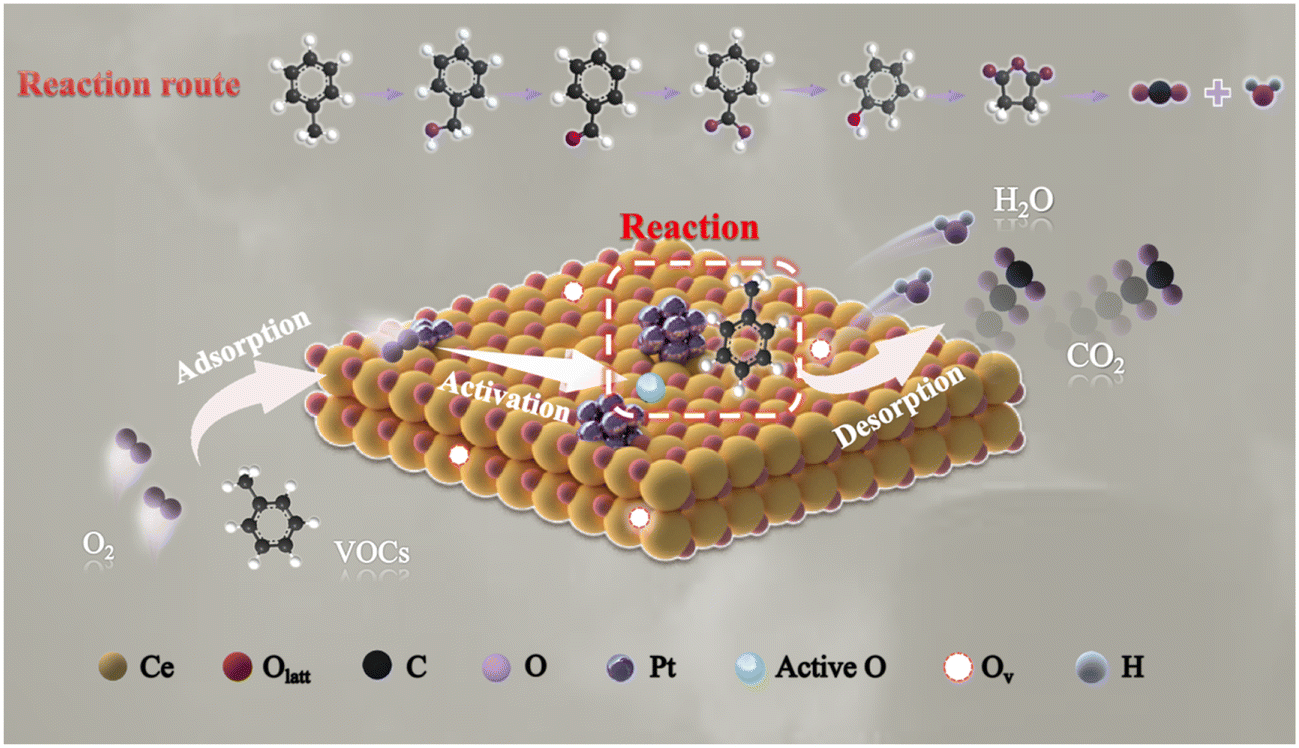 | ||
| Scheme 2 Proposed mechanism over Pt nanocluster catalyst for toluene oxidation. | ||
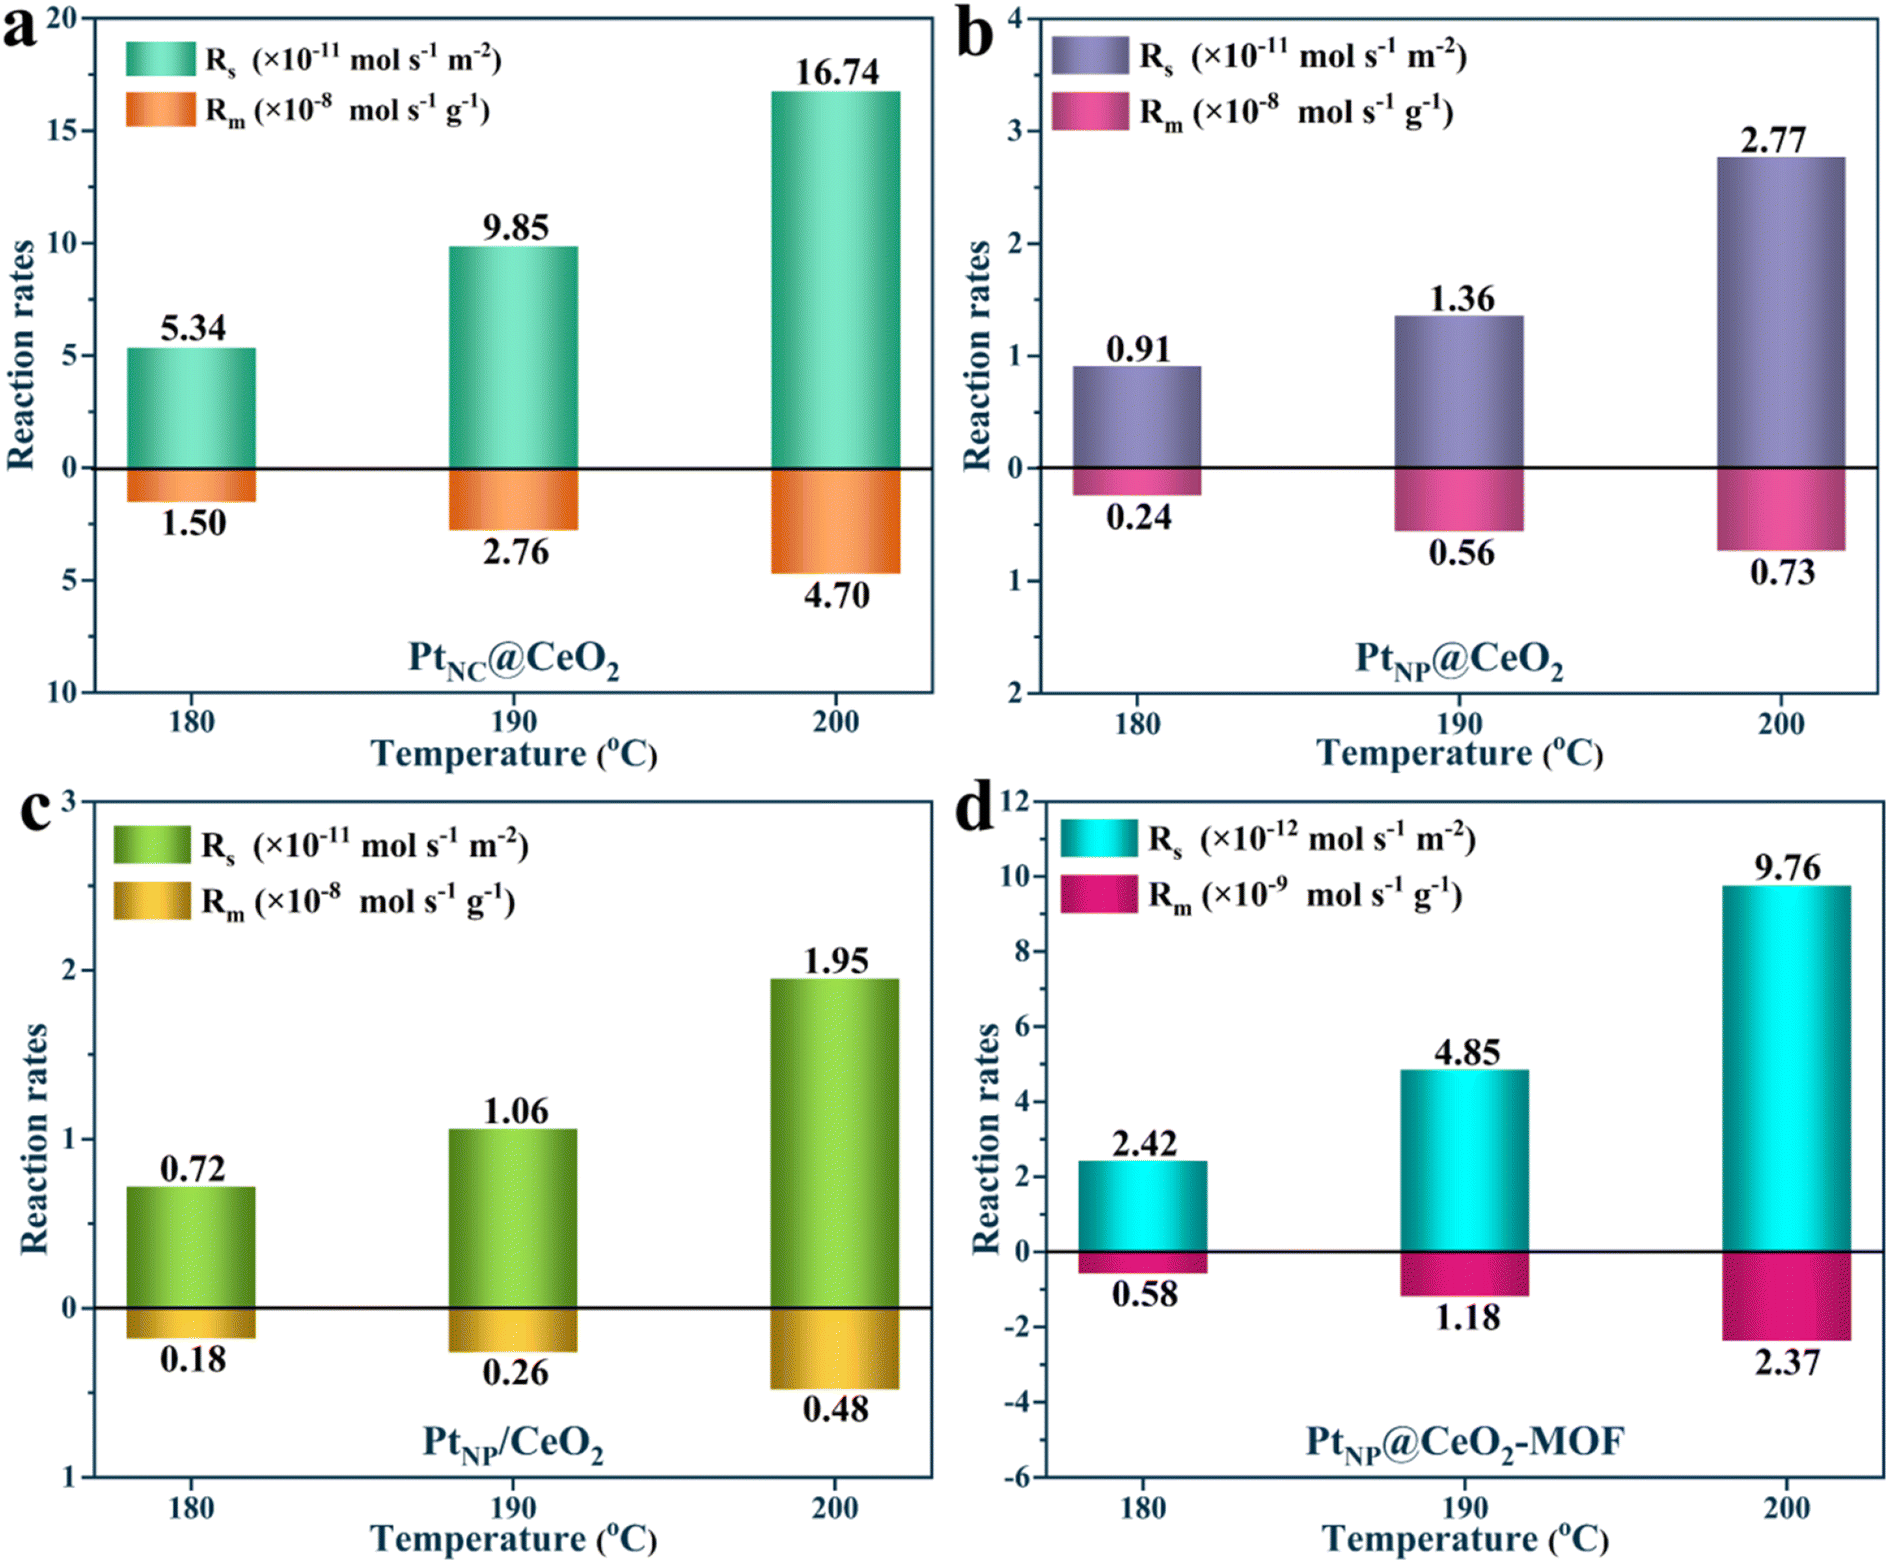
In short, the generation of Pt nanoclusters, more Ce3+ species, more lattice oxygen, more weak acid sites, larger specific surface area, and strong interfacial effect between Pt and CeO2 combined to construct the PtNC@CeO2 catalyst with the most excellent activity (Fig. 10h). To verify the activity for the catalysts, kinetic studies were performed (Fig. 11). It can be found that the Rs and Rm values of PtNC@CeO2 were much higher than those of PtNP@CeO2 under the same conditions in Fig. S12,† which also implied that PtNC@CeO2 had superior catalytic activity.
 | ||
| Fig. 11 Measurement of the specific toluene reaction rates of the catalysts. | ||
4. Conclusion
In conclusion, Pt nanoclusters over the PtNC@CeO2 catalyst were successfully obtained through an in situ confined encapsulation method for the toluene oxidation elimination. The size effect of Pt species on toluene catalytic oxidation was investigated systematically. It was found that Pt nanoclusters over the PtNC@CeO2 catalyst provided efficient activity (T90 = 272 °C) and excellent stability during the toluene reaction. The reasons were attributed to the more active Ce3+ species, more lattice oxygen and more weak acid sites, which favored the generation of oxygen vacancies (Ce3+ + Olatt → Ce4+ + OV) and the adsorption of reactant molecules. More importantly, the construction of Pt nanoclusters exposed more active sites and effectively promoted the activity. It is also possible that PtNC@CeO2 formed SMSIs, which led to more Pt–O–Ce bonding. The production of Pt nanoparticles led to the formation of the PtNP@CeO2 catalyst with lower activity, which did not expose abundant catalytic active sites. Through characterization analyses, the Pt and Ce introduction methods had diverse effects on the size of Pt species, morphology and catalytic performance. It is verified that the Pt in situ introduction strategy could not only achieve the formation of Pt nanoclusters but also generate more oxygen vacancies, thus optimizing the catalyst performance. The results of in situ DRIFTS confirmed that the MvK mechanism was more applicable for toluene elimination over the PtNC@CeO2 catalyst.Conflicts of interest
There are no conflicts to declare.Acknowledgements
This work was supported by the National Natural Science Foundation of China (52070182), the Natural Science Foundation of Gansu (23JRRA622, 23JRRA638), the DNL Cooperation Fund, CAS (DNL202004), the Joint Fund of the Yulin University and the Dalian National Laboratory for Clean Energy (YLU-DNL Fund 202206), the Longyuan Youth Innovation and Entrepreneurship Talent Project, Talents of Innovation and Entrepreneurship Project of Lanzhou, China (2022-RC-26), and the Major Program of the Lanzhou Institute of Chemical Physics, CAS (No. ZYFZFX-10).References
- Y. Wang, W. Deng, Y. Wang, L. Guo and T. Ishihara, A comparative study of the catalytic oxidation of chlorobenzene and toluene over Ce-Mn oxides, Mol. Catal., 2018, 459, 61–70 CrossRef CAS.
- F. Dong, W. Han, W. Han and Z. Tang, Assembling core-shell SiO2@NiaCobOx nanotube decorated by hierarchical NiCo-Phyllisilicate ultrathin nanosheets for highly efficient catalytic combustion of VOCs, Appl. Catal., B, 2022, 315, 121524 CrossRef CAS.
- J. Fu, N. Dong, Q. Ye, S. Cheng, T. Kang and H. Dai, Enhanced performance of the OMS-2 catalyst by Ag loading for the oxidation of benzene, toluene, and formaldehyde, New J. Chem., 2018, 42, 18117–18127 RSC.
- J. Qu, D. Chen, N. Li, Q. Xu, H. Li, J. He and J. Lu, Ternary photocatalyst of atomic-scale Pt coupled with MoS2 co-loaded on TiO2 surface for highly efficient degradation of gaseous toluene, Appl. Catal., B, 2019, 256, 117877 CrossRef CAS.
- W. Han, F. Dong, W. Han, J. Yao, Y. Meng and Z. Tang, A new strategy for designing highly efficient Co3O4 catalyst with the molecular space configurations for toluene catalytic combustion, Chem. Eng. J., 2022, 435, 134953 CrossRef CAS.
- B. Chen, X. Yang, X. Zeng, Z. Huang, J. Xiao, J. Wang and G. Zhan, Multicomponent metal oxides derived from Mn-BTC anchoring with metal acetylacetonate complexes as excellent catalysts for VOCs and CO oxidation, Chem. Eng. J., 2020, 397, 125424 CrossRef CAS.
- L. Meng and H. Zhao, Low-temperature complete removal of toluene over highly active nanoparticles CuO-TiO2 synthesized via flame spray pyrolysis, Appl. Catal., B, 2020, 264, 118427 CrossRef.
- Z. Zhu, G. Lu, Z. Zhang, Y. Guo, Y. Guo and Y. Wang, Highly active and stable Co3O4/ZSM-5 catalyst for propane oxidation: effect of the preparation method, ACS Catal., 2013, 3, 1154–1164 CrossRef CAS.
- Y. Guo, Y. Gao, X. Li, G. Zhuang, K. Wang, Y. Zheng, D. Sun, J. Huang and Q. Li, Catalytic benzene oxidation by biogenic Pd nanoparticles over 3D-ordered mesoporous CeO2, Chem. Eng. J., 2019, 362, 41–52 CrossRef CAS.
- S. Zuo, X. Sun, N. Lv and C. Qi, Rare earth-modified Kaolin/NaY-supported Pd-Pt bimetallic catalyst for the catalytic combustion of benzene, ACS Appl. Mater. Interfaces, 2014, 6, 11988–11996 CrossRef CAS.
- G.-Q. Yang, X. Ren, V. A. Kondratenko, H.-B. Zhang, E. V. Kondratenko and Z.-W. Liu, Promotional nature of Sn on Pt/CeO2 for the oxidative dehydrogenation of propane with carbon dioxide, Nano Res., 2023, 1–14 Search PubMed.
- J. Wang, X. Shi, L. Chen, H. Li, M. Mao, G. Zhang, H. Yi, M. Fu, D. Ye and J. Wu, Enhanced performance of low Pt loading amount on Pt–CeO2 catalysts prepared by adsorption method for catalytic ozonation of toluene, Appl. Catal., A, 2021, 625, 118342 CrossRef CAS.
- J. Peng and S. Wang, Performance and characterization of supported metal catalysts for complete oxidation of formaldehyde at low temperatures, Appl. Catal., B, 2007, 73, 282–291 CrossRef CAS.
- M. J. Patterson, D. E. Angove and N. W. Cant, The effect of carbon monoxide on the oxidation of four C6 to C8 hydrocarbons over platinum, palladium and rhodium, Appl. Catal., B, 2000, 26, 47–57 CrossRef.
- H. Yang, J. Deng, Y. Liu, S. Xie, P. Xu and H. Dai, Pt/Co3O4/3DOM Al2O3: Highly effective catalysts for toluene combustion, Chin. J. Catal., 2016, 37, 934–946 CrossRef CAS.
- J. Ji, Y. Tang, L. Han, P. Ran, W. Song, Y. Cai, W. Tan, J. Sun, C. Tang and L. Dong, Cerium manganese oxides coupled with ZSM-5: A novel SCR catalyst with superior K resistance, Chem. Eng. J., 2022, 445, 136530 CrossRef CAS.
- M. S. Avila, C. I. Vignatti, C. R. Apesteguia and T. F. Garetto, Effect of support on the deep oxidation of propane and propylene on Pt-based catalysts, Chem. Eng. J., 2014, 241, 52–59 CrossRef CAS.
- Z. Abbasi, M. Haghighi, E. Fatehifar and S. Saedy, Synthesis and physicochemical characterizations of nanostructured Pt/Al2O3-CeO2 catalysts for total oxidation of VOCs, J. Hazard. Mater., 2011, 186, 1445–1454 CrossRef CAS.
- J. H. Kwak, J. Hu, D. Mei, C.-W. Yi, D. H. Kim, C. H. Peden, L. F. Allard and J. Szanyi, Coordinatively unsaturated Al3+ centers as binding sites for active catalyst phases of platinum on γ-Al2O3, Science, 2009, 325, 1670–1673 CrossRef CAS PubMed.
- Z. Wang, Z. Huang, J. T. Brosnahan, S. Zhang, Y. Guo, Y. Guo, L. Wang, Y. Wang and W. Zhan, Ru/CeO2 catalyst with optimized CeO2 support morphology and surface facets for propane combustion, Environ. Sci. Technol., 2019, 53, 5349–5358 CrossRef CAS PubMed.
- X. Hu, Z. Zhang, Y. Zhang, L. Sun, H. Tian and X. Yang, Synthesis of a Highly Active and Stable Pt/Co3O4 Catalyst and Its Application for the Catalytic Combustion of Toluene, Eur. J. Inorg. Chem., 2019, 2019, 2933–2939 CrossRef CAS.
- H. Peng, T. Dong, L. Zhang, C. Wang, W. Liu, J. Bao, X. Wang, N. Zhang, Z. Wang, P. Wu, P. Zhang and S. Dai, Active and stable Pt-Ceria nanowires@silica shell catalyst: Design, formation mechanism and total oxidation of CO and toluene, Appl. Catal., B, 2019, 256, 117807 CrossRef CAS.
- M. Wang, D. Chen, N. Li, Q. Xu, H. Li, J. He and J. Lu, Highly Efficient Catalysts of Bimetallic Pt-Ru Nanocrystals Supported on Ordered ZrO2 Nanotube for Toluene Oxidation, ACS Appl. Mater. Interfaces, 2020, 12, 13781–13789 CrossRef CAS PubMed.
- S. Liu, A. S. Arce, S. Nilsson, D. Albinsson, L. Hellberg, S. Alekseeva and C. Langhammer, In situ plasmonic nanospectroscopy of the CO oxidation reaction over single Pt nanoparticles, ACS Nano, 2019, 13, 6090–6100 CrossRef CAS.
- I. Chakraborty and T. Pradeep, Atomically precise clusters of noble metals: emerging link between atoms and nanoparticles, Chem. Rev., 2017, 117, 8208–8271 CrossRef CAS.
- Q. Yao, Z. Wu, Z. Liu, Y. Lin, X. Yuan and J. Xie, Molecular reactivity of thiolate-protected noble metal nanoclusters: synthesis, self-assembly, and applications, Chem. Sci., 2021, 12, 99–127 RSC.
- S. Mostafa, F. Behafarid, J. R. Croy, L. K. Ono, L. Li, J. C. Yang, A. I. Frenkel and B. R. Cuenya, Shape-dependent catalytic properties of Pt nanoparticles, J. Am. Chem. Soc., 2010, 132, 15714–15719 CrossRef CAS PubMed.
- W. Xue and D. Mei, Mechanistic understanding of methane combustion over H-SSZ-13 zeolite encapsulated palladium nanocluster catalysts, Chem. Eng. J., 2022, 444, 136671 CrossRef CAS.
- Z. B. Wen, S. M. Zhang, Z. J. Liu, Z. X. Zhang, Z. Qiao, K. Liu and C. B. Gao, Size-engineered noble metal nanoclusters synthesized by impregnation for size-dependent catalysis, Sci. China Mater., 2023, 66, 1417–1426 CrossRef CAS.
- J.-Q. Chi, J.-Y. Xie, W.-W. Zhang, B. Dong, J.-F. Qin, X.-Y. Zhang, J.-H. Lin, Y.-M. Chai and C.-G. Liu, N-doped sandwich-structured Mo2C@C@Pt interface with ultralow Pt loading for pH-universal hydrogen evolution reaction, ACS Appl. Mater. Interfaces, 2019, 11, 4047–4056 CrossRef CAS PubMed.
- S. Sultan, J. N. Tiwari, A. N. Singh, S. Zhumagali, M. Ha, C. W. Myung, P. Thangavel and K. S. Kim, Single atoms and clusters based nanomaterials for hydrogen evolution, oxygen evolution reactions, and full water splitting, Adv. Energy Mater., 2019, 9, 1900624 CrossRef.
- R. Peng, S. Li, X. Sun, Q. Ren, L. Chen, M. Fu, J. Wu and D. Ye, Size effect of Pt nanoparticles on the catalytic oxidation of toluene over Pt/CeO2 catalysts, Appl. Catal., B, 2018, 220, 462–470 CrossRef CAS.
- S. Carabineiro, X. Chen, M. Konsolakis, A. Psarras, P. Tavares, J. Órfão, M. Pereira and J. Figueiredo, Catalytic oxidation of toluene on Ce–Co and La–Co mixed oxides synthesized by exotemplating and evaporation methods, Catal. Today, 2015, 244, 161–171 CrossRef CAS.
- Y. Lai, Z. Zhang, Z. Zhang, Y. Tan, L. Yu, W. Wu, Z. Wang, T. Jiang, S. Gao and N. Cheng, Electronic modulation of Pt nanoclusters through tuning the interface of Pt-SnO2 clusters for enhanced hydrogen evolution catalysis, Chem. Eng. J., 2022, 435, 135102 CrossRef CAS.
- K. Yang, Y. Liu, J. Deng, X. Zhao, J. Yang, Z. Han, Z. Hou and H. Dai, Three-dimensionally ordered mesoporous iron oxide-supported single-atom platinum: Highly active catalysts for benzene combustion, Appl. Catal., B, 2019, 244, 650–659 CrossRef CAS.
- L. Bai, X. Wang, Q. Chen, Y. Ye, H. Zheng, J. Guo, Y. Yin and C. Gao, Explaining the size dependence in platinum-nanoparticle-catalyzed hydrogenation reactions, Angew. Chem., Int. Ed., 2016, 55, 15656–15661 CrossRef CAS.
- J. Zhou, F. Pan, T. Wang, Y. Zhang, Q. Yao, C. Zhu, Y. Zhu, H. Ma and J. Niu, Controlled synthesis of water-soluble Pt nanoclusters and their co-catalysis with RuO2-IrO2 for electrochemical degradation of tetracycline, Sep. Purif. Technol., 2022, 295, 121323 CrossRef CAS.
- H. Mistry, R. Reske, Z. Zeng, Z.-J. Zhao, J. Greeley, P. Strasser and B. R. Cuenya, Exceptional size-dependent activity enhancement in the electroreduction of CO2 over Au nanoparticles, J. Am. Chem. Soc., 2014, 136, 16473–16476 CrossRef CAS.
- F. Jiang, S. Wang, B. Liu, J. Liu, L. Wang, Y. Xiao, Y. Xu and X. Liu, Insights into the Influence of CeO2 Crystal Facet on CO2 Hydrogenation to Methanol over Pd/CeO2 Catalysts, ACS Catal., 2020, 10, 11493–11509 CrossRef CAS.
- R. Si and M. Flytzani-Stephanopoulos, Shape and Crystal-Plane Effects of Nanoscale Ceria on the Activity of Au-CeO2 Catalysts for the Water–Gas Shift Reaction, Angew. Chem., 2008, 120, 2926–2929 CrossRef.
- X. Liu, J. Wang, J. Zeng, X. Wang and T. Zhu, Catalytic oxidation of toluene over a porous Co3O4-supported ruthenium catalyst, RSC Adv., 2015, 5, 52066–52071 RSC.
- M. Wen, F. Dong, J. Yao, Z. Tang and J. Zhang, Pt nanoparticles confined in the ordered mesoporous CeO2 as a highly efficient catalyst for the elimination of VOCs, J. Catal., 2022, 412, 42–58 CrossRef CAS.
- S. Chang, M. Li, Q. Hua, L. Zhang, Y. Ma, B. Ye and W. Huang, Shape-dependent interplay between oxygen vacancies and Ag–CeO2 interaction in Ag/CeO2 catalysts and their influence on the catalytic activity, J. Catal., 2012, 293, 195–204 CrossRef CAS.
- Q. Liu, P. Yang, W. Tan, H. Yu, J. Ji, C. Wu, Y. Cai, S. Xie, F. Liu, S. Hong, K. Ma, F. Gao and L. Dong, Fabricating Robust Pt Clusters on Sn-Doped CeO2 for CO Oxidation: A Deep Insight into Support Engineering and Surface Structural Evolution, Chemistry, 2023, 29, e202203432 CrossRef CAS.
- E. Kumar, P. Selvarajan and K. Balasubramanian, Preparation and studies of cerium dioxide (CeO2) nanoparticles by microwave-assisted solution method, Recent Res. Sci. Technol., 2010, 2, 37–41 CAS.
- H. Zhao, W. Han and Z. Tang, Tailored design of high-stability CoMn1.5Ox@TiO2 double-wall nanocages derived from Prussian blue analogue for catalytic combustion of o-dichlorobenzene, Appl. Catal., B, 2020, 276, 119133 CrossRef CAS.
- C. Huang, Y. Yu, X. Tang, Z. Liu, J. Zhang, C. Ye, Y. Ye and R. Zhang, Hydrogen generation by ammonia decomposition over Co/CeO2 catalyst: Influence of support morphologies, Appl. Surf. Sci., 2020, 532, 147335 CrossRef CAS.
- U. Jamil, A. Husain Khoja, R. Liaquat, S. Raza Naqvi, W. N. N. W. Omar and N. A. S. Amin, Copper and calcium-based metal organic framework (MOF) catalyst for biodiesel production from waste cooking oil: A process optimization study, Energy Convers. Manage., 2020, 215, 112934 CrossRef CAS.
- S. Xie, Y. Liu, J. Deng, X. Zhao, J. Yang, K. Zhang, Z. Han, H. Arandiyan and H. Dai, Effect of transition metal doping on the catalytic performance of Au-Pd/3DOM Mn2O3 for the oxidation of methane and o-xylene, Appl. Catal., B, 2017, 206, 221–232 CrossRef CAS.
- Z. Hou, L. Dai, Y. Liu, J. Deng, L. Jing, W. Pei, R. Gao, Y. Feng and H. Dai, Highly efficient and enhanced sulfur resistance supported bimetallic single-atom palladium-cobalt catalysts for benzene oxidation, Appl. Catal., B, 2021, 285, 119844 CrossRef CAS.
- M. Xiao, D. Han, X. Yang, N. T. Tchinda, L. Du, Y. Guo, Y. Wei, X. Yu and M. Ge, Ni-doping-induced oxygen vacancy in Pt-CeO2 catalyst for toluene oxidation: Enhanced catalytic activity, water-resistance, and SO2-tolerance, Appl. Catal., B, 2023, 323, 122173 CrossRef CAS.
- C. Huang, Y. Zhang, X. Li, H. Cao, Y. Guo and C. Zhang, Mn-incorporated Co3O4 bifunctional electrocatalysts for zinc-air battery application: An experimental and DFT study, Appl. Catal., B, 2022, 319, 121909 CrossRef CAS.
- X. Li, Y. Wang, D. Chen, J. Xiao, N. Li, Q. Xu, H. Li, J. He and J. Lu, Elucidating the Characteristics of Palladium-Anchored CeO2-Modified Hexagonal Nanosheet Co3O4 Catalysts for the Complete Oxidation of Volatile Organic Compounds, Ind. Eng. Chem. Res., 2022, 61, 7537–7546 CrossRef CAS.
- J. Chen, X. Chen, D. Yan, M. Jiang, W. Xu, H. Yu and H. Jia, A facile strategy of enhancing interaction between cerium and manganese oxides for catalytic removal of gaseous organic contaminants, Appl. Catal., B, 2019, 250, 396–407 CrossRef CAS.
- Z. Jiang, M. Jing, X. Feng, J. Xiong, C. He, M. Douthwaite, L. Zheng, W. Song, J. Liu and Z. Qu, Stabilizing platinum atoms on CeO2 oxygen vacancies by metal–support interaction induced interface distortion: Mechanism and application, Appl. Catal., B, 2020, 278, 119304 CrossRef CAS.
- X. Weng, W. L. Wang, Q. Meng and Z. Wu, An ultrafast approach for the syntheses of defective nanosized lanthanide perovskites for catalytic toluene oxidation, Catal. Sci. Technol., 2018, 8, 4364–4372 RSC.
- J.-R. Li, F.-K. Wang, C. He, C. Huang and H. Xiao, Catalytic total oxidation of toluene over carbon-supported CuCo oxide catalysts derived from Cu-based metal organic framework, Powder Technol., 2020, 363, 95–106 CrossRef CAS.
- S. Xie, L. Liu, Y. Lu, C. Wang, S. Cao, W. Diao, J. Deng, W. Tan, L. Ma, S. N. Ehrlich, Y. Li, Y. Zhang, K. Ye, H. Xin, M. Flytzani-Stephanopoulos and F. Liu, Pt Atomic Single-Layer Catalyst Embedded in Defect-Enriched Ceria for Efficient CO Oxidation, J. Am. Chem. Soc., 2022, 144, 21255–21266 CrossRef CAS PubMed.
- B. Wang, X. Li, Y. Sun, H. Xiao, M. Fu, S. Li, H. Liang, Z. Qiao and D. Ye, Unravelling the correlation of dielectric barrier discharge power and performance of Pt/CeO2 catalysts for toluene oxidation, Catal. Sci. Technol., 2023, 13, 389–399 RSC.
- Z. Guo, X. Zhao, G. Chen, W. Zhao, T. Liu, R. Hu and X. Jiang, Controllable synthesis of magic cube-like Ce-MOF-derived Pt/CeO2 catalysts for formaldehyde oxidation, Nanoscale, 2022, 14, 12713–12721 RSC.
- W. Tan, S. Xie, D. Le, W. Diao, M. Wang, K. B. Low, D. Austin, S. Hong, F. Gao, L. Dong, L. Ma, S. N. Ehrlich, T. S. Rahman and F. Liu, Fine-tuned local coordination environment of Pt single atoms on ceria controls catalytic reactivity, Nat. Commun., 2022, 13, 7070 CrossRef CAS.
- S. K. Meher, M. Cargnello, H. Troiani, T. Montini, G. R. Rao and P. Fornasiero, Alcohol induced ultra-fine dispersion of Pt on tuned morphologies of CeO2 for CO oxidation, Appl. Catal., B, 2013, 130, 121–131 CrossRef.
- Q. Zhang, S. Mo, J. Li, Y. Sun, M. Zhang, P. Chen, M. Fu, J. Wu, L. Chen and D. Ye, In situ DRIFT spectroscopy insights into the reaction mechanism of CO and toluene co-oxidation over Pt-based catalysts, Catal. Sci. Technol., 2019, 9, 4538–4551 RSC.
- T. Tong, M. Douthwaite, L. Chen, R. Engel, M. B. Conway, W. Guo, X. P. Wu, X. Q. Gong, Y. Wang, D. J. Morgan, T. Davies, C. J. Kiely, L. Chen, X. Liu and G. J. Hutchings, Uncovering Structure-Activity Relationships in Pt/CeO2 Catalysts for Hydrogen-Borrowing Amination, ACS Catal., 2023, 13, 1207–1220 CrossRef CAS PubMed.
- X. Chen, E. Yu, S. Cai, H. Jia, J. Chen and P. Liang, In situ pyrolysis of Ce-MOF to prepare CeO2 catalyst with obviously improved catalytic performance for toluene combustion, Chem. Eng. J., 2018, 344, 469–479 CrossRef CAS.
- S. Mo, Q. Zhang, J. Li, Y. Sun, Q. Ren, S. Zou, Q. Zhang, J. Lu, M. Fu, D. Mo, J. Wu, H. Huang and D. Ye, Highly efficient mesoporous MnO2 catalysts for the total toluene oxidation: Oxygen-Vacancy defect engineering and involved intermediates using in situ DRIFTS, Appl. Catal., B, 2020, 264, 118464 CrossRef CAS.
- S. Mo, J. Li, R. Liao, P. Peng, J. Li, J. Wu, M. Fu, L. Liao, T. Shen, Q. Xie and D. Ye, Unraveling the decisive role of surface CeO2 nanoparticles in the Pt-CeO2/MnO2 hetero-catalysts for boosting toluene oxidation: Synergistic effect of surface decorated and intrinsic O-vacancies, Chem. Eng. J., 2021, 418, 129399 CrossRef CAS.
- S. Wu, H. Zhao, Y. Xi, Z. Tang and J. Zhang, Core-shell CoCuOx@MOx (M=Nb, Ti and Ce) catalysts with outstanding durability and resistance to H2O for the catalytic combustion of o-dichlorobenzene, Sci. Total Environ., 2023, 860, 160472 CrossRef CAS PubMed.
- J. Yao, F. Dong, X. Xu, M. Wen, Z. Ji, H. Feng, X. Wang and Z. Tang, Rational Design and Construction of Monolithic Ordered Mesoporous Co3O4@SiO2 Catalyst by a Novel 3D Printed Technology for Catalytic Oxidation of Toluene, ACS Appl. Mater. Interfaces, 2022, 14, 22170–22185 CrossRef CAS PubMed.
- J. Zhong, Y. Zeng, D. Chen, S. Mo, M. Zhang, M. Fu, J. Wu, Z. Su, P. Chen and D. Ye, Toluene oxidation over Co3+-rich spinel Co3O4: Evaluation of chemical and by-product species identified by in situ DRIFTS combined with PTR-TOF-MS, J. Hazard. Mater., 2020, 386, 121957 CrossRef CAS PubMed.
- Q. Ren, X. Zhao, J. Zhong, J. Zhang, J. Tian, D. Yan, P. Liu, M. Fu, L. Chen, J. Wu and D. Ye, Unravelling the role of oxygen species in toluene oxidation over Co3O4-base catalysts: In situ DRIFTS coupled with quasi in situ XPS, J. Catal., 2023, 418, 130–140 CrossRef CAS.
- Y. Li, T. Qin, Y. Ma, J. Xiong, P. Zhang, K. Lai, X. Liu, Z. Zhao, J. Liu, L. Chen and Y. Wei, Revealing active edge sites induced by oriented lattice bending of Co-CeO2 nanosheets for boosting auto-exhaust soot oxidation, J. Catal., 2023, 421, 351–364 CrossRef CAS.
Footnote |
| † Electronic supplementary information (ESI) available. See DOI: https://doi.org/10.1039/d3lf00147d |
| This journal is © The Royal Society of Chemistry 2024 |