
 Open Access Article
 This Open Access Article is licensed under a Creative Commons Attribution-Non Commercial 3.0 Unported Licence
Electrostatic microfiltration (EM) enriches and recovers viable microorganisms at low-abundance in large-volume samples and enhances downstream detection†
Yaoping
Liu‡
 ab,
Joshua J.
Raymond‡
b,
Xiaolin
Wu‡
b,
Patrina Wei Lin
Chua
a,
Sharon Yan Han
Ling
a,
Chia Ching
Chan
a,
Cheryl
Chan
b,
Joanne Xin Yi
Loh
b,
Melody Xing Yen
Song
c,
Matilda Yu Yan
Ong
c,
Peiying
Ho
a,
Megan E.
Mcbee
a,
Stacy L.
Springs
bd,
Hanry
Yu
bef and
Jongyoon
Han
*abdgh
ab,
Joshua J.
Raymond‡
b,
Xiaolin
Wu‡
b,
Patrina Wei Lin
Chua
a,
Sharon Yan Han
Ling
a,
Chia Ching
Chan
a,
Cheryl
Chan
b,
Joanne Xin Yi
Loh
b,
Melody Xing Yen
Song
c,
Matilda Yu Yan
Ong
c,
Peiying
Ho
a,
Megan E.
Mcbee
a,
Stacy L.
Springs
bd,
Hanry
Yu
bef and
Jongyoon
Han
*abdgh
aAntiMicrobial Resistance (AMR) IRG, Singapore-MIT Alliance for Research and Technology (SMART), 138602, Singapore
bCritical Analytics for Manufacturing Personalized-Medicine (CAMP) IRG, Singapore-MIT Alliance for Research and Technology (SMART), 138602, Singapore
cSchool of Life Sciences & Chemical Technology, Ngee Ann Polytechnic, 599489, Singapore
dCenter for Biomedical Innovation, Massachusetts Institute of Technology (MIT), MA 02139, USA
eInstitute of Bioengineering and Bioimaging (IBB), A*STAR, 138632, Singapore
fDepartment of physiology and WisDM and Mechanobiology Institute, National University of Singapore, 119077, Singapore
gDepartment of Electrical Engineering and Computer Science, MIT, Cambridge, MA 02139, USA
hDepartment of Biological Engineering, MIT, Cambridge, MA 02139, USA. E-mail: jyhan@mit.edu
First published on 19th August 2024
Abstract
Rapid and sensitive detection of pathogens in various samples is crucial for disease diagnosis, environmental surveillance, as well as food and water safety monitoring. However, the low abundance of pathogens (<10 CFU) in large volume (1 mL−1 L) samples containing vast backgrounds critically limits the sensitivity of even the most advanced techniques, such as digital PCR. Therefore, there is a critical need for sample preparation that can enrich low-abundance pathogens from complex and large-volume samples. This study develops an efficient electrostatic microfiltration (EM)-based sample preparation technique capable of processing ultra-large-volume (≥500 mL) samples at high throughput (≥10 mL min−1). This approach achieves a significant enrichment (>8000×) of extremely-low-abundance pathogens (down to level of 0.02 CFU mL−1, i.e., 10 CFU in 500 mL). Furthermore, EM-enabled sample preparation facilitates digital amplification techniques sensitively detecting broad pathogens, including bacteria, fungi, and viruses from various samples, in a rapid (≤3 h) sample-to-result workflow. Notably, the operational ease, portability, and compatibility/integrability with various downstream detection platforms highlight its great potential for widespread applications across diverse settings.
Introduction
Detection of low-abundance pathogens in large-volume liquid samples poses a critical challenge in various fields, including healthcare,1 epidemiological surveillance,2,3 outbreak management,2,4 environmental monitoring,5 and food6,7 and water safety.8 This challenge arises from the low abundance of pathogens (less than 10 colony-forming units per milliliter, i.e., <10 CFU mL−1) amidst substantial backgrounds in large-volume complex samples. This creates a considerable mismatch (both in volume and concentration) between raw samples and downstream detection methods (Fig. 1A and B, respectively), restricting the lower limit of detection (LOD) even for the most advanced techniques such as digital polymerase chain reaction (dPCR).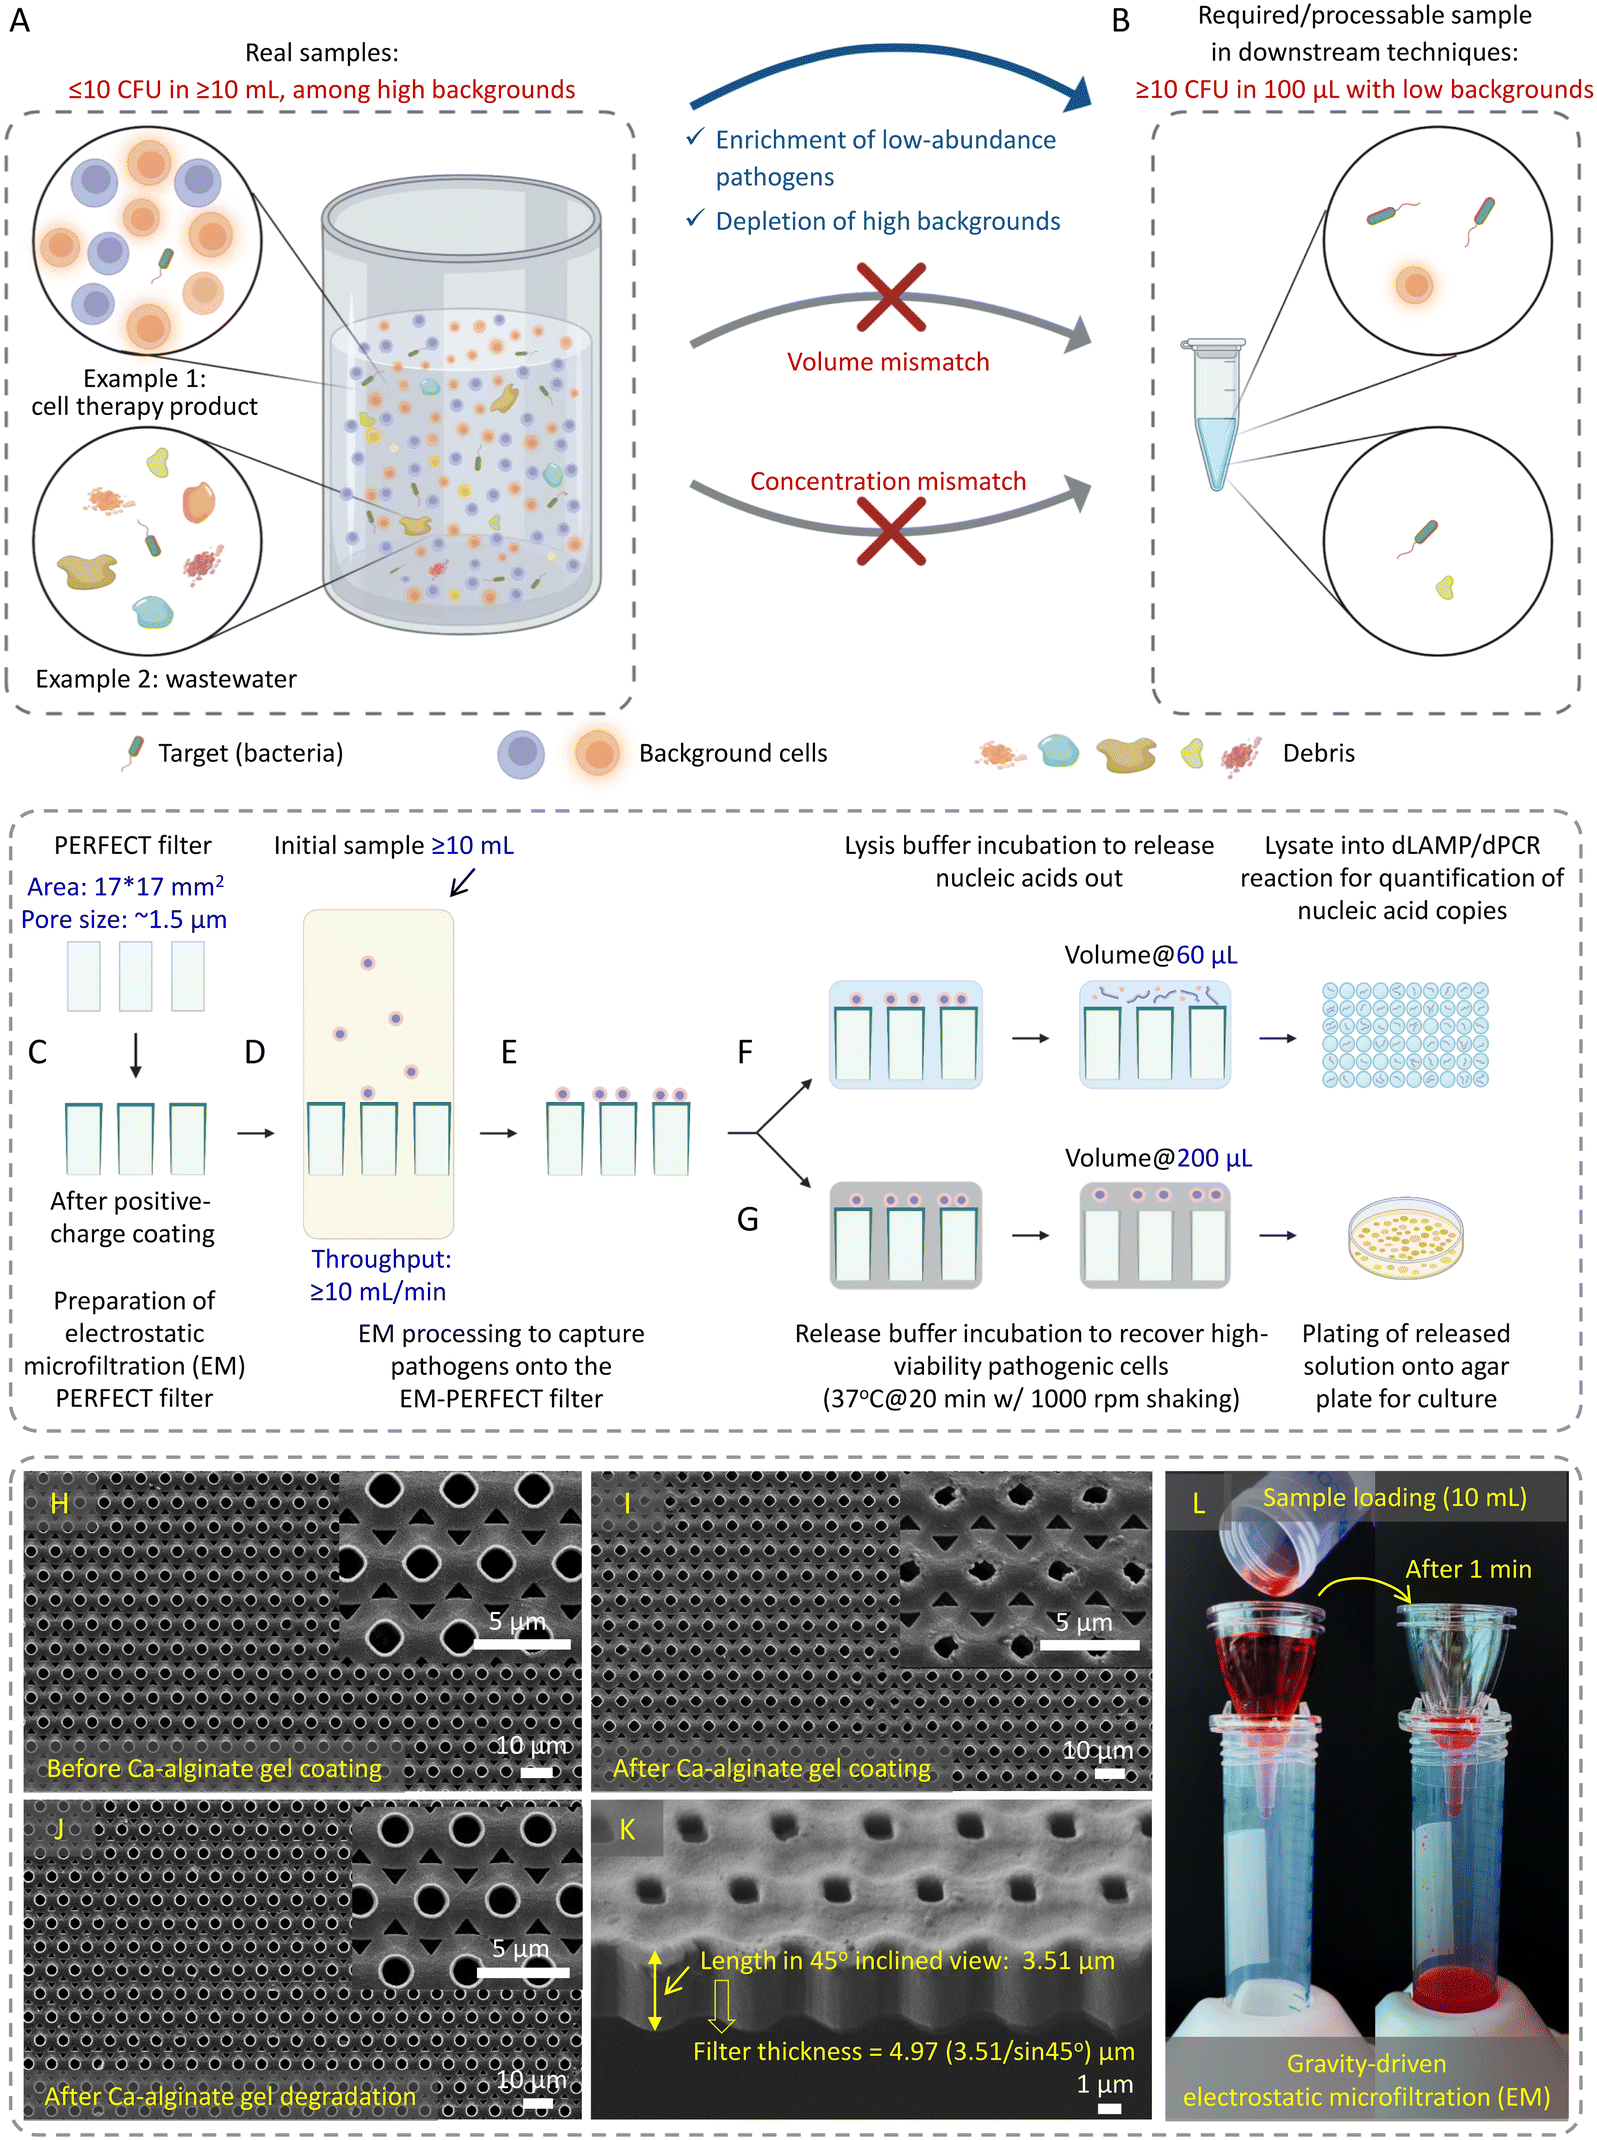 | ||
| Fig. 1 Schematic illustration of A and B) mismatch between raw samples and downstream techniques, and C–G) EM-based sample preparation, H–K) SEM images of PERFECT filters, and L) EM processing driven by gravity. A) Contents in raw samples and B) requirements of downstream detection techniques. C) Preparation of EM-PERFECT filter. D) Gravity-driven EM processing to E) capture pathogens. F) In situ lysis (60 μL) and G) release (200 μL) to interface the digital amplification-based detection and plating-based culture. SEM images of PERFECT filters H) before and I) after Ca-alginate gel coating, J) after Ca-alginate gel degradation, and K) the inclined view of the PERFECT filter to display the small thickness. L) Gravity-driven EM processing with H2O-containing food dye as a label for visualization. (A and B) and C–G) were created with https://BioRender.com). | ||
Commonly used downstream detection techniques (e.g., PCR, sequencing, etc.) are typically limited to assay volumes of no more than 100 μL. To achieve true positives in the detection of low-abundance samples with statistical significance, it is essential to minimize the standard deviation, which scales  in sampling of the n microbial cells.9 The standard deviation becomes substantial when n < 10, thereby, at least ∼10 microbial cells must be present in the processed 100 μL volume. Moreover, interference from the background often leads to false negatives or false positives. Therefore, there is an urgent need for sample preparation techniques aiming at separating and enriching low-abundance pathogens from vast backgrounds in raw samples to enhance the sensitivity and improve the detection limit of downstream methods.8,10–14
Over the past decades, various sample preparation techniques have been explored. While micro/nano techniques have gained attention for their efficiency and sensitivity in detection of low-concentration objects, there is still no effective microfluidic-based sample preparation due to low throughput (μL min−1 levels) and susceptibility to clogging when handling large-volume (mL–L) and complex samples.13,15,16 Current sample preparation techniques mainly include centrifugation/ultracentrifugation,17–19 immunomagnetic separation,20–23 enrichment culture methods,7,24–26 and filtration/ultrafiltration.27–32 Each method presents distinct advantages and limitations, necessitating consideration of factors such as sample characteristics, target pathogen, desired sensitivity levels, and downstream analysis requirements. Key performance metrics for evaluating a sample preparation technique include volume processing capacity (volume throughput), sensitivity (capture efficiency of targets), enrichment factor (the ratio of target abundance or sample volume pre- to post-processing), as well as labor and time requirements.
Centrifugation can process large-volume samples (up to ∼50 mL in typical laboratory systems) but is time-consuming and labor-intensive. It also suffers from significant loss of low-abundance pathogens and is challenging to effectively separate from background contents. Nevertheless, various centrifugation-based techniques, such as differential centrifugation,33 density gradient centrifugation,34 and ultracentrifugation,19 have been used for pathogen enrichment and purification. These methods facilitate the isolation of intact pathogens or pathogen-associated biomolecules, but their reliance on specialized and expensive reagents and equipment restrict the widespread adoption, particularly in resource-limited environments.
Immunomagnetic separation (IMS) utilizes magnetic beads conjugated with specific antibodies or ligands to selectively capture target pathogens from background contents in complex samples, enhancing the performance of downstream detection.20–23 However, IMS heavily relies on the availability of antibodies or ligands of high cost and limited accessibility for all pathogens, restricting its broad application. IMS also faces challenges in efficiently recovering captured pathogens from beads, potentially affecting downstream detection performance.
Enrichment culture optimizes conditions for low-abundance pathogen growth, amplifying their numbers for detection.7,24–26 While adaptable to various sample types and microbial species, enrichment culture is time-consuming (days to weeks) and may overlook non-culturable pathogens, leading to false negatives and incomplete pathogen diversity in the initial sample. Moreover, prolonged incubation may lead to excessive proliferation of non-target microorganisms, potentially obscuring or interfering with detection of low-abundance targets.
Filtration methods utilize a certain-sized pore to selectively capture pathogens based on their size, enabling the concentration of low-abundance pathogens from complex samples.27–32 These techniques often expedite the processing of large-volume samples and require much less equipment than centrifugation. However, traditional membrane filtration frequently encounters issues such as clogging and non-specific adhesion,32 leading to reduced efficiency in the capture and retention/recovery of pathogens, potentially degrading the sensitivity of downstream detection methods. Electrostatic membrane filtration, dating back to the 1960s, captures pathogens via electrostatic interactions between the charged membrane surface and inherent negative charges on the pathogen surface35–39 but suffers from inefficient retention/recovery of captured pathogens from the membrane.32,39 Membrane filtration can realize massive processing of up to liter-level samples, but the final retentate volume still falls within milliliter level, creating a gap with downstream detection platforms.28,30,37,38 Developing improved filtration units and increased enrichment fold are crucial for enhancing efficiency in electrostatic filtration processes and compatibility with downstream applications.
Herein, this work established an electrostatic microfiltration (EM)-based sample preparation for highly efficient enrichment of low-abundance pathogens from large-volume samples using the previously reported precise, efficient, rapid, flexible, easy, controllable and thin (PERFECT) filter,40 schematically shown in Fig. 1C–G. This approach involves coating the PERFECT filter with a biocompatible hydrogel, calcium (Ca)-alginate (generated by crosslinking alginic acid sodium salt and CaCl2), to impart positive charges for capturing negatively charged pathogens. The controllable degradation of Ca-alginate gel enables the efficient release, thereby, the concentration of captured pathogens into small volumes suitable for downstream techniques. With this efficient sample preparation, we can achieve several goals: 1) improved pathogen capture efficiency: EM processing significantly enhanced pathogen capture efficiency, contrasting with less effective outcomes using centrifugation/ultracentrifugation. 2) Release with high viability: controllable Ca-alginate degradation facilitated pathogen release with viability, confirmed through live-dead staining and subsequent successful cultivation on agar plates. 3) Capability for large-volume processing: EM demonstrated the ability to process ultra-large-volume samples at high throughput with high-fold enrichment. 4) Broad applicability: EM exhibited versatility in capturing low-abundance bacteria, fungi, and viruses in diverse matrices, showcasing adaptability across various microorganisms and sample compositions. 5) Rapid sample-to-result workflow: EM-based concentration interfacing digital amplification techniques enabled a rapid sample-to-result workflow and achieved remarkable improvements in the limit-of-detection (LOD) compared to centrifugation/ultracentrifugation-based sample preparation methods. This advancement facilitated the sensitive detection of various pathogens, including bacteria, fungi, and viruses. Additionally, the EM-based sample preparation demonstrated operational ease, portability, and compatibility with diverse downstream techniques, indicating its potential for widespread applications in different settings.
Materials and methods
Preparation and characterization of positively charged coating on the PERFECT filter
A previously reported PERFECT filter (Hangzhou Branemagic Medical Technology Co., Ltd., China) with a 17 mm × 17 mm area and ∼1.5 μm micropores arranged in a 4 μm-pitch (Fig. 1H–K)40 was used in this study. The positively charged coating was achieved by crosslinking 0.4% (w/v) alginic acid sodium salt and 10 mM CaCl2 (Product nos. A1112 and C5670, Sigma Aldrich) to form the Ca-alginate gel on the surface of the PERFECT filter. A homemade holder, designed as per Fig. S1B and S1C,† supported the EM-PERFECT filter during the sequential coating of CaCl2, alginic acid sodium salt, and CaCl2 (one cycle) using a spin coater (POLOS-200, SPS, Netherlands). After each spin-coating step, the PERFECT filter was dried at ambient temperature. The resulting coated filter, referred to as the electrostatic microfiltration PERFECT filter (EM-PERFECT filter), underwent characterization under a scanning electron microscope (SEM) (Quanta 650FEG, FEI, USA). To enhance conductivity, a 25 nm-thick layer of gold was applied using a sputter (EM ACE200, Leica Microsystems, Germany). For the LB and bottled water (Dasani Drinking Water, purchased from https://amazon.sg) sample processing, the standard Ca-alginate coating was used. For the FBS (Product no. 12662029, ThermoFisher Scientific, USA) sample processing, a Plu-Ca-alginate gel was crafted by adding 2% (w/v) Pluronic F-127 into 0.4% (w/v) alginic acid sodium salt. This modification aimed to reduce protein adhesion41 onto the EM-PERFECT filter, subsequently amplifying the signal outputs in the downstream dLAMP reaction. Different Pluronic concentrations were evaluated, and the optimal concentration determined from the comparison was 2% (w/v) (Table S1†).Bacteria and fungi culture for preparation of spiked samples
To assess the performance of the developed EM-enabled sample preparation technique, three bacterial species-S. aureus (ATCC 6538), K. pneumoniae (KP1, an environmental isolate42) and P. aeruginosa (ATCC 9027)-as well as one fungal species, C. albicans (Robin) Berkhout (ATCC 10231), were selected as representative targets for bacteria and fungi detection. Overnight cultures of bacteria and fungi were initiated by inoculating a single colony into 5 mL sterile LB (Product no. L3522, Sigma Aldrich) for the three bacteria and brain heart infusion broth (BHIB) (Product no. 75917, Sigma Aldrich) for C. albicans. Cultures were incubated at 37 °C for bacteria and 33 °C for fungi with shaking at 200 rpm on an orbital shaker (Orbitron, INFORS HT, Switzerland) overnight. The optical density (OD) of overnight cultures was measured using a UV spectrophotometer (Ultrospec™ 10, Biochrom USA). Cultures were diluted with fresh broth to obtain an OD value of 0.075, initiating the log-phase culture. The conditions for incubation during the log-phase culture were consistent with the overnight culture. OD measurements were taken during incubation, and cultures were terminated when the OD value reached within the range of 0.6 to 0.8. Upon reaching the log phase, cultures were diluted to OD 0.1 with 10% broth (in 1× PBS) (Product no. 20012027, ThermoFisher Scientific, USA), and serial dilutions were performed to introduce an expected abundance of bacteria or fungi into samples of diverse matrices including LB, BHIB, FBS, and bottled water. Bacteria detection involved spiked samples with the three bacteria into LB, FBS and bottled water. Fungi detection involved spiked samples with C. albicans into BHIB. Single plex (one species bacterial cells inside one sample) and multiplex (different species bacterial cells inside one sample) spiked samples were employed in bacteria detection, with the latter having both balanced and biased abundance ratios. CFU abundances of each experimental batch were determined by actual CFU counts using the plating method. Due to the inherent challenges in exactly obtaining expected abundances, categorization was employed during data analysis. Actual counts falling within the range of 0.3 CFU mL−1 to 3.3 CFU mL−1, 3.4 CFU mL−1 to 33 CFU mL−1, 34 CFU mL−1 to 333 CFU mL−1, and 334 CFU mL−1 to 3333 CFU mL−1 were considered to represent levels of 1 CFU mL−1, 10 CFU mL−1, 100 CFU mL−1, and 1000 CFU mL−1, respectively.Preparation of viral spent media samples
Vero cells (ATCC CCL-81) were cultured using Dulbecco's Modified Eagle Medium (DMEM, Product no. 11995065, ThermoFisher Scientific, USA) and used for infection of herpes simplex virus type 1 (HSV-1, ATCC VR-260) at multiplicity of infection (MOI) of 0.01. Spent culture media was collected at 48 hours post-infection. The virus titer in initially collected spent media was quantified using plaque assay and subsequent counting of plaque-forming unit (PFU). Lower-abundance viral samples were generated by diluting the original spent media containing HSV particles with fresh media. The PFU abundances of HSV particles in spiked samples were determined by considering the serial dilution factor and the PFU counting from the initially collected spent media.Electrostatic microfiltration (EM) processing for pathogen capture
The EM-PERFECT filter was packaged into the sterile matching gadget, purchased together with the PERFECT filter, as shown in Fig. S1D–S1F.† Before loading samples, 1 mL of 70% ethanol was applied for sterilization and wetting of the EM-PERFECT filter, followed by 3 mL of 1× PBS wash. All filtration was gravity-driven. LB and bottled water samples were directly loaded onto the EM-PERFECT filter after ethanol wetting and PBS wash. FBS samples were 10× diluted with 1× PBS before undergoing EM processing, followed by a wash with 3 mL 1× PBS filtration. CFU counting of initial samples and filtrates for bacterial LB spiking tests was conducted with a plating-based method, and capture efficiencies were accordingly calculated, with detailed data available in Table S2.† The average and standard deviation of capture efficiencies at a certain level of abundance were analyzed based on the earlier mentioned categorization standard. After filtration, two approaches were taken: 1) SEM characterization, where the EM-PERFECT filter containing captured pathogens was transferred into a 35 mm petri dish. A 1-mL of 2.5% glutaraldehyde solution (G5882, Sigma-Aldrich) incubation was conducted, followed by a 3× wash with 1× PBS. Subsequently, gradient dehydration by 70%, 90%, and 100% ethanol (each for 10 minutes) was conducted, followed by a critical point dehydration (CPD) process using a CPD chamber (EM CPD300, Leica Microsystems, Germany). Finally, the coating of a 25 nm-thick layer of gold was conducted to enhance conductivity. Bacteria and fungi observation was performed with an SEM machine (Quanta 650FEG, FEI, USA), while virus observation used another SEM machine (JSM-6701F, JEOL, Japan) with higher resolution. 2) Pathogenic cell release or lysis, where the flexible EM-PERFECT filter containing captured pathogens was folded into an RNase-free, non-stick, low-binding microfuge tube (AM120, Life Technologies Holdings Pte Ltd, US) containing the release or lysis solution.Bacteria release and viability characterization
For bacteria release and viability characterization, incubation of the EM-PERFECT filter containing captured bacteria in an RNase-free, non-stick, low-binding microfuge tube containing the release solution for 15 minutes at 37 °C with shaking at 1000 rpm on a dry bath/block heater (ThermoMixer C, Eppendorf, Germany) was conducted. The release solution containing 0.1 unit per mL alginate lyase (Product no. A1603, Sigma-Aldrich) in 1× PBS at pH 6.3. After release, short-term viability was tested using flow cytometry (Attune NxT, Life Technologies Holdings Pte Ltd, US) based on staining with a live-dead kit (Product no. L7012, Life Technologies Holdings Pte Ltd, US). Long-term viability was verified by plating released bacteria onto LB agar plates for overnight culture at 37 °C. Different concentrations of alginate lyase and buffer PHs were compared, with detailed viability data shown in Table S3,† and the optimal release solution comprised 0.1 unit per mL alginate lyase (Product no. A1603, Sigma-Aldrich) in 1× PBS at PH 6.3. In the live-dead staining, released bacteria were incubated for 10 minutes at room temperature with SYTO9 and propidium iodide (PI) at concentrations of 83.5 nM and 5 μM for S. aureus, and 835 nM and 66.7 μM for K. pneumoniae and P. aeruginosa. The signals of SYTO9 and PI were detected with forward scatter (FSC) and side scatter (SSC) set as 250 and 320 under blue (BL1, excitation at 440 nm & collection at filter of 530/30 nm) and yellow (YL2, excitation at 510 nm & collection at filter of 620/15 nm) laser channels, respectively. 100 μL was collected for each sample. The viability was determined by calculating the ratio of SYTO9-positive singlets among all detected singlets.EM-enabled sample preparation interfacing digital amplification-based detection
The workflow of EM-based pathogen enrichment interfacing digital amplifications is illustrated in Fig. 1C–G and S3.† The EM-PERFECT filter containing captured pathogens was folded into an RNase-free, non-stick, low-binding microfuge tube containing lysis solution (1× Lucigen QuickExtract™ DNA Extraction Solution). Lysis was accomplished through alternating heating and vortexing procedures: 65 °C for 6 minutes, vortexing for 1 minute, 95 °C for 5 minutes, and vortexing for 1 minute. Heating was accompanied by shaking at 1000 rpm on a dry bath/block heater. Vortexing was conducted at the highest speed of a vortex mixer (Vortex V-1 plus, bioSan, Latvia). Immediate cooling on ice was conducted after each heating and before vortexing to avoid nucleic acid degradation and annealing. The lysate, without nucleic acid extraction and purification, was introduced into the home-designed LAMP mastermix or commercially available PCR mastermix (Product no. RT017096A, Suzhou Sniper Medical Technologies Co., Ltd, China), forming the LAMP or PCR reaction mix. The details of the LAMP and PCR reaction mix are shown in Table 1. All primers and probes used in this work were purchased from Integrated DNA Technologies (IDT), with detailed sequences available in Table S4.† Subsequently, the digital LAMP (dLAMP) and dPCR reactions and detection procedures were conducted following standard protocols. The QIAcuity from QIAGEN (Germany) was used for dLAMP-based bacteria and fungi detection. The all-in-one digital PCR device (DQ24 Plus) from Sniper (China) was used for dPCR-based virus detection. The dLAMP experimental setting was an isothermal reaction at 60 °C for 60 minutes. The dPCR running parameters followed the standard protocol of Sniper dPCR mastermix. In both dLAMP and dPCR, each sample run two replicates and their average value was taken as the signal output.| Reagents | Final concentration |
|---|---|
| a Primer mix and probe can be either single-plex (one set) or multiplex (containing multiple sets) detection, with listed concentration applicable for one species. | |
| dLAMP for bacteria and fungi detection | |
| Isothermal amplification buffer (NEB, B0537S) | 1× |
| Taurine | 50 μM |
| Deoxynucleoside triphosphate, PCR grade (Roche, 03622614001) | 1.4 mM |
| Magnesium sulfate (MgSO4) solution (NEB, B1003S) | 6 mM |
| WarmStart RTx reverse transcriptase (NEB, M0380L) | 0.3 U μL−1 |
| RNase inhibitor, murine (NEB, M0314L) | 1 U μL−1 |
| Bst 2.0 WarmStart DNA polymerase (NEB, M0538M) | 1 U μL−1 |
| Reference dye (cyanine 680SE) | 250 nM |
| Primer mixa | 1.6 μM of FIP & BIP |
| 0.2 μM of F3 & B3 | |
| 0.4 μM of LoopF & LoopB | |
| Probea | 0.2 μM for bacteria |
| 0.275 μM for fungi | |
| Lysate | 0.2× |
| dPCR for virus detection | |
| PCR mastermix (sniper, RT017096A) | 1× |
| Primer mix | 0.25 μM of FP & RP |
| Probe | 0.5 μM |
| Lysate | 0.3× |
Investigation of EM-PERFECT filter's stability after storage
The stability of EM-PERFECT filters was investigated after storage at 4 °C. EM-PERFECT filters were prepared continuously over 7 days, while processing of the same batch of bacterial samples and dLAMP detection interface was performed on the 8th day to avoid large variances from bacteria interfering the judgement of filter's performance after storage. Multiplex spiking samples of S. aureus![[thin space (1/6-em)]](https://www.rsc.org/images/entities/char_2009.gif) :K. pneumoniae:P. aeruginosa at the level of 100:100:100 CFU mL−1 in 10 mL LB matrix were used.
:K. pneumoniae:P. aeruginosa at the level of 100:100:100 CFU mL−1 in 10 mL LB matrix were used.
Setting of control groups and biological replicates
Detection of pathogen samples involved side-by-side comparisons among the EM concentration, centrifugation for bacteria and fungi (10000 g@10 minutes with the Avanti J-15R, Beckman Coulter, US), and ultracentrifugation for virus (20000 rpm/63500 g@30 minutes at 4 °C with the Optima™ L-100 XP Ultracentrifuge, Beckman Coulter, US), and unconcentrated raw sampling approaches. The 10 mL LB-, BHIB- and FBS-related samples were repeated more than three times at each abundance level. Box chart analyses using Origin 2020b were conducted on the data collected from all repetitions, as illustrated in Fig. 3, 4A, 7C and D. Detailed information for each sample can be found in Tables S5–S7.† These box charts portray normalized signals correlated to normalized abundances, based on actual CFU counts and the categorization standard mentioned earlier. The detection of bottled water containing extremely low abundances of bacteria involved more than five repeats. Scatter plots displaying all data points are presented in Fig. 5, with comprehensive details available in Table S8.† For the 10 mL LB, BHIB and FBS single-plex spiked samples, the LOD was determined using the statistical variance assessed by Welch's t-test. When the signals of samples at a certain abundance are all higher than those from NC samples, the p-value below 0.05 signifies a significant distinction and substantiates the LOD. In the case of 100 mL and 500 mL bottled water samples, the limit of blank (LOB), calculated as Ave. + 1.645 × SD, was employed to differentiate between true positives and false negatives, and thereby calculating the detection rate.
Results and discussion
Preparation of EM-PERFECT filter and package for EM processing
The one-cycle sandwich layers of CaCl2, alginic acid sodium salt, and CaCl2 were sequentially applied to the surface of the PERFECT filter using a homemade holder and a spin coater (Fig. S1A–S1C†). The spin-coated alginic acid sodium salt and CaCl2 formed the Ca-alginate gel (positively charged layer), with a thickness of 0.29 ± 0.03 μm. The coated Ca-alginate gel layer resulted in a reduction in pore size (from 1.54 ± 0.03 μm to 1.25 ± 0.04 μm), as evidenced by the scanning electron microscope (SEM) images (Fig. 1H). The consistent alteration in pore size observed across the SEM images indicates the uniformity of the Ca-alginate gel coating process.The gravity-driven rapid EM processing, using a food dye as a color label for easy visualization and demonstration of the sample flow, is displayed in Fig. 1L. Fig. S1D–S1F† shows the packing of the EM-PERFECT filter, providing comprehensive views of the design and structure of the matching gadget purchased together with the PERFECT filter. The EM processing achieves a filtration throughput exceeding 10 mL min−1 (Fig. 1D), primarily attributed to the PERFECT filter's ultra-small thickness of approximately 5 μm (Fig. 1K) spanning a large area of 17 mm × 17 mm. Consequently, the transmembrane pressure of the filter, which decreases with the reduction of the liquid column height above the filter during filtration, is around 291 Pa at the beginning of filtration when using a 10 mL-PBS (aqueous) sample. Furthermore, after Ca-alginate gel coating, the filter's hydrophilicity slightly increased with the contact angle reducing from 76° to 68° (Fig. S2†), enhancing its filtration efficiency.
Capture of bacteria via EM processing
SEM characterization was conducted to check the capture of bacteria. Fig. 2A presents an SEM image displaying captured bacteria, specifically three ESKAPE pathogens: S. aureus (Gram-positive), K. pneumoniae (Gram-negative but with an outer-cell-wall capsule), and P. aeruginosa (Gram-negative), which demonstrates an unbiased capture of different species in EM processing.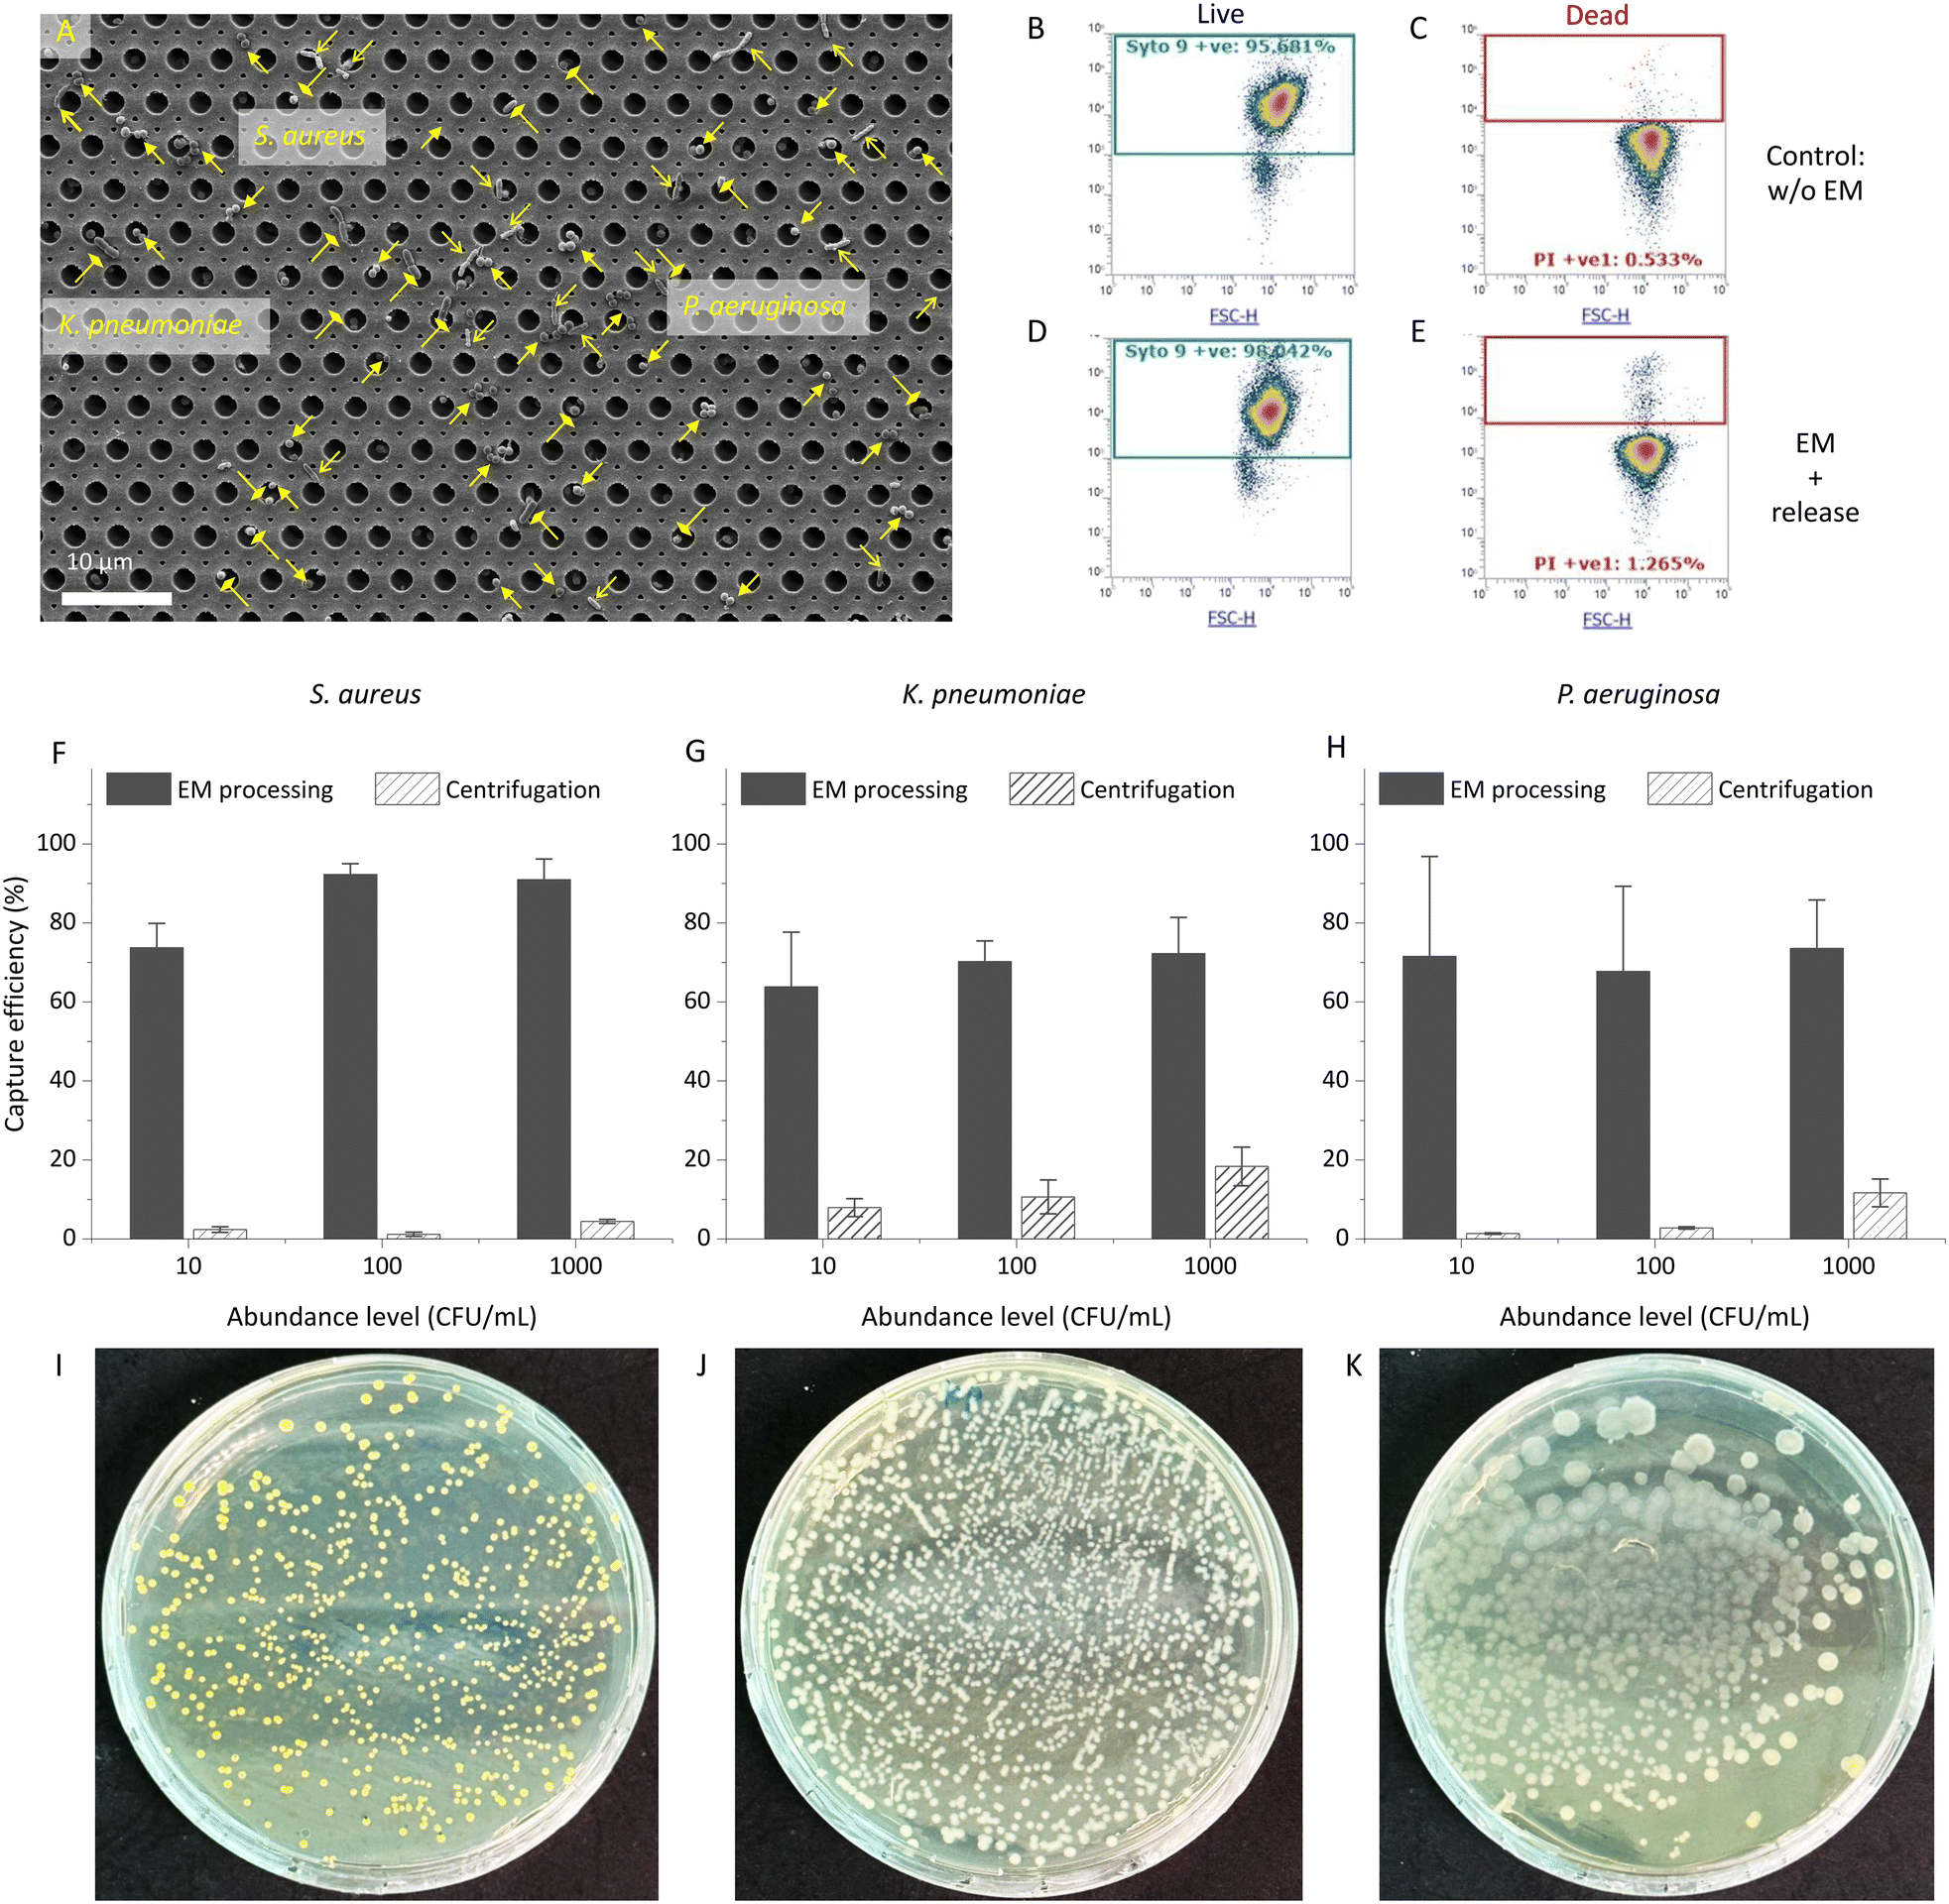 | ||
| Fig. 2 Captured bacteria on the EM-PERFECT filter and viability/cultivability of released bacteria. A) The SEM image of captured bacteria on the EM-PERFECT filter. B–E) the viability of bacteria (K. pneumoniae) via flow cytometry characterization: B) SYTO9 (live) and C) PI (dead) signals of the control group (no EM processing, no release), and D) SYTO9 and E) PI signals of released bacteria after EM processing. The capture/recovery efficiencies of bacteria from 10 mL LB via EM processing and centrifugation for F) S. aureus, G) K. pneumoniae and H) P. aeruginosa. LB-agar plates with cultured colonies of I) S. aureus, J) K. pneumoniae, and K) P. aeruginosa. | ||
Additionally, in-parallel conventional centrifugation for bacteria concentration was conducted to assess and compare capture efficiencies of bacteria-spiked samples by introducing known quantities of bacteria into lysogeny broth (LB). Considering practicability for obtaining valid CFU counts, the capture efficiencies for three species across different abundances ranging from level of 10 CFU mL−1 to 1000 CFU mL−1 in a 10 mL volume are shown in Fig. 2F–H. Table S2† details the capture efficiencies and CFU counts for each species at different abundance levels. The capture efficiencies achieved by EM processing for all three bacterial species show a significant increase compared to conventional centrifugation. Across abundances from 10 CFU mL−1 to 1000 CFU mL−1, EM processing yielded capture efficiencies of at least 74 ± 6.0%, 64 ± 14.0%, and 68 ± 22.0%, in contrast to a maximum of 4.4 ± 0.5%, 18 ± 5.0%, and 12 ± 4.0% from centrifugation, for S. aureus, K. pneumoniae, P. aeruginosa, respectively. Particularly noteworthy is the 10 CFU mL−1 abundance level, where the capture efficiencies present remarkable increase by 31×, 8×, and 52× compared to those from centrifugation, for S. aureus, K. pneumoniae, P. aeruginosa, respectively. This emphasizes the substantial enhancement in capture efficiency achieved through EM processing, particularly at lower bacterial concentrations, compared to conventional centrifugation methods.
Release of captured bacteria from the EM-PERFECT filter
The degradation and subsequent removal of Ca-alginate is critical in releasing captured bacteria from the EM-PERFECT filter, operating on the lift-off principle. The SEM image (Fig. 1J) demonstrates the effective control of Ca-alginate degradation, highlighting its controllability and facilitation of releasing captured bacteria. As shown in Fig. 1G, the captured bacteria were recovered from the EM-PERFECT filter through incubation with the optimized release solution. Subsequently, the viability of released bacteria was characterized through flow cytometry based on a live-dead kit staining, as shown in Fig. 2B–E. Furthermore, Fig. 2I–K shows the colonies of the three species obtained by plating the released solution onto agar plates followed by incubation at 37 °C. The viabilities of released bacterial cells characterized by flow cytometry are 90% ± 5.3%, 97% ± 1.7%, and 64% ± 9.9% for S. aureus, K. pneumoniae, P. aeruginosa, respectively. The grown colonies shown in Fig. 2I–K further demonstrate the released bacteria are viable and culturable. The high viability and cultivability are critical for subsequent functional downstream analyses, such as antimicrobial susceptibility testing.EM-based sample preparation interfacing with dLAMP techniques for bacteria detection
A rapid (≤3 h) workflow integrating EM-based bacteria enrichment with downstream digital loop-mediated isothermal amplification (dLAMP) detection is illustrated in Fig. 1F and S3.† Following EM processing, the flexible EM-PERFECT filter containing captured bacteria was folded into a microcentrifuge tube containing the lysis solution. Bacteria were lysed by alternating heating and vortexing procedures within 15 minutes. The resulting lysate (60 μL) was directly used in the subsequent dLAMP detection without the need for nucleic acids extraction and purification.Concurrently, comparative studies were done using a conventional centrifugation for bacteria concentration and a raw sampling approach (collecting 40 μL from initial raw samples) side-by-side to evaluate the detection sensitivities and LODs (experimental workflow shown in Fig. S3†). These assessments involved single-plex spiked samples by introducing certain abundances of bacteria into 10 mL LB (Fig. 3), 10 mL fetal bovine serum (FBS) (Fig. 4), or 100 and 500 mL commercially available bottled water (Fig. 5). Additionally, multiplex spiked samples were tested to evaluate the detection of different pathogens at both balanced and biased abundance ratios to confirm the unbiased capture of various species via EM processing (Fig. 6).
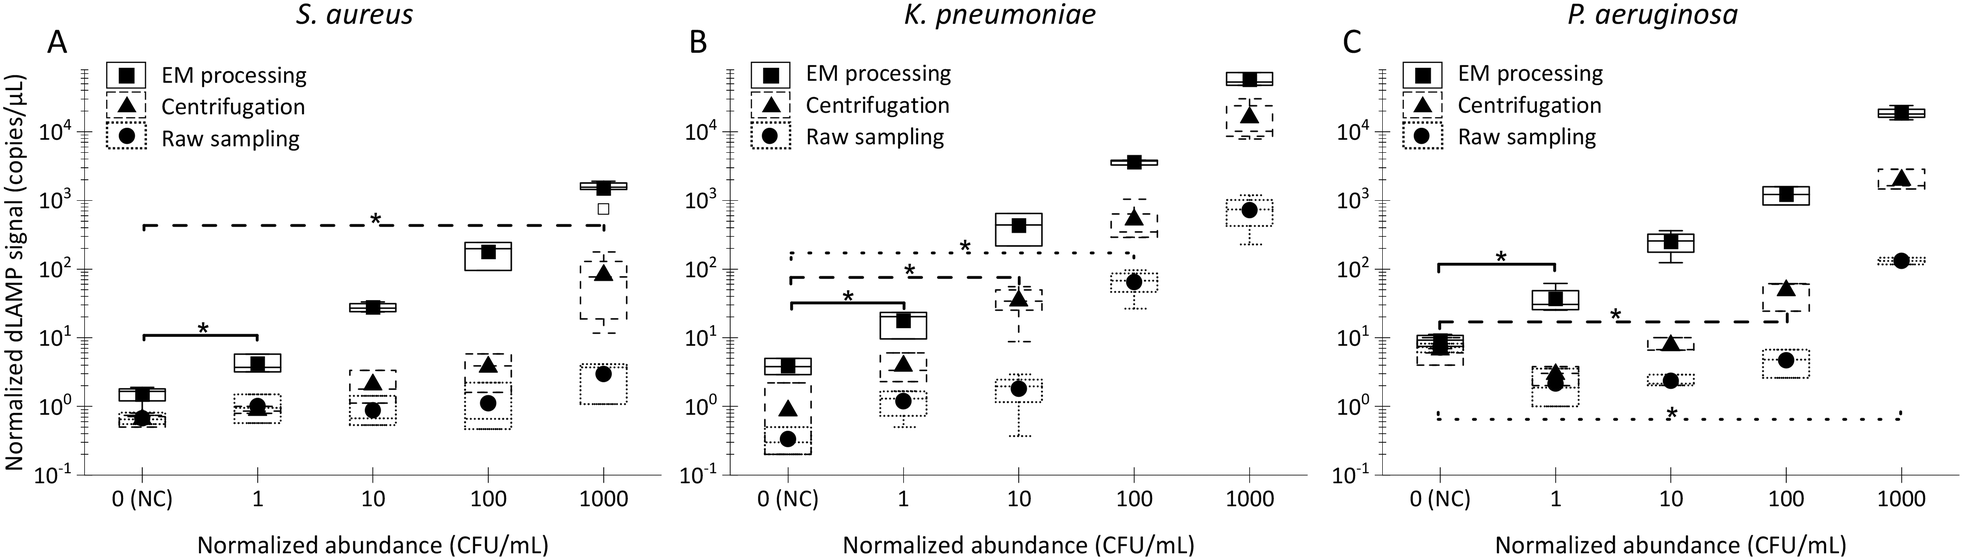 | ||
| Fig. 3 The dLAMP detection results of low-abundance bacteria in 10 mL LB via the EM concentration, centrifugation, and raw sampling approaches. The box charts of normalized dLAMP signals in correlation to the categorized/normalized abundances to determine the limit of detection (LOD) via the Welch's t-test (*: p-value < 0.05): A) S. aureus, B) K. pneumoniae, and C) P. aeruginosa. | ||
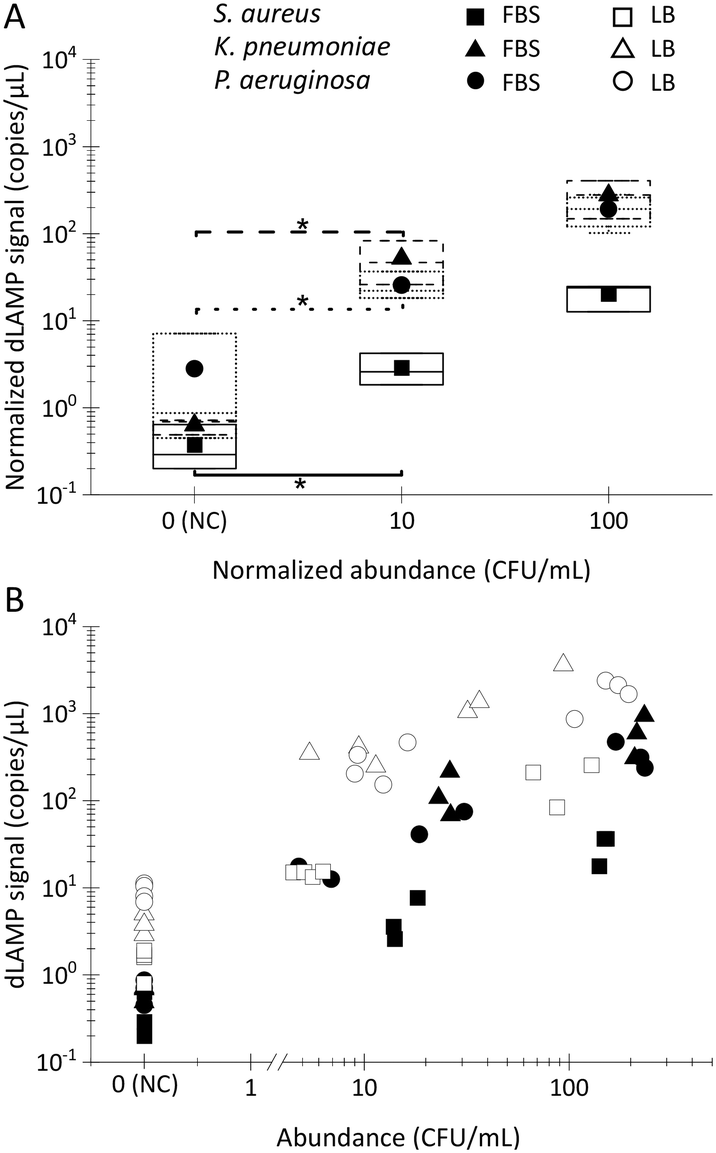 | ||
| Fig. 4 The dLAMP detection results of low-abundance bacteria in a complex background (FBS). A) Normalized dLAMP signals for normalized abundances of FBS samples, Welch’s t-test to evaluate the detection performance (*: p-value < 0.05). B) The scatter plot of dLAMP signal along with the experimentally counted abundances via plating-counting, for LB and FBS spiked samples. | ||
 | ||
| Fig. 5 The dLAMP detection results of extremely-low-abundance bacteria in an ultra-large volume (100 mL and 500 mL bottled water). A) S. aureus, B) K. pneumoniae, and C) P. aeruginosa. The red dashed lines mark the limit of blank (LOB) signals. The red circles mark the false negatives (dashed circle: 100 mL, solid circle: 500 mL). | ||
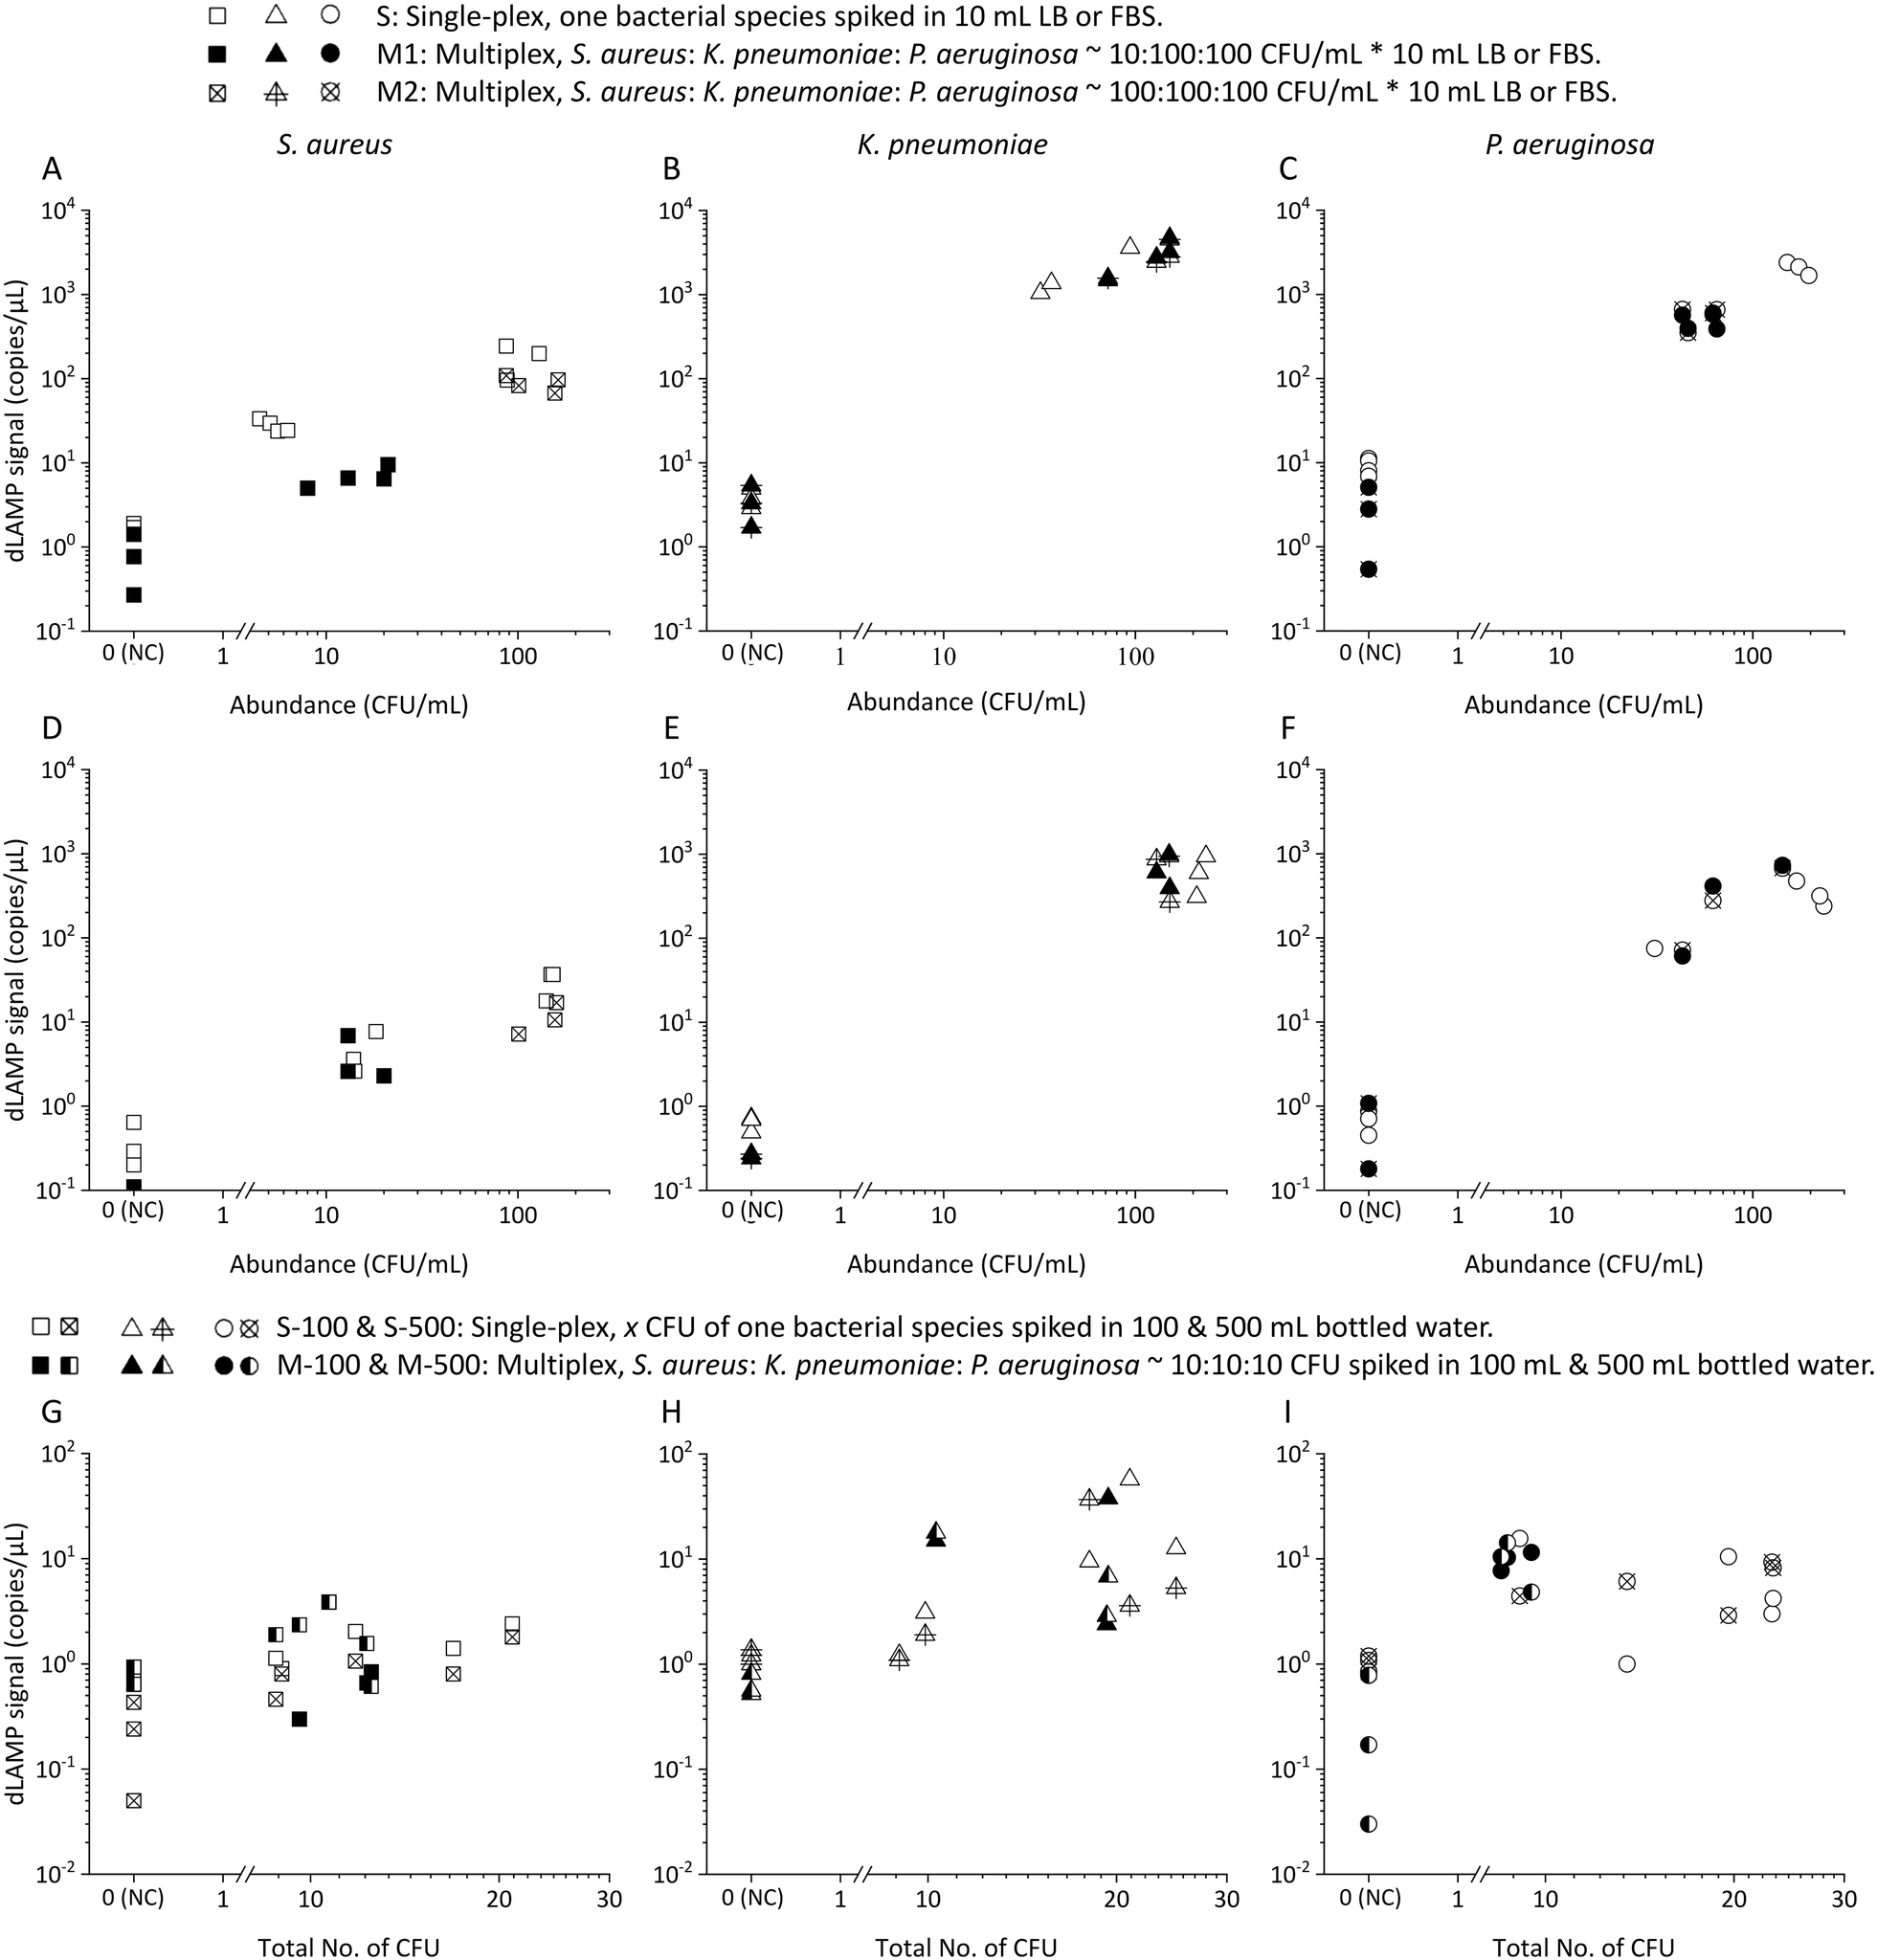 | ||
| Fig. 6 The dLAMP results from multiplex (S. aureus, K. pneumoniae, and P. aeruginosa) samples in various matrices: A–C) LB, D–F) FBS, and G–I) bottled water. | ||
Box charts of normalized dLAMP signals correlated with normalized abundances based on the earlier-mentioned categorization standard for the 10 mL LB samples are shown in Fig. 3. Table S5† shows raw data from dLAMP detection for the three bacteria across diverse abundances, and Fig. S3† presents scatter plots of dLAMP signals corresponding to CFU counts. When compared to the centrifugation-based sample preparation and unconcentrated raw sampling approach, the EM processing-enabled workflow shows significant enhancement of dLAMP signals. For instance, in the case of 100 CFU mL−1P. aeruginosa, signals increase by 25× and 200×, respectively. As a result, EM processing advances LODs by 1000× (from 1000 to 1 CFU mL−1), 100× (from 100 to 1 CFU mL−1) and 10× (from 10 to 1 CFU mL−1) for S. aureus, K. pneumoniae, and P. aeruginosa, respectively, compared to the centrifugation-based processing. Furthermore, an additional 10× improvement (i.e., 10000×, 1000×, and 100× lower LODs, respectively) is achieved compared to the raw sampling approach. The remarkable improvement in dLAMP signals is fundamentally attributed to a substantial concentration increase achieved through a high-fold enrichment (167×, from 10 mL to 60 μL) following the high-efficiency capture of low-abundance pathogens in EM processing. The concentration increment is evident in the raw images and scatter plots of positive versus negative signal points/partitions from dLAMP running (Fig. S5†).
Moreover, the dLAMP method employed in this study effectively amplified and detected both 16S DNA and 16S rRNA during a 1-hour incubation at 60 °C, covering both reverse transcription and LAMP reactions. Despite the inherent characteristics of RNA, including instability and variable copy numbers, leading to relatively large variances in dLAMP signals at identical abundance levels, the higher copies of 16S rRNA contribute to enhancing detection sensitivity.
Noteworthily, the dLAMP signals of S. aureus are lower than those of K. pneumoniae and P. aeruginosa, which could be due to more challenging lysis of the thick and rigid cell walls of gram-positive species. The LOD could be further improved by optimizing the lysis protocol for difficult-to-lyse pathogens.
To further explore the performance of EM processing for samples with complex backgrounds, FBS was selected as a representative matrix with high-concentration (∼10 mg mL−1) protein for spiking tests. The preparation of the FBS spiked samples followed the same protocol as described earlier for LB spiked samples described earlier. However, a notable challenge with FBS lies in the inhibitory effect of high-concentration protein on the dLAMP reactions. Consequently, two approaches were undertaken in this study to address the inhibitor issue.
First, Pluronic F-127, widely used for restricting non-specific adhesion,41 was added into alginic acid sodium salt to craft a Plu-Ca-alginate gel on the surface of the PERFECT filter. This incorporation reduced protein adhesion onto the surface of the EM-PERFECT filter, enabling subsequent amplification of the signal outputs in downstream dLAMP reactions.
Second, recognizing that protein absorption onto the filter surface is concentration-dependent, a dilution-based concentration lowering was implemented to minimize protein adhesion. FBS samples were 10× diluted with 1× phosphate-buffered saline (PBS) before undergoing EM processing.
The results of FBS spiked samples are presented in Fig. 4 with raw dLAMP data listed in Table S6.† The data reveals robust positive detection signals for FBS samples. Despite signals of FBS samples being lower compared to LB samples, they exhibit statistical distinction from negative control (NC) samples, at the 10 CFU mL−1 level. This underscores the successful application of EM processing, even in challenging complex matrices with high-concentration protein background.
When expanding to various applications, the positive charges on the EM-PERFECT filter may adhere to the negatively charged objects in real-world samples, potentially causing clogging. To mitigate this issue, implementing additional sample preparation methods to remove non-pathogen backgrounds prior to EM processing is worth investigating. For instance, spiral microfluidics can efficiently separate host cells from pathogens in bloodborne pathogen detection but struggles with enrichment due to high-factor dilution from the large-volume sheath buffer input.12 By leveraging EM-PERFECT filter's advantageous volume processability, it is possible to enrich low-abundance pathogens from large-volume spiral outputs. This combination could enhance pathogen enrichment efficacy while reducing clogging from non-pathogen backgrounds.
Detection of low-abundance pathogens in ultra-large volume samples is a challenge and potential application of this technology. To evaluate the efficacy of the EM-based sample preparation method for this application, 100 mL and 500 mL commercially available bottled drinking water samples were spiked with approximately 10 CFU. The EM-based sample preparation method allowed for an enrichment factor of >8000× (from 500 mL to 60 μL).
As depicted in Fig. 5 and Table S8,† detection rates surpass 80% (4 out 5 samples) for both 100 mL and 500 mL volumes across the three investigated bacteria, although a few signals fall below the threshold defined by the limit of blank (LOB) signals. This achievement is particularly noteworthy as it demonstrates an unprecedented level of sensitivity, allowing detection of as low as 0.02 CFU mL−1 (i.e., 10 CFU in 500 mL) from initial samples with volume extending up to 500 mL. The ability to robustly detect pathogens at such low abundance in ultra-large volumes has barely been reported. This accomplishment establishes a new paradigm for rapid and sensitive detection, particularly in scenarios where liter-level samples containing extremely low-abundance pathogens pose significant risks.
In many samples, multiple bacteria or pathogens are present concurrently. Therefore, the detection of multiplex spiked samples of LB (Fig. 6A–C), FBS (Fig. 6D–F) and bottled drinking water (Fig. 6G–I) matrices were evaluated. These samples contained different pathogens at both balanced/equal and biased/unequal abundance ratios, with detailed data available in Tables S9–S11.† In multiplex samples featuring balanced abundance ratios, such as S. aureus, K. pneumoniae and P. aeruginosa each at ∼100 CFU mL−1 in 10 mL LB or FBS, and ∼10 CFU in 100 or 500 mL bottled water, the signals observed were indistinguishable from those in single-plex samples for all three species. For multiplex samples with biased abundance ratios, where S. aureus, K. pneumoniae and P. aeruginosa were present at ∼10 CFU mL−1, 100 CFU mL−1, and 100 CFU mL−1, respectively, in 10 mL LB or FBS, although the signals of S. aureus were lower compared to those from single-plex samples, they remained statistically distinct from signals in multiplex NC samples. Despite the inherent lower signals of S. aureus compared to K. pneumoniae and P. aeruginosa in single-plex samples, the ability to detect S. aureus, even amidst 10× higher-abundance other bacteria cells, underscores the robustness of EM-processing-based sample preparation across various samples containing different pathogens. This robustness is attributed to the universal capture efficiency of different pathogens in the EM-processing, a characteristic previously verified.
Applicability of EM-based sample preparation for fungi and viruses
In addition to bacteria, fungi and viruses are challenging to detect in low abundance. The applicability of EM-based sample preparation for fungi and viruses was determined. Initial SEM characterization of captured fungi (C. albicans) and viruses (herpes simplex virus (HSV)) is presented in Fig. 7A and B. The SEM images show the EM technique's universal capability in capturing not only bacteria but also fungi and viruses. Similar to bacterial detection, dLAMP- and dPCR-based detection were used for C. albicans spiked in brain heart infusion broth (BHIB) and HSV particles in spent culture media, respectively. Fig. 7C and D show the detection results of low-abundance C. albicans (levels of 1 CFU mL−1 and 10 CFU mL−1 in 10 mL) and HSV (1 PFU mL−1 to 10000 PFU mL−1 in 10 mL) via dLAMP and dPCR, respectively. Tables S7 and S12† provide detailed data from dLAMP and dPCR detection for C. albicans and HSV across diverse abundance levels, respectively.
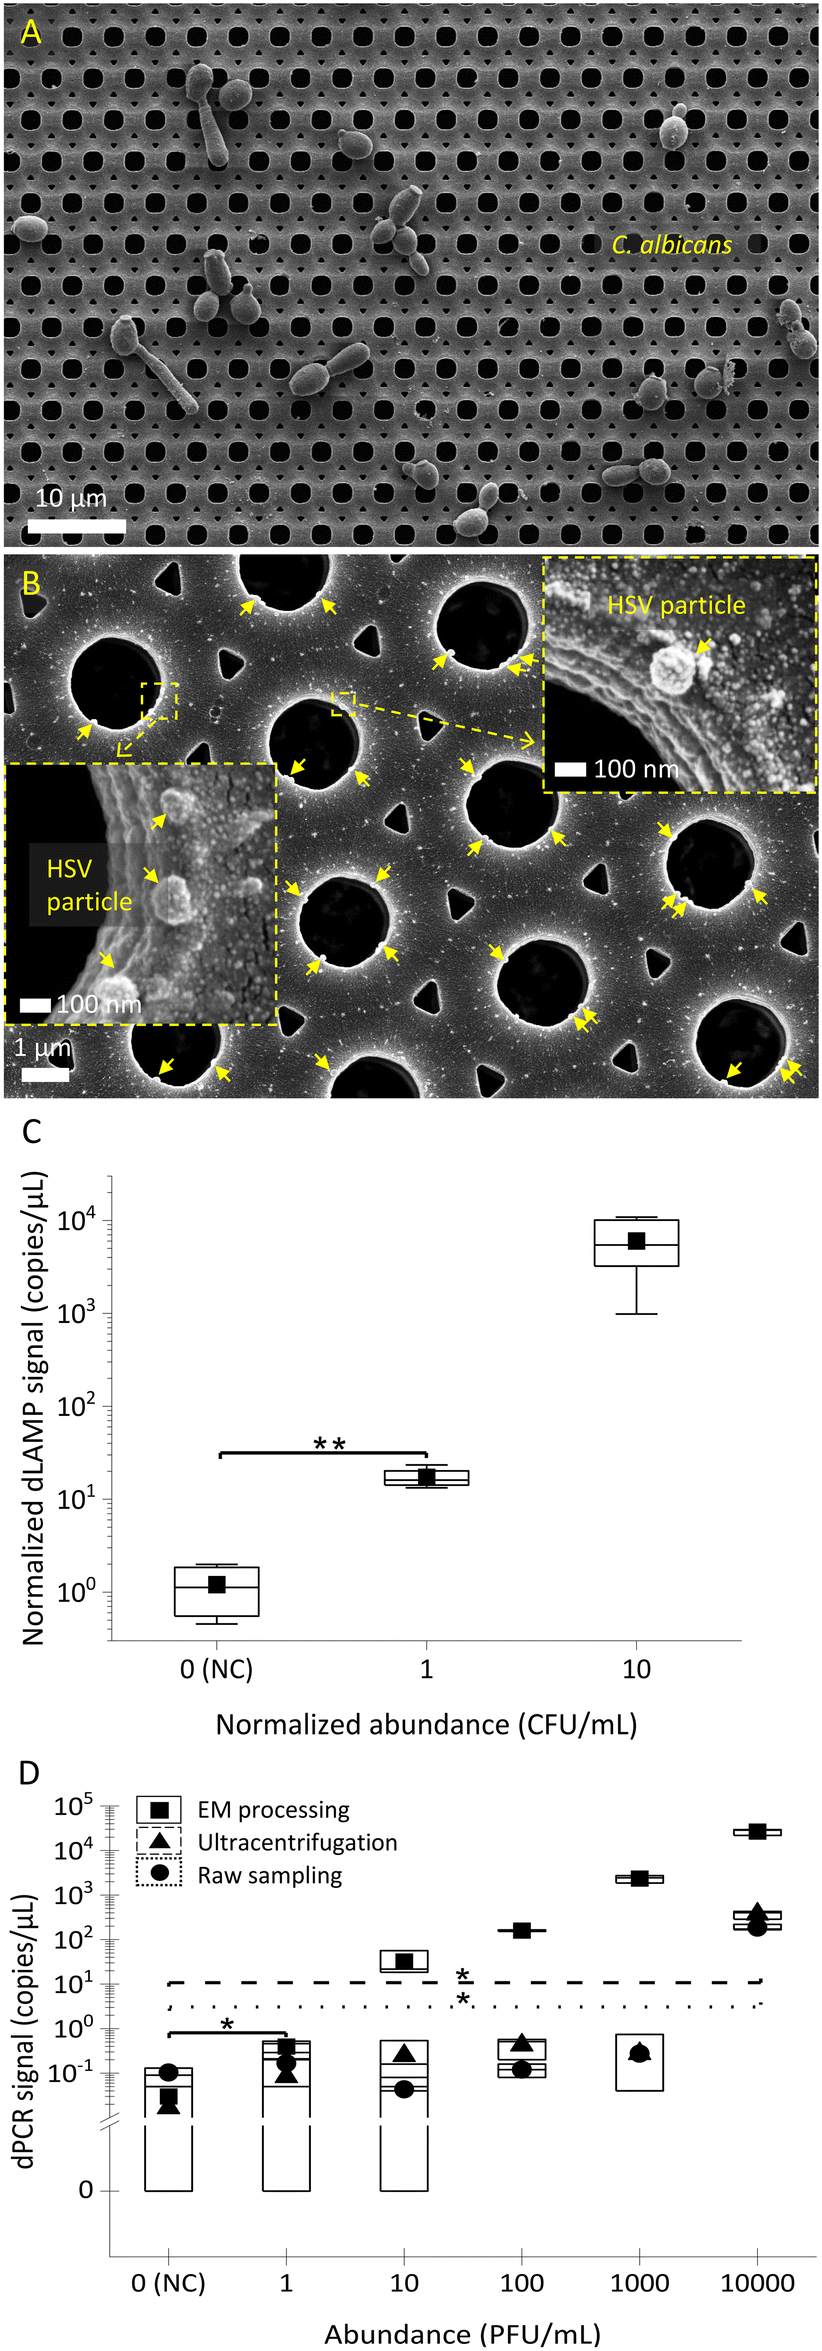 | ||
| Fig. 7 The universal applicability of EM processing in the sample preparation of fungi (C. albicans) and virus (herpes simplex virus, HSV). A) and B) the SEM images of captured C. albicans and HSV particles on the EM-PERFECT filter, respectively. The C) dLAMP and D) dPCR signals from the 10 mL samples of low-abundance C. albicans in BHIB medium and HSV particles in spent cell culture media, respectively. (* and **: p-value < 0.05 and <0.01, respectively, in the Welch’s t-test). | ||
The detection results in Fig. 7C and D demonstrate the capability of dLAMP and dPCR to detect low-abundance C. albicans and HSV, respectively. A LOD at 1 CFU mL−1 in 10 mL BHIB can be established for C. albicans. For viruses, the LOD for detection of viral spent media through EM-based sample preparation is significantly advanced by 10000×, reaching 1 PFU mL−1 in 10 mL spent media, compared to ultracentrifugation-based virus concentration or raw sampling approach. Furthermore, it is noteworthy that ultracentrifugation is time-intensive (processing time @∼45 minutes), costly, and reliant on large equipment, making it much less competitive for broad applications.
These findings highlight the advantages of the EM-PERFECT filter in terms of rapidity, sensitivity, portability, operational ease, and integrability, indicating its immense potential for diverse applications across various settings. However, the dual nature of EM processing, which offers broad applicability for diverse microorganisms but lacks selectivity, presents both opportunities and challenges, particularly for samples with a high total load of pathogens but a minority of target pathogens.
Potential solutions for specific applications could be designed from two aspects. First, specific detection can be achieved through the design of downstream detection methods, such as primer design in PCR/dPCR-based detection or targeted sequencing. Second, the EM method can be combined with further selective capture techniques, such as affinity-based methods. Given the high-fold preconcentration, the input sample for downstream selective capture will be of small volume and high concentration, thereby enhancing binding efficiency and reducing costs (less consumption of beads/antibodies) in subsequent selective capture process.
Stability of EM processing performance after long-term storage
The long-term stability of the EM-PERFECT filters is crucial for real-world applications. Their performance was experimentally tested after storage at 4 °C using dLAMP detection, with normalized signals shown in Fig. 8 and detailed raw dLAMP signals and bacterial abundances lised in Table S13.† The dLAMP signals from EM-PERFECT filters stored for different durations showed no significant variances, indicating that filters stored for 7 days have comparable performance in pathogen enrichment to the freshly prepared filters. This finding suggests that the EM-PERFECT filters have a viable shelf life for real-world applications, warranting further investigation for commercial translation.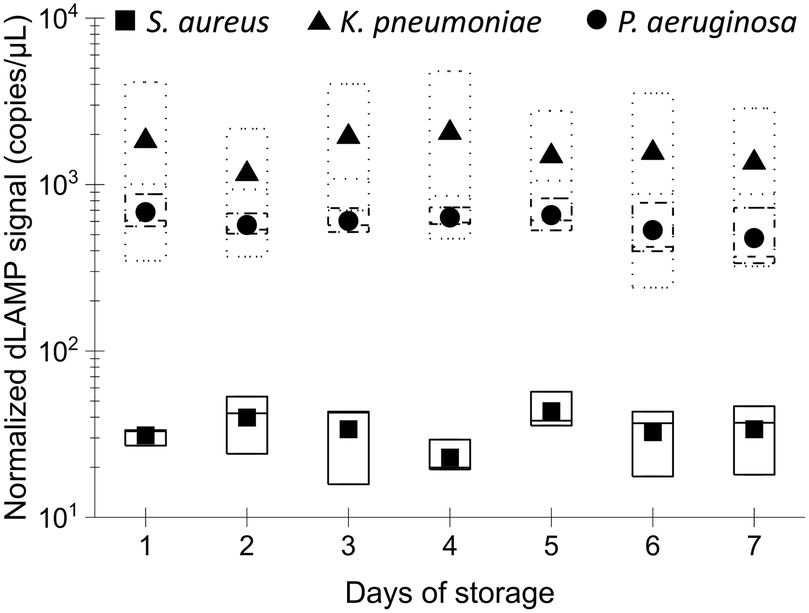 | ||
| Fig. 8 Investigation of EM processing performance after storage. LAMP results of multiplex samples (S. aureus:K. pneumoniae:P. aeruginosa ∼100:100:100 CFU mL−1 × 10 mL LB) with the EM-PERFECT filters after storage for different days. | ||
Conclusions
This work addresses a critical challenge in pathogen detection by developing an efficient EM-enabled sample preparation method. The inherent limitations from low pathogen abundance in large-volume samples have been effectively solved through EM processing, enabling the concentration of low-abundance pathogens into volumes suitable for downstream detection and analysis. This breakthrough not only enhances the sensitivity of detection but also significantly improves the performance of even the most sensitive techniques, such as digital PCR, which are otherwise constrained by low pathogen concentrations among vast background (e.g., debris, protein, inhibitors).The efficiency of the EM-enabled sample preparation is evident in its outstanding abilities: 1) capture of low-abundance pathogens: achieving efficiency of 63.85–73.73% and marking increase by 8–52× compared to conventional centrifugation methods, at the level of 10 CFU mL−1 for the three investigated bacterial species. 2) Release of high-viability pathogens: the controllable degradation of the positively charged layer facilitates the release of pathogenic cells with high viability (64.06% ± 9.94%–96.62% ± 1.65% for three species) and cultivability, enabling subsequent functional downstream analyses, such as antimicrobial susceptibility testing. 3) Processing ultra-large-volume samples with high-fold enrichment: handling samples of ≥500 mL at high throughput of ≥10 mL min−1 and demonstrating a remarkable enrichment factor >8000×. 4) Enhancing LODs: lowering the LODs of digital amplification detection methods by 10–10000× for broad pathogens, including bacteria, fungi, and viruses, compared to centrifugation/ultracentrifugation methods. This includes showcasing detection at levels of 1 CFU mL−1 for diverse bacteria and fungi, and 1 PFU mL−1 for viruses, with a samples volume of 10 mL. 5) Rapid sample-to-result workflow: EM processing to the output of the digital amplification detection signals was executed rapidly (≤3 h), ensuring a significantly shorter turnaround time compared to other culture-based techniques.
This study stands as an impressive demonstration of detection capability (>80% detection rate) for broad pathogens from sample volumes extending up to 500 mL, with abundance as low as 0.02 CFU mL−1 (i.e., 10 CFU in 500 mL). Furthermore, the versatility of EM processing is noteworthy, as it demonstrates the capability to sensitively detect various pathogens, including bacteria, fungi, and viruses. Beyond its technical merits, the operational ease, portability, and compatibility/integrability with various downstream detection techniques highlight the potential of EM-based sample preparation for wide applications across diverse settings. By addressing the most critical bottleneck in pathogen detection, this work sets the stage for a transformative impact on various areas and diverse settings, including water and food safety monitoring, environmental surveillance, epidemiology, and disease diagnosis.
Data availability
All data generated in this study are provided in the ESI† Materials. Data can also be provided by the corresponding author upon further request.Author contributions
Conceptualization: Y. Liu and J. Han; methodology: Y. Liu, J. Raymond, and X. Wu; validation: Y. Liu, J. Raymond, P. W. L. Chua, S. Y. H. Ling, C. C. Chan, C. Chan, J. X. Y. Loh, M. X. Y. Song and M. Y. Y. Ong; project administration: Y. Liu and P. Ho; supervision: J. Han, S. L. Sprins, and H. Yu; writing – original draft: Y. Liu, J. Raymond, P. W. L. Chua, S. Y. H. Ling, and C. C. Chan; writing – review and editing: J. Han, Y. Liu, M. E. Mcbee, X. Wu, and C. Chan.Conflicts of interest
Y. Liu, J. Raymond, and J. Han are the inventors of a patent about the electrostatic microfiltration (PCT/US2023/034274, filed in 10/2023). Y. Liu is one of the inventors of a Chinese Invention patent about the fabrication of the PERFECT filter (Issued, no.: 201710679586.2). All other authors declare they have no competing interests.Acknowledgements
This work was funded by the National Research Foundation of Singapore via SMART AMR and CAMP IRGs, and the Intra-CREATE Seed Collaboration Grant (NRF2022-ITS011-0010). The authors thank Prof. Wei Wang Group from Peking University (https://wwlab.net) for the support of the PERFECT microfilter. The authors thank Mr. Zizhen Wang, for his support and assistance in the investigation of EM-PERFECT filter stability after long-term storage. The authors also thank the Electron Microscopy Unit (https://medicine.nus.edu.sg/msc/electron-microscopy-unit/) in National University of Singapore and the team, particularly Ms. Kay En Low, for their support and assistance in the SEM work.References
- K. Xiao and L. Zhang, Lancet Microbe, 2023, 4, e297 CrossRef PubMed.
- T. Kumblathan, Y. Liu, G. K. Uppal, S. E. Hrudey and X. F. Li, ACS Environ. Au, 2021, 1, 18–31 CrossRef PubMed.
- J. V. Puthussery, D. P. Ghumra, K. R. McBrearty, B. M. Doherty, B. J. Sumlin, A. Sarabandi, A. G. Mandal, N. J. Shetty, W. D. Gardiner, J. P. Magrecki, D. L. Brody, T. J. Esparza, T. L. Bricker, A. C. M. Boon, C. M. Yuede, J. R. Cirrito and R. K. Chakrabarty, Nat. Commun., 2023, 14, 1332 CrossRef PubMed.
- C. F. Houlihan and J. A. Whitworth, Outbreak science: recent progress in the detection and response to outbreaks of infectious diseases, Clin. Med., 2019, 19, 140–144 CrossRef.
- S. M. Beno, M. J. Stasiewicz, A. D. Andrus, R. D. Ralyea, D. J. Kent, N. H. Martin, M. Wiedmann and K. J. Boor, J. Food Prot., 2016, 79, 2095–2106 CrossRef PubMed.
- O. O. Alegbeleye and A. S. Sant'Ana, Curr. Opin. Food Sci., 2020, 32, 83–89 CrossRef.
- M. P. Kabiraz, P. R. Majumdar, M. M. C. Mahmud, S. Bhowmik and A. Ali, Heliyon, 2023, 9, e15482 CrossRef PubMed.
- Y. L. Oon, Y. S. Oon, M. Ayaz, M. Deng, L. Li and K. Song, Front. Microbiol., 2023, 14, 1286923 CrossRef.
- D. C. Montgomery and G. C. Runger, Applied statistics and probability for engineers, 6th edn, Wiley, Hoboken, NJ, USA, 2014 Search PubMed.
- B. Brehm-Stecher, in High Throughput Screening for Food Safety Assessment: Biosensor Technologies, Hyperspectral Imaging and Practical Applications, Elsevier Inc., Amsterdam, Netherlands, 2015, pp. 11–22 Search PubMed.
- K. Danzer, Theoretical and metrological fundamentals, Springer, Berlin/Heidelberg, Germany, 2007 Search PubMed.
- W. G. Pitt, M. Alizadeh, G. A. Husseini, D. S. McClellan, C. M. Buchanan, C. G. Bledsoe, R. A. Robison, R. Blanco, B. L. Roeder, M. Melville and A. K. Hunter, Biotechnol. Prog., 2016, 32, 823–839 CrossRef CAS PubMed.
- M. Sonker, V. Sahore and A. T. Woolley, Anal. Chim. Acta, 2017, 986, 1–11 CrossRef CAS.
- T. Lehnert and M. A. M. Gijs, Lab Chip, 2024, 24, 1441–1493 RSC.
- S. Bin Lim, N. V. Menon and C. T. Lim, EMBO Rep., 2020, 21, e49749 CrossRef.
- L. Xia, J. Yang, R. Su, W. Zhou, Y. Zhang, Y. Zhong, S. Huang, Y. Chen and G. Li, Anal. Chem., 2020, 92, 34–48 CrossRef CAS PubMed.
- Z. Liu, Z. S. Carroll, S. C. Long, A. Roa-Espinosa and T. Runge, J. Environ. Manage., 2017, 191, 268–274 CrossRef CAS PubMed.
- J. Chen, M. Tomasek, E. Nuñez and V. Gau, MethodsX, 2021, 8, 101451 CrossRef CAS.
- C. Prata, A. Ribeiro, Â. Cunha, N. C. M. Gomes and A. Almeida, Environ. Monit. Assess., 2012, 14, 64–70 RSC.
- F. Schaumburg, C. S. Carrell and C. S. Henry, Anal. Chem., 2019, 91, 9623–9630 CrossRef CAS PubMed.
- G. P. Yakub and K. L. Stadterman-Knauer, Methods Mol. Biol., 2014, 268, 189–197 Search PubMed.
- G. A. R. Y. Suaifan, S. Alhogail and M. Zourob, Biosens. Bioelectron., 2017, 92, 702–708 CrossRef CAS PubMed.
- Z. Wang, R. Cai, Z. Gao, Y. Yuan and T. Yue, Compr. Rev. Food Sci. Food Saf., 2020, 19, 3802–3824 CrossRef CAS PubMed.
- K. Tsai, M. W. Nonnenmann, D. Rohlman and K. K. Baker, ACS Food Sci. Technol., 2023, 3, 831–837 CrossRef CAS.
- A. C. G. Foddai and I. R. Grant, Appl. Microbiol. Biotechnol., 2020, 104, 4281–4288 CrossRef CAS.
- R. Kaur, J. Wischmeyer, M. Morris and M. E. Pichichero, J. Med. Microbiol., 2017, 66, 1539–1544 CrossRef PubMed.
- P. Liu, V. R. Hill, D. Hahn, T. B. Johnson, Y. Pan, N. Jothikumar and C. L. Moe, J. Microbiol. Methods, 2012, 88, 155–161 CrossRef PubMed.
- Y. Zhang, C. q. Xu, T. Guo and L. Hong, Sci. Rep., 2018, 8, 17808 CrossRef PubMed.
- I. H. Cho, P. Bhandari, P. Patel and J. Irudayaraj, Biosens. Bioelectron., 2015, 64, 171–176 CrossRef PubMed.
- P. Liu, V. R. Hill, D. Hahn, T. B. Johnson, Y. Pan, N. Jothikumar and C. L. Moe, J. Microbiol. Methods, 2012, 88, 155–161 CrossRef PubMed.
- B. Mull and V. R. Hill, Appl. Environ. Microbiol., 2009, 75, 3593–3597 CrossRef CAS.
- K. S. Alam, M. Fatema-Tuj-Johora and G. M. A. Khan, J. Environ. Chem. Eng., 2021, 9, 106401 CrossRef CAS.
- S. Sengupta, J. Tan, B. D. Lee and L. Polo-Parada, BioTechniques, 2012, 53, 104–108 CrossRef.
- H. Fukushima, K. Katsube, Y. Hata, R. Kishi and S. Fujiwara, Appl. Environ. Microbiol., 2007, 73, 92–100 CrossRef CAS PubMed.
- M. R. Karim, E. R. Rhodes, N. Brinkman, L. Wymer and G. S. Fout, Appl. Environ. Microbiol., 2009, 75, 2393–2399 CrossRef CAS PubMed.
- W. W. F. Leung and Q. Sun, Sep. Purif. Technol., 2020, 250, 116886 CrossRef CAS PubMed.
- L. A. Ikner, M. Soto-Beltran and K. R. Bright, Appl. Environ. Microbiol., 2011, 77, 3500–3506 CrossRef PubMed.
- M. D. Sobsey and B. L. Jones, Appl. Environ. Microbiol., 1979, 37, 588–595 CrossRef PubMed.
- M. M. Sharma, Y. I. Chang and T. F. Yen, Colloids Surf., 1985, 16, 193–206 CrossRef.
- Y. Liu, T. Li, M. Xu, W. Zhang, Y. Xiong, L. Nie, Q. Wang, H. Li and W. Wang, Lab Chip, 2019, 19, 68–78 RSC.
- V. N. Luk, G. C. Mo and A. R. Wheeler, Langmuir, 2008, 24, 6382–6389 CrossRef CAS PubMed.
- K. W. K. Lee, S. Periasamy, M. Mukherjee, C. Xie, S. Kjelleberg and S. A. Rice, ISME J., 2014, 8, 894–907 CrossRef CAS PubMed.
Footnotes |
| † Electronic supplementary information (ESI) available. See DOI: https://doi.org/10.1039/d4lc00419a |
| ‡ These authors contributed equally to this work. |
| This journal is © The Royal Society of Chemistry 2024 |