 Open Access Article
Creative Commons Attribution 3.0 Unported Licence
Concentration–polarization electroosmosis for particle fractionation
Raúl
Fernández-Mateo
 a,
Pablo
García-Sánchez
 b,
Antonio
Ramos
 b and
Hywel
Morgan
*a
aSchool of Electronics and Computer Science, University of Southampton, Southampton SO17 1BJ, UK. E-mail: hm@ecs.soton.ac.uk
bDepto. Electrónica y Electromagnetismo, Facultad de Física, Universidad de Sevilla, Avda. Reina Mercedes s/n, 41012, Sevilla, Spain
First published on 3rd May 2024
Abstract
Concentration–polarization electroosmosis (CPEO) refers to steady-state electroosmotic flows around charged dielectric micro-particles induced by low-frequency AC electric fields. Recently, these flows were shown to cause repulsion of colloidal particles from the wall of a microfluidic channel when an electric field is applied along the length of the channel. In this work, we exploit this mechanism to demonstrate fractionation of micron-sized polystyrene particles and bacteria in a flow-focusing device. The results are in agreement with predictions of the CPEO theory. The ease of implementation of CPEO-based fractionation in microfluidics makes it an ideal candidate for combining with current techniques commonly used to generate particle lift, such as inertial or viscoelastic focusing, requiring no extra fabrication steps other than inserting two electrodes.
1 Introduction
Isolation of small particles such as bacteria from a complex sample mixture is a major challenge in microfluidics. For example, the early detection and diagnosis of blood-stream infection requires isolation of extremely low pathogen concentrations, sometimes below 100 cfu mL−1.1,2 To achieve this requires a high efficiency and specificity separation platform with minimal loss of samples. Several different microfluidic approaches have been published for isolation of bacteria from whole blood, including acoustophoresis,3,4 inertial focusing5 or dielectrophoresis (DEP).6 However, the size of bacteria is close to some components in blood, specifically platelets, and size-based separation mechanisms such as inertial microfluidics5 fail to resolve different populations. Similar issues occur for techniques that exploit differences in mechanical properties (acoustophoresis) or electrical properties (DEP).Combining different microscale forces has been shown to improve the resolution of particle fractionation. For example deterministic lateral displacement (DLD) is a size-based separation method, and combining this with DEP forces7,8 produces a ten-fold enhancement in the size resolution.9
In this work, we describe a proof-of-concept device that exploits hydrodynamic particle–wall interactions to fractionate a mixture of polystyrene microparticles based on size and surface charge.10 The technique is also used to demonstrate isolation of a bacterial population from polystyrene particles. The separation principle is based on concentration–polarization electroosmosis (CPEO) flows around the particles when subjected to low-frequency (≲104 Hz) AC electric fields in low conductivity electrolytes (≲0.1 S m−1).11,12 The flow-focusing device is outlined in Fig. 1 and uses a sheath flow to push the sample close to the channel walls. As the particles flow along the channel, they migrate towards the centre with a rate that depends upon their size and surface charge, so that they are fractionated at the end of the channel.
Flow-focusing channels have previously been used for various fractionation techniques that rely on particle–wall repulsion, including inertial focusing,13 viscoelastic lift,14,15 pinched-flow fractionation,16,17 or combinations of phenomena.18–20 CPEO flow induced separation is a new dimension that can be exploited for tunable wall repulsion by controlling the external AC electric field requiring no extra complexity in device fabrication.
2 Methods
2.1 Device design and preparation
Devices were fabricated using standard soft-lithography of SU8 on a silicon wafer substrate. PDMS (10% (w/w) mixture with curing agent) was cast, cured at 60 °C and oxygen plasma-bonded to a glass slide to produce the final devices.In the device, co-flow channels from two different inlets intersect at a cross junction, and all three channels have the same 50 μm × 50 μm square cross-section. The sample mixture enters in one inlet, with a second sample-free electrolyte entering from a second inlet (see Fig. 1). The outlet channel has the same cross-section (50 μm × 50 μm) and is 5 mm long. This channel expands at the exit to enhance the separation.
2.2 Bacteria culture
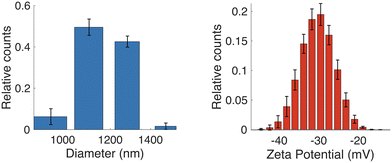
S. aureus 9144 were incubated overnight on an agar plate. Cells were harvested and then washed and resuspended 5 times into the desired conductivity media. The experiments were performed using 1.7 mS m−1 KCl together with 280 mM D-mannitol, a non-metabolising sugar, to compensate the osmotic pressure.S. aureus bacteria are spherical bacteria, and their size was estimated using Dynamic Light Scattering (DLS) (Malvern Zetasizer Nano) with the same electrolyte molarity as the fractionation experiments. The results (Fig. 2(a)), show a median diameter of 1.09 ± 0.12 μm. Zeta-potential was also measured (Fig. 2(b)): −31.1 ± 4.0 mV, similar to literature values.21–23
2.3 Sample preparation
The separation capabilities of the device were tested using mixtures of 500 nm, 1 μm, 2 μm and 3 μm diameter carboxylate microbeads, each with different fluorescence emission wavelengths. Particle zeta potential ζ was obtained from previous measurements:12 −63 mV, −71 mV, −74 mV and −78 mV, respectively. Plain uncharged 3 μm beads (ζ = −15 mV) were also used to demonstrate fractionation based on surface charge.For each experiment, two samples with an approximate concentration of 106 particles per mL were prepared. The medium was a KCl electrolyte with a conductivity of 1.7 mS m−1. 3 μm carboxylate particles (106 particles per mL) were also mixed with bacteria. In all cases, the sheath fluid was the same as the sample fluid but depleted of particles.
2.4 Device operation
Samples were pumped through the channels at a constant flow rate using two independent syringe pumps in order to modulate the sample pinch into the channel walls after the junction. An electric field was applied by inserting two metallic cylinders into the two closest inlet reservoirs of the device (Fig. 1), and the remaining inlets were left floating. The metallic needles were connected to an amplifier and an AC voltage of variable frequency was applied (to give a field of 100 kV m−1 between 50 Hz and 2 kHz). The flow rate, channel length, voltage and frequency were optimised for best fractionation based on experimental observations and the CPEO particle–wall repulsion theory.12 This optimisation is described in the Appendix. The optimal flow rate was 2.5 μL per hour for the sample and 5 μL per hour for the sheath.2.5 Particle detection and analysis
To evaluate the fractionation efficiency of the device, the particle distribution was measured at the end of the channel using Particle Finder software.24 When the sample contained particles of different sizes and surface charges, each population moved to a different position away from the wall, leading to fractionation. By applying different detection filters, Particle Finder can discern between different particle populations in the channel.3 Results and analysis
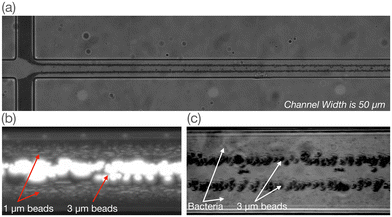
Fig. 3 shows images made from stacks of frames recorded during a 30 second window at a frame-rate of 16 fps. The particle concentration shown in these images does not resemble the actual concentration in the media. Part (a) of the figure shows 3 μm plain particles entering the main channel after the junction with an electric field of around 100 kV m−1 at a frequency of 50 Hz. The particle stream is initially pushed against the channel walls due to the sheath flow. Because the hydrodynamic particle–wall interaction is most intense when the particles are closest to the wall and decay with the square of the separation distance (eqn (4)), an immediate repulsion from the wall is observed as the particles pass the corner. They continue to be repelled from the walls but at a decreasing rate that depends on size and surface charge. Examples in Fig. 3(b) and (c) show different particle populations at various positions in the main channel. Fig. 3(b) shows a mixture of 1 μm particles and 3 μm particles, while part (c) shows 3 μm carboxylate particles and S. aureus. These images are stacks of approximately 1000 frames taken from a video recording.The frames were individually analysed using Particle Finder software to obtain the relative particle concentration across the channel section. Fig. 4 shows the concentration profile at the end of the channel for all experimentally measured conditions, including for pairs of polystyrene beads with different size and surface charge, and a mixture of 3 μm carboxylate particles and bacteria. The relative concentration of particles i at position z is defined as ρi(z) = (1/Ni)ΔNi/Δz, where ΔNi is the number of particles within the range |z, z + Δz| and Ni is the total number of particles i.
The experimental design creates a symmetrical distribution of concentration around the central plane of the channel. Therefore the concentration profiles shown in Fig. 4 are the average concentration from both sides of this symmetry plane and the wall separation is plotted from one of the walls to the symmetry plane, i.e. 25 μm.
Fig. 4(a–d) shows the profiles for different mixtures of particle sizes but approximately equal surface charge. Fig. 4(e) is the concentration at the end of the channel for particles of 3 μm diameter, but different zeta potential. Experimental data for the separation of bacteria from beads is shown in Fig. 4(f). In this case, optimal fractionation was experimentally found when the sample was subjected to an electric field of an amplitude of 100 kV m−1 and a frequency of 1.7 kHz. These concentration profiles suggest that choosing an adequate channel split could lead to an optimal separation efficiency. For example, nearly 70% of the bacteria could be recovered whilst excluding nearly 100% of the polystyrene particles (Fig. 4(f)). The method has a strong dependence on particle size. For the mixture of 1 μm and 2 μm particles high purity populations would be more difficult to achieve (Fig. 4(b)), whereas 99% of 1 μm particles could be separated from the mixture with 3 μm particles (Fig. 4(c)).
4 Discussion
4.1 Origin of the CPEO flows
CPEO is a time-averaged electroosmotic flow arising from surface conductance on a dielectric immersed in low-conductivity electrolytes, in the presence of a low-frequency AC electric field. For a spherical particle, these flows are described by the velocity field in eqn (1), with streamlines plotted in Fig. 5: | (1) |
We refer to this flow field as the Gamayunov field;25 these authors first described the flow pattern around a particle arising from an electroosmotic slip velocity of the form ∼ sin![[thin space (1/6-em)]](https://www.rsc.org/images/entities/char_2009.gif) 2θ. In the above equation, r is the distance to the particle centre (expressed in units of particle radius a) and θ is the angle with respect to the direction of the electric field.
2θ. In the above equation, r is the distance to the particle centre (expressed in units of particle radius a) and θ is the angle with respect to the direction of the electric field. ![[scr V, script letter V]](https://www.rsc.org/images/entities/char_e149.gif) is maximum slip velocity at the particle surface,
is maximum slip velocity at the particle surface,
 | (2) |
 | ||
| Fig. 5 Fluid velocity field streamlines due to CPEO around a spherical particle. The streamlines are axially symmetric with respect to the direction of the electric field. | ||
The function v0 is plotted in Fig. 6 for the polystyrene particles and experimental conditions used in this work. The curves show how the velocity decays for frequencies beyond the reciprocal of the diffusion time,
 | (3) |
4.2 Hydrodynamic particle–wall interaction
The CPEO flows become distorted in the vicinity of a domain boundary, such as the walls of a microfluidic channel as shown in Fig. 7. The distortion causes a hydrodynamic force leading to a particle–wall interaction. Depending on the relative direction of the applied electric field with respect to the channel wall, the interaction could be either attractive, repulsive or with tangential components to the wall.26,27 For the system used in this work, the electric field is parallel to the channel wall, meaning that the interaction is repulsive (Fig. 7). The repulsion velocity can be described in the limit of large separation a/z ≪ 1 by eqn (4) | (4) |
This expression was obtained by Yariv28 in the context of induced-charge electroosmosis (ICEO).
 | ||
| Fig. 7 Diagram showing the wall separation mechanism driven by the CPEO flows around particles when the electric field is applied parallel to the wall. | ||
In a previous publication10 we showed that the CPEO repulsion mechanism dominates for low conductivity electrolytes (up to ∼15 mS m−1) and low electric field frequencies (up to ∼10 kHz). Other repulsion mechanisms such as DEP29,30 only account for the observed repulsion at higher frequencies and conductivities. Furthermore, for DEP the interaction decays with the fourth power of the separation distance, uDEP ∼ 1/z4, meaning that the CPEO hydrodynamic interaction is effective at much longer length scales than DEP. ICEO on metal surfaces produces similar flow patterns.31 However, ICEO flows on dielectrics are negligibly small compared to CPEO even for small Dukhin number,32 and thus ICEO cannot be responsible for the observed wall interaction. Therefore, CPEO must be the dominant mechanism. This means that the particle fractionation depends on electric field and particle properties such as size and surface charge as described by eqn (2) and (4), summarised in Fig. 6.
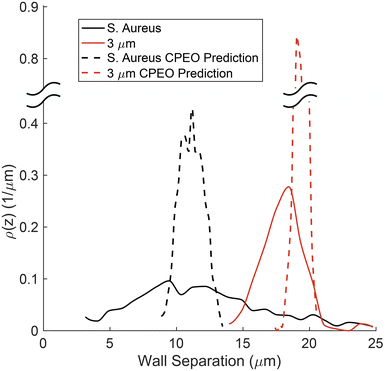
CPEO theory can be used to predict the concentration distribution at the end of the channel for the bacterial cells. The trajectories of N = 103 particles were calculated using the size and zeta potential distribution corresponding to those shown in Fig. 2. The surface conductance of the particles was set to Ks = 1 nS (ref. 33) with a 20% dispersion. The initial separation from the wall was set according to the experimental sample stream widths immediately after the channel junction. The numerical results are shown in Fig. 8 demonstrating that the maximum in the distribution can indeed be predicted by CPEO. However, the theory shows a narrower distribution than measured experimentally. This could be attributed to cell–cell adhesion/interaction or particle–particle interaction, given the high concentration used for bacteria in the experiments. Future work will focus on understanding the origin of this discrepancy.
 | ||
| Fig. 8 Comparison between the distribution of bacteria (black lines) and 3 μm polystyrene particle (red lines) at the end of the channel. Experimental data are shown as solid lines, and CPEO predictions in dashed curves. CPEO concentration profile was obtained by simulating 103 particles with a size and zeta-potential distribution according to Fig. 2, with Ks = 1 nS and an initial distribution based on experimental observations. | ||
The figure also shows the separation predicted by CPEO for the 3 μm carboxylate particles, including the experimentally measured distribution in zeta potential. The surface conductance was set with an uncertainty of 20%, similar to bacteria, with the size dispersion as quoted by the manufacturer (CV = 5%). The predicted separation is greater than experimentally determined, in agreement with previous studies where electric field magnitudes above approximately 60 kV m−1 resulted in deviations from the E02 scaling.12
5 Conclusions
This work demonstrates that CPEO-driven hydrodynamic particle–wall interaction can be used to fractionate mixtures of different particles based on size and/or surface charge. Five different populations of polystyrene particles were used, with sizes ranging from 500 nm to 3 μm in diameter, and surface charge (zeta-potentials from −15 mV to −78 mV). This separation technique can also be used to separate bacteria from 3 μm polystyrene beads, in reasonable agreement with CPEO predictions. In light of these results, it would be interesting to analyze the influence of CPEO particle–wall interaction in previously published experiments that show charge-based separation in microfluidic devices with electric fields.34,35 For example, it has been recently found that CPEO wall–particle repulsion is the main mechanism behind particle fractionation in DLD devices actuated by low-frequency electric fields.36Future investigation will focus on detailed experimental characterisation of bacterial electrical properties in order to characterise the CPEO flows on their surface and potential dependence on bacterial strain, shape and concentration. This will enable the design of further optimised systems for CPEO based fractionation.
Conflicts of interest
There are no conflicts to declare.A Analysis of channel design
The optimal channel dimensions was chosen to maximise the CPEO-driven fractionation based on current designs (see for example ref. 14 and 15). Channel width W and height were based on previous publications, i.e. a square cross-section of 50 μm. The channel length L was determined based on CPEO theory, relating the final particle–wall separation h to particle properties, electric field and flow rate Q, as discussed elsewhere:12 | (5) |
![[thin space (1/6-em)]](https://www.rsc.org/images/entities/char_2009.gif) log|1 − 2ξ|)/1536.
log|1 − 2ξ|)/1536.
In this equation, the electrical parameters and the particle properties are enclosed in the slip velocity, eqn (2). Also the maximum pressure driven flow velocity Vmax and flow rate Q are related through the Poiseuille flow by Q = 2WVmax/3. This means that for particles with a given set of properties (size, zeta potential and surface conductance) and a channel with given dimensions (width and length), then in order to maintain the same particle–wall separation at the end of the channel with increasing flow rate, the electric field magnitude must increase as  .
.
Clearly the electric field cannot be increased indefinitely with flow rate. Previous work12 showed that for electric fields above ∼100 kV m−1 the CPEO flows become severely disrupted and the experimental repulsion falls below the theoretical predictions, so that separation becomes inefficient. This means that to increase the flow rate while achieving the same wall separation at the end of the channel for a fixed electric field the channel length increases as L ∼ Q.
In other words longer channels balance the time of flight of particles flowing at a higher flow rate, τ ∼ L/Vmax. The electrical design also restricts the maximum length of the channel. The AC voltage is applied to the electrodes positioned at two opposite inlets (see Fig. 1), so that field scales as E0 ∼ ϕ0/L, with ϕ0 the applied voltage. The maximum voltage is approximately 900 Volts which sets an upper limit to the channel length for a given electric field.
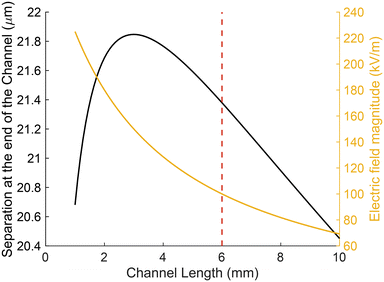
In summary, the channel length should be long enough to allow sufficient flight time of the particles, but limited by the maximum electric field. Fig. 9 shows the separation of a fixed particle population (3 μm carboxylate particles), at an applied voltage of 900 V and flow rate Q = 7.5 μL h−1. As different flow rates will only displace the plot vertically, the figure shows that the optimal channel length should be close to L = 3 mm with electric field below 100 kV m−1. If the field is increased to the upper limits of the linear CPEO, the optimal channel length is around L = 6 mm. Further optimisation of the channel design and electrode should allow higher throughput and separation capabilities.
 | ||
| Fig. 9 Separation at the end of the channel h as a function of the channel length L as given by eqn (5). Slip velocities are computed for a 3 μm carboxylate particle, f = 50 Hz, Q = 7.5 μL h−1, and a KCl electrolyte with a conductivity of 1.7 mS m−1. The red vertical line marks the channel length for which the electric field in the channel is 100 kV m−1. | ||
Acknowledgements
We acknowledge Xiang Wang from University of Southampton and Prof. Mark Sutton from UKHSA for providing the bacteria culture. A. R. and P. G. S. acknowledge financial support by MCIN/AEI/10.13039/501100011033/FEDER, UE (Grant number PID2022-138890NB-I00).Notes and references
- N. Leggieri, A. Rida, P. Francois and J. Schrenzel, Curr. Opin. Infect. Dis., 2010, 23, 311–319 CrossRef CAS PubMed.
- S. Narayana Iyengar, T. Kumar, G. Mårtensson and A. Russom, Electrophoresis, 2021, 42, 2538–2551 CrossRef CAS PubMed.
- P. Ohlsson, K. Petersson, P. Augustsson and T. Laurell, Sci. Rep., 2018, 8, 1–11 CAS.
- J. Rufo, F. Cai, J. Friend, M. Wiklund and T. J. Huang, Nat. Rev. Methods Primers, 2022, 2, 1–21 CrossRef.
- H. W. Hou, R. P. Bhattacharyya, D. T. Hung and J. Han, Lab Chip, 2015, 15, 2297–2307 RSC.
- S. Park, Y. Zhang, T.-H. Wang and S. Yang, Lab Chip, 2011, 11, 2893–2900 RSC.
- J. P. Beech, P. Jönsson and J. O. Tegenfeldt, Lab Chip, 2009, 9, 2698–2706 RSC.
- V. Calero, P. Garcia-Sanchez, C. Honrado, A. Ramos and H. Morgan, Lab Chip, 2019, 19, 1386–1396 RSC.
- R. J. Gillams, V. Calero, R. Fernandez-Mateo and H. Morgan, Lab Chip, 2022, 22, 3869–3876 RSC.
- R. Fernandez-Mateo, V. Calero, H. Morgan, P. Garcia-Sanchez and A. Ramos, Phys. Rev. Lett., 2022, 128, 074501 CrossRef CAS PubMed.
- R. Fernández-Mateo, P. García-Sánchez, V. Calero, H. Morgan and A. Ramos, J. Fluid Mech., 2021, 924, R2 CrossRef.
- R. Fernández-Mateo, H. Morgan, A. Ramos and P. García-Sánchez, Phys. Fluids, 2023, 35, 012019 CrossRef.
- J. M. Martel and M. Toner, Annu. Rev. Biomed. Eng., 2014, 16, 371 CrossRef CAS PubMed.
- C. Liu, J. Guo, F. Tian, N. Yang, F. Yan, Y. Ding, J. Wei, G. Hu, G. Nie and J. Sun, ACS Nano, 2017, 11, 6968–6976 CrossRef CAS PubMed.
- F. Tian, W. Zhang, L. Cai, S. Li, G. Hu, Y. Cong, C. Liu, T. Li and J. Sun, Lab Chip, 2017, 17, 3078–3085 RSC.
- M. Yamada, M. Nakashima and M. Seki, Anal. Chem., 2004, 76, 5465–5471 CrossRef CAS PubMed.
- M. Pødenphant, N. Ashley, K. Koprowska, K. U. Mir, M. Zalkovskij, B. Bilenberg, W. Bodmer, A. Kristensen and R. Marie, Lab Chip, 2015, 15, 4598–4606 RSC.
- X. Lu and X. Xuan, Anal. Chem., 2015, 87, 6389–6396 CrossRef CAS PubMed.
- X. Lu and X. Xuan, Anal. Chem., 2015, 87, 4560–4565 CrossRef CAS PubMed.
- M. K. Raihan, M. Baghdady, H. Dort, J. Bentor and X. Xuan, Anal. Chem., 2023, 95, 16013–16020 CrossRef CAS PubMed.
- E. Kłodzińska, M. Szumski, K. Hrynkiewicz, E. Dziubakiewicz, M. Jackowski and B. Buszewski, Electrophoresis, 2009, 30, 3086–3091 CrossRef PubMed.
- E. Kłodzińska, M. Szumski, E. Dziubakiewicz, K. Hrynkiewicz, E. Skwarek, W. Janusz and B. Buszewski, Electrophoresis, 2010, 31, 1590–1596 CrossRef PubMed.
- S. Halder, K. K. Yadav, R. Sarkar, S. Mukherjee, P. Saha, S. Haldar, S. Karmakar and T. Sen, Springerplus, 2015, 4, 1–14 CrossRef CAS PubMed.
- R. Fernández-Mateo, V. Calero, P. García-Sánchez, A. Ramos and H. Morgan, Microfluid. Nanofluid., 2023, 27, 19 CrossRef.
- N. Gamayunov, V. Murtsovkin and A. Dukhin, Colloid J., 1986, 48, 197–203 Search PubMed.
- J. R. Smart and D. T. Leighton Jr, Phys. Fluids A, 1991, 3, 21–28 CrossRef CAS.
- J. Blake and A. Chwang, J. Eng. Math., 1974, 8, 23–29 CrossRef.
- E. Yariv, Proc. R. Soc. A, 2009, 465, 709–723 CrossRef CAS.
- E. Yariv, Phys. Fluids, 2006, 18, 031702 CrossRef.
- E. Yariv, Soft Matter, 2016, 12, 6277 RSC.
- M. Z. Bazant and T. M. Squires, Phys. Rev. Lett., 2004, 92, 066101 CrossRef PubMed.
- V. Calero, R. Fernández-Mateo, H. Morgan, P. García-Sánchez and A. Ramos, Phys. Rev. Appl., 2021, 15, 014047 CrossRef CAS.
- A. van der Wal, M. Minor, W. Norde, A. J. Zehnder and J. Lyklema, J. Colloid Interface Sci., 1997, 186, 71–79 CrossRef CAS PubMed.
- C. Thomas, X. Lu, A. Todd, Y. Raval, T.-R. Tzeng, Y. Song, J. Wang, D. Li and X. Xuan, Electrophoresis, 2017, 18, 320–326 CrossRef PubMed.
- B. D. Ho, J. P. Beech and J. O. Tegenfeldt, Micromachines, 2020, 11, 1014 CrossRef PubMed.
- V. Calero, R. Fernández-Mateo, H. Morgan, P. García-Sánchez and A. Ramos, J. Chromatogr. A, 2023, 1706, 464240 CrossRef CAS PubMed.
| This journal is © The Royal Society of Chemistry 2024 |


