
Graphene oxide aptasensor droplet assay for detection of metabolites secreted by single cells applied to synthetic biology†
Dan
Zheng
a,
Jingyun
Zhang
a,
Wenxin
Jiang
b,
Ying
Xu
 b,
Haixu
Meng
b,
Chueh Loo
Poh
*a and
Chia-Hung
Chen
*bc
b,
Haixu
Meng
b,
Chueh Loo
Poh
*a and
Chia-Hung
Chen
*bc
aDepartment of Biomedical Engineering, National University of Singapore, 4 Engineering Drive 3, 117583, Singapore. E-mail: poh.chuehloo@nus.edu.sg
bDepartment of Biomedical Engineering, City University of Hong Kong, 83 Tat Chee Avenue, Kowloon Tong, Hong Kong, China. E-mail: chiachen@cityu.edu.hk
cCity University of Hong Kong Shenzhen Research Institute, Shenzhen Virtual University Park, Shenzhen, China
First published on 28th November 2023
Abstract
Synthetic biology harnesses the power of natural microbes by re-engineering metabolic pathways to manufacture desired compounds. Droplet technology has emerged as a high-throughput tool to screen single cells for synthetic biology, while the challenges in sensitive flexible single-cell secretion assay for bioproduction of high-value chemicals remained. Here, a novel droplet modifiable graphene oxide (GO) aptasensor was developed, enabling sensitive flexible detection of different target compounds secreted from single cells. Fluorophore-labeled aptamers were stably anchored on GO through π–π stacking interactions to minimize the non-specific interactions for low-background detection of target compounds with high signal-to-noise ratios. The assay's versatility was exhibited by adapting aptamer sequences to measure metabolic secretions like ATP and naringenin. To show the case, engineered E. coli were constructed for the bioproduction of naringenin. The high signal-to-noise ratio assay (∼2.72) was approached to precisely measure the naringenins secreted from single E. coli in the droplets. Consequently, secretory cells (Gib) were clearly distinguished from wild-type (WT) cells, with a low overlap in cell populations (∼0%) for bioproduction.
Introduction
In the field of synthetic biology, the design–build–test cycle is pivotal for engineering cells to produce desired compounds.1 This can be achieved through the screening of single cells in a mutant library, elucidating the relationship between secretory phenotypes and their transcriptomic profiles to pinpoint critical mutant genes.2 Recent innovations in computational programs, genome editing, and plasmid technology have expanded the capacity for generating diverse mutants.3,4 However, high-throughput biosensor assays for indicating target secretory cells remain limited.5,6 Many current assays face challenges in sensitively and flexibly measuring valuable chemicals like naringenins for industrial applications.Immunosorbent assays present a versatile approach for quantifying various chemical compounds by capturing target molecules for labeling and analysis.7 To discern secretions from individual cells, the development of enzyme-linked immune absorbent spot (ELISpot) proved instrumental, showcasing visible spots that enable secretory profiling.8 In recent advances, integrative microtiter plates have emerged, allowing for parallel assays of single cells. This is achieved by confining individual cells in nanoliter-sized microwells, with their secretions captured by a glass slide precoated with antibodies9 or aptamers.10,11 Notably, this approach enables the simultaneous determination of multiple secretions from the same cells, achieved by coating pre-patterned bands of antibodies12/aptamers13 on a glass slide for multiplexed secretory analysis. While immunoassays on microtiter plates offer high flexibility for single-cell secretory analysis, their screening capacity is often constrained by the number of microwells available (typically ∼103 cells per experiment).14 Additionally, intricate enzyme assays are frequently employed to augment sensitivity for single-cell secretion measurements.15
Fluorescence-activated cell sorting (FACS) holds great promise as a high-throughput platform for sensitive single-cell phenotype screening, capable of processing around 103 cells per second.16,17 However, most flow cytometry-based assays primarily focus on measuring cell size, surface proteins, and intracellular compounds.18 Although intracellular staining technology has been explored for estimating single-cell secretory profiles, it often introduces artifacts19 and may interfere with the natural cell secretion process due to its labor-intensive nature. Additionally, a significant portion of cells may become non-viable after undergoing intracellular staining, which hampers their potential for strain development in bioproduction. Alternative technologies, such as conventional gas chromatography-mass spectrometry (GC-MS)20 and high-performance liquid chromatography-mass spectrometry (HPLC-MS),21 have been investigated for analyzing various metabolic secretions from single cells. However, they continue to face challenges related to low throughput (typically around one cell per experiment).
The droplet enzymatic assay represents a cutting-edge, high-throughput technique for quantifying extracellular secretions from single cells with exceptional sensitivity, particularly in the context of mutant selections.22–25 This method involves the production of monodispersed water-in-oil droplets through droplet microfluidics, where single cells and chemical sensors are encapsulated. Post-incubation, the enzymatic secretions from the cells react with the substrate sensors, generating discernible fluorescence signals that indicate the presence of secretory mutants. These droplets are then processed through an optical detector, enabling rapid cell screening and sorting at a high-throughput rate of around 102 cells per second. This advancement holds significant potential for the targeted evolution of synthetic biology.22–25 It is worth noting that this technique has achieved highly sensitive measurements, approaching levels as low as 1 nM for single-cell screening via enzyme reactions used to sort the secretory mutants.22 Despite these strides, it is important to acknowledge a limitation: the current droplet enzymatic assays may face challenges in adapting to measure specific enzymes, such as horseradish peroxidase (HRP)22 or proteases,26 due to the need for customized reactions. This aspect may restrict its widespread application in the fabrication of high-value chemicals in industry.
To extend the capacity of droplet screens, several assays have been developed for single-cell secretory profiling. For example, whole-cell biosensors were investigated to measure cell-secreted metabolic compounds. This method entails co-encapsulating both whole-cell biosensors and single cells within the same droplets, allowing for the determination of target compounds.27 However, achieving a high co-encapsulation rate for both sensing cells and mutant cells can be challenging, and the detection sensitivity may vary depending on the loaded sensing cells (∼183 μM naringenin).27 Another innovative technique is the RNA-aptamer-in-droplet (RAPID) technology,28 which aims to broaden the applicability of droplet screening for analyzing diverse metabolic compounds. RAPID leverages the binding mechanism of spinach aptamers to target compounds in the droplets, resulting in transduced fluorescence signals that enable the screening of secretory single cells. Nevertheless, the sensitivity of RAPID (∼0.3 mM tyrosine) is limited by the non-specific binding of aptamers to the surface of E. coli or random molecules in the bio-solution. This leads to higher background signals and a constrained signal-to-noise ratio.28 Although the addition of blocking agents like double-stranded salmon sperm DNA can partially mitigate these random interactions, the challenge of consistently achieving low background signals for sensitive detection persists. To provide a comprehensive overview, a summary of the current prominent high-throughput single-cell secretion assays for synthetic biology applications has been included for comparison (ESI† S1).
In this study, a droplet modifiable graphene oxide (GO) aptasensor was devised to enable sensitive and adaptable detection of metabolic compounds secreted by individual cells (Fig. 1). By initially anchoring the aptamers on the GO surface, non-specific interactions with random suspended molecules in bio-solutions were minimized, ensuring low-background and highly sensitive detection. In cases where non-producer strains did not secrete sufficient target compounds in the droplets, the aptamers remained bound to the GO surface, resulting in fluorescence quenching (quenching mode). Conversely, when producer strains secreted the target compounds in the droplets, the aptamers captured these molecules, leading to conformational changes and fluorescence recovery (fluorescence mode). To demonstrate the assay's versatility, ATP and naringenin were measured by adapting the aptamer sequences. Specifically, E. coli was modified to produce naringenin, a valuable central scaffold compound in metabolic engineering for flavonoid production, known for its various health benefits including antioxidative, anti-inflammatory, and anticancer activities. The low-background fluorescence signals allowed for the sensitive measurement of naringenin generated by single E. coli, achieving a high signal-to-noise ratio (∼2.72), all within the droplets. This enabled clear differentiation between secretory mutants (Gib) and wild-type (WT) cells, with minimal overlap in cell populations (∼0%). Overall, the droplet GO aptasensor represents an advanced and versatile tool for accurately identifying secretory mutants, holding great potential for the bioproduction of valuable chemicals in industry.
 | ||
| Fig. 1 Droplet GO aptasensor. When no target molecules are present within a droplet, the fluorophore-labeled aptamers remain anchored to the GO surface, causing their fluorescence signals to be quenched by the GO material (quenching mode). Conversely, in the presence of target compounds, the aptamers engage with these molecules, leading to a recovery of fluorescence signals (fluorescence mode). This dynamic showcases the sensor's ability to discern the presence of specific target compounds with high sensitivity. | ||
Materials and methods
Graphene oxide (GO) reagent
A graphene oxide suspension (0.5 mg mL−1, solvent: H2O) was procured from Jiangsu XFNANO Materials Tech Co Ltd. It was subsequently diluted with DI water to attain the desired concentrations of GO. Note that the concentrations of GO are indicated as moles in the following sections, calculated based on the reported molecular weight of GO (48![[thin space (1/6-em)]](https://www.rsc.org/images/entities/char_2009.gif) 134.19 g mol−1).29 The morphology of GO was assessed using a transmission electron microscope (JEOL JEM-3011).
134.19 g mol−1).29 The morphology of GO was assessed using a transmission electron microscope (JEOL JEM-3011).
Aptamers
ATP and naringenin aptamers were custom-synthesized by labeling single-stranded DNA oligonucleotides, each with specific sequences for binding ATP or naringenin, using distinct fluorescent dyes. These aptamers were procured from Integrated DNA Technologies (IDT) located in Coralville, USA. The ATP aptamer was tagged with the FAM dye (with a maximum excitation of 495 nm and maximum emission of 520 nm), while the naringenin aptamer was labeled with Alexa Fluor 647 dye (excitation 650 nm; emission 665 nm). Both aptamers were dissolved in PBS to create a 5 μM stock solution, and they were stored at 4 °C until use.Buffer solution and culture medium
For the buffer solution, the following steps were undertaken: M9 salt 5× solution (200 mL) was initially combined with CaCl2 (1 M, 0.1 mL), MgSO4 (1 M, 2 mL), and DI water (778 mL). Subsequently, kanamycin (0.1 mM) was introduced into the solution. As for the culture medium, the process involved mixing M9 salt 5× solution (200 mL) with autoclaved casamino acids (2%, 100 mL), glucose (20% w/w, 20 mL), CaCl2 (1 M, 0.1 mL), MgSO4 (1 M, 2 mL), and DI water (658 mL). Following this, IPTG (0.1 mM), tyrosine (0.25 mM), malonic acid (0.75 mM), and kanamycin (0.1 mM) were added to complete the solution.Graphene oxide (GO) aptasensor
The fabrication of GO aptasensors involved several steps: (1) the GO solution was mixed with the buffer solution and blocking agent PEG (Mn = 20000, referred to as PEG20k), followed by sonication for 5 minutes. (2) Aptamer stock was then introduced into the prepared GO solution and allowed to incubate at 26 °C for 25 minutes. (3) The resulting solution underwent centrifugation to remove the supernatants. (4) The GO aptamer pellet was subsequently re-suspended in a clean buffer solution to yield the final GO aptasensor. The concentrations of GO, PEG20k, and aptamer in the final GO aptasensor were 519 nM, 0.008% w/v, and 160 nM, respectively.
Plasmid construction and transformation
Plasmid design was conducted using Benchling (Benchling, USA), and genes along with primers were sourced from IDT. The construction of the naringenin-producing plasmid Gib (pLac-d-CHS-106-32-MCS-106-d-PAL-106-32-4CL) and pEK (wild type, WT) plasmid involved inserting a PCR-amplified fragment into a backbone with kanamycin resistance. Plasmids were assembled utilizing the Gibson assembly method. Following assembly, plasmids were transformed into Acella (E. coli strain, derived from DE3) using the heat shock method.30 Initially, 1 μL of plasmid was introduced into the Acella competent cell, followed by heat shock at 42 °C in a water bath for 45 seconds. The transformed cells were then allowed to recover at 37 °C for 1 hour, after which they were spread onto an agar plate with the selection marker. DNA sequencing was carried out by Axil Scientific (Singapore). Cells were inoculated from glycerol stock and left to grow overnight in LB (0.1 mM kanamycin) at 37 °C with a shaking speed of 225 RPM. Subsequently, the overnight E. coli culture (50 μL) was inoculated in 5 mL of fresh LB (with 0.1 mM kanamycin added) for further use.Fluorescence quenching experiment
To observe the fluorescence quenching, six sets of GO aptasensor solutions with different GO concentrations (208, 312, 416, 519, 623, 727 nM) and a fixed ATP aptamer concentration (160 nM) were prepared. The fluorescence signals were measured in a 384-well plate using a microplate reader (BioTek Synergy H1). The mean fluorescence signals at various time points (0, 1, 5, 10, 15, 20, 25, 30, and 35 min) were plotted against time to generate the quenching kinetic curves. The quenching efficiency was determined by the formula (F1 − F0)/F1, where F1 and F0 are the fluorescence signals of ATP aptamers before and after adding GO.31 The signal-to-noise ratio (SNR) was determined by the formula SNR = F/F0, where F represents the recovered fluorescence intensity and F0 is the quenched fluorescence intensity before adding the target compounds.32 The correlation between GO concentration and quenching efficiency was obtained by recording the plateau quenching at different GO concentrations.Fluorescence recovery experiment
To observe the fluorescence recovery, three sets of GO aptasensor solutions with different GO concentrations (519, 623, 727 nM), along with a fixed ATP aptamer concentration (160 nM), were prepared. By incubating these solutions with varying concentrations of ATP (0 μM, 100 μM, 200 μM, 500 μM, 1000 μM, 2000 μM) for 20 minutes, the fluorescence recoveries were measured using a microplate reader (BioTek Synergy H1). The mean fluorescence signals at various time points (0, 1, 5, 10, 15, 20, 25, 30, and 35 minutes) were recorded to generate the fluorescence recovery kinetic curves. The correlation between GO concentration and recovery rate was analyzed based on the plateau fluorescence recovery rates at different GO concentrations. The fluorescence recovery was determined using the formula (F − F0)/F0, where F represents the recovered fluorescence intensity and F0 is the quenched fluorescence intensity (background) before adding the target compounds.33Specificity tests
To assess the specificity of ATP aptamers, ATP and ADP test solutions were freshly prepared by adding ATP/ADP stock solutions (0.9 μL, 100 mM) to buffer solution (31.5 μL). Following this, the GO aptasensor solution (3.5 μL) and ATP/ADP test solution (9 μL) were combined and incubated in a 384-well plate for 20 minutes for fluorescence measurements. To evaluate the specificity of naringenin aptamers, naringenin, ATP, vanillin, luteolin, and apigenin test solutions were created by mixing naringenin/ATP/vanillin/luteolin/apigenin stock solution (0.9 μL, 5 mM), ethanol (6.9 μL, 100%), and buffer solution (57 μL). Subsequently, the GO aptasensor (3.5 μL) was introduced into the naringenin/ATP/vanillin/luteolin/apigenin test solution for incubation in a 384-well plate for 20 minutes for fluorescence measurements.Droplet microfluidic device
Droplet microfluidic devices were crafted using poly(dimethylsiloxane) (PDMS, Sylgard 184™, Dow Corning Inc, Midland, MI) through soft lithography techniques.34 A droplet generator featuring double aqueous inlets and a co-flow junction (ESI† S2) was constructed. To achieve monodispersed water-in-oil droplets (with a diameter of approximately 40 μm), a nozzle was fashioned with a width of 40 μm and a height of 30 μm. The PDMS replicas of the droplet generator were then securely attached to glass slides coated with a thin PDMS layer using a plasma cleaner (PDC-32G, Harrick Plasma, Ithaca, NY). For the oil phase, Novec™ HFE-7500 oil (3M, Singapore) combined with surfactants (Picosurf-1™, Sphere Fluidics, Cambridge, UK, 0.05% w/w) was employed.34 To generate the water-in-oil droplets, the aqueous flow rates were maintained at approximately 2 μL min−1, and the oil flow rate was set at roughly 8 μL min−1, utilizing syringe pumps (Harvard Apparatus, PhD 2000, USA).Pico-injector device
The pico-injector devices were fabricated using PDMS, with a height and width of 25 μm, and an injector nozzle of 20 μm in diameter (ESI† S3). To create the electrodes, microchannels in the shape of the electrodes were initially formed. The devices were then heated to 80 °C, allowing the low melting-point solder solutions (WIREBN-52189, Indium Corporation, Clinton, NY) to flow into the channels.35 Upon cooling, the solder solutions solidified, resulting in the formation of metallic electrodes conforming to the shape of the channels. Subsequently, the pico-injector devices were assembled by connecting the electrical outputs to these metal electrodes, allowing them to receive AC electrical signals for operation. To disrupt the interface of the previously prepared droplets for pico-injection, a 2 Vpp 20 kHz sinusoidal wave was amplified 100-fold and applied to the electrodes of the pico-injector.Single-cell encapsulation
To encapsulate a single cell in droplets, two streams were used, each containing the same suspension of either Gib or WT cells (cell density: ∼8.0 × 10⁶ cells per mL, flow rate for both streams: 2 μL min−1). Simultaneously, an oil stream (8 μL min−1) was co-injected along with the cell streams into a droplet generation chip. The cell suspension was prepared by diluting the freshly inoculated cell culture with the culture medium. For studying the single-cell encapsulation rate, brightfield images of 100 droplets collected from a single-cell encapsulation experiment were acquired, and the number of E. coli cells in each droplet was counted. The single E. coli encapsulation rate in the droplets, followed by a Poisson distribution,36 was ∼15%.Droplet measurement
Fluorescence signals within the droplets were measured using an inverted fluorescence microscope equipped with a four-wavelength automated excitation system (CoolLED pE-4000) and a versatile multiple bandpass filter set (comprising DAPI, FITC, TRITC, and CY5 filters). The droplets were loaded into a disposable hemocytometer (EVE™ Cell counting slides, NanoEntek, Seoul), and imaging was conducted using the NIS-Elements software (AR 5.30.02) for signal detection.Data analysis
The fluorescence signals of droplets were analyzed using ImageJ software (version 1.53k). Data plotting and statistical significance analysis were performed using Prism 6 software (GraphPad Software, Inc.).Results and discussion
GO aptasensors
The GO aptasensors employ a two-step process for target molecule detection (Fig. 2a). Initially, the fluorophore-labeled aptamers bind to the GO surface through noncovalent π–π interactions, leading to fluorescence quenching via fluorescence resonance energy transfer (FRET) from the fluorophore to GO.37,38 Subsequently, as the aptamers capture the target molecules, they undergo conformational changes, forming aptamer–target complexes that move away from the GO surface. This results in a fluorescence recovery.39–41 Consequently, the increase in fluorescence intensity provides a sensitive indication of the target molecule concentrations. It is worth noting that the adaptability of the GO aptasensors to different aptamer sequences allows for easy customization, enabling the flexible detection of various metabolic compounds. | ||
| Fig. 2 GO aptasensor fabrication and characterization. (a) Schematic of sensing mechanism: (1) the fluorophore-labeled aptamers were anchored on the GO surface causing fluorescence quenching; (2) the aptamers captured the target compounds, moving away from the GO surface, resulting in fluorescence recovery. (b) TEM image of GO (scale bar: 300 nm). (c) Investigation of the effect of GO concentration (ranging from 208 to 727 nM) on quenching kinetics, demonstrating increased fluorescence quenching with higher GO concentration. (d) Analysis of the correlation between quenching efficiency and GO concentration, showing saturation at a GO concentration of ∼519 nM. (e) Application of the GO aptasensor assay to measure ATPs via fluorescence spectra. The peak value at 520 nm gradually increased with rising ATP concentration. (f) Linear increase in fluorescence recovery rates with higher ATP concentrations. (g) Validation of GO aptasensor assay stability. Similar fluorescence signals were observed when testing ATPs in a buffer solution and a culture medium containing amino acids. | ||
The planar sheet-like morphology of GO was confirmed through transmission electron microscopy (TEM) imaging (Fig. 2b). To optimize experimental parameters, we utilized the FAM-labeled ATP aptamer (AATP) as a model. The kinetics of GO–aptamer binding were investigated at different GO concentrations ranging from 10 to 35 μg mL−1, monitoring fluorescence quenching over time (Fig. 2c). The results demonstrated that regardless of GO concentration, the fluorescence signals of AATP gradually decreased and reached plateaus in approximately 25 minutes. Generally, the plateau fluorescence signal decreased with increasing GO concentration. At a low GO concentration (208 nM), a high plateau fluorescence signal was observed (∼13973 a.u.), while at a high GO concentration (727 nM), a low plateau fluorescence signal was recorded (∼452 a.u.). We analyzed the correlation between GO concentration and quenching efficiency by recording plateau fluorescence signals at different GO concentrations (Fig. 2d). The quenching efficiency increased from 0.31 to 0.93 as the GO concentration rose from 208 to 416 nM, and it reached saturation at approximately 0.96 when the GO concentration exceeded 519 nM, indicating that aptamers were completely quenched at this GO concentration. Notably, the quenching efficiency by GO is contingent upon the ratio between GO and the aptamer.42 In this study, although the aptamer concentration was fixed (160 nM), different ratios between GO and the aptamer were tested by changing GO concentrations (ESI† S4). It was observed that the saturated quenching efficiency was approached when the GO/aptamer ratio was ∼3.2 (GO concentration: 519 nM, aptamer concentration: 160 nM). Furthermore, we systematically characterized the fluorescence recovery by adding ATP (1000 μM) to the solutions at various GO concentrations (519 to 727 nM) (ESI† S5). We observed that for all GO concentrations, the fluorescence signals increased over time and reached plateaus within approximately 20 minutes. Notably, as the GO concentration increased from 519 to 727 nM, the fluorescence recovery rate showed a decline, dropping from around ∼6.2 to ∼2.1. Based on these findings, we determined that a GO concentration of 519 nM was optimal for the preparation of the GO aptasensors.
When investigating the effect of adding ATP to a GO aptasensor solution (519 nM) on fluorescence recovery using a microplate reader, we observed a notable trend. As the ATP concentration increased from 0 μM to 2000 μM, the fluorescence peak at 520 nm in the fluorescence spectra increased from approximately ∼600 a.u. to ∼6857 a.u. (Fig. 2e). Remarkably, the lowest detectable ATP concentration in these microplate measurements was approximately ∼10 μM (signal-to-noise ratio ∼1.11). A distinct difference was observed (p = 0.021 for t-test) between negative (0 μM) and positive (10 μM) samples. Additionally, the fluorescence recovery rate displayed a linear increase from 0 to ∼6.42 when the ATP concentration was raised from 0 to 1000 μM (Fig. 2f).
To validate the assay's stability for bio-detection, we employed the GO aptasensors to measure ATP levels in various biological solutions (Fig. 2g). When testing a blank buffer (light gray), a low background signal of approximately ∼600 a.u. was observed. Upon adding ATP (1000 μM) to the buffer solution, the fluorescence signal increased to around ∼4553 a.u., indicating a high signal-to-noise ratio (7.59). In the case of testing a blank culture medium containing amino acids (dark gray), the interactions between amino acids and aptamers were minimized when using the GO aptasensors, resulting in a low background signal of roughly ∼700 a.u. When testing ATP (1000 μM) in the culture medium, a high fluorescence signal of approximately ∼4781 a.u. was observed, once again demonstrating a high signal-to-noise ratio (6.83). Furthermore, we validated the specificity of the ATP aptamer by employing the GO aptasensor to test ATP and ADP solutions (ESI† S6). When testing ATP (2000 μM), a high fluorescence signal of around ∼6600 a.u. was observed. In contrast, when testing ADP (2000 μM), the fluorescence signal dramatically decreased to approximately ∼3400 a.u., clearly demonstrating the assay's specificity in detecting ATP using the GO aptasensors.
ATP droplet assay
The sequence of AATP (Fig. 3a) used to develop the droplet GO aptasensors was fabricated to bind the ATPs for assaying. The ATP droplet GO aptasensors were characterized by recording the droplet fluorescence signals at different ATP concentrations (100 μM and 2000 μM). The droplets at low ATP concentration (100 μM) and the droplets at high ATP concentration (2000 μM) were mixed in various ratios (i.e., 0% to 100%, 30% to 70%, and 50% to 50%) (ESI† S7). The fluorescence image of mixed droplets was recorded under an inverted microscope. For each mixing ratio, ∼250 droplets were measured. It was observed that if only high ATP concentration droplets (∼100%) were presented, all droplets showed high fluorescence signals, indicating a single cluster. In the case of mixing 30% low ATP concentration droplets and 70% high ATP concentration droplets, two distinguished droplet clusters were observed to show ∼29.3% low fluorescence droplets and ∼70.7% high fluorescence droplets. A similar result to show ∼48.3% low fluorescence droplets and ∼51.6% high fluorescence droplets was observed when mixing 50% low ATP concentration droplets and 50% high ATP concentration droplets (Fig. 3b). Moreover, the ATP droplet aptasensor assay was characterized by measuring the fluorescence signals of droplets containing the aptasensor and ATPs at varied concentrations (0, 50, 100, 200, 500, 1000, and 2000 μM) (Fig. 3c). It was observed that without ATP, AATP fluorescence in the droplets was quenched to show a low fluorescence signal (∼57 a.u.). When the ATP concentration increased from 50 μM to 2000 μM, the droplet fluorescence signals increased from ∼69 a.u. to ∼617 a.u. accordingly. The fluorescence recovery rate therefore increased from ∼0.21 to ∼9.81. Accordingly, the signal-to-noise ratio was increased from 1.21 to 10.82.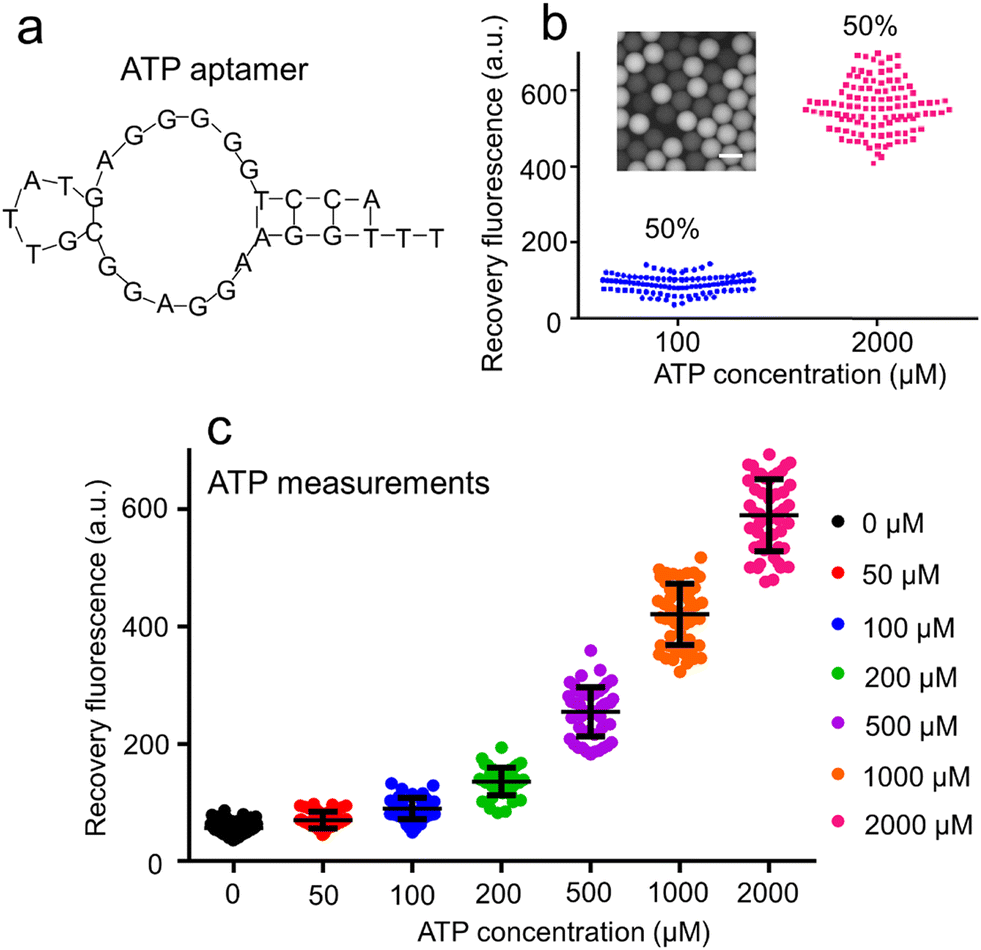 | ||
| Fig. 3 Droplet ATP GO aptasensor. (a) The aptamer sequence designed for ATP measurements is provided. (b) A fluorescent image of droplets containing a mixture of 100 μM ATP and 2000 μM ATP, with a mixing ratio of 50%:50%, is shown (scale bar: 50 μm). (c) The fluorescence signals of the droplets containing various ATP concentrations were measured, demonstrating a gradual increase with rising ATP concentrations. The standard deviations were obtained from measurements of 50 droplets. | ||
Naringenin droplet assay
Owing to the highly flexible design, the AATP sequence was replaced by the ANar sequence 5′-CTA GCA GTT GTG GTA GAG TCA CCA CAA-3′ (Fig. 4a) to fabricate the naringenin aptasensors. This ANar sequence was established based on previously reported work.43,44 Using the online RNAfold web server tool, the core region for naringenin binding was identified as 5′-GTT GTG GTA GAG TCA CCA C-3′. It is worth noting that when incubating E. coli in bulk solutions (or in droplets), the pH can change over time.45 To ensure consistent fluorescence signals, a pH-insensitive dye (Alexa Fluor 647) was used in the fabrication of the GO aptasensor for naringenin measurement. The stable fluorescence signals of Alexa Fluor 647-labeled aptamers in buffer solutions at different pH levels were confirmed (ESI† S8). | ||
| Fig. 4 Droplet naringenin GO aptasensor. (a) The aptamer sequence for naringenin measurements is presented. (b) A specificity test of the naringenin aptasensors was conducted using naringenin, ATP, and vanillin to demonstrate high selectivity in measuring naringenins. (c) The fluorescence signals of the droplets containing varying concentrations of naringenin were measured, revealing that the detection limit of the droplet GO aptasensor for naringenin was approximately 10 μM. Standard deviations were obtained by measuring 50 droplets. | ||
The GO aptasensor was employed to measure naringenin at various concentrations using a microplate reader (ESI† S9). The lowest detectable concentration of naringenin was approximately 1 μM. The fluorescence recovery rate exhibited a roughly linear increase when the naringenin concentration was raised from 1 to 400 μM. Furthermore, the selectivity of the naringenin aptasensor was assessed by comparing its interactions with three different compounds (naringenin, ATP, vanillin) (Fig. 4b). A strong fluorescence signal (∼319.9 a.u.) was observed upon reaction with 50 μM naringenin. In contrast, weak fluorescence signals (less than 10 a.u.) were observed upon reaction with 50 μM ATP or vanillin, indicating promising selectivity. It is important to note that the specificity of GO aptasensors depends on the aptamer sequences used to differentiate between different compounds. Consequently, compounds with similar molecular structures, such as naringenin, luteolin, and apigenin, may not be well distinguished using the GO aptasensors (ESI† S10).
The droplet GO aptasensor was used to measure naringenin at various concentrations within the droplets under an inverted microscope (Fig. 4c). In this scenario, the detection limit of the droplet GO aptasensor for naringenin was approximately 10 μM (signal-to-noise ratio ∼1.85). A significant difference was observed (p = 0.01 for t-test) between negative (0 μM) and positive (10 μM) samples. In the absence of naringenin in the droplets, the background fluorescence signals were low (∼22.8 a.u.). As the naringenin concentration increased from 10 to 600 μM, the droplet fluorescence signals increased from ∼42.1 a.u. to ∼514.8 a.u. It was observed that as the naringenin concentration increased from 10 to 400 μM, the fluorescence recovery for naringenin measurements in the droplets increased linearly from ∼0.85 to ∼17.56, and the signal-to-noise ratio increased from 1.85 to 18.56. When the naringenin concentration further increased to 600 μM, the fluorescence recovery rate approached ∼21.58 and the signal-to-noise ratio approached 22.58. Notably, our GO aptasensor assay, though not the most sensitive compared to some conventional assays, is a flexible high-throughput single-cell assay with a unique advance in low-background detection of various metabolic compounds through GO–aptamer adaptation. When compared to other flexible droplet assays like RAPID (∼0.3 mM)28 and droplet whole cell sensors (∼183 μM),27 our GO aptasensor shows superior sensitivity (∼10 μM).
Droplet detection of single secretory cells for naringenin production
The naringenin-producing Gib cells, which carried genes for chalcone synthase (CHS), malonyl-CoA synthase (MCS), phenylalanine ammonia-lyase (PAL), and 4-coumaroyl-CoA ligase (4CL), were prepared for bacterial droplet experiments (Fig. 5a). The Gib plasmids were constructed by integrating a PCR-amplified fragment into a backbone with kanamycin resistance. Following this, the assembled Gib plasmids were introduced into Acella through the heat shock method. Wild-type (WT) cells with kanamycin resistance were also generated for control experiments. | ||
| Fig. 5 Detection of naringenin secreted by engineered E. coli. (a) The genetic circuit for the Gib cells is outlined. (b) When measuring the Gib cell culture and WT cell culture using GO aptasensors in bulk through a microplate reader, a ∼5.9-fold higher fluorescence signal was observed in Gib cell culture compared to the fluorescence signals in WT cell culture. (c) When using droplet GO aptasensors, the Gib supernatants exhibited an ∼2.72-fold higher average fluorescence signal compared to the averaged fluorescence signals in WT supernatant droplets. Error bars and standard deviation values were obtained from measurements of 50 droplets. (d) Droplets containing WT cells and empty droplets displayed low fluorescence signals. (e) In contrast, droplets containing Gib cells exhibited high fluorescence signals. Scale bar: 50 μm. (f) The fluorescence signals of empty droplets, droplets containing WT cells, and droplets containing Gibs indicated that the Gibs were well distinguished from WT cells, with a low overlapping cell population of approximately 0%. | ||
To validate the GO aptasensor assay for bioanalysis in the biological solutions, the Gib cell culture and WT cell culture were characterized using a microplate reader (Fig. 5b). Notably, the Gib cell culture exhibited a higher fluorescence signal (∼490 a.u.) compared to the signal in the WT cell culture (∼83 a.u.). After normalizing for background signals, the GO aptasensor demonstrated a robust fluorescence recovery (∼5.6) with a high signal-to-noise ratio (6.6), enabling the sensitive measurement of naringenins in Gib cell culture.
The droplet GO aptasensor was employed to measure naringenins in both WT supernatant and Gib supernatant within the droplets using an inverted microscope (Fig. 5c). Notably, droplets containing Gib supernatant exhibited stronger fluorescence signals (average ∼163 a.u.) compared to those containing WT supernatant (average ∼45.6 a.u.). This distinction was validated by applying an unpaired t-test with Welch's correction, which confirmed a substantial difference between the two groups (p < 0.0001). Following background normalization, the naringenin concentration in the Gib supernatant was estimated to be approximately ∼107 μM, while no naringenin was detected in the WT supernatant. To further validate the results, conventional HPLC equipped with an absorbance range of 240–500 nm was employed to determine the naringenin concentrations in the Gib supernatant (∼104 μM) and in the WT supernatant (0 μM) (ESI† S11). Remarkably, the outcomes obtained from the droplet GO aptasensors were highly consistent with those from the HPLC, underscoring the high accuracy of the aptasensor assay.
In the single-cell assay, individual E. coli cells were encapsulated within the droplets, and the secreted naringenin was subsequently measured. The process of single-cell encapsulation adhered to a Poisson distribution, resulting in an encapsulation rate of ∼15% (ESI† S12). Following encapsulation, the E. coli cells were allowed to incubate within the droplets for approximately 48 hours prior to the assay. Subsequently, the GO aptasensors were introduced into the droplets via a droplet pico-injector. The relationship between the applied droplet flow rates and the final concentration of GO aptasensors within the droplets was characterized (ESI† S12). Approximately 13.6 picoliters of the GO aptasensor solution were injected into each individual droplet, leading to an increase in droplet diameter from ∼40 μm to ∼45 μm (ESI† S14). Post-injection, the E. coli and GO aptasensors were allowed to incubate within the droplets for ∼25 minutes to facilitate signal development.
The results demonstrated that due to the limited secretion of naringenins by WT cells, only weak fluorescence signals (∼59 a.u.) were observed in the droplets (Fig. 5d). Notably, the weak fluorescence signals from the droplets containing WT cells were comparable to those from the empty droplets (∼47 a.u.). In contrast, robust fluorescence signals (∼128 a.u.) were detected in the droplets containing Gib cells (Fig. 5e). Relative to the droplets containing WT cells, the droplets containing Gib cells exhibited approximately 2.1-fold higher fluorescence intensity. A one-way ANOVA test was conducted to confirm the significant difference between these two groups (p < 0.0001). Following background normalization, the fluorescence recovery rate for measuring the secreted naringenins by individual Gib cells was ∼1.72. Consequently, the signal-to-noise ratio was 2.72. As expected, there was nearly no naringenin secreted by individual WT cells in the droplets.
To enhance the sensitivity and signal-to-noise ratio of GO aptasensors, further efforts are needed to reduce random binding by designing more stable aptamer sensors with better aptamer–target binding affinity. We propose two strategies, development of stable aptamer sensors and improvement of optical systems for signal detection. For the first strategy, by adopting approaches such as optimization of aptamer sequences and stabilization of aptamer structures to improve aptamer–target binding affinities,46 aptamer sensors can achieve greater stability, thus minimizing non-specific molecular binding and reducing noise in signal measurements. For instance, the development of insulin aptamers that can form G-quartet structures47 has allowed for precise measurements of insulin biomarkers in complex biological fluids like fetal bovine serum,48 which contain a variety of biomolecules and cells. For the second strategy, the accuracy of fluorescence signal measurements could be substantially improved by software that filters out background noise. Much of this noise exhibits recognizable patterns that can be potentially identified and mitigated using advanced machine learning algorithms,49,50 thus enhancing detection sensitivity.
Conclusion
In summary, this study presents a novel droplet-modifiable GO aptasensor, offering a sensitive and adaptable assay for quantifying target compounds produced by individual cells. This technology holds great potential for identifying secretory cells in synthetic biology applications. The aptamers were strategically immobilized on the GO surface, creating a stable configuration that minimizes non-specific interactions with other molecules. This resulted in a low-fluorescence background due to the quenching effect of GO on aptamer fluorescence signals. Upon interaction with the target compounds, the aptamers disengaged from GO, revealing fluorescence signals proportional to the compound concentrations. Furthermore, the adaptability of the aptamers allows for the flexible analysis of various target compounds.To showcase the capabilities of this assay, it was applied to analyze E. coli engineered to produce naringenin (Gib). Supernatant samples from shake-flask production cultures were examined, demonstrating low-background and high signal-to-noise ratio fluorescence signals for naringenin detection in bio-solutions. Moreover, through the advancement of the GO aptasensor, elevated fluorescence signals were detected in droplets containing Gib cells compared to those containing WT cells (overlapping cell population ∼0%). Notably, beyond naringenin detection, by customizing the aptamer sequences, the droplet GO aptasensor assay could be extended to identify other crucial mutants involved in the bioproduction of valuable chemicals. This study thus introduces a powerful and versatile tool for measuring single-cell secretions, contributing to the automation of design–build–test cycles in synthetic biology for the production of valuable chemicals.
Conflicts of interest
There are no conflicts to declare.Acknowledgements
The authors gratefully acknowledge the funding provided by various institutions, including the National Natural Science Foundation of China (NSFC) 22074129; the Health and Medical Research Fund (HMRF) 09203596; the Research Grants Council of the Hong Kong, China (GRF), CityU11212822 and CityU11204923, City University of Hong Kong, 9610467, 7005639, 7020030, 9667239, and CityU11202221; the Singapore National Research Foundation (NRF) under the NRF Strategic Capability Programme (SBP5); and the Hong Kong Innovation and Technology Fund (PRP/037/22FX).References
- R. P. Pandey, P. Parajuli, M. A. G. Koffas and J. K. Sohng, Microbial production of natural and non-natural flavonoids: Pathway engineering, directed evolution and systems/synthetic biology, Biotechnol. Adv., 2016, 34(5), 634–662 CrossRef CAS.
- T. C. Williams, I. S. Pretorius and I. T. Paulsen, Synthetic evolution of metabolic productivity using biosensors, Trends Biotechnol., 2016, 34(5), 371–381 CrossRef CAS.
- D. Oling, L. Lawenius, W. Shaw, S. Clark, R. Kettleborough, T. Ellis, N. Larsson and M. Wigglesworth, Large scale synthetic site saturation GPCR libraries reveal novel mutations that alter glucose signaling, ACS Synth. Biol., 2018, 7(9), 2317–2321 CrossRef.
- A. Currin, S. Parker, C. J. Robinson, E. Takano, N. S. Scrutton and R. Breitling, The evolving art of creating genetic diversity: From directed evolution to synthetic biology, Biotechnol. Adv., 2021, 50, 107762 CrossRef CAS PubMed.
- S. Siedler, N. K. Khatri, A. Zsohár, I. Kjærbølling, M. Vogt, P. Hammar, C. F. Nielsen, J. Marienhagen, M. O. A. Sommer and H. N. Joensson, ACS Synth. Biol., 2017, 6, 1860–1869 CrossRef PubMed.
- C. Li, X. Gao, H. Qi, W. Zhang, L. Li, C. Wei, M. Wei, X. Sun, S. Wang, L. Wang, Y. Ji, S. Mao, Z. Zhu, M. Tanokura, F. Lu and H. Qin, Angew. Chem., Int. Ed., 2023, 62, e202216721 CrossRef CAS.
- J. C. He, A. T. Brimmo, M. A. Qasaimeh, P. Y. Chen and W. Q. Chen, Recent advances and perspectives in microfluidics-based single-cell biosensing techniques, Small Methods, 2017, 1(10), 1700192 CrossRef.
- N. Sachdeva and D. Asthana, Cytokine quantitation: technologies and applications, Front. Biosci.-Landmark, 2007, 12, 4682–4695 CrossRef CAS.
- Z. Chen, J. J. Chen and R. Fan, Single-cell protein secretion detection and profiling, Annu. Rev. Anal. Chem., 2019, 12(1), 431–449 CrossRef CAS PubMed.
- S. Y. Toh, M. Citartan, S. C. B. Gopinath and T. H. Tang, Aptamers as a replacement for antibodies in enzyme-linked immunosorbent assay, Biosens. Bioelectron., 2015, 64, 392–403 CrossRef CAS.
- Y. Deng, A. Finck and R. Fan, Single-cell omics analyses enabled by microchip technologies, Annu. Rev. Biomed. Eng., 2019, 21, 365–393 CrossRef CAS.
- Y. Lu, Q. Xue, M. R. Eisele, E. S. Sulistijo, K. Brower, L. Han, E. D. Amir and R. Fan, et. al., High-throughput secretomic analysis of single cells to assess functional cellular heterogeneity, Anal. Chem., 2013, 85(4), 2548–2556 CrossRef CAS.
- Y. Lu, Q. Xue, M. R. Eisele, E. S. Sulistijo, K. Brower, L. Han, E. D. Amir and R. Fan, et. al., Highly multiplexed profiling of single-cell effector functions reveals deep functional heterogeneity in response to pathogenic ligands, Proc. Natl. Acad. Sci. U. S. A., 2015, 112(7), E607–E615 CrossRef CAS PubMed.
- M. Elitas, K. Brower, Y. Lu, J. J. Chen and R. Fan, A microchip platform for interrogating tumor–macrophage paracrine signaling at the single-cell level, Lab Chip, 2014, 14(18), 3582–3588 RSC.
- K. Eyer, S. Stratz, P. Kuhn, S. K. Küster and P. S. Dittrich, Implementing Enzyme-Linked Immunosorbent Assays on a Microfluidic Chip to Quantify Intracellular Molecules in Single Cells, Anal. Chem., 2013, 85(6), 3280–3287 CrossRef CAS PubMed.
- A. Tzur, J. K. Moore, P. Jorgensen, H. M. Shapiro and M. W. Kirschner, Optimizing optical flow cytometry for cell volume-based sorting and analysis, PLoS One, 2011, 6(1), e16053 CrossRef CAS PubMed.
- L. K. Flachbart, S. Sokolowsky and J. Marienhagen, Displaced by deceivers: prevention of biosensor cross-talk is pivotal for successful biosensor-based high-throughput screening campaigns, ACS Synth. Biol., 2018, 8(8), 1847–1857 CrossRef PubMed.
- V. Menon, R. Thomas, A. R. Ghale, C. Reinhard and J. Pruszak, Flow cytometry protocols for surface and intracellular antigen analyses of neural cell types, J. Visualized Exp., 2014, 94, 52241 Search PubMed.
- Z. Gong, Q. Li, J. Y. Shi and G. W. Ren, An artifact in intracellular cytokine staining for studying t cell responses and its alleviation, Front. Immunol., 2022, 13, 759188 CrossRef CAS PubMed.
- S. J. Fairweather, S. Okada, G. Gauthier-Coles, K. Javed, A. Broer and S. A. Broer, GC-MS/single-cell method to evaluate membrane transporter substrate specificity and signaling, Front. Mol. Biosci., 2021, 8, 646574 CrossRef CAS.
- V. Carrera, E. Sabater, E. Vilanova and M. A. Sogorb, A simple and rapid HPLC-MS method for the simultaneous determination of epinephrine, norepinephrine, dopamine and 5-hydroxytryptamine: Application to the secretion of bovine chromaffin cell cultures, J. Chromatogr. B: Anal. Technol. Biomed. Life Sci., 2007, 847(2), 88–94 CrossRef CAS PubMed.
- J. J. Agresti, E. Antipov, A. R. Abate, K. Ahn and D. A. Weitz, et. al., Ultrahigh-throughput screening in drop-based microfluidics for directed evolution, Proc. Natl. Acad. Sci. U. S. A., 2010, 107(9), 4004–4009 CrossRef CAS PubMed.
- W. C. DeLoache, Z. N. Russ, L. Narcross, A. M. Gonzales, V. J. J. Martin and J. E. Dueber, An enzyme-coupled biosensor enables (S)-reticuline production in yeast from glucose, Nat. Chem. Biol., 2015, 11(7), 465–473 CrossRef CAS PubMed.
- T. Beneyton, S. Thomas, A. D. Griffiths, J. M. Nicaud, A. Drevelle and T. Rossignol, Droplet-based microfluidic high-throughput screening of heterologous enzymes secreted by the yeast Yarrowia lipolytica, Microb. Cell Fact., 2017, 16, 18 CrossRef PubMed.
- J. H. Yang, R. Tu and L. L. Zhu, et. al., Recent advances in droplet microfluidics for enzyme and cell factory engineering, Crit. Rev. Biotechnol., 2021, 41(7), 1023–1045 CrossRef CAS PubMed.
- M. Wang, M. H. Nai, R. Y. J. Huang and C. H. Chen, et. al., High-throughput functional profiling of single adherent cells via hydrogel drop-screen, Lab Chip, 2021, 21(4), 764–774 RSC.
- E. K. Bowman, J. M. Wagner, S.-F. Yuan and H. S. Alper, et. al., Sorting for secreted molecule production using a biosensor-in-microdroplet approach, Proc. Natl. Acad. Sci. U. S. A., 2021, 118(36), e2106818118 CrossRef CAS PubMed.
- J. Abatemarco, M. F. Sarhan and A. R. Abate, et. al., RNA-aptamers-in-droplets (RAPID) high-throughput screening for secretory phenotypes, Nat. Commun., 2017, 8, 332 CrossRef PubMed.
- K. Kumar, R. P. Dave, S. Dev and M. Singh, Study of molar properties of GO after doping with transition metals for photodegradation of fluorescent dyes, RSC Adv., 2022, 12, 29734 RSC.
- A. Froger and J. E. Hall, Transformation of plasmid DNA into E. coli using the heat shock method, J. Visualized Exp., 2007, 253 Search PubMed.
- Y. Liu, et. al., A Facile Aptasensor for Instantaneous Determination of Cadmium Ions Based on Fluorescence Amplification Effect of MOPS on FAM-Labeled Aptamer, Biosensors, 2021, 11(5), 133 CrossRef CAS PubMed.
- X. Liu, H. Zhu, J. Sabó, Z. Lánský and P. Neužil, Improvement of the signal to noise ratio for fluorescent imaging in microfluidic chips, Sci. Rep., 2022, 12(1), 18911 CrossRef CAS PubMed.
- S. Ahmed, H. A. A. Clayton and G. Wright, Practical manual for fluorescence microscopy techniques, PicoQuant GmbH, 2016, ch. 6, pp. 6–4 Search PubMed.
- C. H. Chen, R. K. Shah, A. R. Abate and D. A. Weitz, Janus Particles Templated from Double Emulsion Droplets Generated Using Microfluidics, Langmuir, 2009, 25, 4320–4323 CrossRef CAS PubMed.
- A. R. Abate, T. Hung, P. Mary, J. J. Agresti and D. A. Weitz, High-throughput injection with microfluidicsusing picoinjectors, Proc. Natl. Acad. Sci. U. S. A., 2010, 107(45), 19163–19166 CrossRef CAS.
- K. Matuła, F. Rivello and W. T. S. Huck, Single-Cell Analysis Using Droplet Microfluidics, Adv. Biosyst., 2020, 4, 1900188 CrossRef.
- Y. Shi, W. T. Huang, H. Q. Luo and N. B. Li, A label-free DNA reduced graphene oxide-based fluorescent sensor for highly sensitive and selective detection of hemin, Chem. Commun., 2011, 47, 4676–4678 RSC.
- X. Yang, et al., High-Efficiency Loading and Controlled Release of Doxorubicin Hydrochloride on Graphene Oxide, J. Phys. Chem. C, 2008, 112, 17554–17558 CrossRef CAS.
- S. Cai, et al., Investigations on the interface of nucleic acid aptamers and binding targets, Analyst, 2018, 143, 5317–5338 RSC.
- K. P. Loh, Q. Bao, G. Eda and M. Chhowalla, Graphene oxide as a chemically tunable platform for optical applications, Nat. Chem., 2010, 2, 1015–1024 CrossRef CAS PubMed.
- C.-H. Lu, H.-H. Yang, C.-L. Zhu, X. Chen and G.-N. Chen, A Graphene Platform for Sensing Biomolecules, Angew. Chem., Int. Ed., 2009, 48, 4785–4787 CrossRef CAS PubMed.
- Z. S. Qian, X. Y. Shan, L. J. Chai, J. R. Chen and H. Feng, A fluorescent nanosensor based on graphene quantum dots–aptamer probe and graphene oxide platform for detection of lead (II) ion, Biosens. Bioelectron., 2015, 68, 225–231 CrossRef CAS PubMed.
- H. Youn, et. al. Aptasensor for multiplex detection of antibiotics based on FRET strategy combined with aptamer/graphene oxide complex, Sci. Rep., 2019, 9, 7659 CrossRef PubMed.
- S. Jang, et. al. Development of Artificial Riboswitches for Monitoring of Naringenin In Vivo, ACS Synth. Biol., 2017, 6, 2077–2085 CrossRef CAS PubMed.
- R. Sánchez-Clemente, M. I. Igeño, A. G. Población, M. I. Guijo, F. Merchán and R. Blasco, Study of pH Changes in Media during Bacterial Growth of Several Environmental Strains, Proceedings, 2018, 2(20), 1297 Search PubMed.
- H. Hasegawa, N. Savory, K. Abe and K. Ikebukuro, Methods for Improving Aptamer Binding Affinity, Molecules, 2016, 21, 421 CrossRef PubMed.
- W. Yoshida, E. Mochizuki, M. Takase, H. Hasegawa, Y. Morita, H. Yamazaki, K. Sode and K. Ikebukuro, Selection of DNA aptamers against insulin and construction of an aptameric enzyme subunit for insulin sensing, Biosens. Bioelectron., 2009, 24(5), 1116–1120 CrossRef CAS.
- Y. He, Y. Cheng and X. Wen, A design of red emission CDs-based aptasensor for sensitive detection of insulin via fluorescence resonance energy transfer, Spectrochim. Acta, Part A, 2022, 280, 121497 CrossRef CAS.
- N. Nitta and K. Goda, et. al., Intelligent Image-Activated Cell Sorting, Cell, 2018, 175(1), 266–276 CrossRef CAS PubMed.
- R. F. Laine and A. Krull, et. al., Imaging in focus: An introduction to denoising bioimages in the era of deep learning, Int. J. Biochem. Cell Biol., 2021, 140, 106077 CrossRef CAS PubMed.
Footnote |
| † Electronic supplementary information (ESI) available. See DOI: https://doi.org/10.1039/d3lc00959a |
| This journal is © The Royal Society of Chemistry 2024 |