Mg separation from samples with very high Ca/Mg ratios for Mg isotope analysis
Received
23rd July 2024
, Accepted 2nd October 2024
First published on 3rd October 2024
Abstract
Samples with very high Ca/Mg ratios present challenges for measuring their Mg isotope ratios. Here, we present an efficient method to separate Mg from samples with high Ca/Mg matrices, which also allows for quantitative separation of Sr, Ca and K. The method comprises a three-step chromatographic separation using DGA and AG50W-X12 (200–400 mesh) cation exchange resin. By utilising the automated sample purification system prepFAST MC™ for two of the three separations, the labour is substantially minimised. This analytical approach results in a quantitative Mg yield and a pure Mg solution, with other cations reduced to below the limit of detection (<53 ng mL−1). We demonstrate the efficacy of this method using a set of geochemical reference materials with Ca/Mg ratios ranging from 1.32 to 1271 mol mol−1. This approach enhances sample throughput and ensures high-quality separations in carbonate samples characterised by high Ca/Mg ratios.
Introduction
Magnesium (Mg) is a major element in the Earth's crust and the second most abundant cation in the ocean, and participates in key geochemical cycles at the Earth's surface. To trace processes such as rock weathering and diagenesis, Mg isotopes are a widely used tool and the main archives for them are carbonates. In speleothems they are used for studies of climate change in terrestrial settings,1,2 in dolostones or dolomite-rich carbonates they serve as tracers for rock weathering, seawater chemistry and diagenesis.1,3–11 Mg isotope variations in biogenic carbonates can also be used as proxies to study palaeoceanographic changes.3,12–21
Mg is closely linked to the carbon cycle due to processes like weathering of minerals and precipitation of carbonates and clays in the ocean, which are major controlling factors of both elements at the Earth's surface.22 Because of this connection, Mg isotope analysis has gained particular interest and may provide valuable insights into the climatic past. Biogenic carbonates can record seawater Mg isotope ratios and thus serve as valuable archives for δ26Mg (the normalized 26Mg/24Mg isotope ratio) of paleo-seawater and reveal the causes of the secular shift in Ca/Mg during the Cenozoic.15,20,21
The low Mg concentrations in most carbonate minerals challenge precise and accurate Mg isotope ratio analysis. Residual matrices and incomplete recovery of Mg can introduce significant bias into the measurements.5 In dolomite (approx. 13 mol%) and in high-Mg calcite (>4 mol%) Mg is a major constituent23 and poses no analytical challenge. These analyses are routinely conducted with a single-step chromatographic separation using mostly the AG50W-X12 resin. However, in low-Mg calcite Mg occurs as minor element (<4 mol%) and in aragonite only in trace amounts (<0.5 mol%) creating the necessity for a different separation routine. Various chromatographic separation techniques have been developed over the years using different cation exchange resins. The most commonly used cation exchange resin for Mg is AG50W-X12 from Bio-Rad. It is employed either in a single-step separation1,24,25 or multiple-step separations.3,26 Some studies have used AG50W-X8 (ref. 5 and 27) or AG MP-50.18 Others have employed AG50W-X12 in multiple-step separations in combination with other resins, such as AG50W-X8,4,28 AG MP-1M29 or DGA (Triskem).30
These methods are only partially suitable for samples with a very high Ca/Mg ratio as they are prone to a non-quantitative collection of Mg if Ca is to generously collected. Recently, the DGA resin has been used in the purification of Mg and Ca25,30 because it binds Ca and Sr, but not Mg. It also does not bind other elements such as K and Na as shown in the detailed overview of partition coefficients provide by Pourmand and Dauphas (2010) (ref. 31). We report a development of the method from Bao et al., 2020 (ref. 30), which minimises labour by using the ESI prepFAST MC™ automatic sample purification system. Their method consists of two manually conducted chromatographic separations using DGA and AG50W-X12 and was tested only for samples with a lower Ca/Mg ratio than that of carbonates. We use the prepFAST MC™ system from ESI for the separation with the DGA resin. Benefits of this system are the minimisation of labour, an improvement of reproducibility, and an enhanced sample throughput.
Material and method
Material
We processed several carbonate reference materials with predominantly high Ca/Mg ratios ranging from 1.32 to 1271 mol mol−1. For some reference materials, the Mg isotope ratios are known; for the others, they are reported here for the first time. The reference materials used include the limestones JLs-1 (Geological Survey of Japan, GSJ), IAEA-B7 (International Atomic Energy Agency, IAEA), and Cal-S (Centre de Recherches Petrographiques et Geochemique, France, CRPG); the dolomite JDo-1 (GSJ); two giant clams Tridacna gigas JCt-1 (GSJ) and EN-1 (United States Geological Survey, USGS); the coral Porites sp. JCp-1 (GSJ); the carbonatite standard COQ-1 (USGS); and the pure calcium carbonate standard BAM-RS3 (Bundesanstalt für Materialforschung und -prüfung (BAM), Germany). Table 1 lists the processed reference materials with their published Ca/Mg ratios and δ25Mg and δ26Mg values.
Table 1 All processed reference materials with their respective literature Ca/Mg ratios and their Mg isotope ratios. BAM-RS3 and IAEA-B7 have no published δ25Mg and δ26Mg values
| Standard |
Material |
Ca/Mg (mol mol−1) |
δ
25Mg (‰ DSM3) |
2s |
δ
26Mg (‰ DSM3) |
2s |
Reference |
|
Same ratio as JCt-1 assumed. If available, values were obtained from GeoReM.
|
| BAM-RS3 |
Calcium carbonate |
1271 |
|
|
|
|
35
|
| JCt-1 |
Tridacna gigas
|
740 |
−1.72 |
0.01 |
−3.37 |
0.01 |
35
|
| EN-1 |
Tridacna gigas
|
740a |
−2.23 |
0.02 |
−4.39 |
0.02 |
32
|
| JCp-1 |
Porites sp. |
239 |
−1.03 |
0.02 |
−1.96 |
0.04 |
35
|
| IAEA-B7 |
Limestone |
131 |
|
|
|
|
33
|
| Cal-S |
Limestone |
109 |
−2.25 |
0.11 |
−4.37 |
0.14 |
35
|
| JLs-1 |
Limestone |
65 |
−1.86 |
0.05 |
−3.60 |
0.07 |
32 and 35 |
| COQ-1 |
Carbonatite |
28 |
−0.25 |
0.04 |
−0.50 |
0.06 |
27 and 34 |
| JDo-1 |
Dolomite |
1.32 |
−1.23 |
0.09 |
−2.35 |
0.15 |
35
|
Sample preparation
Depending on their magnesium concentration, a total of 0.23–27.38 mg of solid sample was processed, corresponding to 3.12–26 μg Mg. The samples were dissolved in 1.5 mL HNO3 (2 mol L−1) and centrifuged to check for possible solid. In no case residues were observed. An aliquot of 0.5 mL was used for concentration measurement by ICP-OES. The only standard that was digested differently is the carbonatite COQ-1 because it did not dissolve completely in HNO3. It was additionally treated with double-distilled HNO3 (14 mol L−1) + HF (23 mol L−1) and heated up to 120 °C for 15 hours. Afterwards it was treated with double-distilled HCl (11 mol L−1) until it dissolved completely. For the standard JCp-1, three replicates were processed and for BAM-RS3, four replicates were processed.
Chromatographic separation
The separation of elements is conducted with a three-step cation-exchange chromatography. The first two separations serve for the removal of the vast majority of Ca. This is done by using the DGA resin (50–100 μm) in the automated chromatographic system prepFAST MC™, which performs the chromatographic separation automatically and runs each sample over a single column consecutively. Acids, volumes, and flow rates can be adjusted for each method, allowing for precise separation. The samples are loaded in 1 mL HNO3 (2 mol L−1) onto 3 mL of resin (column length: 8 cm; diameter: 0.7 cm). Mg is eluted with the loading volume and 3 mL HNO3 (2 mol L−1). This fraction also contains K and Na, as well as Al, Mn, Rb and Ba. Sr is eluted with 10 mL HNO3 (6 mol L−1), followed by Ca that is eluted with 8 mL HCl (0.05 mol L−1) (Fig. 1A). Table 2 lists the acid volumes and flow rates used. The chromatographic separation produces the following blanks in the respective fraction in which they were collected: Mg: (0.2 ± 0.07) ng, K: (4 ± 0.7) ng, Sr: (0.06 ± 0.03) ng and Ca: (40 ± 23) ng. Because Mg does not bind to the resin, it simply washes through, leading to a yield of 100%. Even though when the Mg amounts are minimized to a few micrograms to keep the total cations loaded low, the high Ca/Mg ratio of carbonates still causes a breakthrough of Ca. Approx. 40% of the cation exchange capacity of the DGA resin (0.45 meq) is used when 3–26 μg Mg of an aragonite sample are processed. The repetition of this first step overall removes 99.96% of the Ca which results in an overall decrease of Ca/Mg by roughly a factor of 1000. Fig. 1B shows the elution profile of the second separation. Between the two separations the samples are dried down and redissolved in 1 mL HNO3 (2 mol L−1). After the second separation, the samples are dried and redissolved in 200 μL HNO3 (1 mol L−1). The third chromatographic separation step serves to separate the remaining cations, in aragonite predominantly Na and K that have relatively high abundances (K/Mg: 40–90 mmol mol−1; Na/Mg: 4.4–19 mol mol−1). This is achieved by a manual separation in a clean lab using columns filled with 1.2 mL of AG50W-X12 (200–400 mesh) resin (column length: 6.1 cm; diameter: 0.5 cm). The precleaned sample of 0.23–27 mg carbonate uses approx. 0.5% of the cation exchange capacity (2.5 meq). The samples are loaded onto the column and flushed with 23 mL HNO3 (1 mol L−1) to release Na. The following 8 mL of HNO3 (1 mol L−1) contain the K fraction (Fig. 2). The next millilitre is collected separately to monitor possible tailing of K and Mg (“pre-Mg” fraction). Mg is then collected in the following 9 mL HNO3 (2 mol L−1). One millilitre is added and collected separately to monitor possible Mg tailing at the end of the Mg elution peak (“post-Mg” fraction).
 |
| | Fig. 1 Elution profiles of aragonite (JCp-1) processed over the DGA resin using the automated prepFAST MC™ system (conditions summarised in Table 2). (A): The first chromatographic step separates Mg, Sr and Ca, where the Ca/Mg ratio is reduced from 240 mol mol−1 to about 5 mol mol−1. The usage of a high fraction of the exchange capacity (approx. 40%), leads to Ca breakthrough and elution with the Mg fraction. (B): The repeated procedure further decreases the Ca/Mg ratio to approx. 0.26 mol mol−1. Sr is quantitatively separated in the first pass. | |
Table 2 Volumes and flow rates of the chromatographic separation with the DGA resin using the prepFAST MC™ system
| Step |
Acid |
Load and dispense volume (mL) |
Load and dispense rate (mL min−1) |
| Conditioning |
2 mol per L HNO3 |
5 |
2 |
| Load |
2 mol per L HNO3 |
1 |
1 |
| Mg, Na, K |
2 mol per L HNO3 |
3 |
2 |
| Sr |
6 mol per L HNO3 |
10 |
2 |
| Ca |
0.05 mol per L HCl |
8 |
2 |
| Wash |
0.05 mol per L HCl |
10 × 2 |
10 × 2 |
 |
| | Fig. 2 Elution profile of the chromatographic separation of a K–Mg solution (1![[thin space (1/6-em)]](https://www.rsc.org/images/entities/char_2009.gif) :1) with the AG50W-X12 (200–400 mesh) resin. Bao et al., 2020 have shown, that Na elutes within the first 20 mL. :1) with the AG50W-X12 (200–400 mesh) resin. Bao et al., 2020 have shown, that Na elutes within the first 20 mL. | |
The column is then cleaned with 12 mL HCl (6 mol L−1). Fig. 2 shows an elution profile of a solution containing each 2 μg Mg and K separated using AG50W-X12. This third separation also removes any remaining Ca, further purifying the sample. In this separation we achieve Mg yields of (99.6 ± 0.2)% to (100 ± 0.2)%. The uncertainty is assumed based on the yields of the repeated measurements of JCp-1. The pre- and post-Mg fractions contain <2.5 ng Mg. The K fraction has an average blank of about (44 ± 12) ng K and blanks in the Mg fraction average (6 ± 7) ng Mg. Following chromatographic separations, samples are dried down and redissolved in 3 mL HNO3 (0.32 mol L−1), of which a 1 mL aliquot is used to determine the Mg concentration by ICP-OES. The complete rundown of the three chromatographic separations is shown in Tables 2 and 3.
Table 3 Summary of volumes and acids used for the manually conducted chromatographic separation with AG50W-X12
| Resin |
Volume (mL) |
Acid |
Molarity (mol L−1) |
Comment |
| AG50W-X12 (mesh 200–400) |
5 |
HNO3 |
1 |
Conditioning |
| 0.2 |
HNO3 |
1 |
Sample load |
| 23 |
HNO3 |
1 |
Wash |
| 8 |
HNO3 |
1 |
K fraction |
| 1 |
HNO3 |
1 |
“Pre-Mg” |
| 9 |
HNO3 |
2 |
Mg fraction |
| 1 |
HNO3 |
2 |
“Post-Mg” |
| 5 |
MQ-H2O |
|
Wash |
| 12 |
HCl |
6 |
Wash |
Mg isotope measurement
Mg isotope ratios were determined in low resolution mode on a Thermo Scientific Neptune Plus™ multicollector inductively coupled plasma mass spectrometer (MC-ICP-MS) in the Geochemistry Department at the University of Göttingen. Samples and the bracketing standard DSM-3 were diluted to 0.25 μg per mL Mg in HNO3 (0.32 mol L−1). Concentrations were matched to within 10%. Sample solutions were nebulised with a microconcentric PFA nebuliser with an effective uptake rate of 70 μL min−1 and the aerosol was dried using an APEX-2G (Elemental Scientific Inc.). Measurements were done using a Ni sample cone and H type skimmer cone. Intensities of 24Mg, 25Mg and 26Mg were measured in Faraday cups connected to 1011 Ω resistors (other settings listed in Table 4). Under these conditions a sensitivity of 16 V 24Mg per 1 μg per mL Mg was achieved. To correct for instrumental mass fractionation and drift, we applied the sample-standard-bracketing method using DSM-3 as bracketing standard. Blank measurements were performed before and after every two samples. The blank contributed <0.28% of the signal intensity. Instrumental drift in the measurement session (13 hours) amounted only to 0.36‰ and 0.64‰ for δ25Mg and δ26Mg. The introduction of non-purified samples could impact the accuracy of δ26Mg values. A significant amount of matrix elements would lead to a mismatching matrix with the bracketing standard, resulting in variable mass bias, the introduction of Ca leads to an isobaric interference of doubly charged 48Ca2+ on 24Mg. However, due to the low abundance of the 48Ca isotope (0.187%) and low formation rates of doubly charged Ca ions (0.1%),32 even a relatively high concentration of residual Ca in the purified solutions, e.g. 25 μg mL−1 (corresponding to a Ca/Mg ratio of 0.1) would result in a bias of only 0.002‰ and can therefore be neglected.
Table 4 Settings of the MC-ICP-MS and Apex 2G in the analytical session
| Inlet system |
APEX 2G |
| Cool gas [L min−1] |
16 |
Ar sweep [mL min−1] |
323 |
| Auxiliary gas [L min−1] |
0.8 |
Spraychamber [°C] |
140 |
| Sample gas [L min−1] |
0.9 |
Peltier cooler [°C] |
3 |
|
Z [mm] |
1.55 |
|
|
Results
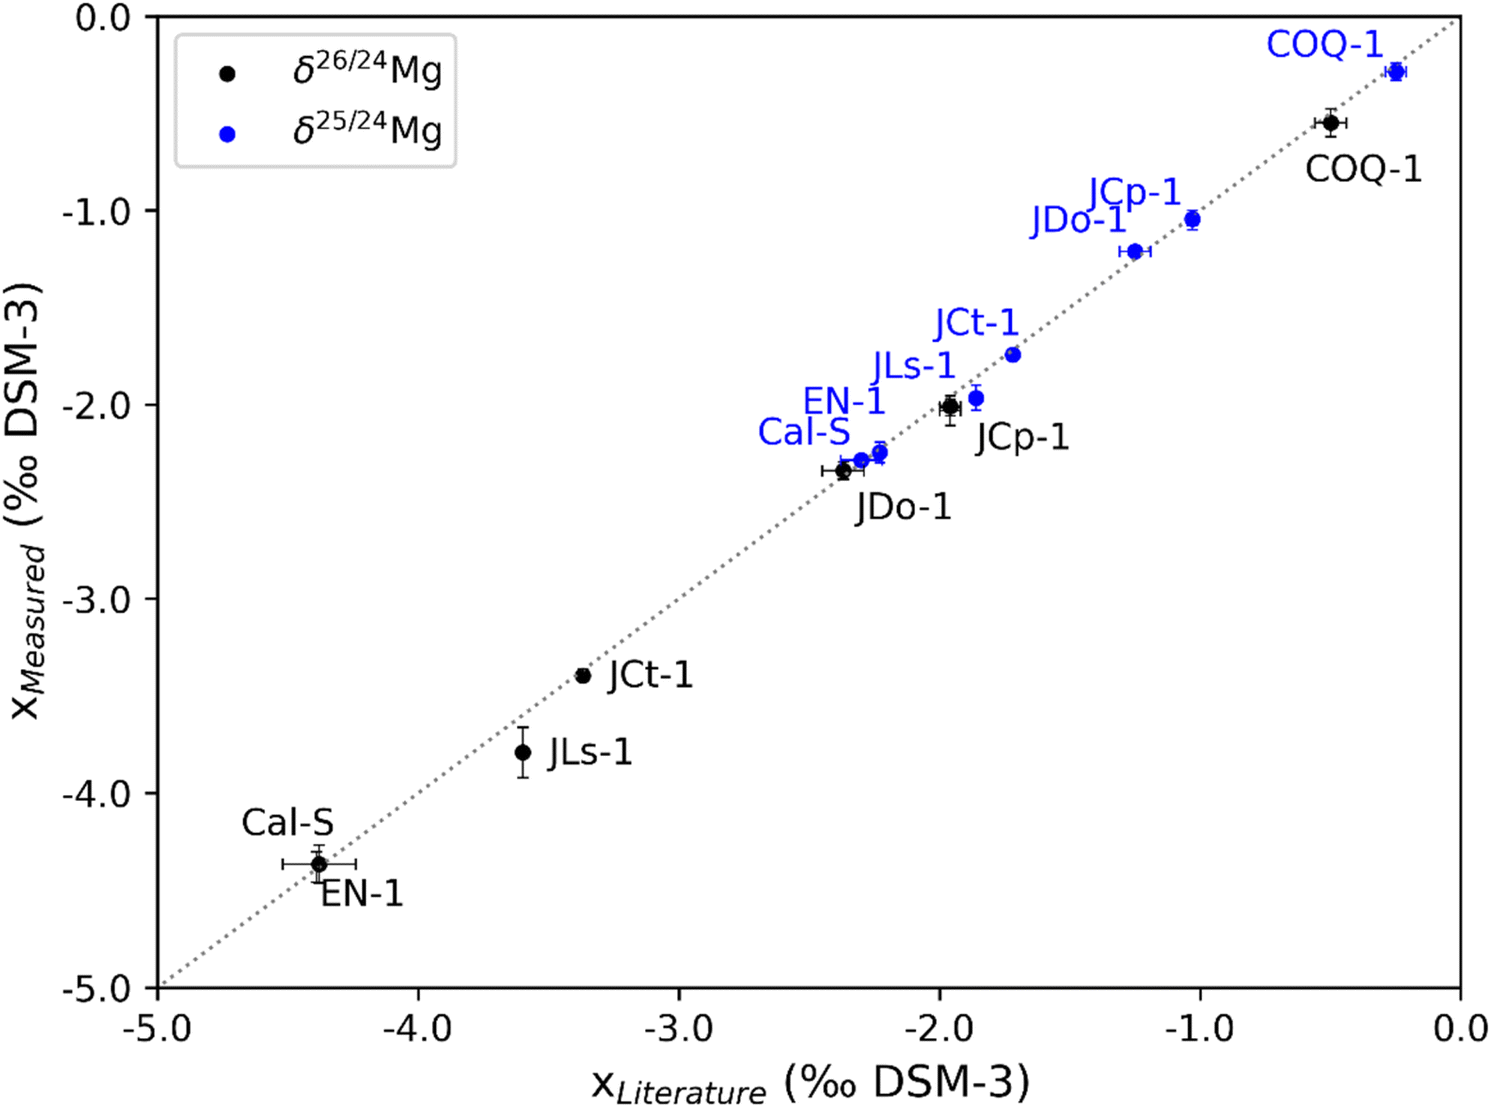
The presented purification process for Ca-rich samples yields pure solutions. Following chromatography, all elements except Mg yielded non-detectable concentrations. To determine Mg/element ratios for those samples, the limit of detection (LOD: blank + three times the standard deviation) was considered as the maximum concentration. The detection limits for the analysis were 15 ng per mL Ca, 1 ng per mL Mg, 0.1 ng per mL Sr, 53 ng per mL Na and 9.7 ng per mL K. We show the resulting Mg-to-element ratios that decreased significantly during the chromatographic separation (Fig. 3). Ca/Mg and Sr/Ca decreased by roughly five orders of magnitude. Na/Mg and K/Mg ratios were lowered by approx. 1–3 orders of magnitude. The isotope ratios of the analysed standards (Table 5) yield identical δ-values compared to published values (Fig. 4).
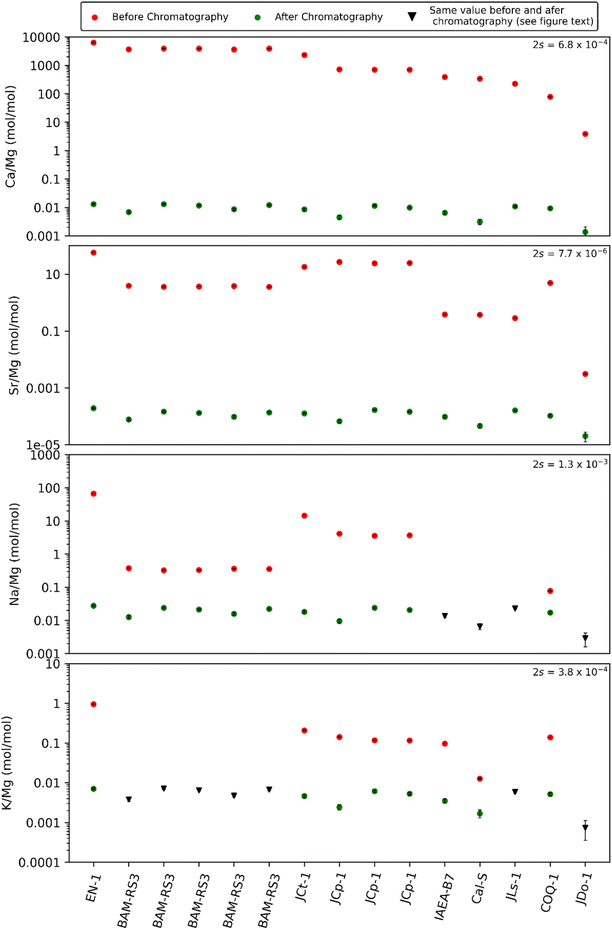 |
| | Fig. 3 Mg/element ratios of the standards before and after all three chromatographic separations. Concentration measurements were conducted using ICP-OES. After chromatography all elements other than Mg occur at concentrations below LOD. Therefore, the Mg/element ratios are calculated using the LOD. In some standards the Na and K concentrations are <LOD before chromatography; these are shown as black triangles. | |
Table 5 Results of the Mg isotope ratio measurements. The standards BAM-RS3 and JCp-1 were digested and separated four and three times, respectively. N is the number of repeat measurements in the same analytical session
| Standard |
δ
25Mg (‰ DSM3) |
2s |
δ
26Mg (‰ DSM3) |
2s |
N
|
Mass (mg) |
Mg (μg) |
Mg recovery (%) |
δ
25MgLit.a (‰ DSM3) |
2s |
δ
26MgLit.a (‰ DSM3) |
2s |
|
For references to the literature values see Table 1.
|
| BAM-RS3 |
−1.51 |
0.05 |
−2.88 |
0.06 |
4 |
17.38 |
3.13 |
99.6 ± 0.2 |
|
|
|
|
|
|
−1.60 |
0.01 |
−3.04 |
0.04 |
4 |
19.73 |
3.55 |
99.6 ± 0.2 |
|
|
|
|
|
|
−1.59 |
0.02 |
−3.05 |
0.07 |
4 |
26.91 |
4.84 |
99.7 ± 0.2 |
|
|
|
|
|
|
−1.62 |
0.02 |
−3.12 |
0.06 |
4 |
18.68 |
3.36 |
99.6 ± 0.2 |
|
|
|
|
| JCt-1 |
−1.74 |
0.03 |
−3.40 |
0.03 |
4 |
14.17 |
4.52 |
99.7 ± 0.2 |
−1.72 |
0.01 |
−3.37 |
0.01 |
| EN-1 |
−2.25 |
0.05 |
−4.38 |
0.08 |
4 |
26.50 |
2.79 |
99.5 ± 0.2 |
−2.23 |
0.02 |
−4.39 |
0.02 |
| IAEA-B7 |
−2.34 |
0.02 |
−4.50 |
0.06 |
4 |
3.57 |
6.58 |
99.8 ± 0.2 |
|
|
|
|
| JCp-1 |
−1.05 |
0.05 |
−2.03 |
0.08 |
4 |
8.30 |
8.00 |
99.8 ± 0.2 |
−1.03 |
0.02 |
−1.96 |
0.04 |
|
|
−1.04 |
0.03 |
−2.02 |
0.04 |
4 |
3.23 |
3.12 |
99.6 ± 0.2 |
−1.03 |
0.02 |
−1.96 |
0.04 |
|
|
−1.04 |
0.02 |
−2.01 |
0.02 |
4 |
3.87 |
3.73 |
99.6 ± 0.2 |
−1.03 |
0.02 |
−1.96 |
0.04 |
| Cal-S |
−2.29 |
0.02 |
−4.37 |
0.10 |
4 |
5.80 |
12.80 |
99.9 ± 0.2 |
−2.25 |
0.11 |
−4.37 |
0.14 |
| JLs-1 |
−1.97 |
0.06 |
−3.79 |
0.13 |
4 |
1.13 |
4.14 |
99.6 ± 0.2 |
−1.86 |
0.05 |
−3.60 |
0.07 |
| COQ-1 |
−0.29 |
0.05 |
−0.55 |
0.07 |
4 |
1.97 |
14.23 |
99.7 ± 0.2 |
−0.25 |
0.04 |
−0.50 |
0.06 |
| JDo-1 |
−1.21 |
0.01 |
−2.34 |
0.05 |
4 |
0.23 |
25.99 |
100 ± 0.2 |
−1.23 |
0.09 |
−2.35 |
0.15 |
 |
| | Fig. 4
δ
26Mg and δ25Mg values of the measured standards plotted against published values. Error bars show the 2s analytical repeatability. | |
Mg isotope ratios for the standards IAEA-B7 and BAM-RS3 are reported here for the first time. We report the 2s analytical repeatability of measurements from one analytical session for 1 to 4 digestions of sample material ranging from 0.23 to 26.91 mg, containing 3.12 to 25.99 μg Mg (see Table 5). IAEA-B7 was measured at δ25MgDSM3 = (−2.34 ± 0.02)‰ and δ26MgDSM3= (−4.50 ± 0.06)‰ (1 digestion of 3.57 mg). BAM-RS3 was measured at an average δ25MgDSM3 = (−1.58 ± 0.02)‰ (SE) and a δ26MgDSM3 of (−3.02 ± 0.04)‰ (SE) (N = 4).
Discussion
The presented method for chromatographic Mg separation from calcium carbonates allows quantitative Mg recovery and a high degree of purification. The Mg isotope ratios of the standards agree with the published values within the analytical reproducibility (Fig. 4A), except for the JLs-1, which we measured with a deviation of (0.19 ± 0.06)‰ δ26Mg. An explanation for this deviation might be that either the reference value or our value is biased due to Mg-loss or an elevated column blank. The AG50W-X12 resin used for the separation is prone to the loss of isotopically light Mg, when the Mg-peak is cut-off too early, causing a shift towards higher δ26Mg values, because of isotopic fractionation on AG50W-X12 (ref. 3 and 32) releases 26Mg first. The standard BAM-RS3 was measured with four replicates. One out of the four analyses show a deviation that exceeds the analytical reproducibility of typically (−1.61 ± 0.03)‰ δ25Mg and (−3.07 ± 0.07)‰ δ26Mg. One possible explanation is that this standard is not homogenous in Mg isotopes on this sample size (17.38 to 26.91 mg). Alternatively, an undetected contamination of Mg could have biased the analysis. This highlights that the work with low Mg amounts is sensitive to procedural blanks and hence requires careful handling. The cumulative procedural blanks sum up to (6.2 ± 7.07) ng. We note that high purity of the separation improves the analytical results by allowing very steady instrumental mass fractionation.
Conclusion
The use of the automated prepFAST MC™ system minimises labour substantially and provides an efficient way to remove the bulk Ca from calcium carbonate samples. Additionally, the automated system allows for a reduction of operator-induced errors and allows collecting the Sr fraction from the same aliquot. Mg, Ca and Sr blanks are very low despite repeated usage of the same resin batch (200 times). The reproducibility of Mg isotope ratios in separate digestions, each containing <8 μg Mg demonstrates the reliable and precise determination of Mg isotope ratios in calcium carbonate.
Data availability
The data supporting this article have been included in the main article.
Conflicts of interest
The authors declare no conflict of interest.
Notes and references
- A. Galy, M. Bar-Matthews, L. Halicz and R. K. O'Nions, Earth Planet. Sci. Lett., 2002, 201, 105–115 CrossRef.
- A. Immenhauser, D. Buhl, D. Richter, A. Niedermayr, D. Riechelmann, M. Dietzel and U. Schulte, Geochim. Cosmochim. Acta, 2010, 74, 4346–4364 CrossRef.
- V. T. C. Chang, A. Makishima, N. S. Belshaw and R. K. O'Nions, J. Anal. At. Spectrom., 2003, 18, 296–301 RSC.
- A. Brenot, C. Cloquet, N. Vigier, J. Carignan and C. France-Lanord, Geochim. Cosmochim. Acta, 2008, 72, 5070–5089 CrossRef.
- F. Wombacher, A. Eisenhauer, A. Heuser and S. Weyer, J. Anal. At. Spectrom., 2009, 24, 627 RSC.
- M. S. Fantle and J. A. Higgins, Geochim. Cosmochim. Acta, 2014, 142, 458–481 CrossRef.
- A. Geske, R. H. Goldstein, V. Mavromatis, D. K. Richter, D. Buhl, T. Kluge, C. M. John and A. Immenhauser, Geochim. Cosmochim. Acta, 2015, 149, 131–151 CrossRef.
- M. S. Fantle, B. D. Barnes and K. V. Lau, Annu. Rev. Earth Planet. Sci., 2020, 48, 549–583 CrossRef.
- Z. Hu, Z. Shi, G. Li, Z. Xia, L. Yi, C. Liu and W. Li, Earth Planet. Sci. Lett., 2022, 595, 117755 CrossRef.
- D. Bi, S. Zhai, D. Zhang, X. Liu, A. Dong and X. Shi, J. Asian Earth Sci., 2024, 261, 105981 CrossRef.
- A. S. C. Ahm, C. J. Bjerrum, C. L. Blättler, P. K. Swart and J. A. Higgins, Geochim. Cosmochim. Acta, 2018, 236, 140–159 CrossRef.
- F. Teng, Rev. Mineral. Geochem., 2017, 82, 219–287 CrossRef.
- A. Sadekov, N. S. Lloyd, S. Misra, J. P. D’Olivo and M. McCulloch, Rapid Commun. Mass Spectrom., 2020, 34(23), e8918 CrossRef CAS.
- C. Saenger and Z. Wang, Quat. Sci. Rev., 2014, 90, 1–21 CrossRef.
- P. A. E. Pogge von Strandmann, J. Forshaw and D. N. Schmidt, Biogeosciences, 2014, 11, 5155–5168 CrossRef.
- D. Hippler, D. Buhl, R. Witbaard, D. K. Richter and A. Immenhauser, Geochim. Cosmochim. Acta, 2009, 73, 6134–6146 CrossRef.
- F. Wombacher, A. Eisenhauer, F. Böhm, N. Gussone, M. Regenberg, W. C. Dullo and A. Rüggeberg, Geochim. Cosmochim. Acta, 2011, 75, 5797–5818 CrossRef.
- T. Yoshimura, M. Tanimizu, M. Inoue, A. Suzuki, N. Iwasaki and H. Kawahata, Anal. Bioanal. Chem., 2011, 401, 2755–2769 CrossRef PubMed.
- F. Planchon, C. Poulain, D. Langlet, Y. M. Paulet and L. André, Geochim. Cosmochim. Acta, 2013, 121, 374–397 CrossRef.
- J. A. Higgins and D. P. Schrag, Earth Planet. Sci. Lett., 2015, 416, 73–81 CrossRef CAS.
- A. M. Gothmann, J. Stolarski, J. F. Adkins and J. A. Higgins, Geology, 2017, 45, 1039–1042 CrossRef.
- R. A. Berner, A. C. Lasaga and R. M. Garrels, Am. J. Sci., 1983, 283, 641–683 CrossRef.
-
M. E. Tucker and S. J. Jones, Sedimentary Petrology, John Wiley & Sons, 2023 Search PubMed.
- E. T. Tipper, A. Galy, J. Gaillardet, M. J. Bickle, H. Elderfield and E. A. Carder, Earth Planet. Sci. Lett., 2006, 250, 241–253 CrossRef.
- C. Zong, Z. Bao, X. Nie, Y. Zhang, K. Chen and H. Yuan, J. Anal. At. Spectrom., 2021, 36, 273–278 RSC.
- L. Ma, Y. Sun, Z. Jin, Z. Bao, P. Zhang, Z. Meng, H. Yuan, X. Long, M. He and K.-J. Huang, Geochim. Cosmochim. Acta, 2019, 259, 1–16 CrossRef.
- T. Gao, S. Ke, R. Li, X. Meng, Y. He, C. Liu, Y. Wang, Z. Li and J. Zhu, Rapid Commun. Mass Spectrom., 2019, 33, 767–777 CrossRef PubMed.
- Z. Wang, P. Hu, G. Gaetani, C. Liu, C. Saenger, A. Cohen and S. Hart, Geochim. Cosmochim. Acta, 2013, 102, 113–123 CrossRef.
- E. B. Bolou-Bi, N. Vigier, A. Brenot and A. Poszwa, Geostand. Geoanal. Res., 2009, 33, 95–109 CrossRef CAS.
- Z. Bao, C. Zong, K. Chen, N. Lv and H. Yuan, Int. J. Mass Spectrom., 2020, 448, 116268 CrossRef CAS.
- A. Pourmand and N. Dauphas, Talanta, 2010, 81(3), 741–753 CrossRef.
- M. Tatzel, J. Vogl, M. Rosner, M. J. Henehan and T. Tütken, Anal. Chem., 2019, 91, 14314–14322 CrossRef PubMed.
- S. Tonarini, M. Pennisi, A. Adorni-Braccesi, A. Dini, G. Ferrara, R. Gonfiantini, M. Wiedenbeck and M. Gröning, Geostand. Newsl., 2003, 27, 21–39 CrossRef.
- J. S. Ray, K. Pande, R. Bhutani, A. D. Shukla, V. K. Rai, A. Kumar, N. Awasthi, R. S. Smitha and D. K. Panda, Contrib. Mineral. Petrol., 2013, 166, 1613–1632 CrossRef.
-
GeoReM Database, http://georem.mpch-mainz.gwdg.de/.
|
| This journal is © The Royal Society of Chemistry 2024 |
Click here to see how this site uses Cookies. View our privacy policy here. 
 Open Access Article
 This Open Access Article is licensed under a
  * and
Michael
Tatzel
* and
Michael
Tatzel