
The mechanism of sample composition variation in the selective laser melting process based on the laser-induced breakdown spectroscopy and Raman system detection
Jingjun
Lin
 a,
Yao
Li
a,
Xiaomei
Lin
*a and
Changjin
Che
*b
a,
Yao
Li
a,
Xiaomei
Lin
*a and
Changjin
Che
*b
aChangchun University of Technology, Changchun, Jilin 130012, China. E-mail: 187049860@qq.com
bBeihua University, Jilin, Jilin 132013, China
First published on 21st November 2023
Abstract
We jointly applied laser-induced breakdown spectroscopy (LIBS) and Raman spectroscopy to microscopically detect the unavoidable, harmful residual trace metal oxides in the parts manufactured by the selective laser melting (SLM) process. The elemental and molecular compositions of 316L stainless steel (316L SS) powder and SLM-made parts were examined, and the intensity-normalized LIBS information reflected the atomic and ionic content variations during the process. The normalized LIBS intensities of Ni I 357.18 nm, Cr I 461.61 nm, and Mo I 338.58 nm lines from the SLM parts were found to be decreased by approximately 21.82%, 15.96%, and 4.11%, respectively, compared to those from the 316L SS powder. In particular, the normalized intensities of Mn II 348.29 nm and Fe II 518.68 nm lines from the SLM parts were increased by approximately 60.19% and 25.56%, respectively, compared to those from the 316L SS powder. Raman spectroscopy results indicated the presence of Fe3O4 (676 cm−1) and α-Fe2O3 (500 cm−1 and 1300 cm−1) oxides in the SLM parts; however, these oxides were not observed in the raw 316L SS powder. These oxides may cause a decrease in the surface tension and wetting ability of the metal melt pool, and in severe cases, the metal powder in the melt pool may not fully melt and cause the spherification phenomenon.
1 Introduction
Additive manufacturing (AM) is critical to the fourth industrial revolution (Industry 4.0). AM is an advanced manufacturing technology with a unique manufacturing strategy, which manufactures sophisticated parts with complex structures by depositing raw materials layer by layer or even particle by particle.1,2 AM is currently used in many cutting-edge fields, including aerospace,3–7 defense,8 marine industry,9 and medicine,10,11 and has a great potential for the future. Selective laser melting (SLM) is one of the AM processes, in which the raw metal powder is completely melted using a high-energy laser and rapidly cooled and shaped to form the required parts. SLM can produce fully dense parts with high precision and mechanical properties without post-processing.12 However, the SLM process involves several physical, thermal, and hydrodynamic phenomena. During the forming process, defects, such as sputtering, spheroidization, porosity, and cracking, may severely deteriorate the quality of the parts,13 which has led to an increasing number of studies on enhancing the performance and quality of SLM-made parts.At present, making defect-free and high-performance AM parts is one of the leading research topics, wherein most studies focus on improving the part performance by optimizing the SLM process parameters, including laser power,14–17 scanning speed,18–21 and scanning strategy.22–27 The effect of substrate preheating28–30 and heat treatment31 on the part has also been investigated. The variation in the elemental and molecular compositions of the AM powders and the made parts has attracted special interest in research. Spectroscopy has been employed to investigate the AM powder properties and monitor the AM process in real-time. Laser-induced breakdown spectroscopy (LIBS) is a real-time, online, remote, and non-destructive detection technique and has been applied in coal mining, metallurgy, pharmaceuticals, and other fields.32 The Lednev team introduced the LIBS technique in the AM studies by systematically and quantitatively investigating the variations in the elemental compositions of the raw metal powders and the made parts in the AM process.33–38 The coefficients of determination (R2) of the LIBS calibration curves for C and W were found to be 0.990 and 0.993, respectively, and the root mean square errors of the cross-validation (RMSECV) for C and W were 0.122 wt% and 1.3 wt%, respectively.34 They demonstrated that LIBS makes better detection on metal powders than X-ray fluorescence (XRF). Subsequently, they analyzed the plating of a tungsten carbide-reinforced 1560 nickel alloy manufactured by the coaxial laser melting technology. In which, LIBS combined with energy dispersive X-ray (EDX) spectroscopy provides a three-dimensional multi-element analysis of synthetic plating. By accumulating multiple laser spots, LIBS allows measurements at depths of up to ±2 μm.35
Raman spectroscopy, as a fingerprint spectroscopy is capable of detecting molecular vibrations39 and has also been applied to the detection of molecular structures in AM.40–43 In particular, Beyhaghi et al. demonstrate that Raman spectroscopy can be used to investigate the oxidation behavior of Inconel 718 (IN718) at different post-treatment temperatures.44
As is known, the unavoidable oxidation phenomenon during the SLM process hinders its development from reaching an even higher accuracy. The high temperature drives the raw metal powder to react with oxygen, water vapor, etc. to form metal oxides, which are harmful to the AM-made parts and greatly affect the forming quality. It may also decrease the metal melt pool wetting capacity,45,46 causing partial melting of the powder to generate the spherification phenomenon,47 or lead to loose interlayer bonding and low density in the AM parts by causing oxidation and balling in-between the layers during the SLM process. Therefore, real-time monitoring of the oxidation in the SLM process is important for the development of the SLM technology towards higher accuracy and quality. Unfortunately, there are few reports on the detection and monitoring of the oxidation products in the SLM process yet.
In this study, we explored the possibility of jointly using LIBS and Raman spectroscopy for the online monitoring of the oxidation behavior in the raw metal powders and made parts in the SLM process. Powder samples and SLM parts were prepared from the same 316L stainless steel (316L SS) powder. The elemental and molecular differences between the 316L SS powder samples and the SLM-made components were analyzed, and the metal oxides (Fe3O4 and α-Fe2O3) formed during the SLM process were detected. The crystal structure and the formation mechanism of these metal oxides were also studied.
2 Experiments and methods
2.1 Sample preparation
Table 1 shows the elemental compositions and contents of the 316L SS powder used in this study. The 316L SS powder was adhered to the double-sided tape (3M™ VHB™ 4910) and secured using slides. The SLM parts were printed and manufactured using the SLM equipment (iSLM150, China). Fig. 1(a) and (b) show the SLM and the powder samples.| C | Si | Mn | S | P | Cr | Ni | Mo | Fe |
|---|---|---|---|---|---|---|---|---|
| 0.03 | 1.0 | 2.0 | 0.03 | 0.045 | 16.0–18.0 | 10.0–14.0 | 2.0–3.0 | Bal. |
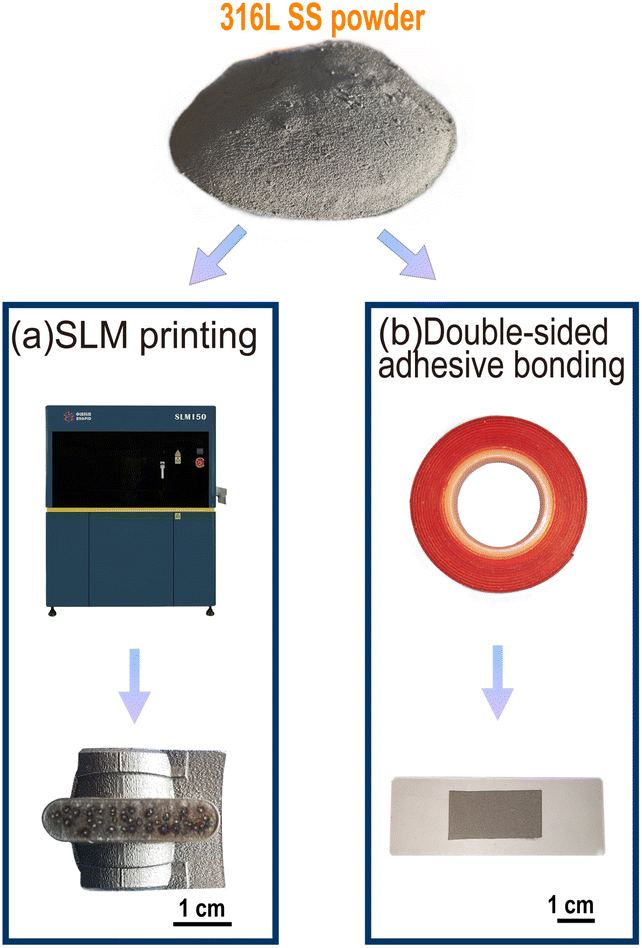 | ||
| Fig. 1 Two types of sample preparation for 316L SS powder. (a) Printing 316L SS powder onto the SLM parts and (b) sticking the 316L SS powder onto the double-sided adhesive. | ||
2.2 Experimental setup
Fig. 2 shows the schematic diagram of the LIBS-Raman system. The Raman spectra of SLM parts and powder samples were acquired in advance. The Raman signal was produced by excitation using a laser with an output power of 100 mW at the wavelength of 785 nm. A Raman spectrometer (Princeton HRS-300-S) with a CCD (Princeton PIXIS 256) was used to obtain the Raman signal. The spectral resolution was 0.07–0.10 nm, and the wavelength range was 200–1050 nm. The Raman signal was acquired using a 1200 G mm−1 grating, and each Raman spectrum had an exposure time of 120 s. The width of the slit was 150 μm during the Raman spectroscopy acquisition.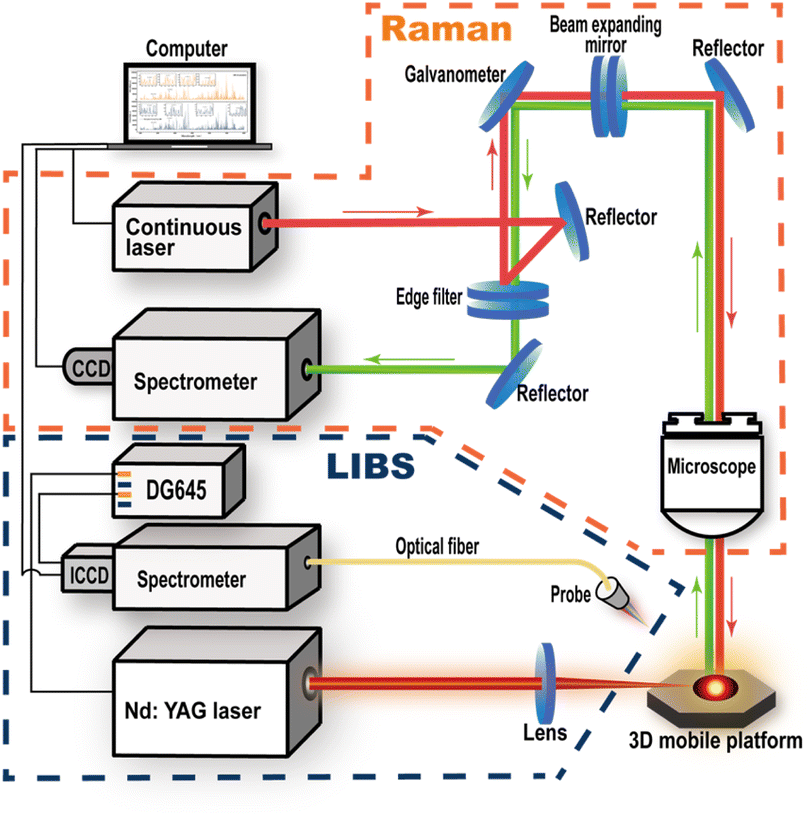 | ||
| Fig. 2 A schematic diagram of the LIBS-Raman system. | ||
The Q-Switched Nd:YAG laser (SLII-10, Continuum) used in the LIBS apparatus was operating at 1064 nm. The LIBS spectra were collected using a spectrometer (Me5000, Andor) equipped with an ICCD detector. The spectral range of the spectrometer was 200–975 nm. Each sample was subjected to LIBS measurements using a laser power of 50 mJ. A focusing lens with a 120 mm focal length was utilized. The laser was focused 2 mm below the surface of the sample. The LIBS spectra of the 316L SS powder samples and the SLM part samples were collected under the same experimental conditions. All the measurements were performed using a gate width of 15 μs and a delay time of 5 μs. We collected 80 LIBS spectra of the powder samples and 80 LIBS spectra of the SLM parts, all from different points. The LIBS spectra of the double-sided adhesive substrates were acquired to facilitate the removal of the substrate effects on the powder spectra. By removing the influence of the double-sided adhesive substrate, we finally selected 15 stable LIBS spectra of the powder. Subsequently, 15 spectra of the SLM parts with steady intensities were selected. Baseline corrections were made to both, the spectra of the 316L SS powder and SLM parts.
3 Results and discussion
3.1 LIBS spectral study of 316L SS powder and SLM parts
The LIBS spectra of the 316L SS powder and the SLM parts in the 300 to 600 nm range are shown in Fig. 3. The elements selected for comparison are labeled in the diagram, including Fe, Mn, Ni, Cr, and Mo. Because the Fe content accounts for approximately 69% of the 316L SS powder, its spectral peak predominates the spectrogram. As a result, the stable Fe I 383.42 nm line was selected as the normalization reference. The stable atomic (Ni I 357.18 nm, Cr I 461.61 nm, and Mo I 338.58 nm) and ionic (Fe II 518.68 nm and Mn II 348.29 nm) lines were chosen as indicators for comparison. To avoid errors caused by the consumption of the powder during the acquisition process, only the first half of the spectral lines were chosen. In Fig. 3, the spectrum section with the weaker peaks is enlarged.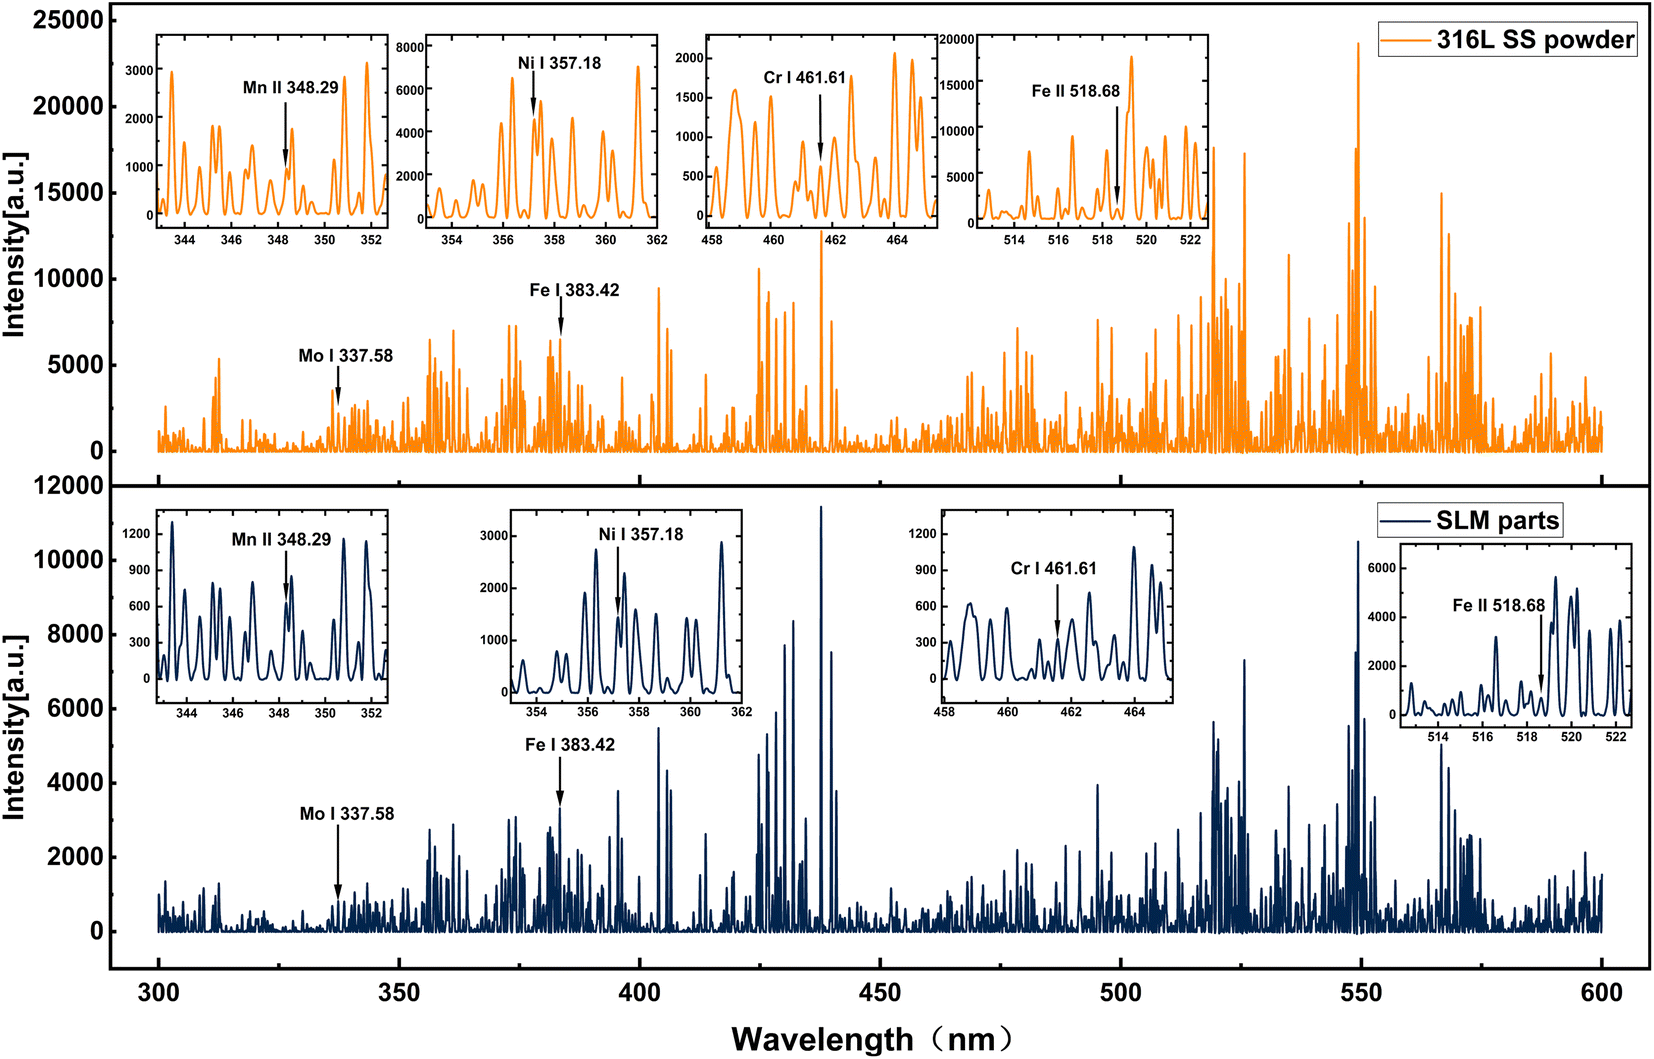 | ||
| Fig. 3 300–600 nm LIBS spectra of 316L SS powder and SLM parts. | ||
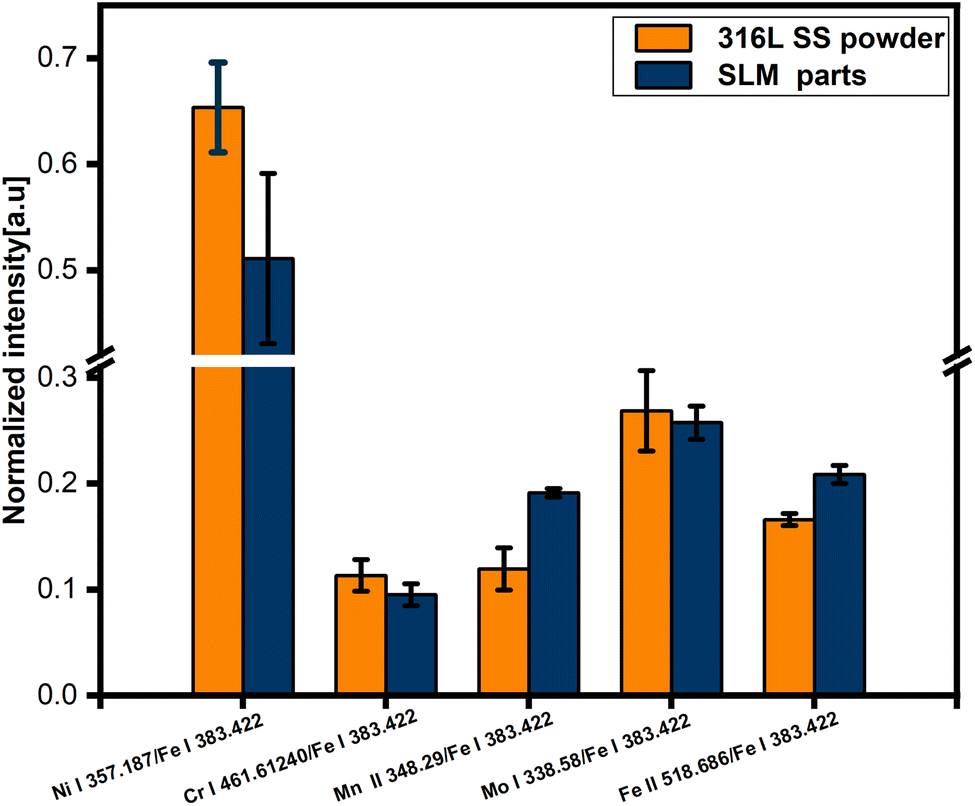
The ratio of the selected atomic lines (Ni I 357.18 nm, Cr I 461.61 nm, and Mo I 338.58 nm) and ionic lines (Fe II 518.68 nm and Mn II 348.29 nm) to the intensity-stabilized Fe I 383.42 nm line was used as the normalized intensity. As shown in Fig. 4, we found that the atomic line normalization intensity in the powder was higher than that in the formed part. However, the ion-line normalization intensity in the powder was lower than that in the formed part. Compared with that in the powder, the normalized intensities of Ni I 357.18 nm, Cr I 461.61 nm, and Mo I 338.58 nm lines in the SLM part decreased by approximately 21.82%, 15.96%, and 4.11%, respectively. The normalized intensity of the Mn II 348.29 nm and Fe II 518.68 nm lines increased by approximately 60.19% and 25.56%, respectively, in the SLM part than that in the powder. To explain this phenomenon, the plasma temperature was further evaluated utilizing the Boltzmann diagram.
 | ||
| Fig. 4 The standardized intensity of 316L SS powder and SLM parts. | ||
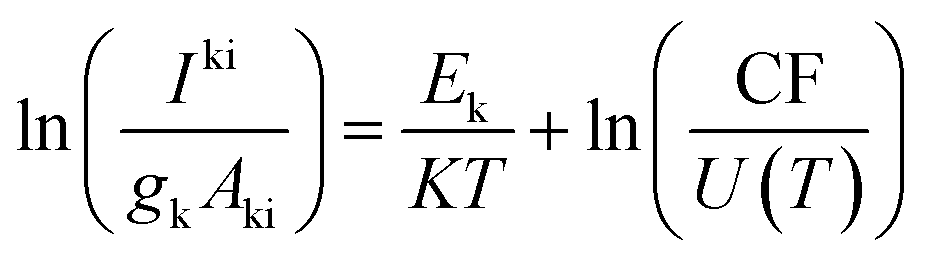
Plasma excitation temperatures were evaluated using Boltzmann plots of Fe I lines in different upper states, as shown in Fig. 5, and were calculated using eqn (1):
 | (1) |
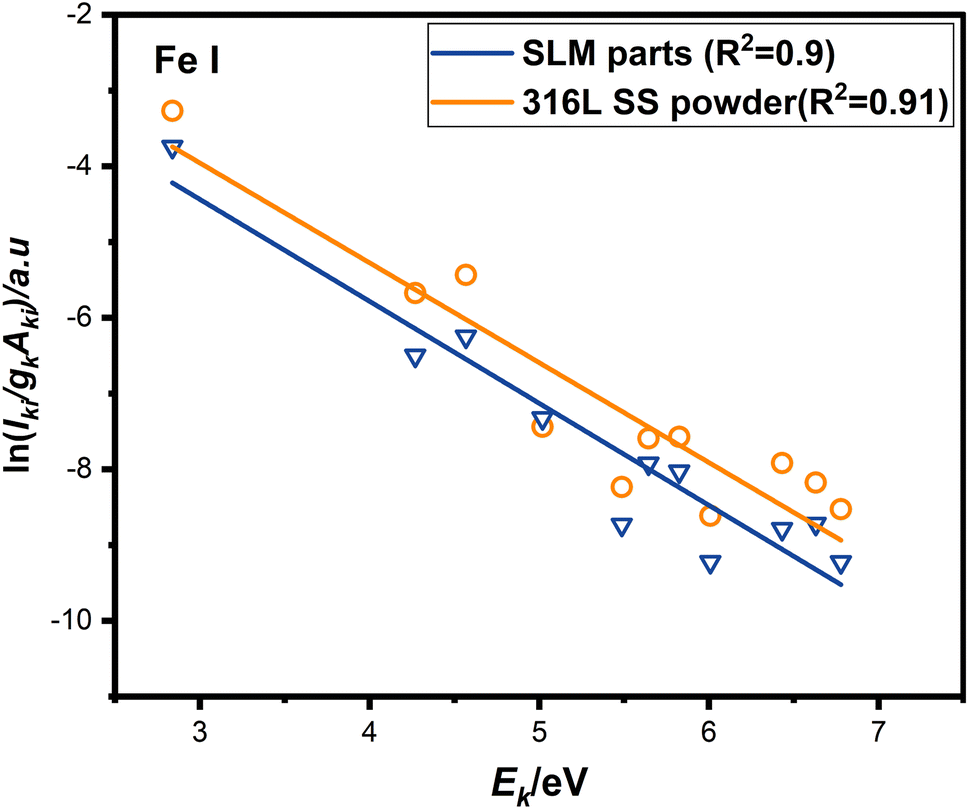 | ||
| Fig. 5 Boltzmann plots derived from raw line intensities of SLM parts and 316 L SS powder samples. | ||
The plasma temperatures of the SLM part and 316L SS powder were 8620 K and 8803 K, respectively. The plasma temperatures of the part and powder samples were similar for the same material. Therefore, the plasma temperature has a minor effect on the differences between the spectra of the SLM part and the 316L SS powder samples.
Based on the LIBS data, we speculate that the variation in the atomic and ionic contents causes the difference in the intensity of the spectral lines in the powder and in the formed part. In the SLM process, a small amount of oxygen and other impurities were present in the powder and the SLM-forming chamber, which chemically reacted with the metal in the high-temperature melt pool and resulted in a change in the elemental contents in the SLM part. Since LIBS cannot obtain molecular information, we needed to corroborate the LIBS results with molecular information from Raman spectroscopy.
3.2 Raman spectroscopy-based studies on molecular and microscopic morphologies
Raman spectroscopy is based on the interaction of light with chemical bonds and is a non-destructive analytical technique. It gives detailed information about the sample's chemical structure, phases, morphology, crystallinity, and molecular interactions. Raman spectroscopy was used to demonstrate the metal oxides and other molecules produced during the SLM process.Fig. 6 shows Raman spectra of the 316L SS powder and the SLM part. In the 316L SS powder, there is no sign of any metal oxides, as indicated by the Raman spectroscopy, which is because the oxygen content and other impurities were strictly controlled at very low levels during the production of the 316L SS powder and the storage under vacuum conditions. The peak at 676 cm−1 in the spectrum of the SLM part is attributed to the stretching vibration of the Fe–O bond in Fe3O4.48,49 Additionally, there are two other peaks associated with α-Fe2O3, located at 500 cm−1 and 1300 cm−1. The peak at 500 cm−1 is attributed to the A1g mode.50 The peak at 1300 cm−1 is a characteristic peak associated with two-magnon scattering of α-Fe2O3.51–53 Presumably, the low metal oxide content or the complexity of the SLM process led to the absence of any other distinctive peaks being excited.
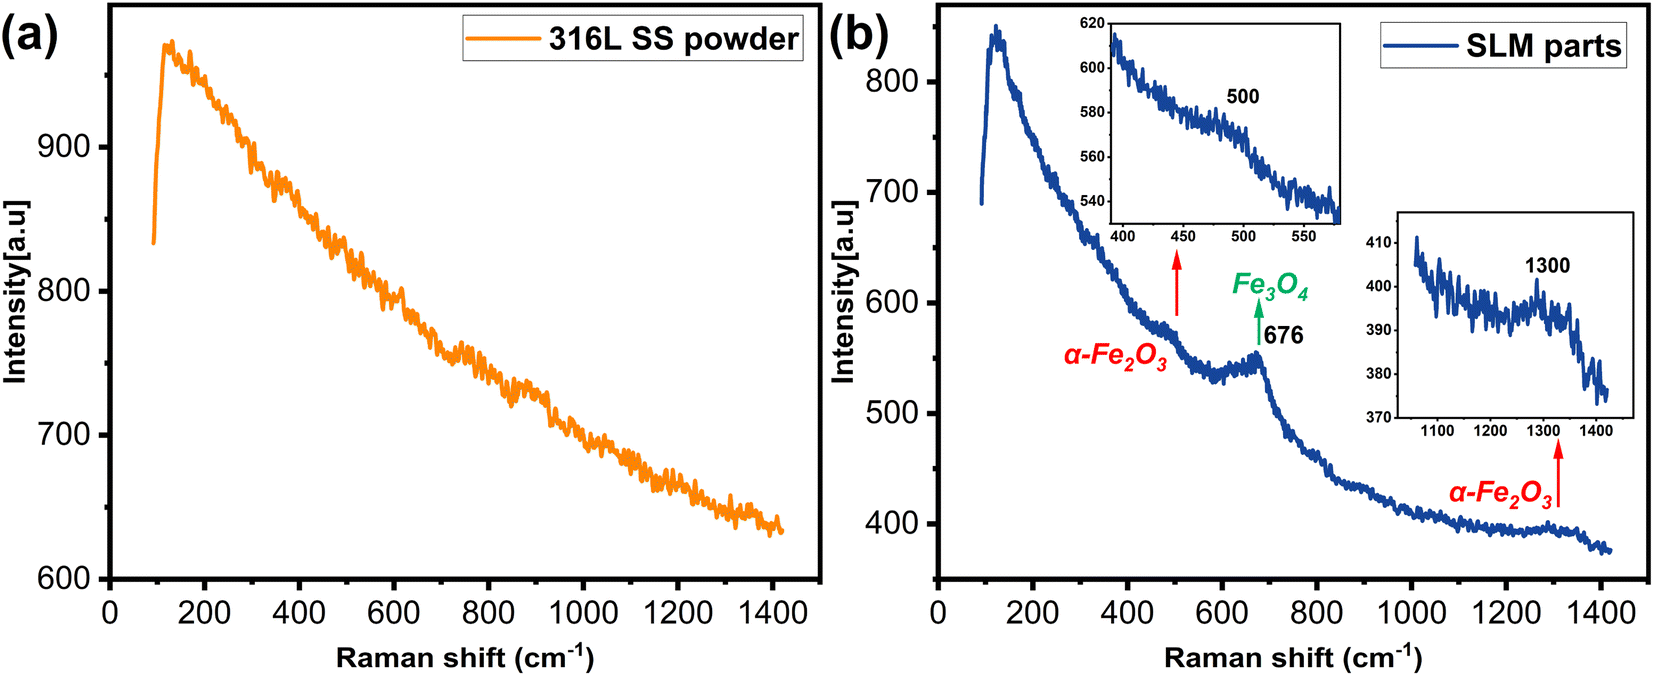 | ||
| Fig. 6 Raman spectra in the region of 100 to 1400 cm−1 of (a) SLM parts and (b) 316L SS powder. | ||
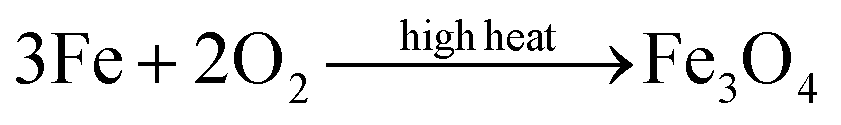
The formation of Fe3O4 by iron oxidation in the metal powder is based on the following equation:
 | (2) |
Then, Fe3O4 undergoes a phase change at a higher temperature above 400 °C to produce the weakly magnetic α-Fe2O3,54 part of which is kept unchanged in the fast cooling process. The chemical reaction equation is as follows:
 | (3) |
The crystal structures of Fe, Fe3O4, and α-Fe2O3 and the effect of the oxidation products on the microstructure of the SLM parts were investigated, as shown in Fig. 7. The monolithic iron exhibits a body-centered cubic crystal with a stable structure at room temperature. Due to the nature of metallic bonding, iron crystals are highly symmetrical and dense. Fe3O4 is an anti-spinel structure. The oxygen atoms are in a cubic, densely packed arrangement, with Fe2+ and Fe3+ ions filling the gaps in the dense packing of oxygen atoms. In the face-centered cubic lattice with tetrahedral and octahedral holes, Fe3+ ions occupy the tetrahedral voids and are randomly distributed in the octahedral gaps with Fe2+ ions. However, the α-Fe2O3 crystal is a space-grouped triangular corundum structure. It has a ferromagnetic sub-lattice that is arranged antiparallel along the c-axis of the crystal.43,55 The introduction of the oxygen atoms through oxidation will reduce the density of the SLM part and thus affect its performance.
 | ||
| Fig. 7 The transformation relationship between Fe, Fe3O4, and α-Fe2O3 and the crystal structure diagram. | ||
Micrographs of the 316L SS powder and the SLM parts were collected, as shown in Fig. 8. The surface of the formed part has a higher density and a flatter surface compared to the raw 316L SS powder, as shown in Fig. 8(a) and(b). The surface of the spherification phenomenon is randomly distributed with the unmelt metal spheres. The large voids between the spheres affect the surface quality of the formed parts, as shown in Fig. 8(c). In addition, the longitudinal profiling capabilities of LIBS were utilized. Micrographs of the interior of the crater produced by the LIBS laser were collected, as shown in Fig. 8(d). Spheroidization has been found within the LIBS crater. The spherification inside the part cannot be removed after the part is formed. Therefore, establishing a real-time LIBS and Raman monitoring system to simultaneously monitor the variation of the elements and molecules in the AM process is highly significant.
 | ||
| Fig. 8 Micrographs of 316L SS powder and SLM parts. (a) 316L SS powder under the 50× objective lens, (b) SLM formed part under the 50× objective lens, (c) surface of the formed part under the 20× objective lens, and (d) inside the LIBS crater under the 20× objective lens. | ||
Then, we can see that LIBS combined with the Raman spectroscopy can detect the harmful oxides such as Fe3O4 and α-Fe2O3 generated in the formed parts in the SLM process. These oxides reduce the surface tension and wettability of the metal melt pool. As a result, the powder cannot melt completely, leading to spherification. Other defects, such as holes and cracks, may also occur in severe cases.
4 Conclusion
This study analyzed the variation in the elemental and molecular compositions of 316L SS metal powder and the SLM parts made from it using the combined LIBS-Raman system. The elemental composition was analyzed using LIBS. The atomic line intensities of the SLM parts were reduced compared to those in the 316L SS powder. Conversely, the normalized intensity of the ion lines in the SLM parts increased. Raman spectroscopy confirmed the LIBS results. The characteristic vibrational Raman peaks associated with iron oxides of Fe3O4 (676 cm−1) and α-Fe2O3 (500 cm−1 and 1300 cm−1) were detected in the SLM parts, but not in the 316L SS powder. LIBS combined with Raman spectroscopy was able to detect the metal oxides produced in the SLM process. The crystal structure reveals that the oxides could have a detrimental effect on the melt pool.Understanding the microscopic changes in the SLM process and analyzing the mechanisms of the defect generation can help facilitate the production of defect-free using the SLM technology. A joint LIBS and Raman spectroscopy real-time detection system to monitor the variation in the elemental and molecular compositions during the SLM forming process is essential for the higher quality and performance of the SLM-formed products.
Author contributions
Jingjun Lin: methodology, writing – original draft, data curation. Yao Li: writing – review and editing, data curation. Xiaomei Lin: supervision, project administration, funding acquisition, writing – review and editing. Changjin Che: supervision.Conflicts of interest
All authors disclose no relevant relationships.Acknowledgements
This work was supported by Department of Science and Technology of Jilin Province of China (grant no. YDZJ202301ZYTS481), Department of Science and Technology of Jilin Province of China (grant no. 20220201032GX), Department of Science and Technology of Jilin Province of China (grant no. 20230402068GH), and National Natural Science Foundation of China (NSFC, no. 51374040).References
- U. M. Dilberoglu, B. Gharehpapagh, U. Yaman and M. Dolen, The Role of Additive Manufacturing in the Era of Industry 4.0, Procedia Manuf., 2017, 11, 545–554, DOI:10.1016/j.promfg.2017.07.148.
- A. Nazir, O. Gokcekaya, K. Md Masum Billah, O. Ertugrul, J. Jiang, J. Sun and S. Hussain, Multi-material additive manufacturing: A systematic review of design, properties, applications, challenges, and 3D printing of materials and cellular metamaterials, Mater. Des., 2023, 226, 111661, DOI:10.1016/j.matdes.2023.111661.
- R. Liu, Z. Wang, T. Sparks, F. Liou, and J. Newkirk, 13 - Aerospace applications of laser additive manufacturing, in Laser Addit. Manuf., ed. M. Brandt, Woodhead Publishing, 2017, pp. 351–371, DOI:10.1016/B978-0-08-100433-3.00013-0.
- R. Jones, N. Matthews, C. A. Rodopoulos, K. Cairns and S. Pitt, On the use of supersonic particle deposition to restore the structural integrity of damaged aircraft structures, Int. J. Fatigue, 2011, 33, 1257–1267, DOI:10.1016/j.ijfatigue.2011.03.013.
- R. Jones, N. Matthews, R. Green and D. Peng, On the potential of supersonic particle deposition to repair simulated corrosion damage, Eng. Fract. Mech., 2015, 137, 26–33, DOI:10.1016/j.engfracmech.2014.09.003.
- C. Hauser, Case Study: Laser Powder Metal Deposition Manufacturing of Complex Real Parts, TWI, 2014, https://docplayer.net/48458850-Case-study-laser-powder-metal-deposition-manufacturing-of-complex-real-parts.html Search PubMed.
- A. Kestilä, K. Nordling, V. Miikkulainen, M. Kaipio, T. Tikka, M. Salmi, A. Auer, M. Leskelä and M. Ritala, Towards space-grade 3D-printed, ALD-coated small satellite propulsion components for fluidics, Addit. Manuf., 2018, 22, 31–37, DOI:10.1016/j.addma.2018.04.023.
- C. M. McNulty, N. Arnas, and T. A. Campbell, Toward the Printed World: Additive Manufacturing and Implications for National Security, 2012 Search PubMed.
- M. A. G. Calle, M. Salmi, L. M. Mazzariol, M. Alves and P. Kujala, Additive manufacturing of miniature marine structures for crashworthiness verification: Scaling technique and experimental tests, Mar. Struct., 2020, 72, 102764, DOI:10.1016/j.marstruc.2020.102764.
- M. Salmi, Additive Manufacturing Processes in Medical Applications, Materials, 2021, 14, 191, DOI:10.3390/ma14010191.
- I. Gibson and A. Srinath, Simplifying Medical Additive Manufacturing: Making the Surgeon the Designer, Procedia Technol., 2015, 20, 237–242, DOI:10.1016/j.protcy.2015.07.038.
- C. Li, Z. Y. Liu, X. Y. Fang and Y. B. Guo, On the Simulation Scalability of Predicting Residual Stress and Distortion in Selective Laser Melting, J. Manuf. Sci. Eng., 2018, 140, 041013, DOI:10.1115/1.4038893.
- C. Galy, E. Le Guen, E. Lacoste and C. Arvieu, Main defects observed in aluminum alloy parts produced by SLM: From causes to consequences, Addit. Manuf., 2018, 22, 165–175, DOI:10.1016/j.addma.2018.05.005.
- E. Louvis, P. Fox and C. J. Sutcliffe, Selective laser melting of aluminium components, J. Mater. Process. Technol., 2011, 211, 275–284, DOI:10.1016/j.jmatprotec.2010.09.019.
- L. Wang, Q. S. Wei, Y. S. Shi, J. H. Liu, and W. T. He, Experimental Investigation into the Single-Track of Selective Laser Melting of IN625, Advanced Materials Research, Trans Tech Publications Ltd, 2011, vol. 233, DOI:10.4028/www.scientific.net/AMR.233-235.2844.
- D. Buchbinder, W. Meiners, K. Wissenbach and R. Poprawe, Selective laser melting of aluminum die-cast alloy—Correlations between process parameters, solidification conditions, and resulting mechanical properties, J. Laser Appl., 2015, 27, S29205, DOI:10.2351/1.4906389.
- E. O. Olakanmi, Selective laser sintering/melting (SLS/SLM) of pure Al, Al–Mg, and Al–Si powders: Effect of processing conditions and powder properties, J. Mater. Process. Technol., 2013, 213, 1387–1405, DOI:10.1016/j.jmatprotec.2013.03.009.
- X. Jiang, T. Ye and Y. Zhu, Effect of process parameters on residual stress in selective laser melting of AlSi10Mg, Mater. Sci. Technol., 2020, 36, 342–352, DOI:10.1080/02670836.2019.1705560.
- T. H. C. Childs, C. Hauser and M. Badrossamay, Mapping and Modelling Single Scan Track Formation in Direct Metal Selective Laser Melting, CIRP Ann., 2004, 53, 191–194, DOI:10.1016/S0007-8506(07)60676-3.
- Y. Li and D. Gu, Parametric analysis of thermal behavior during selective laser melting additive manufacturing of aluminum alloy powder, Mater. Des., 2014, 63, 856–867, DOI:10.1016/j.matdes.2014.07.006.
- K. Kempen, L. Thijs, J. Van Humbeeck and J.-P. Kruth, Processing AlSi10Mg by selective laser melting: parameter optimisation and material characterisation, Mater. Sci. Technol., 2015, 31, 917–923, DOI:10.1179/1743284714Y.0000000702.
- H. Jia, H. Sun, H. Wang, Y. Wu and H. Wang, Scanning strategy in selective laser melting (SLM): a review, Int. J. Adv. Manuf. Technol., 2021, 113, 2413–2435, DOI:10.1007/s00170-021-06810-3.
- K. He and X. Zhao, 3D thermal finite element analysis of the SLM 316L parts with microstructural correlations, Complexity, 2018, 2018, 1–13, DOI:10.1155/2018/6910187.
- J. P. Kruth, L. Froyen, J. Van Vaerenbergh, P. Mercelis, M. Rombouts and B. Lauwers, Selective laser melting of iron-based powder, J. Mater. Process. Technol., 2004, 149, 616–622, DOI:10.1016/j.jmatprotec.2003.11.051.
- Y. Lu, S. Wu, Y. Gan, T. Huang, C. Yang, L. Junjie and J. Lin, Study on the microstructure, mechanical property and residual stress of SLM Inconel-718 alloy manufactured by differing island scanning strategy, Opt. Laser Technol., 2015, 75, 197–206, DOI:10.1016/j.optlastec.2015.07.009.
- H. Shipley, D. McDonnell, M. Culleton, R. Coull, R. Lupoi, G. O'Donnell and D. Trimble, Optimisation of process parameters to address fundamental challenges during selective laser melting Ti-6Al-4V: A review, Int. J. Mach. Tools Manuf., 2018, 128, 1–20, DOI:10.1016/j.ijmachtools.2018.01.003.
- Ł. Żrodowski, B. Wysocki, R. Wróblewski, A. Krawczyńska, B. Adamczyk-Cieślak, J. Zdunek, P. Błyskun, J. Ferenc, M. Leonowicz and W. Święszkowski, New approach to amorphization of alloys with low glass forming ability via selective laser melting, J. Alloys Compd., 2019, 771, 769–776, DOI:10.1016/j.jallcom.2018.08.075.
- K. Kempen, B. Vrancken, S. Buls, L. Thijs, J. Van Humbeeck and J. P. Kruth, Selective laser melting of crack-free high density M2 high speed steel parts by baseplate preheating, J. Manuf. Sci. Eng., 2014, 136, 6, DOI:10.1115/1.4028513.
- M. Alimardani, E. Toyserkani, J. P. Huissoon and C. P. Paul, On the delamination and crack formation in a thin wall fabricated using laser solid freeform fabrication process: An experimental–numerical investigation, Opt. Lasers Eng., 2009, 47, 1160–1168, DOI:10.1016/j.optlaseng.2009.06.010.
- Y. C. Hagedorn, N. Balachandran, W. Meiners, K. Wissenbach, and R. Poprawe, SLM of Net-Shaped High Strength Ceramics: New Opportunities for Producing Dental Restorations, 2011 International Solid Freeform Fabrication Symposium, University of Texas at Austin, 2011, DOI:10.26153/tsw/15315.
- T. Vilaro, C. Colin and J. D. Bartout, As-Fabricated and Heat-Treated Microstructures of the Ti-6Al-4V Alloy Processed by Selective Laser Melting, Metall. Mater. Trans. A, 2011, 42, 3190–3199, DOI:10.1007/s11661-011-0731-y.
- L.-B. Guo, D. Zhang, L.-X. Sun, S.-C. Yao, L. Zhang, Z.-Z. Wang, Q.-Q. Wang, H.-B. Ding, Y. Lu, Z.-Y. Hou and Z. Wang, Development in the application of laser-induced breakdown spectroscopy in recent years: A review, Front. Phys., 2021, 16, 1–25, DOI:10.1007/s11467-020-1007-z.
- V. N. Lednev, P. A. Sdvizhenskii, M. N. Filippov, M. Y. Grishin, V. A. Filichkina, A. Ya. Stavertiy, R. S. Tretyakov, A. F. Bunkin and S. M. Pershin, Elemental profiling of laser cladded multilayer coatings by laser induced breakdown spectroscopy and energy dispersive X-ray spectroscopy, Appl. Surf. Sci., 2017, 416, 302–307, DOI:10.1016/j.apsusc.2017.04.108.
- V. N. Lednev, P. A. Sdvizhenskii, M. Y. Grishin, M. A. Davidov, A. Y. Stavertiy, R. S. Tretyakov, M. V. Taksanc and S. M. Pershin, Laser induced breakdown spectroscopy for multielement analysis of powdered materials used in additive technologies, Spectrosc. Lett., 2018, 51, 184–190, DOI:10.1080/00387010.2018.1447967.
- P. A. Sdvizhenskii, V. N. Lednev, M. Y. Grishin, V. V. Cheverikin, A. Y. Stavertiy, R. S. Tretyakov, R. D. Asyutin and S. M. Pershin, Laser induced breakdown spectrometry for elemental mapping of wear resistant coatings synthesized by laser cladding, J. Phys. Conf. Ser., 2018, 1109, 012066, DOI:10.1088/1742-6596/1109/1/012066.
- V. N. Lednev, P. A. Sdvizhenskii, R. D. Asyutin, R. S. Tretyakov, M. Y. Grishin, A. Y. Stavertiy, A. N. Fedorov and S. M. Pershin, In situ elemental analysis and failures detection during additive manufacturing process utilizing laser induced breakdown spectroscopy, Opt. Express, 2019, 27, 4612, DOI:10.1364/OE.27.004612.
- V. N. Lednev, P. A. Sdvizhenskii, R. D. Asyutin and A. V. Perestoronin, Investigation of the feasibility of online laser-induced breakdown spectroscopy for elemental analysis of compositionally graded alloy parts during their fabrication, J. Anal. At. Spectrom., 2021, 36, 540–547, 10.1039/D0JA00437E.
- P. A. Sdvizhenskii, V. N. Lednev, R. D. Asyutin, M. Y. Grishin, R. S. Tretyakov and S. M. Pershin, Correction: Online laser-induced breakdown spectroscopy for metal-particle powder flow analysis during additive manufacturing, J. Anal. At. Spectrom., 2020, 35, 632, 10.1039/D0JA90010A.
- J. A. Manrique-Martinez, G. Lopez-Reyes, A. Alvarez-Perez, T. Bozic, M. Veneranda, A. Sanz-Arranz, J. Saiz, J. Medina-Garcia and F. Rull-Perez, Evaluation of multivariate analyses and data fusion between Raman and laser-induced breakdown spectroscopy in binary mixtures and its potential for solar system exploration, J. Raman Spectrosc., 2020, 51, 1702–1717, DOI:10.1002/jrs.5819.
- L. A. Northcutt, S. V. Orski, K. B. Migler and A. P. Kotula, Effect of processing conditions on crystallization kinetics during materials extrusion additive manufacturing, Polymer, 2018, 154, 182–187, DOI:10.1016/j.polymer.2018.09.018.
- D. Gailevičius, V. Padolskytė, L. Mikoliūnaitė, S. Šakirzanovas, S. Juodkazis and M. Malinauskas, Additive-manufacturing of 3D glass-ceramics down to nanoscale resolution, Nanoscale Horiz., 2019, 4, 647–651, 10.1039/C8NH00293B.
- J. Long, A. Nand and S. Ray, Application of Spectroscopy in Additive Manufacturing, Materials, 2021, 14, 203, DOI:10.3390/ma14010203.
- K. Sasan, A. Lange, T. D. Yee, N. Dudukovic, D. T. Nguyen, M. A. Johnson, O. D. Herrera, J. H. Yoo, A. M. Sawvel, M. E. Ellis, C. M. Mah, R. Ryerson, L. L. Wong, T. Suratwala, J. F. Destino and R. Dylla-Spears, Additive Manufacturing of Optical Quality Germania–Silica Glasses, ACS Appl. Mater. Interfaces, 2020, 12, 6736–6741, DOI:10.1021/acsami.9b21136.
- M. Beyhaghi, M. Rouhani, J. Hobley and Y.-R. Jeng, In-situ and ex-situ comparison of oxidation of Inconel 718 manufactured by selective laser melting and conventional methods up to 650 °C, Appl. Surf. Sci., 2021, 569, 151037, DOI:10.1016/j.apsusc.2021.151037.
- R. Williams, M. Bilton, N. Harrison and P. Fox, The impact of oxidised powder particles on the microstructure and mechanical properties of Ti-6Al-4 V processed by laser powder bed fusion, Addit. Manuf., 2021, 46, 102181, DOI:10.1016/j.addma.2021.102181.
- X. Wang, S. Zhang, Z. Y. Wang, C. H. Zhang, C. L. Wu and M. Wang, 3D printing externally reinforced layers for high-speed railway brake discs: adaptability of SLM processes for manufacturing gradient materials, Mater. Today Commun., 2022, 31, 103778, DOI:10.1016/j.mtcomm.2022.103778.
- P. Barriobero-Vila, K. Artzt, A. Stark, N. Schell, M. Siggel, J. Gussone, J. Kleinert, W. Kitsche, G. Requena and J. Haubrich, Mapping the geometry of Ti-6Al-4V: from martensite decomposition to localized spheroidization during selective laser melting, Scr. Mater., 2020, 182, 48–52, DOI:10.1016/j.scriptamat.2020.02.043.
- M. Hanesch, Raman spectroscopy of iron oxides and (oxy)hydroxides at low laser power and possible applications in environmental magnetic studies, Geophys. J. Int., 2009, 177, 941–948, DOI:10.1111/j.1365-246X.2009.04122.x.
- M. K. Nieuwoudt, J. D. Comins and I. Cukrowski, The growth of the passive film on iron in 0.05 M NaOH studied in situ by Raman micro-spectroscopy and electrochemical polarisation. Part I: near-resonance enhancement of the Raman spectra of iron oxide and oxyhydroxide compounds: Near Resonance enhancement of Raman spectra of iron oxides and oxyhydroxides, J. Raman Spectrosc., 2011, 42, 1335–1339, DOI:10.1002/jrs.2837.
- D. Bersani, P. P. Lottici and A. Montenero, Micro-Raman investigation of iron oxide films and powders produced by sol-gel syntheses, J. Raman Spectrosc., 1999, 30, 355–360, DOI:10.1002/(SICI)1097-4555(199905)30:5<355::AID-JRS398>3.0.CO;2-C.
- M. Tadic, D. Trpkov, L. Kopanja, S. Vojnovic and M. Panjan, Hydrothermal synthesis of hematite (α-Fe2O3) nanoparticle forms: Synthesis conditions, structure, particle shape analysis, cytotoxicity and magnetic properties, J. Alloys Compd., 2019, 792, 599–609, DOI:10.1016/j.jallcom.2019.03.414.
- L. Chen, X. Yang, J. Chen, J. Liu, H. Wu, H. Zhan, C. Liang and M. Wu, Continuous Shape- and Spectroscopy-Tuning of Hematite Nanocrystals, Inorg. Chem., 2010, 49, 8411–8420, DOI:10.1021/ic100919a.
- S. Biswal, D. S. Bhaskaram and G. Govindaraj, Role of graphene oxide in modifying magnetism in α-Fe2O3 nanoparticles: Raman and magnetization studies, Mater. Chem. Phys., 2021, 266, 124531, DOI:10.1016/j.matchemphys.2021.124531.
- D. L. A. de Faria, S. Venâncio Silva and M. T. de Oliveira, Raman microspectroscopy of some iron oxides and oxyhydroxides, J. Raman Spectrosc., 1997, 28, 873–878, DOI:10.1002/(SICI)1097-4555(199711)28:11<873::AID-JRS177>3.0.CO;2-B.
- T. Hashimoto, T. Yamada and T. Yoko, Third-order nonlinear optical properties of sol–gel derived α-Fe2O3, γ-Fe2O3, and Fe3O4 thin films, J. Appl. Phys., 1996, 80, 3184–3190, DOI:10.1063/1.363258.
| This journal is © The Royal Society of Chemistry 2024 |