 Open Access Article
Practical applications of total internal reflection fluorescence microscopy for nanocatalysis
Chengyang
Yan
ab,
Xuanhao
Mei
ab,
Xue
Gong
*a and
Weilin
Xu
 *ab
*ab
aState Key Laboratory of Electroanalytical Chemistry, Jilin Provincial Key Laboratory of Low Carbon Chemical Power, Changchun Institute of Applied Chemistry, Chinese Academy of Sciences, Changchun 130022, China. E-mail: weilinxu@ciac.ac.cn
bUniversity of Science and Technology of China, Hefei 230026, China
First published on 29th June 2023
Abstract
Fluorescence microscopy has evolved from a purely biological tool to a powerful chemical instrument for imaging and kinetics research into nanocatalysis. And the demand for high signal-to-noise ratio and temporal–spatial resolution detection has encouraged rapid growth in total internal reflection fluorescence microscopy (TIRFM). By producing an evanescent wave on the glass–water interface, excitation can be limited to a thin plane to ensure the measured accuracy of kinetics and image contrast of TIRFM. Thus, this unique physical principle of TIRFM makes it suitable for chemical research. This review outlines applications of TIRFM in the field of chemistry, including imaging and kinetics research. Hence, this review could provide guidance for beginners employing TIRFM to solve current challenges creatively in chemistry.
Keywords: Total internal reflection fluorescence microscopy; Nanocatalysis; Imaging; Kinetics analysis.
1 Introduction
Nanocatalysts are essential for some important industrial application prospects and economic benefits.1–5 Besides, nanocatalysts are usually the basis for pursuing high-efficiency and selectivity research.6–9 Therefore, the study of the structure–activity relationship of nanocatalysts has prospered in recent years, enhancing the comprehension of nanoparticles (NPs), clusters and atoms10,11 at the single-particle level. A common area of interest for chemists is to investigate nanocatalysts in real-time, in situ and at high spatiotemporal resolution. Total internal reflection fluorescence microscopy (TIRFM) is a special kind of fluorescence microscopy amongst many detection technologies.12–15 A large amount of research work into TIRFM has been reported in previous publications.16–19 The core principle of TIRFM is to illuminate a thin plane at the two-phase interface by an evanescent wave, with both out-of-focus fluorescence and the overall lighting of the sample declining dramatically.16,17 Moreover, TIRFM and fluorescent dyes can join forces to break the diffraction limit, making it an attractive detection technique for nanocatalytic chemists. Therefore, TIRFM, as an invaluable optical tool in chemical systems, offers real-time, in situ and high space–time resolution.16–19 Hofkens et al.20 showed that the catalytic heterogeneity of layered double hydroxide (LDH) could be revealed by TIRFM (Fig. 1a–d). Chen et al.21 studied the catalytic kinetics and dynamics of individual Au nanoparticles via this unique analytical tool (Fig. 1e and f). Majima's group22 employed this technique to uncover the photocatalytically active sites of semiconductors (Fig. 1g and h).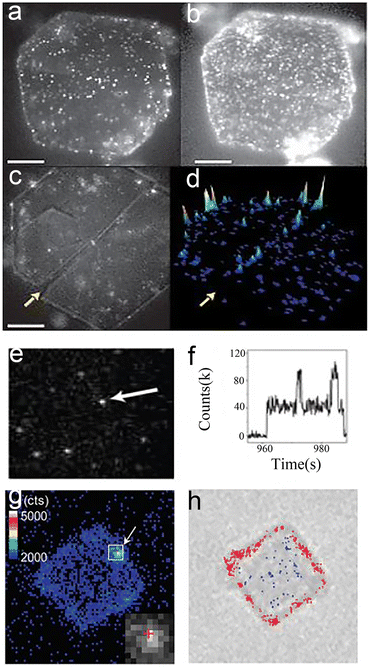 | ||
| Fig. 1 TIRFM images of nanocatalysts at single-molecule level. (a and b) Images of individual LDH catalytic reactions in 1-butanol at ester concentrations of (a) 40 and (b) 700 nM; (c) product formation at crystal edges; (d) accumulated spot intensity on the same crystal;20 reprinted with permission from ref. 20. Copyright 2006, Springer Nature. (e and f) Fluorescence images21 (e) and fluorescence trajectory (f) of single Au NPs. Reprinted with permission from ref. 21. Copyright 2008, Springer Nature. (g and h) Fluorescence22 (g) and transmission (h) images of the same TiO2 crystal. Reprinted with permission from ref. 22. Copyright 2011, American Chemical Society. | ||
However, chemists should recognize the underlying photophysical phenomena and the physical principles of TIRFM to ensure good reliability and accuracy in experiments.23–26 Theoretically, the main difficulty with the experiments is organically integrating the evanescent wave and the fluorescence. Sometimes the true structure or catalytic processes of the catalyst cannot be fully characterized by the collected signals (images or fluorescence blinking movies) due to the intrinsic principles of TIRFM, such as the evanescent field, noise and intensity. Although detailed guides to TIRFM can be found extensively in the biological field,20,27 some special descriptions are needed for the chemical field.
From this perspective, some barriers need to be overcome. Thus, in this review, the principles of TIRFM are discussed and its practical applications in the nanocatalysis field, including super-resolution imaging and kinetic analysis, are emphasized. Most importantly, this review aims at describing a series of physical principles of TIRFM and recommending the application of TIRFM in chemical systems, which may encourage researchers to solve current challenges creatively in nanocatalysis fields.
2 Development and theory of TIRFM
2.1 A brief history of the development of fluorescence microscopy and TIRFM
The invention of TIRFM was based on a series of accidental discoveries that boomed in the early 20th century.23 The tale started with the special phenomena of various minerals and plant extracts that emit a certain color of light when exposed to sunlight.28 George Stokes29 coined the term “fluorescence” in 1852 and observed that the wavelength of light emitted from fluorescent substances is longer than that of the excitation light and now the phenomenon is named “Stokes shift”. At the same time, physicists were intent on improving the resolution of conventional optical microscopes. In 1872, Abbe's work30 suggested that the wavelength and resolution could be obtained from the following formula: | (1) |
It is known from the formula that if we use green light (λ = 532 nm) and a certain objective lens (for example, NA = 1.4), we can produce an image whose resolution is about 200 nm. The formula also shows that the spatial resolution of classical optical microscopes is limited by the wavelength of the light (to about half of the wavelength of the light). Obviously, if we use shorter wavelengths of light (i.e., ultraviolet), we can get higher-resolution images. It would seem that using the shortest wavelengths of light, such as ultraviolet, could produce super-resolution images. However, such UV light is invisible and harmful to human eyes, making experimentation difficult.31–36 In 1904 this phenomenon of auto-fluorescence was described as an experimental problem rather than a lighting system.37 In 1911, it is pointed out that enough excitation light to illuminate the sample and collect fluorescence with low noise is important for fluorescence microscopy. And the first fluorescence microscope was built to observe bacteria based on the autofluorescence phenomenon.38 However, there was an obvious limitation in application of the fluorescence microscope at that time due to the illumination system being dependent on the autofluorescence of the sample and a dark field concentrator. Secondary fluorescence technology has brought enormous changes to the fluorescence microscope. This technology needs the application of exogenous fluorescent chemicals (which are now named fluorescent pigments) to illuminate samples. Fluorescent pigments and their applications really began an epoch for shaping microscopy and fluorescence microscopy techniques.45 In 1980, Daniel Axelrod39 proposed total internal reflection fluorescence microscopy (TIRFM), which uses the principle of total internal reflection (TIR) to excite fluorescent dyes to obtain a high signal-to-noise ratio. TIR can lead excitation light to produce an evanescent wave at the interface, which gives it an excellent optical slicing ability in the Z-axis, and thus a high signal-to-noise ratio. Besides, TIRFM can observe the entire wide field rather than point-by-point scanning, which allows it to monitor multiple samples in real-time.
2.2 Theory of TIRFM
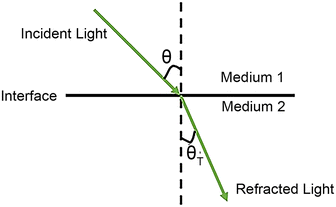
What is total internal reflection? Considering a beam transmitted from medium 1 to medium 2 (Fig. 2), the transmitted and reflected light obey Snell's law:40n1![[thin space (1/6-em)]](https://www.rsc.org/images/entities/char_2009.gif) sin sin![[thin space (1/6-em)]](https://www.rsc.org/images/entities/char_2009.gif) θ = n2 θ = n2![[thin space (1/6-em)]](https://www.rsc.org/images/entities/char_2009.gif) sin sin![[thin space (1/6-em)]](https://www.rsc.org/images/entities/char_2009.gif) θT θT | (2) |
The critical angle is defined as  . When θ = θc, the incident beam is refracted by the parallel surface and, accordingly, no light is delivered to the other side. If θ < θc, most of the light enters the sample through the interface as conventional wide-field illumination. The incident light is completely reflected from the interface only when θ > θc, which is called total internal reflection.23 At this point, an evanescent wave propagates in the direction normal to the interface and finally enters the sample through the interface. According to prediction from Maxwell's equations, the frequency, polarity and wavelength of the field are the same as those of the incident light when an evanescent field appears. Maxwell's equations and Snell's law are combined to calculate the intensity of an evanescent field as follows:24,25
 | (3) |
The equation indicates that the intensity of the evanescent wave decreases exponentially with Z. Therefore, total internal reflection happens when an excitation beam is incident at a high angle (θ > θc) and is completely reflected without refraction, resulting in a magnetic field which exponentially decays with distance from the interface. The transmission depth d can be given by the following formula:26
 | (4) |
As for application to the nanocatalysis field, multi-layered interfaces are sometimes involved.41–43 For example, if medium 1 is indium tin oxide (ITO) with a nanometer-thick middle layer, TIR will occur regardless of the refractive index of the middle layer.
2.3 General procedure for employing TIRFM
With the development of laser technology,44,45 fluorescent probe synthesis46,47 and computer technology,48,49 TIRFM has transformed from a professional physicist's tool to a toolkit that the general public can use, even building it yourself in the lab.50 In this section, from the perspective of TIRFM principles and applications, we focus on the construction of experimental equipment, reaction cells and single-turnaround reactions. For other aspects of TIRFM, such as the properties of fluorescent probe, the reader can refer to these papers.47,51The TIRFM can be achieved by using a prism to direct an excitation beam to the interface or through a high NA value microscope objective.26,52,53 As shown in Fig. 3d, the beam passes through a neutral density filter and a beam expander, which controls its power density and diameter. Due to the laser being linearly polarized, a quaternary wave plate is used to convert the light to circular polarization to guarantee uniform Koehler illumination of the sample. It passes through an achromatic lens to focus the light on a prism and the excitation beam undergoes total internal reflection at the glass/water interface. Finally, the fluorescence caused by the evanescent wave is collected by the objective and is recorded through the filter and focusing optics by the electron-multiplying charge-coupled device (EMCCD) camera. The illumination path and the signal collection do not interfere with each other. In addition, this gives great freedom in the selection of microscope filters and color dividers. The EMCCD camera has a small dark current at low temperature. For these reasons, the fluorescent signals can be monitored with high signal-to-noise ratios at the single-molecule level.
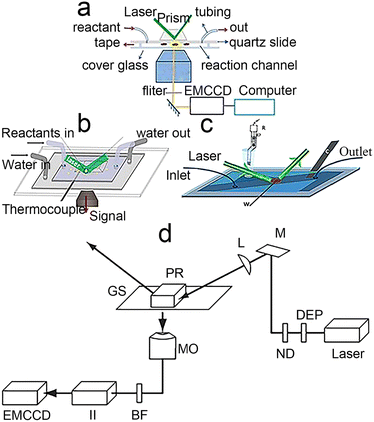 | ||
| Fig. 3 Types of reaction cells. (a) Classical reaction cell.56 Reprinted with permission from ref. 56. Copyright 2022, PNAS. (b) Temperature control of the reactive cell.57 Reprinted with permission from ref. 57. Copyright 2016, American Chemical Society. (c) Electrochemical reaction cell.58 Reprinted with permission from ref. 58. Copyright 2016, Wiley-VCH GmbH. (d) Schematic diagram of a prism-type TIR setup on an inverted microscope: depolarizer (DEP), neutral density filter (ND), mirror (M), focusing lens (L), prism (PR), glass slide (GS)T, microscope objective (MO), barrier filter (BF), imager intensifier (II), electron-multiplying charge-coupled device (EMCCD).52 Reprinted with permission from ref. 52. Copyright 1969, Springer Nature. | ||
Currently, a laser light source, which has monochromaticity, directionality and high brightness, is the most general choice compared with others. The wavelength of the light is determined by the fluorescent molecules. For example, the classical fluorescence reaction system adopted by our group is based on the non-fluorescent molecule resazurin reverting to the fluorescent molecule resorufin, which can be excited by a 532 nm laser to produce fluorescence. The strong fluorescence emitted by resorufin then can be detected at the single-molecule level.24
So, how can these parts be combined on the microscope for observation after considering all of this? First, take our group's work as an example, dispersing the sample on a slide with enough distance by appropriate methods (such as controlling the concentration of nanoparticles and spin coating) to ensure reliable observation of single molecules, considering the low lateral resolution of TIRFM53 (about 200 nm). Sometimes, the glass needs to be functionalized to fix the sample. Secondly, a reaction cell needs to be built with glass that can hold liquids and has the ability to exchange substances54,55 due to most catalytic reactions occurring in a liquid environment. Finally, they are assembled with epoxy resin,56 as shown in Fig. 3a. According to this train of thought and the characteristics of the target reaction, we have successively constructed a temperature-controlling reaction cell57 (Fig. 3b) and an electrochemical reaction cell58 (Fig. 3c).
In 2008, the process of the catalytic reduction of resazurin by individual gold nanoparticles and its catalytic kinetics were studied by Chen et al. (Fig. 4a and b) through TIRFM.21 In this work, the catalytic process is modeled in two parts: the formation process (τon) and the dissociation process (τoff), where τon and τoff correspond to fluorescence burst and fluorescence quenching in the time–intensity curve, respectively. Thus, the dissociation rate and the product formation rate can be expressed as 〈τon〉−1 and 〈τoff〉−1, respectively. Statistical analysis of 〈τon〉−1 and 〈τoff〉−1 was based on the Langmuir–Hinshelwood mechanism, with the following results:
 | (5) |
 | (6) |
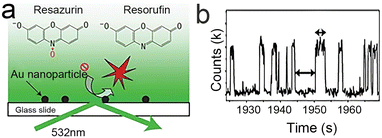 | ||
| Fig. 4 Single-turnover detection of single-Au-nanoparticle catalysis.21 (a) Reaction cell and experimental design; (b) classic fluorescence signal. Reprinted with permission from ref. 21. Copyright 2008, Springer Nature. | ||
Through eqn (5) and (6), the authors gave the mechanism of product generation and dissociation at the single-molecule level, and further time-dependent analysis revealed fluctuation in the activity of single nanoparticles. This paper showed that TIRFM is a reinforcing single-molecule tool to reveal nanocatalysis processes, but it lacks sufficient structural information on nanocatalysts.3,18
3 Kinetic analysis of single-molecule and particle nanocatalysis by TIRFM
Prism-based TIRFM is reputed to be the best single-molecule imaging method with high resolution at room temperature.25,59 It is used to detect the time dependence, distribution and trajectory of catalytic particles, and to study single-turnover reactions according to the time–intensity curve. However, its application in practical systems remains a challenge.60 This section shows our work in employing the TIRFM of practical single-molecule single-turnover reactions.3.1 Particle size effect in gold clusters and palladium cubes
Metal nanomaterials (nanoparticles, clusters, etc.) are the most important materials for developing highly selective catalysts.18,41,43 In particular, noble metals such as Au (ref. 61–63) and Pd (ref. 64–66) have been used extensively in energy and chemical industries, contaminant treatment and clean energy.67 The size of metal nanomaterials dominates catalytic performance compared to morphology or catalyst support. The size effect means that tremendous changes in their electronic and geometric structures shape the unique performance of nanocatalysts.68 The basic mechanism of this property and the study of the catalytic performance of individual nanocatalysts at the atomic level have been explored quite a lot by traditional detection methods, such as transmission electron microscopy and scanning probe measured microscopies. However, they mainly obtain averaged properties of the catalytic system.69–71As mentioned previously, TIRFM is a wide-field imaging technology. The full field of view can be imaged at a very high acquisition speed (a few milliseconds to hundreds of milliseconds). It not only has high spatiotemporal resolution, and high sensitivity but can act at the level of a single molecule. Here, our group displayed the size dependence of gold clusters and palladium cubes based on TIRFM.72 Chen et al.21 studied Au nanoparticles via TIRFM and pointed out the heterogeneous reactivity and reaction mechanism of Au NPs. We further studied atomically precise Au clusters.72 Based on an Au cluster-catalyzed single-turnover catalytic fluorescence reaction (i.e., the reduction of non-fluorescent resazurin to fluorescent resorufin), atomically precise Au clusters (Au15, Au18, Au25) were chosen as model catalysts to study the kinetics and dynamics of different sizes of Au clusters.
As displayed in Fig. 5a and b, the typical fluorescence burst curve contains complete information about a single-turnover reaction (i.e., τon and τoff). Based on the L–H mechanism, the equations for product formation rate (〈τoff〉−1) and dissociation rate (〈τon〉−1) can be obtained:73
 | (7) |
 | (8) |
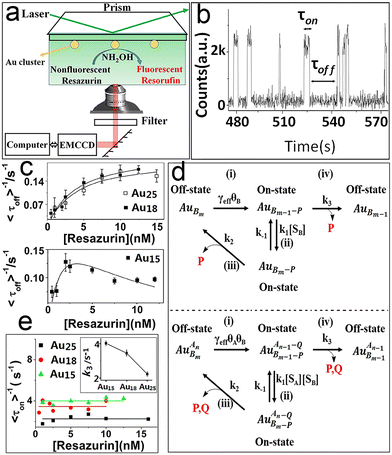 | ||
| Fig. 5 Single-turnover detection of single-Au-cluster catalysis.72 (a) Reaction cell and experimental design. (b) Classic fluorescence signal. Kinetic study of different-sized Au clusters; (c) the substrate resazurin concentration; (d) reaction paths; (e) resazurin concentration titrations of 〈τoff〉−1 on Au25, Au18 and Au15. Reprinted with permission from ref. 72. Copyright 2018, Proc. Natl. Acad. Sci. U. S. A. | ||
Obviously, the different performance of Au clusters is not accounted for by the change in substrate concentration or the inactivity of Au clusters (Fig. 5a and e). Similarly, for the product dissociation process, the dissociation rate is independent of substrate concentration, which is diametrically opposed to that of Au NPs (Fig. 5b). This means that the active sites of an Au cluster are limited, so after the adsorption reaches equilibrium, adsorption of the substrate molecules is limited by steric hindrance. On the Au cluster surface, the product molecules can only directly dissociate without being affected by the substrate molecules. Based on this idea, kinetic parameters are fitted to further evaluate the size effect of Au clusters.21,72γeff increases with a decrease in the size of Au clusters in contradiction to the variation in the resazurin adsorption equilibrium constant and the product direct dissociation constant, unlike previous investigation of gold nanoparticles,21 suggesting that Au clusters show strong adsorption of reactants and weak adsorption of products. Such a difference can be attributed to the quantum effects of unique dimensions and the different structures between them; that is, the different arrangements of atoms.74
As detailed in Fig. 6a–e, the size-dependence of the Pd cube's catalytic properties was studied for five different sizes of Pd cube. Kinetic and thermodynamic parameters are calculated through quantitative deconvolution of product formation and dissociation rate.75γeff increases with an increase in Pd cube size, which means that the smaller the size of the Pd nanoparticles, the higher the utilization rate. The adsorption equilibrium constant of resazurin rises rapidly with an increase in nanoparticle size. Size-related selectivity in the process of product desorption was also observed. Small nanocubes are more inclined to a direct desorption pathway, and large ones are promoted by substrate adsorption.
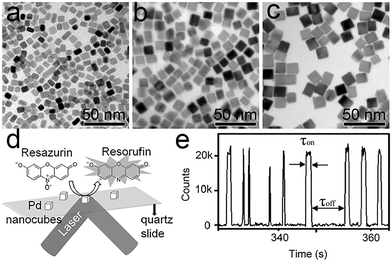 | ||
| Fig. 6 (a–c) Classical TEM images of different-sized Pd nanocubes. (a) 7; (b) 11.4; (c) 15.2 nm; (d) and (e) reaction cell and classical reaction signaling. Reprinted with permission from ref. 75. Copyright 2016, Wiley-VCH GmbH. | ||
The edge activity sites dominate the total activity of Pd cubes, which means that edge sites are more active than planar sites.75 The product desorption process at the planar sites is subdivided into two pathways: a direct dissociation pathway and an indirect dissociation pathway. The direct dissociation pathway is twice as large as the other. Conversely, the product dissociation rate at the edge sites decreases with an increase in substrate concentration, indicating that substrate adsorption obstructs the product desorption process. These differences are referenced to the changes in the degree of atomic contribution to the surface caused by a reduction in nanoparticle size.
The works21,72,75 introduced here cover only the application of a single-molecule strategy in traditional catalysis, and there is no denying the fact that single-molecule technology is a powerful representative tool for revealing atomic catalytic information on different types of surface. And the new information mined is conducive to an in-depth understanding of surface catalysis. The digging out of new information is conducive to a better understanding of the surface catalysis process and guidance for catalyst design.
3.2 Kinetic study of two-electron oxygen reduction reaction based on Fe3O4 nanoparticles
In the clean energy field, the oxygen reduction reaction (ORR) is one of the most important reactions in which detection of either the 4H+ + 4e− + O2 → 2H2O reaction (4e ORR) or the 2H+ + 2e− + O2 → H2O2 reaction (2e ORR) are both particularly challenging.76–78 4e ORR consists of 2e ORR, which means that improving the kinetics of 2e ORR is crucial to the efficiency of ORR. Based on the fact that Fe3O4 NPs can catalyze 2H+ + O2 to H2O2 or H2O2 + Amplex red to resorufin (high fluorescence activity),79,80 Xu et al.81 cascaded them to reveal the kinetics of 2e ORR at the single-molecule level and measured the electron transport coefficient, standard rate, and active heterogeneity of the long-term catalysis of individual nanoparticles.As shown in Fig. 7a–c, electrochemistry coupled with fluorescence spectroscopy indicates that the fluorescence signal comes only from the Reaction-II process and has nothing to do with other Fe3O4 NP catalytic oxidation processes. Based on such a result, fluorescence burst movies during the catalytic process are recorded via a three-electrode reaction cell (Fig. 7d). Fig. 7e displays part of the typical time trajectory, which contains fluorescence burst and quenching signals that span the entire observation. Each impulse represents the time of generation resorufin by Reaction-I/II and the sudden drop in intensity represents resorufin dissociation. Therefore, each on–off time means a full 2e ORR cycle. The high probe concentration causes Reaction-I to become a rate-determining step. At low potential, all the H2O2 molecules produced by the nanoparticles can be approximated as being consumed by probes to result in burst fluorescence. Thus, the generation rate of resorufin (fluorescent product) closely approximates the rate of 2e ORR. 〈τoff〉−1, which represents the rate of 2e ORR, can be expressed by the classic Butler–Volmer model, following the formula:
〈τoff〉−1 = Aoff![[thin space (1/6-em)]](https://www.rsc.org/images/entities/char_2009.gif) exp(−βfE) exp(−βfE) | (9) |
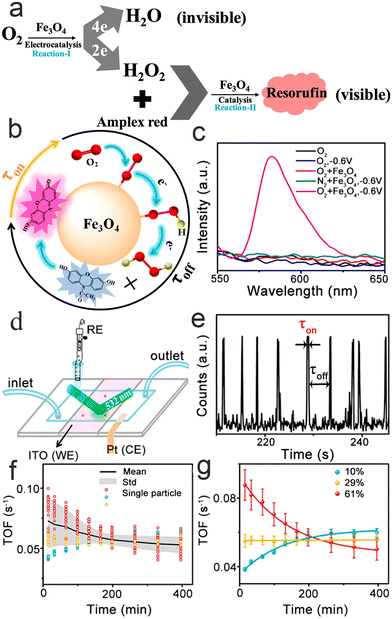 | ||
| Fig. 7 Reaction mechanism (a) and detection mechanism (b); (c) electrochemically coupled fluorescent light; (d) schematic illustration of a three-electrode microfluidic reaction cell; (e) typical fluorescence burst curve; (f and g) fitting (f) and correlation analysis (g) of kinetic parameters.81 Reprinted with permission from ref. 81. Copyright 2020, American Chemical Society. | ||
The heterogeneity of their electrocatalytic activity has also been researched, such as the size, shape and surface distribution of active sites, by monitoring the activity of multiple nanoparticles. Further long-term activity testing shows that the 2e ORR process of individual nanoparticles is gradually inactivated over time and eventually stabilizes (Fig. 7f and g). More interestingly, from a nanoparticle's point of view, it has three deactivated channels, which confirms the heterogeneity of the nanoparticles. In general, this study helps to further understand and design the composition of electrolytes for better catalytic performance.
3.3 Revealing the catalytic kinetics of Pt single-atom catalysts
Single-atom catalysts82–85 play a central role in heterogeneous catalysis, due to their near 100% atomic utilization and remarkable economic results. A previous study75 has shown that Pt cubes show size-dependent activity, and Xu et al.56 further studied a Pt single-atom catalyst at the single-atom level via TIRFM (Fig. 8a–c).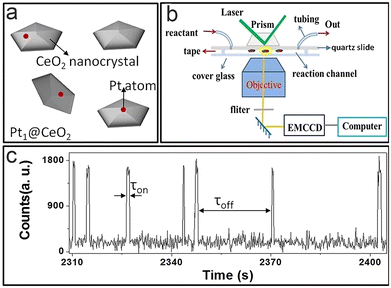 | ||
| Fig. 8 (a) Catalyst structure model; (b and c) imaging principles (b) and fluorescence signals (c).56 Reprinted with permission from ref. 56. Copyright 2022, Proc. Natl. Acad. Sci. U. S. A. | ||
As mentioned before,21τoff and τon contain kinetic information about the formation and dissociation process; where 〈τoff〉−1 and 〈τon〉−1 represent the production formation and dissociation rate, respectively. It is found that the total reaction process follows the L–H mechanism, and the relationship between catalytic reaction rate and substrate concentration can be determined by analyzing the spectral data. The activity of monoatomic Pt is significantly greater than that of Pt nanoparticles. This difference is mainly caused by the different structures of the active sites and the steric hindrance effect on the surface of traditional Pt nanoparticles, which is an important reason for the high utilization rate of Pt mono-atomic catalysts. The surface reconstruction of the single atom has an effect on the catalytic process, which is consistent with nanoparticle catalysts; however, its catalytic process makes no difference to surface reconstruction, which is different from the case of nanoparticle catalysts. This phenomenon is attributed to the surface remodelling of single-atom catalysts, which is a rapid process; thus, the impact from the environment is diminished.
In conclusion, the catalytic behaviour of Pt single-atom catalysts is studied at the single-atom level by TIRFM, which provides a basic insight into the structure–activity relationship of atomically dispersed catalysts.
4 Nanocatalysts super-resolution images in TIRFM
Compared with kinetic analysis, super-resolution imaging concentrates mainly on the structure of nanocatalysts. Recent studies86–88 have reported that bimetallic nanoparticles, Au- and Ag-based linked nanostructures, and plasmonic nanoparticles can be super-resolution imaged by TIRFM, resulting in super-resolution graphics that provide new insights into nanocatalysts.4.1 Bimetallic nanoparticle super-resolution imaging
Bimetallic nanoparticles represent one type of heterogeneous catalyst that are widely used in industry and energy, due to their unique activity, selectivity and stability.89–92 The bimetallic effects93–95 are based on two main mechanisms: an electronic effect and an ensemble effect. However, the special effects exhibit high heterogeneity, and their catalytic enhancement is a result of the bimetallic interactions at the atomic level, which makes detection difficult.96,97 Peng Chen et al.86 quantitatively imaged the enhanced bimetallic activity within individual bimetallic nanoparticles by total internal reflection super-resolution fluorescence microscopy (TIR-SR-M). A mesoporous silica-covered PdAu bimetallic nanoparticle (Fig. 9a) was chosen as a model bimetallic catalyst and catalytic resazurin disproportionation was selected as the labeled reaction (Fig. 9b). Thus, this enhanced bimetallic reaction can be imaged on individual PdAu nanoparticles by TIR-SR-M. Due to the unique structure of nanoparticles, the super-resolution catalysis images can be added onto their SEM images with 40 nm precision, on which the Pd–Au interface location is obvious (Fig. 9c–e). This is the first time that catalytic enhancement by the bimetallic effect has been visualized. Each PdAu nanoparticle is further divided into four different areas (Fig. 9f): (Pd–Au region, monometallic Pd component, Au–Pd region, and monometallic Au component) and each region is larger than 40 nm to ensure the significance of spatial resolution. The results of summarizing PdAu nanoparticles show that the activity of bimetallic Au–Pd and Pd–Au regions are almost twice those of monometallic Pd or Au. The phenomenon denotes that the observed higher product detection rates in bimetallic regions are attributable to the bimetallic effect. The disconnected Pd–Au junction images show that bimetallic enhancement is relevant to the particular geometry of Pd–Au contact.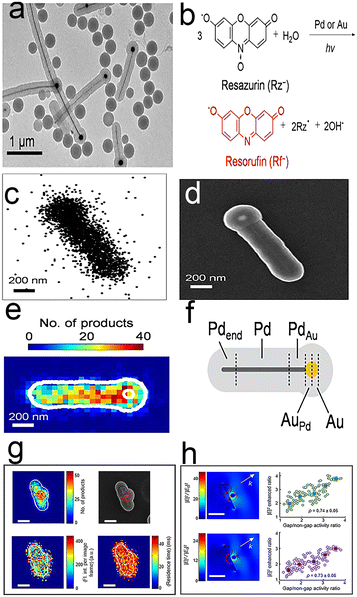 | ||
| Fig. 9 (a) TEM image of mesoporous silica-coated PdAu nanoparticles; (b) labeled fluorescence reactions; (c) fluorescence image; (d) TEM image; (e) fluorescence and TEM composite figure; (f) segmentation of a typical PdAu nanoparticle.86 Reprinted with permission from ref. 86. Copyright 2017, American Chemical Society. (g) Catalytic hotspots on linked Au–Ag nanorod–nanoparticle nanostructures; (h) average single-molecule fluorescence intensity.88 Reprinted with permission from ref. 88. Copyright 2018, American Chemical Society. | ||
Fig. 9g shows the nanoscale images of surface-plasmon (SP)-enhanced catalytic activity by the Au–Ag-based linked nanostructures.88 In contrast to the visualization of PdAu bimetallic nanoparticles, this work does not rely on the bimetallic junction, instead focusing on the surface plasmon (SP) resonance at nanoscale gaps. As for metal nanoparticles, SP excitation can enhance the catalytic activity of the nanoparticles, whereas reductive deoxygenation of resazurin to resorufin by NH2OH as a label reaction enables super-resolution images of Au–Ag-based linked nanostructures. The catalytic activities of gap regions are twice as high as those of non-gap regions by mapping the super-resolution images onto SEM images, which suggests catalytic enhancement at plasmonic hotspots on Au–Ag nanostructures. Further study of the gap size effect shows that the larger the gap, the smaller the enhancement (Fig. 9h).
4.2 Photoactivation and optical writing–reading of silver nanoparticles
Stefania Impellizzeri et al.87 designed a unique system (Fig. 11a) that consists of Ag nanoparticles (Ag NPs) and fluorogenic-derived dipyrromethene, which can be selectively activated by UVA or UVC. Ag NPs have been used to enhance fluorescence by the reasonable design of the nanostructure, which can be employed to increase the fluorescence signal relative to noise.Under wide-field laser (TIRFM) illumination, the appropriate photoacid generator releases p-toluenesulfonic, triflic or hydrobromic acid. Any of them can promote optical writing (Fig. 10b) by catalyzing the formation of fluorescent species. A further single-molecule reading study (Fig. 10c) shows that the fluorescence intensity is unevenly distributed, which is caused by the structure of the Ag NPs and the Ag NPs effectively reducing the necessary writing time by half compared with non-Ag NPs. Thus, the fine-tuning of Ag nanostructures can significantly facilitate the performance of fluorescence optical techniques to achieve faster and superior results.
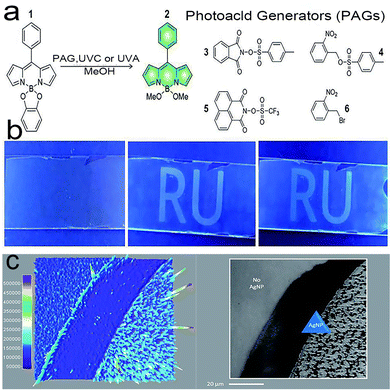 | ||
| Fig. 10 (a) Structures of compounds 1–6; (b) optical writing process; (c) single-molecule TIRFM images of Ag NPs across the sample area.87 Reprinted with permission from ref. 87. Copyright 2020, Royal Society of Chemistry. | ||
4.3 Super-resolution imaging of plasmon-driven chemical reactions
The ability to generate highly energetic charge carriers, elevated surface temperatures and enhanced electromagnetic fields has enabled plasmonic nanoparticles to emerge as promising photocatalysts. Andrea Baldi et al.98 studied the plasmon-driven chemical reactions of a single Au nanorod (Fig. 11a) by a fluorogenic chemical reaction (Fig. 11b) (the dismutation reaction of resazurin) and superresolution fluorescence microscopy (Fig. 11c). Real-time imaging of the plasmon-driven chemical reaction conjugated to Au nanorods revealed that the electric field distribution is closely related to catalytic activity, which may be sufficient to guide the design of advanced photocatalysts. By showing that the absorption and scattering cross-sections of the nanorod are independent of the in-plane particle orientation, the study further demonstrated the varying in-plane orientations.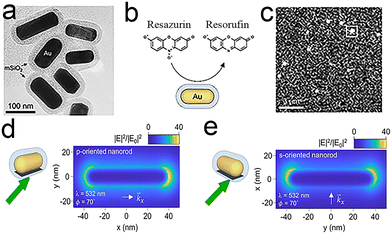 | ||
| Fig. 11 (a–c) In situ super-resolution catalysis on individual gold nanorods (a) TEM image of the Au@mSiO2 nanorods; (b) principle of fluorescent labelling; (c) single-molecule imaging; (d and e) electric field intensity normalized to the incident field intensity. The nanorod is p-oriented (d) or s-oriented (e).98 Reprinted with permission from ref. 98. Copyright 2021, American Chemical Society. | ||
The in-plane angular distribution of catalytic events has been used to investigate the relationship between catalytic activity and simulated electric field, which further demonstrates the reasonableness of the weak correlation between the turnover rate, the weak average field enhancement and the particle orientation (Fig. 11d and e). On top of this, the authors assume that all molecules are observed within the outer 5 nm of the SiO2 shell and achieve quantitative detection. This in situ mapping scattering method with a subparticle spatial resolution can be extended to other photochemical systems.
5 Combining TIRFM with other detection technologies
TIRFM technology is short of structural information about nanocatalysts, but this can be detected by ex situ methods, such as scanning electron microscopy (SEM),99,100 transmission electron microscopy (TEM), and scanning electron microscopy (AEM).107,111 As different types of information can be provided by different equipment, coupling of devices enables different information to be obtained simultaneously. Certainly, this often happens in chemistry, such as the coupling of chromatography to mass spectrometry.101–104 Michael Börsch et al.105 coupled a scanning electrochemical microscope (SECM) and TIRFM (Fig. 12a) in 2004. SECM is applied to generate space- and time-controlled pH gradients in a solvent and TIRFM is used to monitor the real-time pH gradients generated by the sample. The authors monitored proton-driven ATP synthesis with these coupled instruments (Fig. 12b). Combining TIRFM with AFM is also an interesting technique106–108 as shown in Fig. 12c. This technology introduces a new way to study cell structures at high resolution that cannot be recognized by TIRFM. It can also reveal cell properties that cannot be detected by classical optical or electron microscopy. Like SECM–TIRFM,120,121 AFM–TIRFM is widely suitable for specimens in water or other fluid media, such as redox reactions.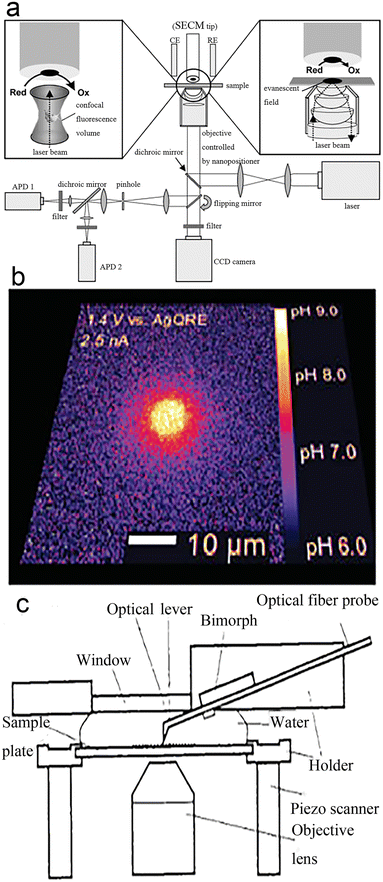 | ||
| Fig. 12 (a) SECM–TIRFM schematic diagram; (b) a 35 nm-radius nanorode generates a local pH gradient.105 Reprinted with permission from ref. 105. Copyright 2004, American Chemical Society. (c) AFM–TIRFM schematic diagram.111 Reprinted with permission from ref. 111. Copyright 1996, Springer Nature. | ||
Another interesting combination is TIRFM with super-resolution technologies, such as photoactivated localization microscopy or stochastic optical reconstruction microscopy,109,110 due to the wide-field property of TIRFM. These two mentioned super-resolution technologies take new fluorophores and illumination methods that allow the timely separation of the emission of fluorescent particles, allowing them to obtain diffraction-limit localization results that outperform samples with high concentrations of fluorescent molecules. TIRFM is used to reduce background signals and achieve a high signal-to-noise ratio. These combinations will enable other future expansions that may enable TIRFM to achieve resolution at the near-molecular level and provide important new tools for observing molecular localization and interactions.
In this section, coupling instruments (such as SECM-TIRFM, AFM-TIRFM)52,105 were seldom employed to solve chemical problems encouraging. There are several reasons for this: first, there is a lack of awareness among chemists of the need to pay attention to photophysical phenomena in chemistry.112 Secondly, the employment of probes in chemistry is not really as developed as in biology.46 Finally, there has been diffidence in building a standard for employing TIRFM in chemistry.113
6 Conclusions and outlook
Applications of TIRFM in the nanocatalysis field represent an important transition in the development of fluorescence microscopy. It can quantify specific nanocatalysis reactions, monitor changes in the catalytic kinetics of nanoparticles, and reveal the structure–activity relationships at the single-molecule level.58,81,86–88 The basic physical principles of TIRFM and the overall experimental design from theoretical applications to the field of catalysis have been discussed.The advantages of TIRFM as a real-time in situ detection technique were fully discussed in this review. Last but not least, perhaps it is appropriate to end with some discussion of probe limitation. For one thing, the real limitation of TIRFM as a modern detection method in biochemistry and chemistry stem from the lack of selective fluorescent probes.114–117 There are many commercially available probes in the biological field, but most of the probes used in the chemical field are non-commercial and are only designed and synthesized in the laboratory, and whether their characteristics (such as quantum yield, fluorescence lifetime, or stability) meet the requirements of chemical inertness and non-reactivity has not yet been confirmed.118,119 In addition, it is difficult for laboratories to have the ability for both fluorescent probe synthesis and single-molecule fluorescence detection. For another thing, organic fluorophores are comparable to or even larger than catalysts in size. This means we have to consider whether each potential interaction would affect the experimental results.46 Therefore, much scientific research effort is still required to develop probes suitable for chemistry. And, thirdly, many probes are stable in aqueous solution, but not in organic solvents, which limits their application in organic reactions.120–122 Finally, much detection based on the redox reaction123–125 of probes lacks systematic research on whether the redox reactions would have an impact on research objectives.
Although single-molecule measurement lays many traps for beginners (such as applying principles, constructing reaction cells, and designing experiments), predictably it will provide new platforms and opportunities for those who are proficient in the technology.
Author contributions
Chengyang Yan: formal analysis, writing – original draft, visualization. Xuanhao Mei: writing – review & editing, visualization. Xue Gong: writing – review & editing, visualization. Weilin Xu: funding acquisition, writing – review & editing, project administration.Conflicts of interest
There are no conflicts to declare.Acknowledgements
This work was supported by the National Science Foundation of China (21925205, 22072145, 22102172, 21721003).References
- S. Bayda, M. Adeel, T. Tuccinardi, M. Cordani and F. Rizzolio, The history of nanoscience and nanotechnology: From chemical-physical applications to nanomedicine, Molecules, 2020, 25, 112 CrossRef CAS.
- A. Huguet-Casquero, E. Gainza and J. L. Pedraz, Towards green nanoscience: From extraction to nanoformulation, Biotechnol. Adv., 2021, 46, 107657 CrossRef CAS PubMed.
- R. Lang, X. Du, Y. Huang, X. Jiang, Q. Zhang, Y. Guo, K. Liu, B. Qiao, A. Wang and T. Zhang, Single-atom catalysts based on the metal-oxide interaction, Chem. Rev., 2020, 120, 11986–12043 CrossRef CAS.
- R. Ryoo, J. Kim, C. Jo, S. W. Han, J.-C. Kim, H. Park, J. Han, H. S. Shin and J. W. Shin, Rare-earth–platinum alloy nanoparticles in mesoporous zeolite for catalysis, Nature, 2020, 585, 221–224 CrossRef CAS PubMed.
- Y. Yao, Q. Dong, A. Brozena, J. Luo, J. Miao, M. Chi, C. Wang, I. G. Kevrekidis, Z. J. Ren, J. Greeley, G. Wang, A. Anapolsky and L. Hu, High-entropy nanoparticles: Synthesis-structure-property relationships and data-driven discovery, Science, 2022, 376, eabn3103 CrossRef CAS.
- C. Guo, J. Ran, A. Vasileff and S.-Z. Qiao, Rational design of electrocatalysts and photo(electro)catalysts for nitrogen reduction to ammonia (NH3) under ambient conditions, Energy Environ. Sci., 2018, 11, 45–56 RSC.
- C. Jiang, S. J. A. Moniz, A. Wang, T. Zhang and J. Tang, Photoelectrochemical devices for solar water splitting – materials and challenges, Chem. Soc. Rev., 2017, 46, 4645–4660 RSC.
- Z. W. Seh, J. Kibsgaard, C. F. Dickens, I. Chorkendorff, J. K. Nørskov and T. F. Jaramillo, Combining theory and experiment in electrocatalysis: Insights into materials design, Science, 2017, 355, eaad4998 CrossRef PubMed.
- C. Tan, X. Cao, X. J. Wu, Q. He, J. Yang, X. Zhang, J. Chen, W. Zhao, S. Han, G. H. Nam, M. Sindoro and H. Zhang, Recent advances in ultrathin two-dimensional nanomaterials, Chem. Rev., 2017, 117, 6225–6331 CrossRef CAS PubMed.
- X.-M. Hu, S. U. Pedersen and K. Daasbjerg, Supported molecular catalysts for the heterogeneous CO2 electroreduction, Curr. Opin. Electrochem., 2019, 15, 148–154 CrossRef CAS.
- Z. Wang, J. Qi, N. Yang, R. Yu and D. Wang, Core–shell nano/microstructures for heterogeneous tandem catalysis, Mater. Chem. Front., 2021, 5, 1126–1139 RSC.
- T. Chen, B. Dong, K. Chen, F. Zhao, X. Cheng, C. Ma, S. Lee, P. Zhang, S. H. Kang, J. W. Ha, W. Xu and N. Fang, Optical super-resolution imaging of surface reactions, Chem. Rev., 2017, 117, 7510–7537 CrossRef CAS PubMed.
- Y. Li, X. Ning, Q. Ma, D. Qin and X. Lu, Recent advances in electrochemistry by scanning electrochemical microscopy, TrAC, Trends Anal. Chem., 2016, 80, 242–254 CrossRef CAS.
- Y. Lin, M. Zhou, X. Tai, H. Li, X. Han and J. Yu, Analytical transmission electron microscopy for emerging advanced materials, Matter, 2021, 4, 2309–2339 CrossRef CAS.
- D. Su, Advanced electron microscopy characterization of nanomaterials for catalysis, Green Energy Environ., 2017, 2, 70–83 CrossRef.
- T. Ha, T. Enderle, D. F. Ogletree, D. S. Chemla, P. R. Selvin and S. Weiss, Probing the interaction between two single molecules: Fluorescence resonance energy transfer between a single donor and a single acceptor, Proc. Natl. Acad. Sci. U. S. A., 1996, 93, 6264–6268 CrossRef CAS.
- G. Jung, A. Schmitt, M. Jacob and B. Hinkeldey, Fluorescent probes for chemical transformations on the single-molecule level, Ann. N. Y. Acad. Sci., 2008, 1130, 131–137 CrossRef CAS.
- N. M. Esfandiari and S. A. Blum, Homogeneous vs heterogeneous polymerization catalysis revealed by single-particle fluorescence microscopy, J. Am. Chem. Soc., 2011, 133, 18145–18147 CrossRef CAS.
- N. M. Esfandiari, Y. Wang, J. Y. Bass, T. P. Cornell, D. A. Otte, M. H. Cheng, J. C. Hemminger, T. M. McIntire, V. A. Mandelshtam and S. A. Blum, Single-molecule imaging of platinum ligand exchange reaction reveals reactivity distribution, J. Am. Chem. Soc., 2010, 132, 15167–15169 CrossRef CAS PubMed.
- M. B. Roeffaers, B. F. Sels, I. H. Uji, F. C. De Schryver, P. A. Jacobs, D. E. De Vos and J. Hofkens, Spatially resolved observation of crystal-face-dependent catalysis by single turnover counting, Nature, 2006, 439, 572–575 CrossRef CAS PubMed.
- W. Xu, J. S. Kong, Y. T. Yeh and P. Chen, Single-molecule nanocatalysis reveals heterogeneous reaction pathways and catalytic dynamics, Nat. Mater., 2008, 7, 992–996 CrossRef CAS.
- T. Tachikawa, S. Yamashita and T. Majima, Evidence for crystal-face-dependent TiO2 photocatalysis from single-molecule imaging and kinetic analysis, J. Am. Chem. Soc., 2011, 133, 7197–7204 CrossRef CAS PubMed.
- D. Axelrod, T. P. Burghardt and N. L. Thompson, Total internal reflection fluorescence, Annu. Rev. Biophys. Bioeng., 1984, 13, 247–268 CrossRef CAS PubMed.
- P. B. Garland, Optical evanescent wave methods for the study of biomolecular interactions, Q. Rev. Biophys., 1996, 29, 91–117 CrossRef CAS.
- B. A. Millis, Evanescent-wave field imaging: an introduction to total internal reflection fluorescence microscopy, Methods Mol. Biol., 2012, 823, 295–309 CrossRef CAS.
- M. Oheim, D. Loerke, R. H. Chow and W. Stühmer, Evanescent-wave microscopy: A new tool to gain insight into the control of transmitter release, Philos. Trans. R. Soc., B, 1999, 354, 307–318 CrossRef CAS.
- D. Axelrod, Total internal reflection fluorescence microscopy in cell biology, Traffic, 2001, 2, 764–774 CrossRef CAS PubMed.
- N. Rusk, The fluorescence microscope, Nat. Cell Biol., 2009, 11, S8–S9 CrossRef.
- J. C. Maxwell, Scientific worthies, Nature, 1877, 15, 389–391 CrossRef.
- H. Volkmann, Ernst Abbe and his work, Appl. Opt., 1966, 5, 1720–1731 CrossRef CAS PubMed.
- A. Hollaender, Effects of ultraviolet radiation, Annu. Rev. Physiol., 1946, 8, 1–16 CrossRef CAS PubMed.
- P. G. Kevan, L. Chittka and A. G. Dyer, Limits to the salience of ultraviolet: Lessons from colour vision in bees and birds, J. Exp. Biol., 2001, 204, 2571–2580 CrossRef CAS PubMed.
- Y. Kumamoto, A. Taguchi and S. Kawata, Deep-ultraviolet biomolecular imaging and analysis, Adv. Opt. Mater., 2019, 7, 1801099 CrossRef.
- G. Nemethy and A. Ray, Solvent effects on the near-ultraviolet spectrum of phenol and its distribution in micellar solutions, J. Phys. Chem., 1973, 77, 64–68 CrossRef CAS.
- J. C. Ogilvie, Ultraviolet radiation and vision, AMA Arch. Ophthalmol., 1953, 50, 748–763 CrossRef CAS PubMed.
- J. A. Parrish, Ultraviolet radiation affects the immune system, Pediatrics, 1983, 71, 129–133 CrossRef CAS PubMed.
- M. W. Davidson, Pioneers in optics: Zacharias Janssen and Johannes Kepler, Microsc. Today, 2009, 17, 44–47 Search PubMed.
- S. Schmitz and C. Desel, Der Experimentator Zellbiologie, Springer Spektrum Berlin, Heidelberg, 2018 Search PubMed.
- D. Axelrod, Cell-substrate contacts illuminated by total internal reflection fluorescence, J. Cell Biol., 1981, 89, 141–145 CrossRef CAS PubMed.
- R. J. Schechter, Snell's Law: Optimum pathway analysis, Surv. Ophthalmol., 1977, 21, 464–466 CrossRef CAS PubMed.
- J. Fang, Q. Chen, Z. Li, J. Mao and Y. Li, The synthesis of single-atom catalysts for heterogeneous catalysis, Chem. Commun., 2023, 59, 2854–2868 RSC.
- J. Li, M. F. Stephanopoulos and Y. Xia, Introduction: Heterogeneous single-atom catalysis, Chem. Rev., 2020, 120, 11699–11702 CrossRef CAS.
- A. Wang, J. Li and T. Zhang, Heterogeneous single-atom catalysis, Nat. Rev. Chem., 2018, 2, 65–81 CrossRef CAS.
- A. Ikesue and Y. L. Aung, Ceramic laser materials, Nat. Photonics, 2008, 2, 721–727 CrossRef CAS.
- M. Oxborrow, J. D. Breeze and N. M. Alford, Room-temperature solid-state maser, Nature, 2012, 488, 353–356 CrossRef CAS.
- T. Cordes and S. A. Blum, Opportunities and challenges in single-molecule and single-particle fluorescence microscopy for mechanistic studies of chemical reactions, Nat. Chem., 2013, 5, 993–999 CrossRef CAS.
- K. M. Dean and A. E. Palmer, Advances in fluorescence labeling strategies for dynamic cellular imaging, Nat. Chem. Biol., 2014, 10, 512–523 CrossRef CAS PubMed.
- P. J. Hayes, Computer programming as a cognitive paradigm, Nature, 1975, 254, 563–566 CrossRef.
- M. Krenn, R. Pollice, S. Y. Guo, M. Aldeghi, A. Cervera-Lierta, P. Friederich, G. Dos Passos Gomes, F. Häse, A. Jinich, A. Nigam, Z. Yao and A. Aspuru-Guzik, On scientific understanding with artificial intelligence, Nat. Rev. Phys., 2022, 4, 761–769 CrossRef.
- N. G. Walter, C. Y. Huang, A. J. Manzo and M. A. Sobhy, Do-it-yourself guide: How to use the modern single-molecule toolkit, Nat. Methods, 2008, 5, 475–489 CrossRef CAS.
- S. M. van den Wildenberg, Y. J. Bollen and E. J. Peterman, How to quantify protein diffusion in the bacterial membrane, Biopolymers, 2011, 95, 312–321 CrossRef CAS PubMed.
- T. Wazawa and M. Ueda, Total internal reflection fluorescence microscopy in single molecule nanobioscience, Adv. Biochem. Eng./Biotechnol., 2005, 95, 77–106 CrossRef CAS PubMed.
- N. S. Poulter, W. T. Pitkeathly, P. J. Smith and J. Z. Rappoport, The physical basis of total internal reflection fluorescence (TIRF) microscopy and its cellular applications, Methods Mol. Biol., 2015, 1251, 1–23 CrossRef CAS PubMed.
- T. Chen, Y. Zhang and W. Xu, Single-Molecule Nanocatalysis Reveals Catalytic Activation Energy of Single Nanocatalysts, J. Am. Chem. Soc., 2016, 138, 12414–12421 CrossRef CAS.
- R. Narayanan and M. A. El-Sayed, Catalysis with transition metal nanoparticles in colloidal solution: nanoparticle shape dependence and stability, J. Phys. Chem. B, 2005, 109, 12663–12676 CrossRef CAS PubMed.
- X. Liu, X. Ge, J. Cao, Y. Xiao, Y. Wang, W. Zhang, P. Song and W. Xu, Revealing the catalytic kinetics and dynamics of individual Pt atoms at the single-molecule level, Proc. Natl. Acad. Sci. U. S. A., 2022, 119, e2114639119 CrossRef CAS PubMed.
- T. Chen, Y. Zhang and W. Xu, Single-Molecule Nanocatalysis Reveals Catalytic Activation Energy of Single Nanocatalysts, J. Am. Chem. Soc., 2016, 138, 12414–12421 CrossRef CAS PubMed.
- Y. Zhang, T. Chen, S. Alia, B. S. Pivovar and W. Xu, Single-Molecule Nanocatalysis Shows In Situ Deactivation of Pt/C Electrocatalysts during the Hydrogen-Oxidation Reaction, Angew. Chem., Int. Ed., 2016, 55, 3086–3090 CrossRef CAS PubMed.
- T. Gibaud, E. Barry, M. J. Zakhary, M. Henglin, A. Ward, Y. Yang, C. Berciu, R. Oldenbourg, M. F. Hagan, D. Nicastro, R. B. Meyer and Z. Dogic, Reconfigurable self-assembly through chiral control of interfacial tension, Nature, 2012, 481, 348–351 CrossRef CAS PubMed.
- Y. Senju and S. Suetsugu, Spatiotemporal analysis of caveolae dynamics using total internal reflection fluorescence microscopy, Methods Mol. Biol., 2020, 2169, 63–70 CrossRef CAS.
- A. Ayati, A. Ahmadpour, F. F. Bamoharram, B. Tanhaei, M. Mänttäri and M. Sillanpää, A review on catalytic applications of Au/TiO2 nanoparticles in the removal of water pollutant, Chemosphere, 2014, 107, 163–174 CrossRef CAS PubMed.
- F.-K. Liu, Analysis and applications of nanoparticles in the separation sciences: A case of gold nanoparticles, J. Chromatogr. A, 2009, 1216, 9034–9047 CrossRef CAS.
- J. T. Miller, A. J. Kropf, Y. Zha, J. R. Regalbuto, L. Delannoy, C. Louis, E. Bus and J. A. van Bokhoven, The effect of gold particle size on AuAu bond length and reactivity toward oxygen in supported catalysts, J. Catal., 2006, 240, 222–234 CrossRef CAS.
- A. J. McCue and J. A. Anderson, Recent advances in selective acetylene hydrogenation using palladium containing catalysts, Front. Chem. Sci. Eng., 2015, 9, 142–153 CrossRef CAS.
- C. Vogt, F. Meirer, M. Monai, E. Groeneveld, D. Ferri, R. A. van Santen, M. Nachtegaal, R. R. Unocic, A. I. Frenkel and B. M. Weckhuysen, Dynamic restructuring of supported metal nanoparticles and its implications for structure insensitive catalysis, Nat. Commun., 2021, 12, 7096 CrossRef CAS PubMed.
- M. Yamauchi, H. Kobayashi and H. Kitagawa, Hydrogen storage mediated by Pd and Pt nanoparticles, ChemPhysChem, 2009, 10, 2566–2576 CrossRef CAS PubMed.
- S. B. Kalidindi and B. R. Jagirdar, Nanocatalysis and Prospects of Green Chemistry, ChemSusChem, 2012, 5, 65–75 CrossRef CAS PubMed.
- Z. Yu, X. Lu, X. Wang, J. Xiong, X. Li, R. Zhang and N. Ji, Metal-catalyzed hydrogenation of biomass-derived furfural: Particle size effects and regulation strategies, ChemSusChem, 2020, 13, 5185–5198 CrossRef CAS PubMed.
- F. M. de Groot, E. de Smit, M. M. van Schooneveld, L. R. Aramburo and B. M. Weckhuysen, In-situ scanning transmission X-ray microscopy of catalytic solids and related nanomaterials, ChemPhysChem, 2010, 11, 951–962 CrossRef CAS PubMed.
- E. Kim, J. Lee, D. Kim, K. E. Lee, S. S. Han, N. Lim, J. Kang, C. G. Park and K. Kim, Solvent-responsive polymernanocapsules with controlled permeability: Encapsulation and release of a fluorescent dye by swelling and deswelling, Chem. Commun., 2009, 1472–1474 RSC.
- J. Liu, Scanning transmission electron microscopy and its application to the study of nanoparticles and nanoparticle systems, J. Electron Microsc., 2005, 54, 251–278 CrossRef CAS PubMed.
- Y. Zhang, P. Song, T. Chen, X. Liu, T. Chen, Z. Wu, Y. Wang, J. Xie and W. Xu, Unique size-dependent nanocatalysis revealed at the single atomically precise gold cluster level, Proc. Natl. Acad. Sci. U. S. A., 2018, 115, 10588–10593 CrossRef CAS PubMed.
- K. S. Han, G. Liu, X. Zhou, R. E. Medina and P. Chen, How does a single Pt nanocatalyst behave in two different reactions? A single-molecule study, Nano Lett., 2012, 12, 1253–1259 CrossRef CAS.
- M. Boronat, A. Leyva-Pérez and A. Corma, Theoretical and experimental insights into the origin of the catalytic activity of subnanometric gold clusters: Attempts to predict reactivity with clusters and nanoparticles of gold, Acc. Chem. Res., 2014, 47, 834–844 CrossRef CAS PubMed.
- T. Chen, S. Chen, Y. Zhang, Y. Qi, Y. Zhao, W. Xu and J. Zeng, Catalytic Kinetics of Different Types of Surface Atoms on Shaped Pd Nanocrystals, Angew. Chem., Int. Ed., 2016, 55, 1839–1843 CrossRef CAS PubMed.
- F. Cheng, T. Zhang, Y. Zhang, J. Du, X. Han and J. Chen, Enhancing electrocatalytic oxygen reduction on MnO2 with vacancies, Angew. Chem., Int. Ed., 2013, 52, 2474–2477 CrossRef CAS PubMed.
- W. He, Y. Wang, C. Jiang and L. Lu, Structural effects of a carbon matrix in non-precious metal O2-reduction electrocatalysts, Chem. Soc. Rev., 2016, 45, 2396–2409 RSC.
- J. Wu, M. Shi, X. Yin and H. Yang, Enhanced stability of (111)-surface-dominant core–shell nanoparticle catalysts towards the oxygen reduction reaction, ChemSusChem, 2013, 6, 1888–1892 CrossRef CAS PubMed.
- X. Xia, Y. Wang, D. Wang, Y. Zhang, Z. Fan, J. Tu, H. Zhang and H. J. Fan, Atomic-layer-deposited iron oxide on arrays of metal/carbon spheres and their application for electrocatalysis, Nano Energy, 2016, 20, 244–253 CrossRef CAS.
- X. Zhang, X. Wang, L. Le, A. Ma and S. Lin, Electrochemical growth of octahedral Fe3O4 with high activity and stability toward the oxygen reduction reaction, J. Mater. Chem. A, 2015, 3, 19273–19276 RSC.
- Y. Xiao, J. Hong, X. Wang, T. Chen, T. Hyeon and W. Xu, Revealing kinetics of two-electron oxygen reduction reaction at single-molecule level, J. Am. Chem. Soc., 2020, 142, 13201–13209 CrossRef CAS PubMed.
- F. Dvořák, M. F. Camellone, A. Tovt, N.-D. Tran, F. R. Negreiros, M. Vorokhta, T. Skála, I. Matolínová, J. Mysliveček, V. Matolín and S. Fabris, Creating single-atom Pt-ceria catalysts by surface step decoration, Nat. Commun., 2016, 7, 10801 CrossRef PubMed.
- L. Han, H. Cheng, W. Liu, H. Li, P. Ou, R. Lin, H.-T. Wang, C.-W. Pao, A. R. Head, C.-H. Wang, X. Tong, C.-J. Sun, W.-F. Pong, J. Luo, J.-C. Zheng and H. L. Xin, A single-atom library for guided monometallic and concentration-complex multimetallic designs, Nat. Mater., 2022, 21, 681–688 CrossRef CAS PubMed.
- K. Jiang, M. Luo, Z. Liu, M. Peng, D. Chen, Y.-R. Lu, T.-S. Chan, F. M. F. de Groot and Y. Tan, Rational strain engineering of single-atom ruthenium on nanoporous MoS2 for highly efficient hydrogen evolution, Nat. Commun., 2021, 12, 1687 CrossRef CAS PubMed.
- H. Yan, C. Su, J. He and W. Chen, Single-atom catalysts and their applications in organic chemistry, J. Mater. Chem. A, 2018, 6, 8793–8814 RSC.
- G. Chen, N. Zou, B. Chen, J. B. Sambur, E. Choudhary and P. Chen, Bimetallic Effect of Single Nanocatalysts Visualized by Super-Resolution Catalysis Imaging, ACS Cent. Sci., 2017, 3, 1189–1197 CrossRef CAS PubMed.
- N. P. Dogantzis, G. K. Hodgson and S. Impellizzeri, Optical writing and single molecule reading of photoactivatable and silver nanoparticle-enhanced fluorescence, Nanoscale Adv., 2020, 2, 1956–1966 RSC.
- N. Zou, G. Chen, X. Mao, H. Shen, E. Choudhary, X. Zhou and P. Chen, Imaging catalytic hotspots on single plasmonic nanostructures via correlated super-resolution and electron microscopy, ACS Nano, 2018, 12, 5570–5579 CrossRef CAS.
- A. C. Alba-Rubio, C. Sener, S. H. Hakim, T. M. Gostanian and J. A. Dumesic, Synthesis of supported RhMo and PtMo bimetallic catalysts by controlled surface reactions, ChemCatChem, 2015, 7, 3881–3886 CrossRef CAS.
- R. Wei, N. Tang, L. Jiang, J. Yang, J. Guo, X. Yuan, J. Liang, Y. Zhu, Z. Wu and H. Li, Bimetallic nanoparticles meet polymeric carbon nitride: Fabrications, catalytic applications and perspectives, Coord. Chem. Rev., 2022, 462, 214500 CrossRef CAS.
- Y. Zhang, G. Li and Y. Hu, Fabrication of bimetallic nanoparticles modified hollow nanoporous carbons derived from covalent organic framework for efficient degradation of 2,4-dichlorophenol, Chin. Chem. Lett., 2021, 32, 2529–2533 CrossRef CAS.
- Y. Zhao, C. Ye, W. Liu, R. Chen and X. Jiang, Tuning the composition of AuPt bimetallic nanoparticles for antibacterial application, Angew. Chem., Int. Ed., 2014, 53, 8127–8131 CrossRef CAS PubMed.
- P. T. M. Do, A. J. Foster, J. Chen and R. F. Lobo, Bimetallic effects in the hydrodeoxygenation of meta-cresol on γ-Al2O3 supported Pt–Ni and Pt–Co catalysts, Green Chem., 2012, 14, 1388–1397 RSC.
- Y. F. Nishimura, H. J. Peng, S. Nitopi, M. Bajdich, L. Wang, C. G. Morales-Guio, F. Abild-Pedersen, T. F. Jaramillo and C. Hahn, Guiding the catalytic properties of copper for electrochemical CO2 reduction by metal atom decoration, ACS Appl. Mater. Interfaces, 2021, 13, 52044–52054 CrossRef CAS PubMed.
- Y. Wang, L. R. Winter, J. G. Chen and B. Yan, CO2 hydrogenation over heterogeneous catalysts at atmospheric pressure: from electronic properties to product selectivity, Green Chem., 2021, 23, 249–267 RSC.
- X.-C. Fan, K. Wang, C.-J. Zheng, G.-L. Dai, Y.-Z. Shi, Y.-Q. Li, J. Yu, X.-M. Ou and X.-H. Zhang, Thermally activated delayed fluorescence emitters with low concentration sensitivity for highly efficient organic light emitting devices, J. Mater. Chem. C, 2019, 7, 8923–8928 RSC.
- M. R. Radlauer, M. W. Day and T. Agapie, Bimetallic effects on ethylene polymerization in the presence of amines: inhibition of the deactivation by Lewis bases, J. Am. Chem. Soc., 2012, 134, 1478–1481 CrossRef CAS PubMed.
- R. F. Hamans, M. Parente and A. Baldi, Super-resolution mapping of a chemical reaction driven by plasmonic near-fields, Nano Lett., 2021, 21, 2149–2155 CrossRef CAS.
- M. Omidi, A. Fatehinya, M. M. Farahani, Z. Akbari, S. Shahmoradi, F. Yazdian, M. Tahriri, K. Moharamzadeh, L. Tayebi and D. Vashaee, in Biomaterials for oral and dental tissue engineering, Woodhead Publishing, 2017 Search PubMed.
- C. J. Peddie, C. Genoud, A. Kreshuk, K. Meechan, K. D. Micheva, K. Narayan, C. Pape, R. G. Parton, N. L. Schieber, Y. Schwab, B. Titze, P. Verkade, A. Weigel and L. M. Collinson, Volume electron microscopy, Nat. Rev. Methods Primers, 2022, 2, 51 CrossRef CAS.
- P. Arpino, Combined liquid chromatography mass spectrometry. Part I. Coupling by means of a moving belt interface, Mass Spectrom. Rev., 1989, 8, 35–55 CrossRef CAS.
- L. Fang, J. Deng, Y. Yang, X. Wang, B. Chen, H. Liu, H. Zhou, G. Ouyang and T. Luan, Coupling solid-phase microextraction with ambient mass spectrometry: Strategies and applications, TrAC, Trends Anal. Chem., 2016, 85, 61–72 CrossRef CAS.
- G. Morlock and W. Schwack, Coupling of planar chromatography to mass spectrometry, TrAC, Trends Anal. Chem., 2010, 29, 1157–1171 CrossRef CAS.
- M. Zoccali, P. Q. Tranchida and L. Mondello, Fast gas chromatography-mass spectrometry: A review of the last decade, TrAC, Trends Anal. Chem., 2019, 118, 444–452 CrossRef CAS.
- F.-M. Boldt, J. Heinze, M. Diez, J. Petersen and M. Börsch, Real-time pH microscopy down to the molecular level by combined scanning electrochemical microscopy/single-molecule fluorescence pectroscopy, Anal. Chem., 2004, 76, 3473–3481 CrossRef CAS PubMed.
- J. Madl, S. Rhode, H. Stangl, H. Stockinger, P. Hinterdorfer, G. J. Schütz and G. Kada, A combined optical and atomic force microscope for live cell investigations, Ultramicroscopy, 2006, 106, 645–651 CrossRef CAS PubMed.
- M. Micic, D. Hu, Y. D. Suh, G. Newton, M. Romine and H. P. Lu, Correlated atomic force microscopy and fluorescence lifetime imaging of live bacterial cells, Colloids Surf., B, 2004, 34, 205–212 CrossRef CAS PubMed.
- A. Miranda, A. I. Gómez-Varela, A. Stylianou, L. M. Hirvonen, H. Sánchez and P. A. A. De Beule, How did correlative atomic force microscopy and super-resolution microscopy evolve in the quest for unravelling enigmas in biology?, Nanoscale, 2021, 13, 2082–2099 RSC.
- V. Hamel and P. Guichard, Improving the resolution of fluorescence nanoscopy using post-expansion labeling microscopy, Methods Cell Biol., 2021, 161, 297–315 Search PubMed.
- D. Mahecic, I. Testa, J. Griffié and S. Manley, Strategies for increasing the throughput of super-resolution microscopies, Curr. Opin. Chem. Biol., 2019, 51, 84–91 CrossRef CAS.
- H. Muramatsu, N. Chiba, T. Ataka, S. Iwabuchi, N. Nagatani, E. Tamiya and M. Fujihira, Scanning near-field optical/atomic force microscopy for fluorescence imaging and spectroscopy of biomaterials in air and liquid: Observation of recombinantEscherichia coli with gene coding to green fluorescent protein, Opt. Rev., 1996, 3, 470–474 CrossRef CAS.
- E. H. Stelzer, Light-sheet fluorescence microscopy for quantitative biology, Nat. Methods, 2015, 12, 23–26 CrossRef CAS PubMed.
- J. W. Lichtman and J. A. Conchello, Fluorescence microscopy, Nat. Methods, 2005, 2, 910–919 CrossRef CAS.
- A. M. Achimovich, H. Ai and A. Gahlmann, Enabling technologies in super-resolution fluorescence microscopy: reporters, labeling, and methods of measurement, Curr. Opin. Chem. Biol., 2019, 58, 224–232 CAS.
- L. Chen, X. Chen, X. Yang, C. He, M. Wang, P. Xi and J. Gao, Advances of super-resolution fluorescence polarization microscopy and its applications in life sciences, Comput. Struct. Biotechnol. J., 2020, 18, 2209–2216 CrossRef CAS PubMed.
- K. Nienhaus and G. U. Nienhaus, Where do we stand with super-resolution optical microscopy?, J. Mol. Biol., 2016, 428, 308–322 CrossRef CAS PubMed.
- S. Yoshida and L. Kisley, Super-resolution fluorescence imaging of extracellular environments, Spectrochim. Acta, Part A, 2021, 257, 119767 CrossRef CAS PubMed.
- J. W. Lichtman and J.-A. Conchello, Fluorescence microscopy, Nat. Methods, 2005, 2, 910–919 CrossRef CAS PubMed.
- H. L. Riva and T. R. Turner, Further experience with fluorescence microscopy in exfoliative cytology: A ten-second acridine orange staining technique for cytologic cancer screening by fluorescence microscopy, Am. J. Obstet. Gynecol., 1963, 85, 713–723 CrossRef CAS PubMed.
- M. Collot, S. Pfister and A. S. Klymchenko, Advanced functional fluorescent probes for cell plasma membranes, Curr. Opin. Chem. Biol., 2022, 69, 102161 CrossRef CAS PubMed.
- V.-N. Nguyen, J. Ha, M. Cho, H. Li, K. M. K. Swamy and J. Yoon, Recent developments of BODIPY-based colorimetric and fluorescent probes for the detection of reactive oxygen/nitrogen species and cancer diagnosis, Coord. Chem. Rev., 2021, 439, 213936 CrossRef CAS.
- Y. Wang, L. Zhang, X. Han, L. Zhang, X. Wang and L. Chen, Fluorescent probe for mercury ion imaging analysis: Strategies and applications, Chem. Eng. J., 2021, 406, 127166 CrossRef CAS.
- X. Fang and W. Tan, Imaging single fluorescent molecules at the interface of an optical fiber probe by evanescent wave excitation, Anal. Chem., 1999, 71, 3101–3105 CrossRef CAS.
- G. R. Gossweiler, T. B. Kouznetsova and S. L. Craig, Force-rate characterization of two spiropyran-based molecular force probes, J. Am. Chem. Soc., 2015, 137, 6148–6151 CrossRef CAS PubMed.
- C. Wei, R. Wang, C. Zhang, G. Xu, Y. Li, Q. Z. Zhang, L. Y. Li, L. Yi and Z. Xi, Dual-reactable fluorescent probes for highly Selective and sensitive detection of biological H2S, Chem. – Asian J., 2016, 11, 1376–1381 CrossRef CAS PubMed.
| This journal is © Institute of Process Engineering of CAS 2024 |

