
 Open Access Article
 This Open Access Article is licensed under a
 Creative Commons Attribution 3.0 Unported Licence
Subcritical CO2–H2O hydrolysis of polyethylene terephthalate as a sustainable chemical recycling platform†
Dacosta
Osei
abc,
Lakshmiprasad
Gurrala
 ab,
Aria
Sheldon
ab,
Jackson
Mayuga
ab,
Clarissa
Lincoln
de,
Nicholas A.
Rorrer
de and
Ana Rita C.
Morais
*ab
ab,
Aria
Sheldon
ab,
Jackson
Mayuga
ab,
Clarissa
Lincoln
de,
Nicholas A.
Rorrer
de and
Ana Rita C.
Morais
*ab
aDepartment of Chemical and Petroleum Engineering, University of Kansas, Lawrence, Kansas 66045, USA. E-mail: ana.morais@ku.edu
bWonderful Institute for Sustainable Engineering, University of Kansas, Lawrence, Kansas 66045, USA
cCenter for Environmentally Beneficial Catalysis, University of Kansas, Lawrence, Kansas 66047, USA
dRenewable Resources and Enabling Sciences Center, National Renewable Energy Laboratory, Golden, CO, 80401, USA
eBOTTLE Consortium, Golden, CO 80401, USA
First published on 13th February 2024
Abstract
The development of an efficient and environmentally sustainable chemical hydrolysis process for recycling waste plastics, based on green chemistry principles, is a key challenge. In this work, we investigated the role of subcritical CO2 on the hydrolysis of polyethylene terephthalate (PET) into terephthalic acid (TPA) at 180–200 °C for 10–100 min. The addition of CO2 into the reaction mixture led to the in situ formation of carbonic acid that helps to catalyze PET hydrolysis relative to hot compressed H2O (i.e. N2–H2O). The highest TPA yield of 85.0 ± 1.3% was obtained at 200 °C, PET loading of 2.5 g PET in 20 mL H2O for 100 min, and 208 psi of initial CO2 pressure. In addition, the subcritical CO2–H2O system demonstrated high selectivity toward hydrolyzing PET in a mixture with polyethylene (PE) at 200 °C for 100 min, thus providing “molecular sorting” capabilities to the recycling process. The robustness of the process was also demonstrated by the ability to hydrolyze both colored Canada Dry and transparent Pure Life® waste PET bottles into high yields of TPA (>86%) at 200 °C. In addition, subcritical CO2–H2O hydrolysis of colored PET bottles resulted in a white TPA product similar to that generated from transparent PET bottles. Overall, this work shows that, under optimized reaction conditions, subcritical CO2 can provide acid tunability to the reaction medium to favor waste PET hydrolysis for subsequent recycling.
1. Introduction
Plastics have become a common commodity in the global market and are indispensable to our society. The current worldwide production of polyethylene terephthalate (PET) is exceeding 82 million metric tons per year.1 Despite their widespread use, PET mechanical recycling rates in the US are <19% and about 80% of waste PET is landfilled.2 To address this issue, various chemical recycling processes (including solvolysis and thermal depolymerization approaches) have been actively developed over the past years to produce monomers from end-of-life PET.3–5 The produced and purified monomers can undergo repolymerization to produce recycled PET with virgin-like properties.4Hydrolysis of PET into terephthalic acid (TPA) and ethylene glycol (EG) has received increasing attention because TPA is the major component in commercial production of PET.6 In the case of acid hydrolysis, mineral acids, such as concentrated H2SO4 and HNO3, are used.7–9 However, the major limitations associated with the mineral acid-catalyzed hydrolysis are severe corrosion issues, the need for highly polar solvents for TPA recrystallization, and generation of both inorganic salts and deleterious wastes.10,11 Another important limitation associated with H2SO4-catalyzed hydrolysis is the carbonization of the products, notably EG, induced by the strong dehydrating effect of the acid, leading to lower reaction yields.11
Neutral hydrolysis is an environmentally-friendly alternative to acid hydrolysis as it is performed using steam or water in the presence of water-soluble salts.5,12 Pereira et al. studied the performance of H2O at varying temperatures (190–400 °C) and pressures (1–35 MPa) on the hydrolysis of both solid and molten PET.13 A high TPA yield (>85%) was observed when molten PET was hydrolyzed in saturated liquid H2O (311 °C, 10 MPa and 30 min of reaction time). The cleavage of ester bonds by H2O is promoted by the development of acidity at high temperatures.14 Marshal and Frank reported that the ion product (Kw) of H2O increases with temperature and reaches a maximum of 6.34 × 10⁻¹², which results in a pH of 5.5 at 220 °C.15 Significantly faster hydrolysis rates have been reported for molten PET than PET in the solid state; thus, reactions performed at temperatures greater than the melting temperature (Tm) of the substrate are highly recommended.5,16 Campanelli et al. reported that complete hydrolytic depolymerization of PET into monomer was achieved at 265 °C and with a H2O![[thin space (1/6-em)]](https://www.rsc.org/images/entities/char_2009.gif) :PET ratio >5:1 w/w. However, lower H2O loadings (H2O:PET ratio of 2:1 w/w) resulted in incomplete depolymerization due to the establishment of equilibrium conditions.17 It is worth mentioning that neutral hydrolysis requires high temperatures (>250 °C) and pressures (1–45 MPa),18 and long reaction times.13,16,19 In addition, the TPA produced through neutral hydrolysis has a considerably lower purity than that produced by acid hydrolysis. This is because impurities present in the waste PET, including dyes, pigments, metal catalysts, dicarboxylic acids, etc., are not easily separated from the TPA during reaction, and additional purification steps are required.5,11
:PET ratio >5:1 w/w. However, lower H2O loadings (H2O:PET ratio of 2:1 w/w) resulted in incomplete depolymerization due to the establishment of equilibrium conditions.17 It is worth mentioning that neutral hydrolysis requires high temperatures (>250 °C) and pressures (1–45 MPa),18 and long reaction times.13,16,19 In addition, the TPA produced through neutral hydrolysis has a considerably lower purity than that produced by acid hydrolysis. This is because impurities present in the waste PET, including dyes, pigments, metal catalysts, dicarboxylic acids, etc., are not easily separated from the TPA during reaction, and additional purification steps are required.5,11
The aforementioned shortcomings associated with both acid and neutral hydrolysis can be alleviated by the use of CO2. CO2 is known as a green chemical because it is nonflammable, nontoxic and readily available, and it is applied in diverse applications.5,20,21 One of them is its use in polymer modification.22–24 Due to its plasticization effect, the dissolution of CO2 in polymers alters their properties at both the glassy and rubbery states, promotes swelling,25–27 and depresses both glass transition and crystallization temperature,28–30 which can lead to crystallization of amorphous regions within the polymer.31 Another application is the use of CO2 for chemical deconstruction of plastics.32–36 For instance, Liu and Yin reported that the addition of CO2 to the supercritical methanolysis of PET resulted in superior dimethyl terephthalate (DMT) yields (up to 95%) relative to the process without CO2.32 Recently, Yu et al. reported that the addition of 2 MPa of CO2 to the ethanolysis of PET resulted in 37% higher product yield in comparision with CO2-free ethanolysis.34 Li et al. investigated the mechanism of hydrolysis of waste PET bottles in the presence of a solid super-acid catalyst (SO42−/TiO2) and supercritical CO2 (scCO2) and reported that scCO2 improve the efficiency of the process due to its ability to carry more H2O and H3O+ inside the substrate.37 Also, the hydrolysis of waste bottle PET in WOx/TiO2 solid acid catalysts and scCO2 was investigated by Guo et al., who reported that scCO2 promotes the swelling of the substrate and carries H2O and hydronium ions into the amorphous region of PET matrix.33
The dissolution of CO2 in H2O provides a tunable acidic medium through the generation of carbonic acid (H2CO3) in situ, which loses protons to form bicarbonate (HCO3−) and later carbonate (CO32−) anions,38 according to the following equations:
| CO2 + 2H2O ↔ HCO3− + H3O+; HCO3− + H2O ↔ CO32− + H3O+ | (1) |
The acidity of the subcritical CO2–H2O system is influenced by the solubility of CO2 and dissociation of H2CO3 in H2O.38 Hunter and Savage reported that at temperatures >150 °C, the solubility of CO2 (at given amount) in H2O increases with increasing temperature, while the dissociation of H2CO3 in H2O decreases with temperature.38 Thus, overall temperature dependence of pH in the CO2–H2O system is much more influenced by the temperature dependence of first dissociation constant (Ka1) than the temperature dependence of dissolution of CO2 in H2O. This indicates that the addition of CO2 will be mostly effective in inducing acid-hydrolysis of PET at temperatures between 150 and 200 °C.38 At constant temperature, the extent of CO2 dissolution in H2O increases with increasing pressure. Thus, through thermodynamic fine-control (i.e. temperature, pressure and composition), the CO2–H2O reaction mixture can reach pH values low enough to induce cleavage of acid-labile ester bonds and provide reaction rates that are greater than those that occur in hot compressed H2O (no added CO2) reactions. Unlike mineral acid-catalyzed hydrolysis, the acidity of the medium generated by the addition of CO2 does not represent an issue, as the pH of the system increases when CO2 is released.20 In addition, no neutralization waste is produced as CO2 can be easily recovered and reused, and equipment corrosion issues are reduced relative to mineral acids.20
Although the use of subcritical CO2–H2O mixture for the processing of many different biomasses (e.g., wheat straw, elephant grass) has been widely reported by our group20,39–43 and other authors,44–46 to the best of our knowledge, this technology has been scarcely applied to waste plastics, such as PET. In this work, the feasibility of subcritical CO2–H2O mixture to catalyze the hydrolysis of PET was investigated. The effect of key operational conditions, including CO2 pressure, temperature and residence time on the hydrolysis performance was investigated to identify optimal conditions. Further, the potential of this process to selectively hydrolyze PET within a mixture with other plastics (such as PE), and its robustness to handle real waste PET substrates (colored and transparent waste PET bottles) was scrutinized.
2. Experimental section
2.1. Materials
Granular semicrystalline PET (3–5 mm, product code: ES30-GL-000115), powder semicrystalline PET (300 μm, product code: ES30-PD-000132), amorphous PET film (product code: ES30-FM-000145) and polyethylene (150 μm, product code: ET30-PD-000110) were procured from Goodfellow Corporation (Pittsburgh, PA, USA). Amorphous PET film was cut into squares of 1 × 1 cm dimensions before cryogrinding. Colored Canada Dry soda, Mountain Dew® and Twist Up and transparent Pure Life® PET bottles were used as examples of colored and transparent waste PET bottles, respectively. The bottles were thoroughly washed and dried before usage. Terephthalic acid (TPA, purity = 99%, #CAS 100-21-0) was obtained from ACROS Organics (ThermoFisher Scientific, Waltham, MA, USA). Mono (2-hydroxyethyl) terephthalate (MHET) (95% purity, #CAS 1137-99-1) was purchased from AmBeed (Arlington Heights, IL, USA). Bis(2-hydroxyethyl) terephthalate (BHET) (#CAS 959-26-2), dimethyl sulfoxide (DMSO) (HPLC grade, #CAS 67-68-5), methanol (HPLC grade, #CAS 67-56-1), formic acid (FA) (99% purity, #CAS 64-18-6) sodium hydroxide (#CAS 1310-73-2), acetonitrile (CH3CN) (HPLC grade, #CAS 75-05-8), and hydrochloric acid (#CAS 7647-01-0) were obtained from Sigma-Aldrich (St Louis, MO, USA). The carbon dioxide (CO2) and nitrogen (N2) of research purity was procured from Matheson (Irving, TX, USA). All the chemicals were used as-received.2.2. PET feedstock preparation
Granular semicrystalline PET was used directly with no additional sample preparation. Amorphous PET, colored Canada Dry and transparent Pure Life® waste PET bottles, and colored waste PET Mountain Dew and Twist Up bottles were cryoground in a SPEX SamplePrep 6770 Freezer mill at conditions of 10 counts per second (CPS), 10 min precooling, 1 min run time and 1 min cooling. This procedure was performed until a particle size <300 μm was achieved. Then, after cryogrinding, cryoground samples were sieved using a Retsch vibratory sieve shaker (AS 200) by combining two sieves (American Standard Test Sieve Series) of different sizes (i.e. 106 μm and 300 μm) to obtain a particle size between 106 and 300 μm. Similarly, the pristine powder PET was also sieved between 106 and 300 μm. The sieved samples were then stored in sealed glass bottles at room temperature.2.3. Subcritical CO2–H2O hydrolysis
Subcritical CO2–H2O hydrolysis experiments were carried out using a 100 mL Series 4590 micro stirred reactor from Parr Instrument Company (Moline, IL, USA), equipped with a thermocouple, flour-blade turbine impeller, heating jacket, and pressure transducer. Temperature and pressure were controlled using a Parr PID controller (4848). The reactions were carried out at varying temperatures, notably 180, 190 and 200 °C, initial CO2 pressures ranging from 108 to 408 psi and up to 100 min of residence time. The PET-to-H2O loading of 1:8 (w/w) and an agitation speed of 400 rpm were maintained constant in all experiments. Prior to the reaction, the autoclave was flushed 3 times with CO2 or N2. Upon reaching set reaction times, the reactor was rapidly cooled down using a water bath to quench the reaction and CO2 (or N2) was released when the reactor reached room temperature. The reactor contents were filtered under vacuum (Millipore vacuum pump, model no. WP6111560), using a Whatman filter paper (47 mm diameter and 0.2 μm pore size), and the volume of the post-reaction liquid fraction was measured. 200 μl of the filtrate was diluted in 25 mL of DMSO and analyzed by High-Pressure Liquid Chromatography (HPLC). Because the TPA is insoluble in H2O at room temperature, the solid fraction, which included leftover PET, TPA and other H2O-insoluble products, was dried in a vacuum oven 40 °C for 48 h. The dried insoluble solids were further dissolved in DMSO, and filtered to separate the solid leftover PET from DMSO-soluble products (e.g. TPA, MHET, BHET, among others). The DMSO-soluble products were analyzed by HPLC, while the DMSO-insoluble fraction was dried in a vacuum oven at 40 °C for 48 h. Both liquid and solid fractions were analyzed using the procedures presented below. To analyze the structure and purity of the TPA produced from waste colored PET bottle using subcritical CO2–H2O, TPA was firstly separated from other insoluble products. Initially, the post-reaction solid fraction was dried in a vacuum oven at 40 °C for 48 h. The dried solid fraction was dissolved in 1 M NaOH to form a solution of sodium terephthalate (NaTPA) and filtered. 1 M HCl was added to the filtrate to reprecipitate TPA. TPA was then thoroughly washed with distillated H2O, and dried in a vacuum oven at 40 °C for 48 h.
2.4. Combined severity factor
Combined severity factor (CSpCO2) includes the effect of multiple CO2–H2O parameters, including temperature, CO2 pressure, and reaction time into a single equation.47 It has been applied to optimize the impact of temperature, reaction time and pH on the reaction outcomes as follows:39| CSpCO2 = log(R0) − pH | (2) |
Overend and Chornet developed a model where both temperature and residence time are combined into a single severity factor (R0), equivalent to the logarithmic form of eqn (3):48
 | (3) |
| pH = 8.00 × 10⁻⁶ × T2 + 0.00209 × T − 0.216 × ln(pCO2) + 3.92 | (4) |
2.5. Characterization of the liquid fraction
The liquid fraction samples were analyzed using a HPLC equipped with an Phenomenex Luna® 5 μm C18 (100 Å, 150 × 4.6 mm column, Part #00F-4252-E0) at 40 °C and 0.6 mL min−1 flow rate with UV detector at 240 nm.52 A gradient mobile phase (a combination of 1 wt% FA and CH3CN) was used with 99% FA and 1% CH3CN and finishing at 60% FA and 40 wt% CH3CN in 40 min. The theoretical yield of TPA, BHET and MHET was calculated using external calibration curves performed by measuring the response of the respective standard compound of known concentration. The theoretical yield of TPA in the loaded PET was calculated by considering the molecular weight fraction of TPA within the PET monomer unit (C10H8O4), which has a molar mass of 192 g mol−1. Similarly, for BHET and MHET, a 254.2 and 210.2 g mol−1 of molar mass was used, respectively. The formulas below were used to calculate the yield of each product: | (5) |
 | (6) |
 | (7) |
PET conversion was calculated as follows:
 | (8) |
Unknown peaks found in HPLC chromatograms were identified through Liquid Chromatography-Mass Spectrometry (LC-MS). LC-MS spectra were acquired on a Waters Acquity UPLC HClass equipped with a Waters QDa Mass Detector using a XBridge Peptide BEH C18 XP Column (130 Å, 2.5 μm, 4.6 mm × 150 mm) using a linear gradient of 95:5 H2O/0.1% FA:CH3CN/0.1% FA to 5:95 H2O/0.1% FA:CH3CN/0.1% FA. Mass spectra were acquired in ESI- and UV traces were recorded at 254 nm.
2.6. Characterization of solids before and after depolymerization
 | (9) |
3. Results and discussion
3.1. Effect of subcritical CO2 loading on PET hydrolysis
To better understand the effect of the subcritical CO2–H2O system on the hydrolysis of PET, a model substrate of semicrystalline, granulate (3–5 mm) PET was selected. Semicrystalline PET was expected to be more resistant to hydrolysis than amorphous PET (crystallinity acts as barrier to moisture and oxygen diffusion),55 and thus semicrystalline PET can better highlight the relative robustness of the subcritical CO2–H2O process toward highly crystalline substrates. Also, we have selected granulate PET due to the higher resistance to decomposition relative to powder, thus allowing for insights on potential mass transfer benefits of the use of subcritical CO2–H2O system and its robustness. As a control experiment, hot compressed H2O was used under 208 psi of initial N2 pressure. Fig. 1 (and Table S1†) shows the effect of CO2versus N2 (as inert gas) addition at 180 °C for 100 min, and the effect of initial CO2 pressure on the hydrolysis of PET at 180 °C for 100 min. | ||
| Fig. 1 Effect of CO2 addition (A) and initial CO2 pressure (B) on the hydrolysis of semicrystalline, granulate PET. Reaction conditions: PET to H2O ratio 1:8 w/w (2.5 g PET:20 mL H2O), 180 °C, 208 psi of initial pressure (either CO2 or N2) for 100 min of residence time (A); PET to H2O ratio 1:8 w/w (2.5 g PET:20 mL H2O), 180 °C for 100 min residence time (B). Reactions were conducted, at least, in duplicate, and error bars represent standard deviation. PET conversion is given as mass conversion into DMSO-soluble products. | ||
As shown in Fig. 1A, the addition of CO2 resulted in increased PET depolymerization and product yield relative to compressed hot H2O (i.e. N2–H2O) control at 180 °C for 100 min. PET was almost completely converted to DMSO-soluble products (88.8 ± 0.5%), and a total product (TPA + MHET + BHET) yield of 55.7 ± 0.3% was reached. It is worth mentioning that intermediate compounds, such as dimers, were found at substantial levels after CO2–H2O reactions at 180 °C for 100 min (Fig. S1†). However, in the case of hot compressed H2O, substantially lower PET depolymerization (and product formation) was observed. These results support the hypothesis that the dissolution of CO2 in H2O, and thus in situ formation of H2CO3 catalyzes the hydrolysis of PET ester bonds at 180 °C. It is challenging to compare the results obtained herein with those reported in the literature for neutral hydrolysis reactions, because of the wide variety of operational conditions reported and PET substrate properties/morphologies.13,16,56 Pereira et al. have reported a TPA yield <10% when PET chips from sparking water bottles were hydrolyzed at 200 °C for 120 min.13 It is worth mentioning that when we performed hot compressed H2O reactions (in the absence of N2) a TPA yield <5% was observed at 200 °C for 100 min (Table S2†), which is in good agreement with the findings reported by Pereira et al. who did not use N2 to pressurize the H2O in those experiments.
The impact of CO2 pressure (and composition) on the hydrolysis of PET was evaluated by varying initial CO2 pressure before increasing temperature to 180 °C for 100 min of reaction time. As expected, increasing CO2 pressures led to higher PET conversion into DMSO-soluble products and total product (i.e. TPA + MHET + BHET) yield (Fig. 1B). However, when the initial CO2 pressure was further increased to 408 psi, the total product (TPA + MHET + BHET) yield was only 12.7% higher than that obtained at 308 psi. To better understand the effect of CO2 on product yield, we must understand the effect of varying CO2 pressures on the pH of the system at a given reaction temperature and correlated with the obtained product yields. It is worth mentioning that the pH calculated herein does not include the contribution of the generated acidic products, such as TPA. The solubility of TPA in subcritical H2O was measured by Takebayashi et al., who reported that the mole fraction of TPA in H2O varies from 0.610 × 10⁻³ and 1.77 × 10⁻³ at 174 and 200 °C, respectively.57 Also, Yang et al. reported the hydrolysis of PET with TPA as a catalyst at 220 °C.58 As shown in Fig. 2, an initial CO2 pressure of 108 psi (calculated pH ∼4.17) was sufficient to promote an acidity low enough to induce acid hydrolysis of PET into its constituents at 180 °C for 100 min. An increase of initial CO2 pressure from 108 to 208 psi decreased the pH from 4.17 to 4.01, and this small difference in pH increased the TPA and MHET yields from 12.6 ± 1.4% to 39.1 ± 0.7% and 7.3 ± 0.8 to 14.3 ± 1.2%, respectively. A further increase in CO2 pressure from 308 to 408 psi only decreased the pH value from ∼3.91 to 3.84, but allowed for MHET conversion to TPA resulting in a maximum TPA yield of 73.6 ± 0.6% at 180 °C for 100 min. These findings suggest that slight variations of pH in the medium are crucial to enhance hydrolysis of PET into TPA.
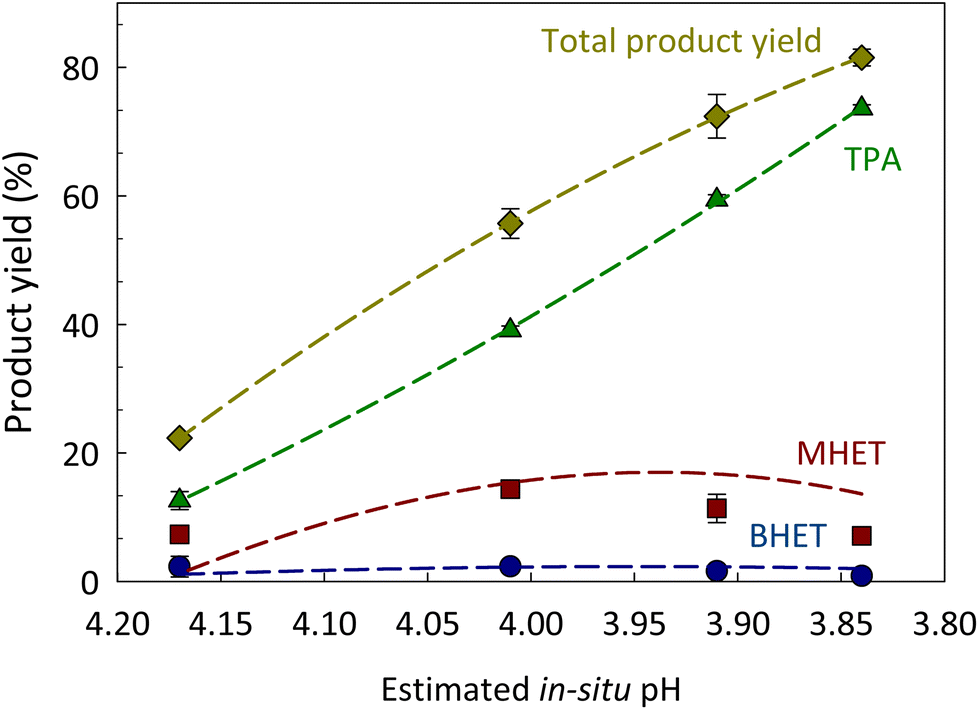 | ||
| Fig. 2 Impact of CO2-induced pH (calculated using eqn (4)) on the yield of products. Reaction conditions: PET to H2O ratio 1:8 w/w (2.5 g PET:20 mL H2O), 108 (estimated pH = 4.17), 208 (estimated pH = 4.01), 308 (estimated pH = 3.91) and 408 (estimated pH = 3.84) psi of initial CO2 pressure at 180 °C for 100 min of reaction time. Lines were added to guide the eye. The estimated in situ pH did not include the contribution of other products (e.g., TPA) and assumed the system was under equilibrium. | ||
Additional experiments showed that an increase of PET and H2O loadings (from 2.5 g PET:20 mL H2O to 3.75 g PET:30 g H2O), while keeping PET:H2O ratio of 1:8 w/w constant, resulted in a substantial decrease in both PET conversion into DMSO-soluble products (from 99 to 37.5%) and TPA yield (from 85 to 7%) at 200 °C, 208 psi of initial CO2 pressure for 100 min (Table S3†). In addition, at the same reaction conditions, when PET:H2O ratios were changed from 1:5.3 to 1:8 w/w, while keeping the same H2O amount (i.e., from 3.75 g PET:20 g H2O to 2.5 g PET:20 g H2O), similar final pressures, PET conversion into DMSO-soluble products and TPA yield were observed. These results can be explained by the fact that the time required to reach equilibrium is highly dependent on the quantity of H2O introduced into the system due to the diffusion limitation of CO2 in the liquid phase. In other words, when the system is not under equilibrium conditions, the pH of the solution at reaction conditions will be less acidic. da Silva et al., found that the performance of subcritical CO2–H2O for hydrolyzing wheat straw was also impacted by the amount of H2O added to the reactor.59
3.2. Effect of reaction severity on PET hydrolysis
A series of reactions were conducted under variable conditions of temperature and residence time to assess the performance of subcritical CO2–H2O to hydrolyze PET into TPA (Fig. 3A and Table S4†). The results show that increasing temperature favors the rate of conversion of PET to DMSO-soluble products (TPA + MHET + BHET). For example, a significant increase in total product yield was obtained for the first 40 min of reaction by only increasing temperature from 180 to 200 °C. | ||
| Fig. 3 Effect of temperature and reaction time on the performance of CO2–H2O hydrolysis of PET (A). TPA yield as a function of combined severity factor (CSpCO2) (B). Reaction conditions: PET to H2O ratio 1:8 w/w (2.5 g PET:20 mL H2O) and 208 psi of initial CO2 pressure (A); PET to H2O ratio 1:8 w/w (2.5 g PET:20 mL H2O) and 208 psi of initial CO2 pressure at varying temperatures (180, 190 and 200 °C), and residence times (40 and 100 min) (B). Reactions were conducted, at least, in duplicate, and error bars represent standard deviation. The numerical values for both CSpCO2 and TPA yield can be found in Table S4.† Fig. S3† shows the impact of CSpCO2 on PET conversion. PET conversion is given as mass conversion into DMSO-soluble products. | ||
In addition, TPA was the main compound present in all reactions, except for the 10 min of reaction time. The amount of TPA recovered increased with both temperature and reaction time reaching a maximum of 85.0 ± 1.3% at 200 °C for 100 min. Under less severe conditions (e.g., 180 °C for 100 min and 190 °C for 40 min), BHET and MHET were found in appreciable amounts. This is expected, as BHET and MHET are reaction intermediates that are converted to TPA and EG over time. As shown here, every variable used in the system, notably temperature, CO2 pressure and residence time, contributes in different ways to the severity of the reaction, which in turn impacts hydrolysis yields. Thus, the use of a combined severity factor (CSpCO2) was further evaluated to predict PET conversion into DMSO-soluble products and TPA yield upon CO2-aided hydrolysis.47 The data obtained at temperatures ranging from 180 to 200 °C and from 10 to 100 min of reaction time (results from 180 to 200 °C for 10 min were not included due to negligible amount of TPA formed under those conditions) were used to evaluate the potential correlation between CSpCO2 and TPA yield. As shown in Fig. 3B, the TPA yield correlates linearly (R2 = 0.977) with CSpCO2, indicating that the effect of temperature, CO2 pressure, and reaction time seem to be reasonably well expressed by the combined severity factor to predict TPA yields.
3.3. Morphological characterization of leftover PET upon CO2–H2O reaction
Characterization of morphological changes in the leftover PET samples (DMSO-insoluble) upon reactions in CO2–H2O media would allow one to understand the effect of CO2 addition to H2O on the ultrastructure and possible disruption of the PET surface. Fig. 4 shows the SEM images of pristine PET and leftover PET after compressed hot H2O (N2–H2O) and CO2–H2O reactions at 165 °C in non-isothermal conditions. In addition, Fig. S2† shows additional SEM images of pristine and leftover PET samples after both hot compressed H2O and subcritical CO2–H2O process at varying operational conditions. | ||
| Fig. 4 Scanning electron microscopy of untreated, granulate PET (A), leftover PET samples from hot compressed H2O (i.e. N2–H2O, with 208 psi of initial N2 pressure) reaction (B), and CO2–H2O reaction (208 psi of initial CO2 pressure) (C) at 165 °C (non-isothermal conditions). Reaction conditions: PET to H2O ratio 1:8 w/w (2.5 g PET:20 mL H2O). | ||
After CO2–H2O process, the PET granulates seemed to clump together, and the PET surface appeared to be subjected to morphological changes (Fig. 4C). Both pristine PET and leftover PET after hot compressed H2O treatment exhibited a tight and contiguous surface (Fig. 4A and B, respectively), while the PET after CO2–H2O process showed irregular roughness and formation of pores (Fig. 4C). These morphological changes can be explained either by the polymer deconstruction or the interaction between the polymer and CO2, and the enhanced diffusivity of CO2 into the amorphous region of the substrate.
3.4. Assessment of subcritical CO2–H2O process robustness
The development of recycling technologies that can effectively process plastics, regardless of the presence of incompatible polymers, fillers and additives (e.g., stabilizers, pigments and plasticizers) is critical for the commercial success of those technologies. Thus, the subcritical CO2–H2O system was evaluated for the selective depolymerization of PET within a mixture of polymers (i.e., HDPE + PET) and for the performance in recycling colored Canada Dry relative to transparent Pure Life® waste PET bottles.A mixture composed of 50:50 w/w powder PET and HDPE and a substrate-to-H2O ratio of 1:8 w/w (2.5 g substrate:20 mL H2O) was used to evaluate the selectivity of the proposed system for “molecular sorting” purposes. As can be seen in Fig. 5A (Table S5†), both total product and TPA yields obtained from the 50:50 w/w PET:PE powder mixture (PET and PE particle sizes were 300 and 150 μm, respectively) were very similar to the one obtained from pure 100% PET (300 μm) at 200 °C for 100 min. These findings were highly expected, as the operational conditions used herein do not promote the cleavage of C–C bonds in the HDPE, but are sufficient to promote the hydrolysis of ester bonds in PET. This shows that the performance of the subcritical CO2–H2O process, at 200 °C for 100 min, does not seem to be impacted by the presence of other plastics and it can provide “molecular sorting” capabilities.
 | ||
| Fig. 5 Effect of subcritical CO2–H2O on the hydrolysis of PET within 50:50 w/w PET-PE mixture and on colored Canada Dry and transparent Pure Life® PET bottles (A). Pristine colored Canada Dry and transparent Pure Life® PET soda bottles prior to reaction (B), H2O-insoluble solids after reaction (including TPA, insoluble oligomers, additives and others) (C), and liquid product samples after filtration (D). Reaction conditions: Substrate to H2O ratio 1:8 w/w (2.5 g substrate:20 mL H2O), 200 °C for 100 min and with an initial CO2 pressure of 208 psi. Reactions were conducted, at least, in duplicate, and error bars represent standard deviation. | ||
As shown in Table 1 and Fig. S4,† both colored Canada Dry and transparent Pure Life® PET bottles show similar crystallinity content and thermal stability after cryogrinding. Fig. 5A shows that there were no differences in total product yields between colored Canada Dry and transparent Pure Life® PET bottles upon CO2–H2O processing under identical operational conditions. In addition, the green pigment initially present in the green Canada Dry soda bottle cannot be observed in the liquid product (Fig. 5D) nor in the leftover insoluble solids with the naked eye (Fig. 5C), resulting in a clean white product like that observed for the product derived from transparent PET bottle.
| Substrate | Crystallinity (%) | ΔHm (J g−1) | ΔHcc (J g−1) |
|---|---|---|---|
| Colored Canada Dry PET bottle | 17.9 ± 0.5 | 25.0 ± 0.7 | 0 |
| Transparent Pure Life® PET bottle | 20.6 ± 0.1 | 29.1 ± 0.0 | 0 |
The chemical structure and purity of TPA recovered from colored waste PET bottle was compared with the TPA recovered from pristine PET through 1H and 13C NMR spectroscopy as shown in Fig. S5–S8.† As shown in Fig. S5 and S6,†1H NMR spectra of TPA produced from both standard PET and colored PET bottle showed two singlets with chemical shift at 8.0 and 13.3 ppm corresponding to the aromatic protons of the benzene ring and COOH proton, respectively.60 Besides the peaks corresponding to DMSO-d6 (2.50 ppm) and H2O (3.38 ppm), no other significant peaks were observed in both 1H NMR spectra. 13C NMR spectra of TPA from both standard PET and colored Canada Dry PET bottle showed three main peaks corresponding to aromatic carbon (130.1 ppm), quaternary aromatic carbon (135.0 ppm) and carbonyl carbon (167.1 ppm) atoms of TPA (Fig. S7 and S8†).61 The absence of other peaks in both 1H NMR and 13C NMR indicate that subcritical CO2–H2O is able to produce TPA with high purity. We further investigated the performance of the CO2–H2O process in hydrolyzing other colored waste PET bottles (i.e., Mountain Dew and Twist Up) (Tables S5, S6, and Fig. S9, S10†) at the same operational conditions, and similar results to colored Canada Dry PET bottle has been obtained (Table S5†). Although the pigments present in the colored PET bottles have been reported to contain somewhat acidic compounds,62 they did not significantly impact the performance of subcritical CO2–H2O process at the studied conditions. The reason for the discoloration of the reaction products after subcritical CO2–H2O exposure is still unknown, as the chemical nature of the green dye in the commercial PET bottles has not been reported by the manufacturer. However, we hypothesize that the dye is susceptible to chemical change when exposed to the conditions present in the media during CO2–H2O processing.
4. Conclusions
This work shows the potential of adding subcritical CO2 to the aqueous hydrolysis of PET. The subcritical CO2–H2O process resulted in a TPA yield of 39.1 ± 0.7% (versus 1.7 ± 0.4% obtained in hot H2O control reaction) at 180 °C, PET:H2O loading of 2.5 g PET:20 g H2O for 100 min. At 200 °C for 100 min, a TPA yield of 85.0 ± 1.3% was achieved. In addition, the performance of subcritical CO2–H2O was not impacted by the presence of polyolefins within the mixture and/or pigments present in waste PET bottles.
Author contributions
Funding acquisition – ARCM; conceptualization – ARCM, DO, LG; investigation – DO, LG, AS, JM, CL; methodology – DO, LG, ARCM; supervision – LG, ARCM, NAR; visualization – DO, ARCM; writing – original draft – DO, ARCM; writing – review & editing – DO, LG, AS, JM, CL, NAR, ARCM.Conflicts of interest
There are no conflits of interest to declare.Acknowledgements
This material is based upon work supported by the National Science Foundation under Grant No. OIA – 2119754, and by the Kansas Board of Regents EPSCoR Grant Program. Also, the authors are grateful to the Department of Chemical and Petroleum Engineering, and the School of Engineering at University of Kansas for their financial support. The authors gratefully acknowledge Dr Erhan Demirel from the Institute for Bioengineering Research (University of Kansas) and Dr Anoop Uchagawkar from Center for Environmental and Beneficial Catalysis (CEBC) (University of Kansas) for their assistance in acquiring and analyzing the DSC data. The authors also thank the access to the medicinal chemistry laboratory at the University of Kansas for LC-MS analysis provided by Samuel Gary and Dr Steven Bloom. We thank Dr Prem Thapa-Chetri from the Microscopy and Analytical Imaging Lab (University of Kansas) for his assistance collecting SEM data. This work was authored in part by the National Renewable Energy Laboratory, operated by Alliance for Sustainable Energy, LLC, for the U.S. Department of Energy (DOE) under Contract No. DE-AC36-08GO28308. C. L. and N. A. R. were funded by the U.S. Department of Energy, Office of Energy Efficiency and Renewable Energy, Advanced Materials and Manufacturing Technologies Office (AMMTO) and Bioenergy Technologies Office (BETO). This work was performed as part of the BOTTLE™ Consortium and was supported by AMMTO and BETO under contract no. DE-AC36-08GO28308 with the National Renewable Energy Laboratory, operated by Alliance for Sustainable Energy, LLC. The views expressed in the article do not necessarily represent the views of the DOE or the U.S. Government. The U.S. Government retains and the publisher, by accepting the article for publication, acknowledges that the U.S. Government retains a nonexclusive, paid-up, irrevocable, worldwide license to publish or reproduce the published form of this work, or allow others to do so, for U.S. Government purposes.References
- A. Bescond and A. Pujari, PET polymer, in Chemical Economics Handbook (IHS, Markit) 2020, p. 32 Search PubMed. https://ihsmarkit.com/products/chemical-economics-handbooks.html.
- E. Ormonde, U. Loechner, M. Yoneyama and X. Zhu, Plastics recycling – Chemical Economics Handbook (IHS Markit), 2022, p. 56. https://www.spglobal.com/commodityinsights/en/ci/products/plastics-recycling-chemical-economics-handbook.html Search PubMed.
- A. Rahimi and J. M. García, Nat. Rev. Chem., 2017, 1, 0046 CrossRef.
- V. Sinha, M. R. Patel and J. V. Patel, J. Polym. Environ., 2010, 18, 8–25 CrossRef CAS.
- D. Paszun and T. Spychaj, Ind. Eng. Chem. Res., 1997, 36, 1373–1383 CrossRef CAS.
- T. E. Long and J. Scheirs, Modern polyesters: chemistry and technology of polyesters and copolyesters, John Wiley & Sons, 2005 Search PubMed.
- T. Yoshioka, T. Motoki and A. Okuwaki, Ind. Eng. Chem. Res., 2001, 40, 75–79 CrossRef CAS.
- T. Yoshioka, N. Okayama and A. Okuwaki, Ind. Eng. Chem. Res., 1998, 37, 336–340 CrossRef CAS.
- S. Mishra, A. Goje and V. Zope, Polym. React. Eng., 2003, 11, 79–99 CrossRef CAS.
- M. J. Kang, H. J. Yu, J. Jegal, H. S. Kim and H. G. Cha, Chem. Eng. J., 2020, 398, 125655 CrossRef CAS.
- E. Barnard, J. J. R. Arias and W. Thielemans, Green Chem., 2021, 23, 3765–3789 RSC.
- A. Jaime-Azuara, T. H. Pedersen and R. Wimmer, Green Chem., 2023, 25, 2711–2722 RSC.
- P. Pereira, P. E. Savage and C. W. Pester, ACS Sustainable Chem. Eng., 2023, 11, 7203–7209 CrossRef CAS.
- C. Schacht, C. Zetzl and G. Brunner, J. Supercrit. Fluids, 2008, 46, 299–321 CrossRef CAS.
- W. L. Marshall and E. Franck, J. Phys. Chem. Ref. Data, 1981, 10, 295–304 CrossRef CAS.
- C. N. Onwucha, C. O. Ehi-Eromosele, S. O. Ajayi, M. Schaefer, S. Indris and H. Ehrenberg, Ind. Eng. Chem. Res., 2023, 62, 6378–6385 CrossRef CAS.
- J. R. Campanelli, M. Kamal and D. Cooper, J. Appl. Polym. Sci., 1993, 48, 443–451 CrossRef CAS.
- M. Han, in Recycling of Polyethylene Terephthalate Bottles, Elsevier, 2019, pp. 85–108 Search PubMed.
- V. S. Zope and S. Mishra, J. Appl. Polym. Sci., 2008, 110, 2179–2183 CrossRef CAS.
- A. R. C. Morais, A. M. da Costa Lopes and R. Bogel-Łukasik, Chem. Rev., 2015, 115, 3–27 CrossRef CAS PubMed.
- D. Damayanti, B. T. Basae, L. Al Mukarromah, D. S. S. Marpaung, D. R. Saputri, A. Sanjaya, Y. Fahni, D. Supriyadi, T. Taharuddin and H. S. Wu, Clean. Eng. Technol., 2023, 100697 CrossRef.
- S. P. Nalawade, F. Picchioni and L. Janssen, Prog. Polym. Sci., 2006, 31, 19–43 CrossRef CAS.
- X. Gao, Y. Chen, P. Chen, Z. Xu, L. Zhao and D. Hu, J. CO2 Util., 2022, 57, 101887 CrossRef CAS.
- I. Elmanovich, A. Stakhanov, E. Kravchenko, S. Stakhanova, A. Pavlov, M. Ilyin, E. Kharitonova, M. Gallyamov and A. Khokhlov, J. Supercrit. Fluids, 2022, 181, 105503 CrossRef CAS.
- R. Wissinger and M. Paulaitis, J. Polym. Sci., Part B: Polym. Phys., 1987, 25, 2497–2510 CrossRef CAS.
- M. Champeau, J.-M. Thomassin, C. Jérôme and T. Tassaing, J. Supercrit. Fluids, 2014, 90, 44–52 CrossRef CAS.
- I. Kikic and F. Vecchione, Curr. Opin. Solid State Mater. Sci., 2003, 7, 399–405 CrossRef CAS.
- Z. Zhang and Y. P. Handa, J. Polym. Sci., Part B: Polym. Phys., 1998, 36, 977–982 CrossRef CAS.
- S. G. Kazarian, N. H. Brantley and C. A. Eckert, Vib. Spectrosc., 1999, 19, 277–283 CrossRef CAS.
- M. Takada and M. Ohshima, Polym. Eng. Sci., 2003, 43, 479–489 CrossRef CAS.
- S. Lambert and M. Paulaitis, J. Supercrit. Fluids, 1991, 4, 15–23 CrossRef CAS.
- J. Liu and J. Yin, Ind. Eng. Chem. Res., 2022, 61, 6813–6819 CrossRef CAS.
- W.-Z. Guo, H. Lu, X.-K. Li and G.-P. Cao, RSC Adv., 2016, 6, 43171–43184 RSC.
- K. Yu, J. Liu, J. Sun, Z. Shen and J. Yin, J. Supercrit. Fluids, 2023, 194, 105837 CrossRef CAS.
- Y. Li, M. Wang, X. Liu, C. Hu, D. Xiao and D. Ma, Angew. Chem., 2022, 134, e202117205 CrossRef.
- Y. Yang, S. Sharma, C. Di Bernardo, E. Rossi, R. Lima, F. S. Kamounah, M. Poderyte, K. Enemark-Rasmussen, G. Ciancaleoni and J.-W. Lee, ACS Sustainable Chem. Eng., 2023, 11, 11294–11304 CrossRef CAS.
- X. K. Li, H. Lu, W. Z. Guo, G. P. Cao, H. L. Liu and Y. H. Shi, AIChE J., 2015, 61, 200–214 CrossRef CAS.
- S. E. Hunter and P. E. Savage, AIChE J., 2008, 54, 516–528 CrossRef CAS.
- A. R. C. Morais, A. C. Mata and R. Bogel-Lukasik, Green Chem., 2014, 16, 4312–4322 RSC.
- D. H. Fockink, A. R. C. Morais, L. P. Ramos and R. M. Łukasik, Energy, 2018, 151, 536–544 CrossRef CAS.
- A. Toscan, A. R. C. Morais, S. M. Paixão, L. Alves, J. r. Andreaus, M. Camassola, A. J. P. Dillon and R. M. Lukasik, Ind. Eng. Chem. Res., 2017, 56, 5138–5145 CrossRef CAS.
- A. R. C. Morais, M. D. D. Matuchaki, J. Andreaus and R. Bogel-Lukasik, Green Chem., 2016, 18, 2985–2994 RSC.
- A. R. C. Morais and R. Bogel-Lukasik, Green Chem., 2016, 18, 2331–2334 RSC.
- J. S. Luterbacher, J. W. Tester and L. P. Walker, Biotechnol. Bioeng., 2010, 107, 451–460 CrossRef CAS PubMed.
- J. S. Luterbacher, J. W. Tester and L. P. Walker, Biotechnol. Bioeng., 2012, 109, 1499–1507 CrossRef CAS PubMed.
- J. S. Luterbacher, Q. Chew, Y. Li, J. W. Tester and L. P. Walker, Energy Environ. Sci., 2012, 5, 6990–7000 RSC.
- G. P. Van Walsum, in Severity function describing the hydrolysis of xylan using carbonic acid, Twenty-Second Symposium on Biotechnology for Fuels and Chemicals, Springer, 2001, pp. 317–329 Search PubMed.
- R. P. Overend and E. Chornet, Philos. Trans. R. Soc., A, 1987, 321, 523–536 CrossRef CAS.
- D. H. Fockink, J. H. Sánchez and L. P. Ramos, Ind. Crops Prod., 2018, 123, 563–572 CrossRef CAS.
- A. R. Abouelela, P. Y. Nakasu and J. P. Hallett, ACS Sustainable Chem. Eng., 2023, 11, 2404–2415 CrossRef CAS PubMed.
- A. Toscan, A. R. C. Morais, S. M. Paixão, L. Alves, J. Andreaus, M. Camassola, A. J. P. Dillon and R. M. Lukasik, Bioresour. Technol., 2017, 224, 639–647 CrossRef PubMed.
- S. Kaabel, J. D. Therien, C. E. Deschênes, D. Duncan, T. Friščić and K. Auclair, Proc. Natl. Acad. Sci. U. S. A., 2021, 118, e2026452118 CrossRef CAS PubMed.
- S. Mori and H. G. Barth, Size exclusion chromatography, Springer Science & Business Media, 1999 Search PubMed.
- A. Mehta, U. Gaur and B. Wunderlich, J. Polym. Sci., Polym. Phys. Ed., 1978, 16, 289–296 CrossRef CAS.
- N. S. Allen, M. Edge, M. Mohammadian and K. Jones, Eur. Polym. J., 1991, 27, 1373–1378 CrossRef CAS.
- H. Abedsoltan, Z. Zoghi and A. H. Mohammadi, J. Appl. Polym. Sci., 2023, e53949 CrossRef CAS.
- Y. Takebayashi, K. Sue, S. Yoda, Y. Hakuta and T. Furuya, J. Chem. Eng. Data, 2012, 57, 1810–1816 CrossRef CAS.
- W. Yang, R. Liu, C. Li, Y. Song and C. Hu, Waste Manage., 2021, 135, 267–274 CrossRef CAS PubMed.
- S. P. M. da Silva, A. R. C. Morais and R. Bogel-Łukasik, Green Chem., 2014, 16, 238–246 RSC.
- V. Štrukil, ChemSusChem, 2021, 14, 330–338 CrossRef PubMed.
- R. Pétiaud, H. Waton and Q.-T. Pham, Polymer, 1992, 33, 3155–3161 CrossRef.
- K. Fukushima, D. J. Coady, G. O. Jones, H. A. Almegren, A. M. Alabdulrahman, F. D. Alsewailem, H. W. Horn, J. E. Rice and J. L. Hedrick, J. Polym. Sci., Part A: Polym. Chem., 2013, 51, 1606–1611 CrossRef CAS.
Footnote |
| † Electronic supplementary information (ESI) available. See DOI: https://doi.org/10.1039/d3gc04576e |
| This journal is © The Royal Society of Chemistry 2024 |