
 Open Access Article
 This Open Access Article is licensed under a
 Creative Commons Attribution 3.0 Unported Licence
A modeling framework to identify environmentally greener and lower-cost pathways of nanomaterials†
Kai
Lan
ab,
Hannah Szu-Han
Wang
a,
Tessa
Lee
a,
Camilla Abbati
de Assis
c,
Richard A.
Venditti
 b,
Yong
Zhu
d and
Yuan
Yao
*ae
b,
Yong
Zhu
d and
Yuan
Yao
*ae
aCenter for Industrial Ecology, Yale School of the Environment, Yale University, 380 Edwards Street, New Haven, Connecticut 06511, USA. E-mail: y.yao@yale.edu
bDepartment of Forest Biomaterials, North Carolina State University, 2820 Faucette Drive, Raleigh, North Carolina 27695, USA
cFisher International, Inc., 15720 Brixham Hill Ave. Suite 550, Charlotte, North Carolina 28277, USA
dDepartment of Mechanical and Aerospace Engineering, North Carolina State University, 911 Oval Drive, Raleigh, North Carolina 27695, USA
eChemical and Environmental Engineering, Yale School of Engineering and Applied Science, Yale University, 17 Hillhouse Avenue, New Haven, Connecticut 06520, USA
First published on 12th February 2024
Abstract
Producing environmentally benign and economically viable nanomaterials is critical for large-scale applications in energy and other industries. This study presents a modeling framework to identify environmentally greener and lower-cost pathways of large-scale nanomaterial production, which encompasses life cycle assessment, Green Chemistry principles, techno-economic analysis, and eco-efficiency analysis. The framework is demonstrated by case studies of cellulose nanomaterials produced in the U.S. For cellulose nanocrystals, the framework identifies pathways that simultaneously reduce the life-cycle global warming potential (GWP) from 17.7 to 2.6 kgCO2e per dry kg cellulose nanocrystals and the minimum selling price (MSP) from US$7540 to US$4587 per dry t cellulose nanocrystals. For cellulose nanofibrils, the strategies present trade-offs of reducing GWP from 7.8 to 0.1 kgCO2e per dry kg cellulose nanofibrils but increasing MSP slightly from US$2873 to US$2985 per dry t cellulose nanofibrils. Eco-efficiency analysis quantifies the magnitudes of co-benefits and trade-offs between the environmental and economic performance of different production strategies and supports decision making for sustainability-informed process optimization.
1. Introduction
The unique properties and performance of nanomaterials have attracted much attention in various fields, such as energy, electronics, water treatment, medicine, and agriculture.1–3 Sustainable design and development of nanomaterials need holistic consideration of environmental sustainability, economic viability, and material functionality.4 Metrics-based frameworks have been developed, such as the well-known Ashby material selection framework and other adapted frameworks that include more environmental and human health considerations.2,4,5 These frameworks focus on streamlined nanomaterial screening and selection, which suit early-stage material design; however, more comprehensive assessments are needed to understand potential environmental impacts and techno-economic performance for large-scale commercial production and application of nanomaterials.6 Life cycle assessment (LCA) and techno-economic analysis (TEA) have been explored for specific nanomaterial classes and applications.6–9 Previous studies have shown large variations in the environmental and economic performances of different nanomaterial production pathways; however, it is unclear how the pathways of reducing environmental burdens affect the economic feasibility of nanomaterial production. There is a strong need to understand the drivers of and trade-offs/co-benefits between the economic and environmental performance of different nanomaterials production pathways and provide guidance on how to use such understandings to inform process design and optimization for producing greener and more cost-effective nanomaterials.To address this gap, we develop a framework powered by LCA, Green Chemistry (GC) principles, TEA, and eco-efficiency analysis to identify the pathways of producing greener and lower-cost nanomaterials. In this framework, LCA assesses the life-cycle environmental impacts of a material;10–12 TEA evaluates the economic performance of emerging technologies and various production pathways.6,13,14 This framework uses the GC principles to develop improvement strategies and scenarios towards greener production.15–18 An eco-efficiency analysis quantifies the co-performance of a product in environmental and economic dimensions; eco-efficiency is typically measured as the ratio of environmental impacts to economic value or vice versa.19,20 We demonstrate this framework through a conceptual case study of cellulose nanomaterials in the U.S. at a large scale.
Cellulose nanomaterials have received increasing research interest due to their high mechanical strength, aspect ratio, biodegradability, biocompatibility, and other advantages.21 Two common categories of cellulose nanomaterials are cellulose nanofibrils (CNF) and cellulose nanocrystals (CNC).22 CNC are “rod-like” or “needle-like” nanoparticles with high crystallinity, while CNF may have higher amorphous cellulose than CNC and a larger aspect ratio (length/width).23 Besides the morphological differences, CNC- and CNF-based materials can differ in mechanical properties (e.g., tensile strength and density).23–27 Many applications of cellulose nanomaterials have been reported, e.g., coatings,28 gel inks,29 tissue engineering,30 wound dressing,31 smart sensors,32 and soft electronics.33 Previous LCA has shown high environmental burdens of CNC and CNF, majorly due to high energy consumption, waste produced, and chemical usage (e.g., acid, neutralizing agent).34 Hence, exploring the pathways of reducing environmental burdens and production cost is essential for large-scale commercial production of CNC and CNF.34 Previous LCA and TEA studies have investigated the environmental impacts and economic feasibility of CNC or CNF production with different methods (see ESI Section S1 for literature review†).21,34–49 However, few studies have explored varied process design strategies (e.g., different choices of acid recovery, energy sources, and neutralizing agents) or alternative production means (e.g., organic or inorganic acid,21,39 acid hydrolysis or autohydrolysis,38,50 with or without pretreatment35,38). Nor have they simultaneously explored the corresponding economic performance of alternative pathways and the potential trade-offs between the environment and economic performance. Additionally, few studies have considered the end-of-life emissions of CNC and CNF, which is a common challenge for nanomaterial LCAs.51
Using this framework, we have identified 11 scenarios (7 scenarios for CNC and 4 scenarios for CNF) to explore their impacts on environmental performance and economic feasibility. The results of production economics and environmental impacts, and their trade-offs/co-benefits provide information for stakeholders (e.g., investors and researchers) on different manufacturing strategies and highlight future opportunities and research directions for producing greener and more cost-effective cellulose nanomaterials. Although the case studies only include CNC and CNF materials, the framework is broadly applicable to other materials and can be applied to other nanomaterials for identifying lower-cost and greener manufacturing pathways.
2. Methods and materials
2.1. Framework overview
Fig. 1 shows the four main modules of the framework: pathway selection and process analysis, LCA, TEA, and result interpretation. Pathway selection starts from a baseline scenario that can be current practices or traditional/emerging technologies that have not been optimized. Then alternative pathway scenarios (Scenario j1, j2, …, jk) are generated by applying relevant GC principles. One or multiple changes can be added in one scenario, depending on the expected granularity in understanding the effects of changes. If an alternative pathway (Scenario jk) has met improvement criteria compared to the previous scenario (Scenario jk–n, n depends on technology choices), then the scenario is selected for further improvement. Otherwise, the scenario is rejected. These improvement criteria can be lowered environmental impacts, better economic performance, or improved material circularity, depending on the users’ needs. This study only focuses on carbon and economic improvement as a demonstration, but other focuses, such as circular economy principles52,53 can be easily incorporated. Future users can also set rejection criteria (e.g., at least 5% poorer performance). Process analysis for each scenario provides mass and energy balances that are essential inventory data needed by LCA. Various methods can be used for process analysis, including theoretical calculations, process simulation, data-driven approach, and other methods.54 This study adapts the TEA framework proposed by Zimmermann et al.55 The selection of specific environmental and economic indicators depends on the goal and purpose of projects and will need to be determined on a case-by-case basis. The results of LCA and TEA can be interpreted separately or incorporated into an eco-efficiency analysis to quantify the extent to which a trade-off or co-benefit exists (see Section 2.8). | ||
| Fig. 1 Schematic diagram of the modeling framework. The framework consists of four modules, namely pathway selection and process analysis, life cycle assessment, techno-economic analysis, and result interpretation. | ||
2.2. Case study overview
The framework is applied to cellulose nanomaterials. 7 scenarios for CNC production and 4 scenarios for CNF production were generated using GC principles (see Sections 2.3 and 2.4, and ESI Sections S2 and S3†). Fig. 2 shows the summarized flow diagram of each scenario (the detailed flow diagrams are shown in ESI Fig. S1–S7†). In this study, the potential improvement pathways were identified from the previous literature that tested the technical feasibility or conducted related experiments. Note that these pathways do not cover all possible opportunities. But future users like researchers and engineers can utilize this framework to analyze the environmental and economic performance of other opportunities or other GC principles and the potential trade-offs or co-benefits. | ||
| Fig. 2 Derived improvement pathway and summarized process flowcharts. (a) CNC production. (b) CNF production. The final product of CNC and CNF is at 8% consistency. In (a), the CNC baseline employs sulfuric acid for hydrolysis and NaOH for neutralization without acid recovery. Following GC Principle 1 of waste prevention, Scenario CNC-1 replaces NaOH with CaO for neutralization that generates gypsum as a valuable byproduct. Based on Scenario CNC-1, Scenario CNC-2 further recovers sulfuric acid from the hydrolysate. Scenario CNC-3 and Scenario CNC-4 use citric acid and subcritical water as the hydrolysis solvent, respectively, following the GC Principle 5 of solvent change. Scenario CNC-5 and CNC-6 explore alternative fuel (residue-derived wood pellets) and electricity source (wind power), respectively, by following Principle 6 minimizing impacts of energy requirements. In (b), the CNF baseline deploys mechanical treatment as a common method. To potentially reduce the high energy consumption of the CNF baseline, Scenario CNF-1 adds enzymatic hydrolysis as pretreatment to reduce the polymer length, following GC Principle 6 minimizing the impacts of energy requirements. By applying the GC Principle 6, Scenario CNF-2 combusts wood pellets as renewable fuel; Scenario CNF-3 adopts renewable electricity rather than grid electricity. | ||
The mass and energy balances in each scenario were generated by process simulations for each scenario in Microsoft Excel (see results in ESI Section S4, Tables S1 and S2†). In this study, global warming potential (GWP) is selected as the environmental impact indicator to determine the acceptance or rejection of Scenario jk. For eco-efficiency analysis, we adopt the indicator, environmental cost efficiency (ECE), proposed by Hellweg et al.19 to quantify the trade-offs between the environmental and economic performance of various pathways. In this study, the primary functional unit is mass-based as 1 dry kg of cellulose nanomaterials produced; then the results are converted to the performance-based functional unit that considers material performance (see Section 2.6 for details).
2.3. Cellulose nanocrystal production
In this study, the feedstock for CNC production is dissolving pulp which has been widely selected by the previous studies.38,47,56,57 Dissolving pulp can be produced from varied biomass sources (typically hardwood, softwood, and cotton fibers) via sulfite pulping or pre-hydrolysis kraft pulping.58 In this study, the dissolving pulp type is pre-hydrolysis kraft pulp which is aligned with the pilot plant experiment of Gu et al.38 The compositions of the dissolving pulp are 97.9% (dry basis) cellulose, 1.5% xylan (dry basis), 0.6% lignin (dry basis), with 5.3% moisture content (dry basis).58,59For CNC production, there are a total of seven scenarios as mentioned above (all the technical and modeling details are available in ESI Sections S2 and S5†). In the CNC baseline process, the dissolving pulp is first fed into a shredder to generate small particles that allow for sulfuric acid hydrolysis.38,47,60 After the acid hydrolysis, the hydrolysate is transferred to the tank for dilution with reverse osmosis water and added with sodium chlorite to preserve the brightness.47 After this step, the acid solution is neutralized by adding 10% NaOH solution.38 The suspension goes through filtration to remove the remaining large particles. Then the stream is fed to the diafiltration process for 36 hours to remove sugars and salts and concentrated by the ultrafiltration system to 8 wt%.38 In the CNC baseline, the unrecovered weak sulfuric acid solution needs to be neutralized with NaOH to generate an effluent consisting of Na2SO4 and water. Hence, one possible improvement to prevent waste generation can be using CaO to produce gypsum as a byproduct in Scenario CNC-1. After the neutralization, the solids and liquid are separated in the decanter and then gypsum is assumed to be sold. To further prevent waste, Scenario CNC-2 recovers the acid. The acid recovery includes two steps, namely separating H2SO4 from the hydrolysate and then concentrating the acid solution to 64 wt%.47 The separation step uses electrodialysis with 90% recovery efficiency.61,62 Then, the separated sulfuric acid solution is evaporated in a three-effect evaporator to achieve 64 wt% and sent back to the acid hydrolysis reactor.
Solvent selection is one of the most important research areas in GC. Many conventional solvents have issues related to toxicity or corrosion.15 Energy-intensive distillation for solvent recovery is another concern.15 To improve the environmental performance of CNC production based on this principle, two possible alternative solvents have been identified in the previous literature: citric acid and subcritical water. On the basis of Scenario CNC-2, CNC-3 changes the unit operations of acid hydrolysis and acid recovery. In Scenario CNC-3, citric acid hydrolysis is operated at 120 °C for 4.5 h with 60 wt% citric acid fed in and 7% pulp consistency.39 After being separated from the hydrolysate in the centrifuges, the citric acid solution is recovered by ion exchange.63 Other than using citric acid, Scenario CNC-4 employs subcritical water for hydrolysis that uses water as the hydrolyzing agent in a high-pressurized reactor.50,64 The advantage of subcritical water hydrolysis is that it is free of substantial usage of acid; therefore, no need for recovery.
GC Principle 6 mentions that the economic and environmental impacts of the energy requirements should be minimized.15 Rather than combusting natural gas for heat supply, Scenario CNC-5 utilizes the biomass solid fuel boiler by combusting wood pellets to provide the heat source.
Electricity is an important energy source in CNC production. Switching from current grid electricity (majorly generated by fossil fuel) to renewable electricity can reduce the GWP of CNC production. On the basis of Scenario CNC-5, Scenario CNC-6 further explores the impacts of using renewable electricity for the CNC plant by using onshore wind power.
2.4. Cellulose nanofibril production
In this study, the feedstock for CNF production is northern bleached softwood kraft (NBSK) pulp, a common type of pulp in the market.46 NBSK pulp has been used as feedstock in the CNF pilot plant65,66 and other studies.46,67–69 The compositions of the dissolving pulp are 85% (dry basis) cellulose, 14% (dry basis) hemicellulose, and 1% lignin (dry basis), with 11% moisture content (dry basis).46,70For CNF production, there are 4 scenarios as mentioned above (all the technical and modeling details are available in ESI Section S3†). The CNF baseline process uses mechanical treatment. The NBSK pulp and water are mixed in the hydropulper to achieve 3 wt% consistency and transferred to a buffer tank and re-circulated to a dual-disk disk refiner. Then, the stream passes through the homogenization at 1000 bar with one pass.71 Finally, the CNF is concentrated by ultrafiltration to derive the final product. High energy consumption for producing CNF is a major disadvantage compared to CNC or cellulose microfibrils.35 According to the GC Principle 6, increasing the overall process energy efficiency is important for minimizing the impacts of energy requirements.15 To achieve this, pretreatment of the pulp can be one solution.27 Hence, Scenario CNF-1 selected enzymatic hydrolysis as the pretreatment method to compare with the CNF baseline process. After the pulp shredder, the pulp is mixed with enzyme and buffer solution for enzymatic hydrolysis. After the enzymatic hydrolysis, the pulp is diluted to 1 wt% for disk refining and microfluidization. Similar to Scenario CNC-5 and CNC-6, Scenario CNF-2 utilizes wood pellets as the fuel source; Scenario CNF-3 further deploys wind power.
2.5. End-of-life of cellulose nanocrystals and cellulose nanofibrils
In this study, CNC and CNF are assumed to be landfilled with landfill gas recovery. Landfilled CNC or CNF majorly emits Greenhouse Gas (GHG) emissions (mainly CO2 and CH4) through the decay process.72 Since CNC and CNF contain a neglectable amount of nutrient elements or other elements, this study only accounts for the GHG emissions from landfill gas. However, future research can include more emissions depending on the data availability. Due to the high GWP factor and energy value of CH4, landfill gas recovery for energy generation is increasingly practiced in the U.S.73 The GWP of CNC/CNF end of life were estimated by two steps: (1) the GHG emissions of landfill gas were evaluated by using the Intergovernmental Panel on Climate Change (IPCC) First Order Decay (FOD) method;72 (2) it is assumed that part of the landfill gas is recovered, and then combusted for power generation. The details of landfill and landfill gas recovery are described in ESI Section S6 and Table S3.†2.6. Life cycle assessment for cellulose nanomaterials
The cradle-to-grave LCAs were conducted in this study to assess the environmental performance of CNC and CNF production in the U.S., following ISO14040 and 14044 standards.10,74 The cradle-to-grave system boundary includes raw material extraction, transportation, production, and end-of-life of CNC and CNF. Since cellulose nanomaterials have broad applications (e.g., electronics, coating), this study does not include the use phase (e.g., electronic usage). The use phase can be added in future research for specific CNC/CNF applications. Two functional units are used. A quantity of 1 dry kg of cellulose nanomaterials is the mass-based functional unit, which is widely used in the previous LCA literature of CNC and CNF.35 The LCA results are then converted to the performance-based functional unit that incorporates material performance, specific tensile strength (see ESI Section S7 for details†).75,76Different scenarios of CNC and CNF productions are developed to analyze the impacts of implementing GC principles. In each scenario, a process-based model was established to generate the mass and energy balance data that are utilized as life-cycle inventory (LCI) data in the LCA. The LCI of producing fuels, chemicals, and electricity (background processes) were collected from the ecoinvent 3.6 cut-off database77 and are documented in ESI Table S4.†
The LCI data for producing NBSK pulp (for CNF production) was derived from the study by Thomas and Liu,78 and shown in ESI Table S5.† The cradle-to-gate life-cycle environmental impacts of producing viscose grade dissolving pulp (for CNC production) were based on the work by Echeverria et al. and shown in ESI Table S6.†![[thin space (1/6-em)]](https://www.rsc.org/images/entities/char_2009.gif) 58 The emission factors of combusting natural gas and wood pellet follow the U.S. Environmental Protection Agency (EPA) AP-42 External Combustion Sources emission factors for natural gas and wood residue combustion.79 In this study, the feedstock pulp contains biogenic carbon that has two destinations. One is in nanocellulose that ends in landfill; the other is emitted as sugars or other organic compounds (e.g., unreacted cellulose, furfural) to wastewater. The biogenic carbon ending in landfills is tracked by using the IPCC FOD method as mentioned above. In this study, the biogenic carbon in wastewater is assumed to be eventually oxidized into CO2 that is emitted to the atmosphere.
58 The emission factors of combusting natural gas and wood pellet follow the U.S. Environmental Protection Agency (EPA) AP-42 External Combustion Sources emission factors for natural gas and wood residue combustion.79 In this study, the feedstock pulp contains biogenic carbon that has two destinations. One is in nanocellulose that ends in landfill; the other is emitted as sugars or other organic compounds (e.g., unreacted cellulose, furfural) to wastewater. The biogenic carbon ending in landfills is tracked by using the IPCC FOD method as mentioned above. In this study, the biogenic carbon in wastewater is assumed to be eventually oxidized into CO2 that is emitted to the atmosphere.
For the life cycle impact assessment method, as mentioned above, this study uses the GWP factors by the IPCC AR6 GWP-100 factors and TRACI 2.1 by U.S. EPA.80,81 Hence, 10 impact categories are used: acidification, human health cancer, human health noncancer, ecotoxicity, eutrophication, fossil fuel depletion, global warming, ozone depletion, respiratory effects, and smog formation.
2.7. Techno-economic analysis for cellulose nanomaterials
The TEA investigates the CNC and CNF plant that produces 25–100 dry t cellulose nanomaterials per day. The capacity of 50 dry t per day is the plant scale used in the previous literature.46,47 The selected indicator of economic performance is the minimum selling price (MSP). MSP was calculated by the discounted cash flow rate of return (DCFROR) analysis conducted in Microsoft Excel.82 The MSP was derived by setting the 10% IRR and the Net Present Value (NPV) to be zero.82 The year of analysis is 2020 given the data availability. The key assumptions of the TEA are shown in ESI Tables S7 and S8.† In TEA, the original purchased costs, installation factors, equipment scaling factors, material and energy prices, and feedstock costs were collected from the literature and discussed in ESI Section S8 and Tables S9–S12 for capital expenditures, and ESI Section S9 and Tables S13–S16 for operating expenditures.†2.8. Eco-efficiency analysis
We adopt the indicator, ECE, proposed by Hellweg et al.19 to quantify the eco-efficiency performance. ECEA,B is measured as the net environmental benefit of technology A over technology B divided by the additional financial cost of technology A over technology B, as shown in eqn (1).19 Technology A is defined as the more environmentally benign technology. In eqn (1), IPA and IPB is the environmental impact of technology A and B, respectively; NCA and NCB is the net financial cost of technology A and B, respectively.19 According to the definition, the numerator of eqn (1) is always positive. If NCA > NCB (or say ECEA,B is positive), it means the trade-offs appear between environmental and economic aspects. The larger ECEA,B is, the higher eco-efficient the technology A is over technology B.19 If NCA < NCB (or say ECE is negative), it means that the co-benefit exists between environmental and economic aspects for technology A over B. The larger the absolute value of ECE is, the higher the co-benefit of technology A is over technology B when harvesting the same amount of cost benefit. In this study, GWP is selected as the environmental impact indicator and MSP is chosen as the financial cost indicator. Each scenario is compared with the baseline (technology B). Hence, if ECE > 0, the absolute value of ECE indicates how much GWP can be reduced when MSP is increased by US$1; if ECE < 0, the absolute value of ECE indicates how much GWP can be reduced when MSP is decreased by US$1.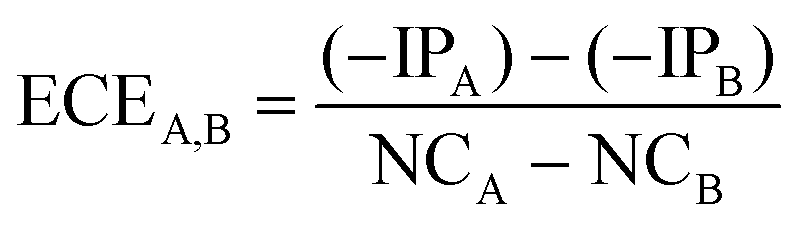 | (1) |
2.9. Scenario analysis
The derived scenarios for the case study of cellulose nanomaterials are shown in ESI Table S17.† As mentioned above, there are 7 scenarios in CNC production and 4 scenarios in CNF production, including the baselines. As mentioned above, the detailed flowcharts of scenarios are available in ESI Fig. S1–S7.†3. Results and discussion
3.1. Life-cycle environmental performance of cellulose nanomaterials
 | ||
| Fig. 3 The normalized life-cycle environmental impacts of 1 dry kg CNC. CNC baseline: sulfuric acid for hydrolysis and NaOH for neutralization without acid recovery; Scenario CNC-1: sulfuric acid for hydrolysis and CaO for neutralization without acid recovery; Scenario CNC-2: sulfuric acid for hydrolysis and CaO for neutralization with acid recovery; Scenario CNC-3: citric acid for hydrolysis and CaO for neutralization with acid recovery; Scenario CNC-4: subcritical water for hydrolysis; Scenario CNC-5: combusting wood pellets, all other conditions same as Scenario CNC-2; Scenario CNC-6: wind power, all other conditions same as Scenario CNC-5. | ||
Given the high contribution of H2SO4 to environmental burdens, Scenario CNC-2 recovering acid decreases the environmental impacts by 8.9%–68.7% across all categories compared to Scenario CNC-1. GWP of Scenario CNC-2 decreases by 44.5% (6.5 kgCO2e in Scenario CNC-2 versus 11.7 kgCO2e in Scenario CNC-1, see ESI Table S18†). Though chemical usage decreases, the energy-related GWP of Scenario CNC-2 is 58.3% higher than CNC-1 due to natural gas consumption of the acid recovery process.
The results of Scenarios CNC-3 and CNC-4 demonstrate the importance of solvent selection. In Fig. 3, Scenario CNC-3 using critic acid has the highest GWP (22.8 kgCO2e per kg dry CNC, even higher than the baseline), mainly contributed by hydrolysis chemicals citric acid and HCl (65.6% of total GWP, see ESI Table S18†). Scenario CNC-3 also shows much higher environmental burdens than Scenario CNC-2 (56.3%–547.3% higher across all categories). Hence, using citric acid with the current recovery technologies presented in this study is not environmentally favorable and therefore this scenario is rejected. Instead of using citric acid, Scenario CNC-4 employs subcritical water hydrolysis and results in much lower environmental burdens than CNC-3. Compared to Scenario CNC-2 that does not change solvents, Scenario CNC-4 shows lower environmental impacts in most categories except GWP (6.8 kgCO2e per kg dry CNC, 5.2% higher than Scenario CNC-2), eutrophication, fossil fuel depletion, and respiratory (17.6%–40.5% higher than Scenario CNC-2). This is mainly because of the lower CNC yield (30%) of Scenario CNC-4 than Scenario CNC-2 (53.1%) (see ESI Table S18†). Hence, increasing CNC yield is recommended as the future research direction to improve the environmental performance of the subcritical water hydrolysis pathway.
The results of Scenarios CNC-5 and CNC-6 indicate the environmental trade-offs of energy decarbonization. Scenario CNC-5 combusts wood pellets instead of natural gas in Scenario CNC-2, resulting in 25.8% lower GWP and 40.3% lower fossil fuel depletion. However, Scenario CNC-5 has 0.3%–43.2% higher environmental burdens in other impact categories than Scenario CNC-2 due to higher non-greenhouse gas air emissions (e.g., benzene, formaldehyde, fluorene) of wood pellet combustion. In Scenario CNC-6 which combusts wood pellets and further deploys wind power, GWP is finally reduced to 53.3% (2.6 kgCO2e per kg dry CNC) of Scenario CNC-5 which uses grid electricity.
Overall, our results for CNC scenarios indicate larger environmental reduction potentials of chemical and waste related strategies than alternative energy supplies. The results of each scenario shed light on individual steps and combined pathways toward greener production of CNC materials. The sensitivity analysis of Scenario CNC-2 (see ESI Fig. S9, Table S19, and Section S10†) shows pulp consistency in acid hydrolysis and CNC conversion rate as the main impactors on GWP. Hence, increasing the pulp consistency in acid hydrolysis and the CNC conversion rate are recommended as future research priorities for reducing the carbon footprint of CNC. In previous literature, the cradle-to-gate (without end-of-life stage) results range from 12.9 to 29.4 kgCO2e per kg dry CNC.38,43,45 The cradle-to-gate portion of our GWP result in the CNC baseline (17.5 kgCO2e per kg dry CNC, see ESI Table S18†) is within the range of the previous literature.
The end-of-life stage (i.e., landfill with landfill gas recovery for power generation) of CNC shows a minor influence on LCA results of the baseline, Scenarios CNC-1 and CNC-3. For example, in the CNC baseline, the end-of-life stage accounts for −3.6%–1.2% across all impact categories (negative values are the avoided environmental burdens of electricity substituted by landfill gas energy recovery) (see ESI Table S18†). The end-of-life impact increases to −28.3%–8.2% in Scenario CNC-6.
Integrating material performance into the LCA provides additional insights. Although the overall trends of the LCA results using the performance-based functional unit (see ESI Fig. S8†) are similar to the results based on 1 dry kg basis in Fig. 3, CNC-3 shows lower environmental impacts than the baseline due to better material performance, which is not the case using 1 kg dry CNC as the functional unit. However, CNC-3 is still rejected, given the higher environmental burdens than CNC-2 scenario.
 | ||
| Fig. 4 The normalized life-cycle environmental impacts of 1 dry kg CNF. CNF baseline: mechanical treatment; Scenario CNF-1: enzymatic hydrolysis as the pretreatment; Scenario CNF-2: combusting wood pellets, other settings are the same as Scenario CNF-1; Scenario CNF-3: wind power, other settings are the same with Scenario CNF-2. Note that the normalized result of Scenario CNF-3 GWP is 1.5% which is too small to be observed in the figure. | ||
The end-of-life stage in Scenario CNF-3 (wind power) accounts for −47.2% to −5.3% of the life-cycle environmental impacts across all the categories except global warming (negative values due to the electricity displacement by recovering landfill gas for power generation). For example, for all CNF scenarios, the GWP of end-of-life includes the greenhouse gas (GHG) emissions from landfills (0.75 kgCO2e per kg dry CNF) and electricity displacement (−0.54 kgCO2e per kg dry CNF), and results in 0.21 kgCO2e per kg dry CNF (see ESI Table S20†). For other impact categories, the end-of-life stage shows negative values, indicating the environmental benefits of recovering landfill gas for electricity generation. Hence, emissions from the end-of-life and landfill gas recovery are not neglectable, especially for Scenarios CNF-2 (total GWP 3.6 kgCO2e per kg dry CNF) and CNF-3 (total GWP 0.1 kgCO2e per kg dry CNF). The cradle-to-gate GWP results (without end-of-life) in the CNF baseline (7.57 kgCO2e per kg dry CNF, see ESI Table S20†) and CNF-1 (4.74 kgCO2e per kg dry CNF, see ESI Table S20†) are within the range of the cradle-to-gate GHG emissions reported by the previous literature (0.79–23.0 kgCO2e per kg dry CNF).35,49,83
The sensitivity analysis of Scenario CNF-1 (see ESI Fig. S11 and Section S10†) shows that pulp consistency in enzymatic hydrolysis has the largest impact on GWP, as it determines the water consumption, heat for hydrolysis, and electricity in hydrolysis and purification. The landfill gas recovery rate in the end-of-life stage, electricity consumption, and electricity carbon intensity are other important factors of GWP results. The results of the performance-based functional unit (see ESI Fig. S10†) show similar trends to the results on the basis of 1 dry kg CNF.
3.2. Economic feasibility of cellulose nanomaterials
The MSP and operating cost of CNC and CNF scenarios on 1 dry metric ton (t) of product basis are shown in Fig. 5a and b. The MSP, capital investment, and operating cost of varied plant capacities are displayed in ESI Tables S9–S16 and S21.† In Fig. 5a and b, the GWP results from LCA are exhibited as green triangles. Fig. 5c shows the MSP and GWP of all scenarios. Fig. 5d shows the ECE results of the scenarios. The results of performance-based functional unit are available in ESI Fig. S12† that shows similar trends to Fig. 5. | ||
| Fig. 5 Minimum selling price, operating cost, global warming potentials, and eco-efficiency analysis results of scenarios at 50 dry t per day. (a) Cellulose nanocrystal scenarios. (b) Cellulose nanofibril scenarios. (c) Minimum selling price and GWP in all scenarios. (d) Environmental cost efficiency results of scenarios compared to the baseline. The minimum selling price (MSP) is displayed as diamonds (left vertical axis). GWP is displayed as triangles (right vertical axis). The plot of (c) is based on the MSP and GWP in (a) and (b). The results of environmental cost efficiency in (d) are derived based on GWP and MSP shown in (c). Positive values of environmental cost efficiency indicate the trade-off between environmental benefit and cost, and their absolute values show how much GWP can be reduced when MSP is increased by US$1. Negative values of environmental cost efficiency indicate the co-benefit of environmental benefit and cost, and their absolute values show how much GWP can be reduced when MSP is decreased by US$1. Note that the environmental cost efficiency of Scenario CNC-3 is not shown as Scenario CNC-3 has higher GWP than the CNC baseline. | ||
974 per dry t CNC).39,47
The MSP of Scenario CNC-5 (combusting wood pellets) increases to US$4713 from US$4601 per t in Scenario CNC-2, though the GWP of Scenario CNC-5 decreases by 25.8% compared to Scenario CNC-2. When switching to wind power, the MSP of Scenario CNC-6 decreases to US$4587 per t. Note that the onshore wind power cost was estimated by the levelized cost of energy estimated by the U.S. National Renewable Energy Laboratory.84 This can be further tailored depending on wind power type (e.g., onshore, fixed-bottom, floating offshore) and locations.84 The sensitivity analysis of Scenario CNC-2 (see ESI Fig. S9 and Section S10†) exhibits pulp consistency in acid hydrolysis, internal rate of return (IRR), plant capacities, and CNC conversion rate as the main drivers of the MSP. For example, increasing the CNC conversion rate from 53.1% to 65.7% can reduce the MSP to US$4085 per dry t CNC.60 Future research can further explore the methods to increase CNC yield,85 especially for large-scale production.
3.3. Eco-efficiency analysis
Fig. 5c co-presents MSP and GWP results of all scenarios; Fig. 5d shows the ECE results of CNC and CNF scenarios. ECE is calculated as the net environmental benefit of scenarios over baselines divided by the financial cost differences between scenarios and baselines. A positive ECE reflects a trade-off between higher costs and lower environmental burdens than the baseline. In other words, a positive ECE shows how much environmental burdens can be reduced by increasing the cost by US$1. A negative ECE, on the other hand, reflects a co-benefit of simultaneously reducing cost and environmental impacts, specifically showing how much environmental burdens can be reduced simultaneously with a cost reduction of US$1. Since CNC-3 is rejected given higher environmental burdens than CNC-2, CNC-3 is not included in ECE analysis according to the definition in Section 2.8. All CNF scenarios fall into trade-off regions. Scenario CNF-3 has higher ECE (68.5 kgCO2e per $) than Scenarios CNF-1 (13.2 kgCO2e per $) and Scenario CNF-2 (13.8 kgCO2e per $). This is mainly contributed by wind power that largely reduces GWP and electricity cost. Wind power in Scenario CNF-3 results in a decrease of GWP by 7.7 kgCO2e per kg dry CNF and an increase of MSP by US$111.8 per t dry CNF, compared to the CNF baseline. Scenario CNF-2 without wind power shows a much smaller GWP decrease (by 4.2 kgCO2e per kg dry CNF) but a larger MSP increase (US$304.9 per t dry CNF). The MSP increase can be mitigated in the future by lowering the cost of renewable energy. In contrast to the CNF scenarios, CNC scenarios show co-benefits as shown in Fig. 5a. As the value of ECE shows the magnitude of environmental burden changes when 1 unit of financial performance is changed, the ECE results of different scenarios show the extent to which co-benefits or trade-offs exist for various process design choices, informing decision making towards maximum environmental cost-effectiveness. For example, CNF scenarios all have trade-offs, but Scenario CNF-3 has the highest ECE in Fig. 5d, indicating the largest environmental benefits when increasing the same US$1 cost. Thus, Scenario CNF-3 is the most favorable in terms of eco-efficiency. This conclusion is consistent with the results shown in Fig. 5b where three CNF scenarios all have higher MSP than the baseline, but Scenario CNF-3 has a lower GWP and MSP than Scenarios CNF-1 and 2.For CNC scenarios, decision-makers can decide the best option depending on their targets of GWP reduction and budget or technological limits. However, ECE values provide additional information on the effectiveness of using their investment in reducing environmental burdens. When the cost benefits of various scenarios are similar, the higher absolute value of negative ECE is better. For example, Scenario CNC-5 shows better results (−4.5 kgCO2e per $) than Scenario CNC-4 (−3.9 kgCO2e per $) when MSP reduction compared to the baseline is similar (US$2793 for CNC-4 and US$2827 for CNC-5). These results demonstrate the usefulness of the framework and ECE indicator in supporting decision-making for sustainable cellulose material production. This case study only uses GWP and MSP for demonstration, but other indicators (e.g., other environmental impacts presented in this study or aggregated environmental impacts as shown in the study by Van Schoubroeck et al.86) can be used, depending on decision-makers’ needs and preferences. Moreover, ECE provides insights on trade-offs and co-benefits, but it should not be used alone without reporting the absolute values of environmental and economic performance which provides insights on the scale of financial investment and environmental issues, both of which are important for decision making.19
4. Conclusions
This study develops a modeling framework to support the decision-making for producing more sustainable materials. The framework is demonstrated by a case study of cellulose nanomaterials produced by various pathways in the U.S. The pathways are identified based on the applicable GC principles. For CNC, the life-cycle GWP across scenarios is 2.6–17.7 kgCO2e per kg dry CNC; the MSP is US$4286–$7540 per dry t CNC. Other environmental impacts such as acidification, eutrophication, and human health impacts, are also quantified. The results show that changing the neutralization agent from NaOH to CaO in CNC production largely reduces the life-cycle environmental impacts and MSP. The environmental impacts can be further reduced by adding acid recovery, although this change requires additional capital investment. Subcritical water is a better solvent than citric acid in terms of both environmental impacts and MSP. Future improvement in CNC yield can further reduce the GWP and MSP of the subcritical water pathway. For CNF, the life-cycle GWP across scenarios is 0.1–7.8 kgCO2e per kg dry CNF; the MSP is US$2873–$3178 per dry t CNF. Enzymatic hydrolysis in pretreatment reduces the overall environmental impacts but increases MSP of CNF scenarios. In both CNC and CNF scenarios, renewable energy sources reduce most environmental impacts but not necessarily MSP. The eco-efficiency analysis assesses the trade-offs or co-benefits of economic and environmental performances of various scenarios and identifies the most cost-effective routes to reduce the environmental burdens, i.e., using sulfuric acid with acid recovery and CaO neutralization combined with renewable fuel and electricity for CNC, and using enzymatic hydrolysis combined with renewable fuel and electricity for CNF. The case study demonstrates how LCA and TEA can be coupled with GC and eco-efficiency analysis in one consistent framework to identify more sustainable pathways of cellulose material production. This framework is broadly applicable and can be applied to other materials to support process design and optimization towards more sustainable directions.Author contributions
Y. Y. and K. L. designed the idea. Y. Y. supervised this study. K. L., H. S. W., T. L., C. A. A. collected and analyzed the data. K. L. built the process simulation models. K. L., H. S. W. and T. L. conducted the LCA, TEA, and sensitivity analysis. R. A. V. and Y. Z. provided suggestions for LCA and TEA. K. L. and H. S. W. visualized the results. K. L., H. S. W., T. L., C. A. A. wrote the draft. Y. Y., R. A. V., and Y. Z. revised the manuscript. All the authors contributed to writing and finalizing the manuscript.Conflicts of interest
The authors declare no conflicts of interest.Acknowledgements
The authors thank the funding support from Yale University and the U.S. National Science Foundation. This work is partially supported by the National Science Foundation under Grant No. 2134664. Any opinions, findings, and conclusions or recommendations expressed in this material are those of the author(s) and do not necessarily reflect the views of the National Science Foundation.References
- S. A. Mazari, E. Ali, R. Abro, F. S. A. Khan, I. Ahmed, M. Ahmed, S. Nizamuddin, T. H. Siddiqui, N. Hossain, N. M. Mubarak and A. Shah, J. Environ. Chem. Eng., 2021, 9, 105028 CrossRef CAS.
- L. M. Gilbertson, L. Pourzahedi, S. Laughton, X. Gao, J. B. Zimmerman, T. L. Theis, P. Westerhoff and G. V. Lowry, Nat. Nanotechnol., 2020, 15, 801–810 CrossRef CAS PubMed.
- M. M. Khin, A. S. Nair, V. J. Babu, R. Murugan and S. Ramakrishna, Energy Environ. Sci., 2012, 5, 8075–8109 RSC.
- M. M. Falinski, D. L. Plata, S. S. Chopra, T. L. Theis, L. M. Gilbertson and J. B. Zimmerman, Nat. Nanotechnol., 2018, 13, 708–714 CrossRef CAS PubMed.
- M. F. Ashby, Materials and the environment: eco-informed material choice, Elsevier, 2012 Search PubMed.
- C. W. Babbitt and E. A. Moore, Nat. Nanotechnol., 2018, 13, 621–623 CrossRef CAS PubMed.
- S. Gavankar, S. Suh and A. F. Keller, Int. J. Life Cycle Assess., 2012, 17, 295–303 CrossRef.
- C. A. de Assis, L. G. Greca, M. Ago, M. Y. Balakshin, H. Jameel, R. Gonzalez and O. J. Rojas, ACS Sustainable Chem. Eng., 2018, 6, 11853–11868 CrossRef PubMed.
- A. Ahmed, I. Hassan, T. Ibn-Mohammed, H. Mostafa, I. M. Reaney, L. S. C. Koh, J. Zu and Z. L. Wang, Energy Environ. Sci., 2017, 10, 653–671 RSC.
- ISO, ISO 14044: Environmental Management, Life Cycle Assessment, Requirements and Guidelines, 2006 Search PubMed.
- K. Lan, B. Zhang and Y. Yao, One Earth, 2022, 1–14 Search PubMed.
- T. Terlouw, C. Bauer, L. Rosa and M. Mazzotti, Energy Environ. Sci., 2021, 14, 1701–1721 RSC.
- M. Metzger, M. M. Besli, S. Kuppan, S. Hellstrom, S. Kim, E. Sebti, C. V. Subban and J. Christensen, Energy Environ. Sci., 2020, 13, 1544–1560 RSC.
- N. R. Baral, O. Kavvada, D. Mendez-Perez, A. Mukhopadhyay, T. S. Lee, B. A. Simmons and C. D. Scown, Energy Environ. Sci., 2019, 12, 807–824 RSC.
- P. Anastas and N. Eghbali, Chem. Soc. Rev., 2010, 39, 301–312 RSC.
- E. S. Beach, Z. Cui and P. T. Anastas, Energy Environ. Sci., 2009, 2, 1038–1049 RSC.
- L. M. Gilbertson, J. B. Zimmerman, D. L. Plata, J. E. Hutchison and P. T. Anastas, Chem. Soc. Rev., 2015, 44, 5758–5777 RSC.
- J. B. Zimmerman, P. T. Anastas, H. C. Erythropel and W. Leitner, Science, 2020, 367, 397–400 CrossRef CAS PubMed.
- S. Hellweg, G. Doka, G. Finnveden and K. Hungerbühler, J. Ind. Ecol., 2005, 9, 189–203 CrossRef CAS.
- G. Huppes and M. Ishikawa, J. Ind. Ecol., 2005, 9, 43–46 CrossRef.
- L. Zhang, X. Jia, Y. Ai, R. Huang, W. Qi, Z. He, J. J. Klemeš and R. Su, J. Cleaner Prod., 2022, 345, 131073 CrossRef CAS.
- O. Nechyporchuk, M. N. Belgacem and J. Bras, Ind. Crops Prod., 2016, 93, 2–25 CrossRef CAS.
- X. Xu, F. Liu, L. Jiang, J. Y. Zhu, D. Haagenson and D. P. Wiesenborn, ACS Appl. Mater. Interfaces, 2013, 5, 2999–3009 CrossRef CAS PubMed.
- Y. Habibi, L. A. Lucia and O. J. Rojas, Chem. Rev., 2010, 110, 3479–3500 CrossRef CAS PubMed.
- A. B. Reising, R. J. Moon and J. P. Youngblood, J. Sci. Technol. For. Prod. Processes, 2012, 2, 32–41 Search PubMed.
- Y. Cen, Z. Xiang, T. Han, Y. Long and T. Song, Cellulose, 2022, 29, 7193–7209 CrossRef CAS.
- Y. Qing, R. Sabo, J. Y. Zhu, U. Agarwal, Z. Cai and Y. Wu, Carbohydr. Polym., 2013, 97, 226–234 CrossRef CAS PubMed.
- L. Kong, D. Xu, Z. He, F. Wang, S. Gui, J. Fan, X. Pan, X. Dai, X. Dong, B. Liu and Y. Li, Molecules, 2019, 24, 1–13 Search PubMed.
- W. Wang and S. Fu, Cellulose, 2020, 27, 1009–1020 CrossRef CAS.
- S. Jacob, R. Reshmy, S. Antony, A. Madhavan, R. Sindhu, M. K. Awasthi, M. Kuddus, S. Pillai, S. Varjani, A. Pandey and P. Binod, Bioengineered, 2022, 13, 12823–12833 CrossRef CAS PubMed.
- K. S. Ooi, S. Haszman, Y. N. Wong, E. Soidin, N. Hesham, M. A. A. Mior, Y. Tabata, I. Ahmad, M. B. Fauzi and M. H. M. Yunus, Materials, 2020, 13, 1–17 CrossRef PubMed.
- R. Sabo, A. Yermakov, C. T. Law and R. Elhajjar, J. Renewable Mater., 2016, 4, 297–312 CrossRef CAS.
- S. Zhu, H. Sun, Y. Lu, S. Wang, Y. Yue, X. Xu, C. Mei, H. Xiao, Q. Fu and J. Han, ACS Appl. Mater. Interfaces, 2021, 13, 59142–59153 CrossRef CAS PubMed.
- H. Nadeem, M. Dehghani, G. Garnier and W. Batchelor, J. Cleaner Prod., 2022, 342, 130890 CrossRef CAS.
- R. Arvidsson, D. Nguyen and M. Svanström, Environ. Sci. Technol., 2015, 49, 6881–6890 CrossRef CAS PubMed.
- X. Z. Sun, D. Moon, T. Yagishita and T. Minowa, Trans. ASABE, 2013, 56, 1061–1067 CAS.
- S. Haroni, H. Z. Dizaji, H. Bahrami and M. G. Alriols, Ind. Crops Prod., 2021, 173, 114084 CrossRef CAS.
- H. Gu, R. Reiner, R. Bergman and A. Rudie, in Proceedings from the LCA XV Conference, 2015, pp. 33–42.
- T. J. Bondancia, G. Batista, J. de Aguiar, M. V. Lorevice, A. J. G. Cruz, J. M. Marconcini, L. H. C. Mattoso and C. S. Farinas, ACS Sustainable Chem. Eng., 2022, 10, 4660–4676 CrossRef CAS.
- D. M. do Nascimento, A. F. Dias, C. P. de Araújo Junior, M. de F. Rosa, J. P. S. Morais and M. C. B. de Figueirêdo, Ind. Crops Prod., 2016, 93, 58–65 CrossRef.
- R. M. Leão, P. C. Miléo, J. M. L. L. Maia and S. M. Luz, Carbohydr. Polym., 2017, 175, 518–529 CrossRef PubMed.
- P. Gallo Stampino, L. Riva, C. Punta, G. Elegir, D. Bussini and G. Dotelli, Molecules, 2021, 26, 1–20 CrossRef PubMed.
- K. C. Teh, R. R. Tan, K. B. Aviso, M. A. B. Promentilla and J. Tan, Food Bioprod. Process., 2019, 118, 13–31 CrossRef CAS.
- M. C. B. de Figueirêdo, M. de Freitas Rosa, C. M. L. Ugaya, M. D. S. M. de Souza Filho, A. C. C. da Silva Braid and L. F. L. de Melo, J. Cleaner Prod., 2012, 35, 130–139 CrossRef.
- S. Zargar, J. Jiang, F. Jiang and Q. Tu, Biofuels, Bioprod. Biorefin., 2022, 16, 68–80 CrossRef CAS.
- C. A. de Assis, M. C. Iglesias, M. Bilodeau, D. Johnson, R. Phillips, M. S. Peresin, E. M. Bilek, O. J. Rojas, R. Venditti and R. Gonzalez, Biofuels, Bioprod. Biorefin., 2017, 12, 251–264 CrossRef.
- C. A. de Assis, C. Houtman, R. Phillips, E. M. Bilek, O. J. Rojas, L. Pal, M. S. Peresin, H. Jameel and R. Gonzalez, Biofuels, Bioprod. Biorefin., 2017, 11, 682–700 CrossRef.
- M. Jonoobi, A. P. Mathew and K. Oksman, Ind. Crops Prod., 2012, 40, 232–238 CrossRef CAS.
- D. Moon, M. Sagisaka, K. Tahara and K. Tsukahara, Sustainablility, 2017, 9, 2368 CrossRef.
- L. P. Novo, J. Bras, A. García, N. Belgacem and A. A. S. Curvelo, ACS Sustainable Chem. Eng., 2015, 3, 2839–2846 CrossRef CAS.
- N. U. M. Nizam, M. M. Hanafiah and K. S. Woon, Nanomaterials, 2021, 11, 1–27 CrossRef PubMed.
- J. Kirchherr, D. Reike and M. Hekkert, Resour., Conserv. Recycl., 2017, 127, 221–232 CrossRef.
- G. Moraga, S. Huysveld, F. Mathieux, G. A. Blengini, L. Alaerts, K. Van Acker, S. de Meester and J. Dewulf, Resour., Conserv. Recycl., 2019, 146, 452–461 CrossRef PubMed.
- A. G. Parvatker and M. J. Eckelman, ACS Sustainable Chem. Eng., 2019, 7, 350–367 CrossRef CAS.
- A. W. Zimmermann, J. Wunderlich, L. Müller, G. A. Buchner, A. Marxen, S. Michailos, K. Armstrong, H. Naims, S. McCord, P. Styring, V. Sick and R. Schomäcker, Front. Energy Res., 2020, 8, 1–23 CrossRef.
- W. Wang, S. Fu, S. Y. Leu and C. Dong, Cellulose, 2018, 25, 6465–6478 CrossRef CAS.
- Z. Zhu, W. Wang, X. Wang, X. Zhao, N. Xia, F. Kong and S. Wang, Cellulose, 2021, 28, 9661–9676 CrossRef CAS.
- D. Echeverria, R. Venditti, H. Jameel and Y. Yao, Environ. Sci. Technol., 2022, 56, 4578–4586 CrossRef PubMed.
- H. Sixta, Handbook of Pulp, Wiley-VCH Verlag GmbH & Co. KGaA, Weinheim, Germany, 2006 Search PubMed.
- Q. Wang, X. Zhao and J. Y. Zhu, Ind. Eng. Chem. Res., 2014, 53, 11007–11014 CrossRef CAS.
- J. Lemaire, C. L. Blanc, F. Duval, M. A. Théoleyre and D. Pareau, Sep. Purif. Technol., 2016, 166, 181–186 CrossRef CAS.
- F. J. Wolfaardt, L. G. L. Fernandes, S. K. C. Oliveira, X. Duret, J. F. Görgens and J. M. Lavoie, Energy Convers. Manage.: X, 2021, 10, 100074 CAS.
- J. Wang, Z. Cui, Y. Li, L. Cao and Z. Lu, J. Cleaner Prod., 2020, 249, 119315 CrossRef CAS.
- L. P. Novo, J. Bras, A. García, N. Belgacem and A. A. da S. Curvelo, Ind. Crops Prod., 2016, 93, 88–95 CrossRef CAS.
- D. A. Johnson, in TAPPI Nanotechnology Conference, Vancouver, CA, 2014.
- The University of Maine, UMaine Nanomaterial Pilot Plant, https://umaine.edu/pdc/nanocellulose/umaine-nanomaterial-pilot-plant/.
- X. Tian, P. Lu, X. Song, S. Nie, Y. Liu, M. Liu and Z. Wang, Cellulose, 2017, 24, 3929–3942 CrossRef CAS.
- Y. Wen, Z. Yuan, J. Qu, C. Wang and A. Wang, ACS Sustainable Chem. Eng., 2020, 8, 2688–2697 CrossRef CAS.
- N. Saba, F. Mohammad, M. Pervaiz, M. Jawaid, O. Y. Alothman and M. Sain, Int. J. Biol. Macromol., 2017, 97, 190–200 CrossRef CAS PubMed.
- A. K. Timo and L. V. Luukkainen, Cellulose, 2020, 27, 6961–6976 CrossRef.
- S. Ang, V. Haritos and W. Batchelor, Cellulose, 2019, 26, 4767–4786 CrossRef CAS.
- S. Towprayoon, T. Ishigaki, C. Chiemchaisri, A. O. Abdel-Aziz, M. E. Hunstone, C. Jarusutthirak, M. Ritzkowski and M. Thomsen, in 2019 Refinement to the 2006 IPCC Guidelines for National Greenhouse Gas Inventories, 2019, vol. 5, pp. 6.1–6.49 Search PubMed.
- US EPA, Landfill Methane Outreach Program (LMOP), https://www.epa.gov/lmop/project-and-landfill-data-state.
- ISO, ISO 14040:2006 Environmental management—Life cycle assessment—Principles and framework, 2006 Search PubMed.
- Q. Xia, C. Chen, Y. Yao, J. Li, S. He, Y. Zhou, T. Li, X. Pan, Y. Yao and L. Hu, Nat. Sustainable, 2021, 4, 627–635 CrossRef.
- S. Xiao, C. Chen, Q. Xia, Y. Liu, Y. Yao, Q. Chen, M. Hartsfield, A. Brozena, K. Tu, S. J. Eichhorn, Y. Yao, J. Li, W. Gan, S. Q. Shi, V. W. Yang, M. Lo Ricco, J. Y. Zhu, I. Burgert, A. Luo, T. Li and L. Hu, Science, 2021, 374, 465–471 CrossRef CAS PubMed.
- G. Wernet, C. Bauer, B. Steubing, J. Reinhard, E. Moreno-Ruiz and B. Weidema, Int. J. Life Cycle Assess., 2016, 21, 1218–1230 CrossRef.
- V. M. Thomas and W. Liu, Assessment of Alternative Fibers for Pulp Production, 2013 Search PubMed.
- US Environmental Protection Agency, AP 42, Fifth Edition Compilation of Air Pollutant Emissions Factors, 2009 Search PubMed.
- IPCC, Climate Change 2021: The Physical Science Basis AR 6 Work Group I, 2022 Search PubMed.
- M. Ryberg, M. D. M. Vieira, M. Zgola, J. Bare and R. K. Rosenbaum, Clean Technol. Environ. Policy, 2014, 16, 329–339 CrossRef CAS.
- K. Lan, L. Ou, S. Park, S. S. Kelley, B. C. English, T. E. Yu, J. Larson and Y. Yao, Renewable Sustainable Energy Rev., 2021, 110881 CrossRef.
- Q. Li, S. Mcginnis, C. Sydnor, A. Wong and S. Renneckar, ACS Sustainable Chem. Eng., 2013, 1, 919–928 CrossRef CAS.
- T. Stehly, P. Beiter and P. Duffy, 2019 Cost of Wind Energy Review, Golden, CO, United States, 2020 Search PubMed.
- L. Chen, Q. Wang, K. Hirth, C. Baez, U. P. Agarwal and J. Y. Zhu, Cellulose, 2015, 22, 1753–1762 CrossRef CAS.
- S. Van Schoubroeck, G. Thomassen, S. Van Passel, R. Malina, J. Springael, S. Lizin, R. A. Venditti, Y. Yao and M. Van Dael, Green Chem., 2021, 23, 1700–1715 RSC.
Footnote |
| † Electronic supplementary information (ESI) available. See DOI: https://doi.org/10.1039/d3gc04036d |
| This journal is © The Royal Society of Chemistry 2024 |