
 Open Access Article
 This Open Access Article is licensed under a Creative Commons Attribution-Non Commercial 3.0 Unported Licence
Tempeh fermentation improves the nutritional and functional characteristics of Jack beans (Canavalia ensiformis (L.) DC)†
Fiametta Ayu
Purwandari
 ab,
Vincenzo
Fogliano
a and
Edoardo
Capuano
*a
ab,
Vincenzo
Fogliano
a and
Edoardo
Capuano
*a
aFood Quality and Design Group, Wageningen University and Research, 6700AA Wageningen, The Netherlands. E-mail: edoardo.capuano@wur.nl
bDepartment of Food and Agricultural Product Technology, Faculty of Agricultural Technology, Gadjah Mada University, Jalan Flora, Bulaksumur, Depok, Sleman, Yogyakarta 55281, Indonesia
First published on 20th February 2024
Abstract
The effect of two processing methods of Jack beans (i.e. cooked bean (CB) and cooked tempeh (CT)) on the in vitro digestibility of protein and starch, as well as the production of short chain fatty acids (SCFAs), γ-aminobutyric acid (GABA), and tryptophan (Trp) metabolites after in vitro colonic fermentation, was investigated. CT was obtained by fungal fermentation after cooking under acidic conditions. CT had significantly higher protein, lower digestible starch, lower total fiber, higher free phenolic compounds, and higher ash content compared to CB. CT exhibited better in vitro protein digestibility than CB and less glucose release during in vitro digestion than CB. A comparable concentration of total SCFAs and GABA was produced after in vitro fermentation of CB and CT, but CB produced more indole than CT, resulting in higher amounts of total Trp metabolites. In summary, our findings show that tempeh fermentation improves the nutritional quality of Jack beans and describe the impact of fermentation on the digestibility of nutrients and the formation of metabolites during colonic fermentation.
1. Introduction
Underutilized pulses refer to pulses that are not globally consumed. Promoting the consumption of underutilized pulses can play a significant role in combating hunger while balancing the economy.1 The Jack bean (Canavalia ensiformis (L.) DC), an underutilized pulse, is high in protein (23–35%) and complex carbohydrates (46–65%, including fiber), minerals, and vitamins, while being low in fat (2–12%).2 This favorable nutritional profile in Jack beans, and pulses in general, is restricted by the lower protein digestibility compared to other protein-rich sources. In the pulse matrix, cell walls can physically hinder protease diffusion to proteins, lowering their digestibility.3 Moreover, the presence of antinutritional factors such as protease inhibitors can also impair protein digestion.4Solid-state fermentation (SSF) with fungal biomass has long been employed for the production of fermented foods. An attractive example of an SSF product is tempeh, a fermented product, originally from Indonesia, which is traditionally produced from soybeans. Tempeh processing involves the employment of Rhizopus sp. fungi, mainly R. oligosporus or R. oryzae, which results in the formation of a dense white mycelium that binds the soybeans together. Rhizopus mycelia grow on cooked beans and secrete a wide range of enzymes including α-amylase, esterase, cellulase, protease, and β-glucosidase.5 These enzymes produce chemical and structural changes in the beans, resulting in the production of bioactive peptides,6 improvement of flavor,7 decrease of antinutritional factors8 and modification of the cell wall observed as cell wall damage.9 Cell wall modification in kidney beans after tempeh fermentation and subsequent mastication has been reported to produce a significant increase in protein digestibility.9
There has been growing interest in fungal fermentation in the past decades. Many studies have reported the use of fungal fermentation for pulses other than soybeans, such as chickpea (Cicer arietinum), pigeon pea (Cajanus cajan), red kidney beans (Phaseolus vulgaris), Jack beans (Canavalia ensiformis), faba beans (Vicia faba), and lentils (Lens culinaris).9–12 The main focus of these studies was on the nutritional quality and the production of microbial metabolites during tempeh fermentation. A few studies have investigated the behavior of tempeh products in the gastrointestinal tract, but none in the human colonic environment.
This study aimed to compare Jack beans, cooked bean (CB) and cooked tempeh (CT), in terms of in vitro digestibility of protein and starch during small intestinal digestion of Jack beans, as well as the production of metabolites derived from colonic fermentation of non-digestible carbohydrates (i.e. SCFAs) and amino acids (i.e. Trp metabolites and GABA).
2. Materials and methods
2.1. Materials
Jack beans were harvested and purchased from a local Indonesian farmer. The beans were grown in Malang, East Java, Indonesia, and were stored in a vacuum plastic bag at room temperature upon delivery to the laboratory. All chemicals and enzymes were of analytical grade unless otherwise stated.2.2. Production of cooked bean and cooked tempeh
Whole Jack bean seeds (1000 g) were washed and soaked in demineralized water overnight (16 h, 25 °C) with a bean to soaking water ratio of 1![[thin space (1/6-em)]](https://www.rsc.org/images/entities/char_2009.gif) :3 (w:v). Half of the soaked beans were cooked in boiling demineralized water (97 °C) for 270 min with a bean to cooking water ratio of 1:2 (w:v). The cooking time was previously determined using the finger press method as described in our previous study.13 The beans were dehulled, and the cotyledons were freeze dried before being processed in a ball mill (MM400 Retsch, Germany) at a frequency of 1/30 s for 60 s. The flour was sieved to pass through a 425 μm filter and was labelled as CB. The other half of the soaked beans were dehulled and cooked in 1% lactic acid solution with a bean to cooking solution ratio of 1:2 (w:v) for 30 min at 97 °C. Acidification is one critical step that mimics natural fermentation, thus preventing the growth of spoilage bacteria and creating a favorable environment for fungal growth (pH 5.5). After cooking, the cotyledons were split and sliced into 4 pieces, slab shaped cotyledons for each cooked seed. The sliced seeds were cooked for 30 min in boiling demineralized water at a bean-to-water ratio of 1:2 (w:v). They were drained and cooled to room temperature before inoculation with the Rhizopus oligosporus starter (Raprima, Bandung) (0.2%). To create regulated aeration, the inoculated beans were placed in a perforated polypropylene plastic bag (uniformly perforated with a distance of 1.5 cm between holes) and finally incubated in a ventilated incubator oven (BF 260 Binder, Germany) at 30 °C for 48 h. The tempeh was cut into a cube shape and steamed for 10 min. It was freeze dried, milled, and sieved to pass through a 425 μm filter. The resulting sample was labelled as the CT sample. Both CB and CT were stored in a tight plastic container at room temperature until use within 8 months.
:3 (w:v). Half of the soaked beans were cooked in boiling demineralized water (97 °C) for 270 min with a bean to cooking water ratio of 1:2 (w:v). The cooking time was previously determined using the finger press method as described in our previous study.13 The beans were dehulled, and the cotyledons were freeze dried before being processed in a ball mill (MM400 Retsch, Germany) at a frequency of 1/30 s for 60 s. The flour was sieved to pass through a 425 μm filter and was labelled as CB. The other half of the soaked beans were dehulled and cooked in 1% lactic acid solution with a bean to cooking solution ratio of 1:2 (w:v) for 30 min at 97 °C. Acidification is one critical step that mimics natural fermentation, thus preventing the growth of spoilage bacteria and creating a favorable environment for fungal growth (pH 5.5). After cooking, the cotyledons were split and sliced into 4 pieces, slab shaped cotyledons for each cooked seed. The sliced seeds were cooked for 30 min in boiling demineralized water at a bean-to-water ratio of 1:2 (w:v). They were drained and cooled to room temperature before inoculation with the Rhizopus oligosporus starter (Raprima, Bandung) (0.2%). To create regulated aeration, the inoculated beans were placed in a perforated polypropylene plastic bag (uniformly perforated with a distance of 1.5 cm between holes) and finally incubated in a ventilated incubator oven (BF 260 Binder, Germany) at 30 °C for 48 h. The tempeh was cut into a cube shape and steamed for 10 min. It was freeze dried, milled, and sieved to pass through a 425 μm filter. The resulting sample was labelled as the CT sample. Both CB and CT were stored in a tight plastic container at room temperature until use within 8 months.
2.3. Compositional analysis
We dried a known amount of samples at 105 °C until constant weight for dry matter analysis and measured the crude lipid using Soxhlet extraction and nitrogen by the Dumas method. The crude protein was calculated by using a factor of 5.4.14 Fibers (soluble and insoluble) and starches (available and resistant starches) were analyzed according to the protocol from Megazyme (K-TDFR) based on AOAC 991.4315 and Megazyme (K-RSTAR) based on AOAC 2002.02,16 respectively. Free and bound phenolics were extracted17 and quantified by using the Folin–Ciocalteu method.18 The amino acid composition was measured for the raw bean, CB, and CT according to a previous report,19 except for tryptophan.20 The individual essential amino acid score was calculated by comparing the amino acid values with amino acid requirement values for humans within the age group of older children, adolescents, and adults.21 All compositional analyses, except total amino acid, were performed in triplicate and expressed on a dry weight basis.2.4. Particle size distribution (PSD)
PSD was determined for the sample flours by laser diffraction using a Mastersizer 2000 equipped with a Scirocco 2000 dry dispersion unit (Malvern Instruments, UK). A pressure of 400 kPa was used and the volume-based particle size distribution was calculated using the Fraunhofer theory, according to a previous report.222.5. In vitro gastrointestinal digestion
In vitro gastrointestinal digestion was carried out on CB and CT flours according to our previous study.13 According to the INFOGEST protocol,23,24 5 g of sample with paste-like consistency represent a physiologically realistic bolus size after dilution with the simulated digestive fluids. In our experiment, this representative bolus was achieved by mixing 2 g of CB and CT flours with 3 mL of Milli-Q water. The oral phase involved mixing 5 g of CB and CT mixture with simulated salivary fluid (SSF) without salivary α-amylase and CaCl2. The gastric phase included the addition of the simulated gastric fluid (SGF) adjusted to pH 3 with HCl, along with CaCl2 and porcine pepsin. The mixture was incubated at 37 °C for 2 h. For the intestinal phase, the pH was adjusted to 7 with NaOH. The gastric chyme was combined with simulated intestinal fluid (SIF), bile salt solution, CaCl2, porcine trypsin, and porcine pancreatic enzyme. These two enzymes are required to obtain 100 U mL−1 trypsin activity and 200 U mL−1 amylase activity in the final mixture. The volume of the final mixture was 40 mL. The mixture was incubated for another 2 h at 37 °C. Three independent tubes were taken at 6 time points at t = 0 and 120 min in the gastric phase and t = 15, 30, 60 and 120 min in the intestinal phase. The tubes were immediately placed in a boiling water bath for 10 min to stop the enzymatic reaction. An aliquot (1 mL) of the supernatant was withdrawn from each tube and stored at −20 °C until further use for starch and protein digestion analyses. A blank digestion sample was prepared by replacing the same amount of samples with Milli-Q water. Digestion experiments were run in three independent replicates for each time point.2.6. In vitro batch colonic fermentation
In vitro batch colonic fermentation was performed according to previous works with modifications.27,28 For the sample preparation, at the end of the intestinal phase (section 2.5), a centrifugation technique (at 4500g, 4 °C, for 20 min) was used instead of thermal shock to stop the enzymatic reaction. Using this technique, we were able to obtain wet pellets – on average 5.5 g and 4.2 g of CB and CT, respectively. The pellets were separated from the supernatant and stored at −20 °C until further use. Soluble fiber was recovered from the supernatant using alcohol precipitation and alcohol washing (adapting the K-TDFR protocol by Megazyme). The fiber obtained was carefully added back to the pellets maintaining the same ratio of the pooled pellet and the pooled fiber. Therefore, 10 mL of sample for colonic fermentation was prepared by dissolving 1.5 g of digested pellet CB + 0.03 g of fiber CB or 1.5 g of digested pellet CT + 0.04 g of fiber CT in sterile Milli-Q water. The sample (10 mL) was combined with 21.5 mL of sterile buffered colon medium, containing 5.22 g L−1 K2HPO4, 16.32 g L−1 KH2PO4, 2.0 g L−1 NaHCO3, 2.0 g L−1 yeast extract, 2.0 g L−1 special peptone, 1.0 g L−1 mucin, 0.5 g L−1L-cysteine HCl, and 2.0 mL L−1 Tween 80, in 120 mL sterile glass penicillin bottles. The bottles were then covered with a rubber cap and sealed with an aluminum ring, and the headspace was flushed with nitrogen by placing two needles for the air inlet and outlet, respectively. The nitrogen flushing was done for 30 min in an attempt to create an anaerobic environment as previously reported.29,30 3.5 mL of human fecal inoculum was then injected into each penicillin bottle, and fermentation was carried out for 24 h at 37 °C, with constant shaking at 100 rpm. The human fecal inoculum was prepared by combining 40 g of fresh feces with 200 mL of phosphate buffer (8.8 g L−1 K2HPO4, 6.8 g L−1 KH2PO4, and 0.1 g L−1 sodium thioglycolate). The mixture was then homogenized into a stomacher for 10 min at a speed of 300 rpm, and centrifuged for 2 min at 500g. The feces were obtained from 3 healthy donors (aged 25–35 years) who had not been treated with antibiotics for the previous 6 months, stored under anaerobiosis and used within 4 h after collection. This research did not require an ethics approval according to the guidelines of the Medical Ethical Advisory Committee of Wageningen University (METC-WU), as reported elsewhere.31 In parallel, two controls were prepared: 1. A sample control without the fecal supernatant was included to determine the release of metabolites from the food matrix. 2. A fecal control without sample addition was used to normalize the metabolite production from the fecal inoculum. All fermentation processes were repeated in duplicate. Sample tubes were taken at 0, 8, and 24 h after inoculation. The samples were immediately centrifuged at 4500g, 4 °C, for 20 min, and the supernatants and pellets were separated. An aliquot of the supernatant (5 mL) was then further centrifuged at 14000g for 5 min (4 °C), and filtered with a 0.2 μm regenerated cellulose filter (Phenomenex, Torrance, USA). The filtrate was divided into small tubes and stored at −20 °C for further analysis (i.e. SCFA, Trp metabolites, and GABA). Gas production and pH were recorded as quality control parameters using manometers and a pH meter, respectively.
:10 (w/v) according to a previous report.32 Extracts were diluted 16-fold for CB and 80-fold for CT with Milli-Q water and filtered with a 0.2 μm regenerated cellulose filter (Phenomenex, Torrance, USA). The supernatant of colonic fermentation and bean extracts were injected into targeted Trp catabolites using a Nexera XR LC-20 ADxr UPLC system coupled with a Shimadzu LCMS-8050 mass spectrometer (Shimadzu, Kyoto, Japan). Separation was done using a Kinetex® 1.7 μm EVO C18 LC column (100 × 2.1 mm) (Phenomenex, Torrance, USA). The operation conditions, recovery and matrix effect were determined according to a previous method.33 Data analysis was carried out using LabSolutions LCMS 5.6 (Shimadzu, Kyoto, Japan). Concentrations of Trp catabolites in colonic fermentation were corrected for recovery and the matrix effect and normalized by the fecal control.
:1) (v/v). 5 μL of bean extracts and colonic fermentation supernatants were injected into a Nexera XR LC-20 ADxr UPLC system coupled with a Shimadzu LCMS-8050 mass spectrometer (Shimadzu, Kyoto, Japan).35 Separation was performed using a SeQuant® 3.5 μm ZIC HILIC column (4.6 × 150 mm) (Merck, Darmstadt, Germany) equipped with a SeQuant® ZIC HILIC PEEK coated guard column (20 × 2.1 mm) (Merck, Darmstadt, Germany). The operation conditions were used with a flow rate of 0.7 mL min−1 and a column temperature of 40 °C. The mobile phases consisted of 0.1% formic acid in water (solvent A) and 0.1% formic acid in acetonitrile (solvent B). The elution program (t in min/%B) was 0.0/90; 4.0/70; 10.0/20; 13.0/20; 15.0/90 and 18.0/90. Data were processed using LabSolutions (Shimadzu Corporation, Kyoto, Japan). Calculations of recovery and the matrix effect were performed according to section 2.6.2. Data analysis was performed using LabSolutions LCMS 5.6 (Shimadzu, Kyoto, Japan). Concentrations of GABA in colonic fermentation were corrected for recovery and the matrix effect and normalized by the fecal control.
2.7. Statistical analysis
Significant differences in the compositional data, DH%, amount of digested starch per g dry matter and starch digested% were tested using a t-test (two tailed). Significant differences in the concentration of colon fermentation metabolites with fermentation times and types of processes (CB and CT) were tested using repeated measures ANOVA (two-way), followed by Tukey's post hoc analysis for comparing more than two samples or a paired test with Šidák correction for comparing the difference between two samples. GraphPad Prism 9 software was used for statistical analysis and a value of p < 0.05 was considered significant.3. Results
3.1. Compositional and structural properties of cooked Jack bean and cooked Jack bean tempeh
Table 1 shows the chemical composition of CB and CT. CT had a higher protein content (31.6%) and lower total starch (35.7%) than CB (26.6% protein; 41.3% starch). Both flours exhibited a similar resistant starch content (p > 0.05). In terms of fiber compositions, CT (16.6%) contained less insoluble fiber than CB (20.6%). The absence of soluble fiber in CT is perhaps related to the enzymatic activity from the Rhizopus fermentation process. Our finding indicates that CT has a lower carbohydrate content than CB. Furthermore, CT displayed a comparable fat content with CB and a higher ash content compared to CB. In comparison with CB, CT had a 5 times higher content of free phenolic compounds and an equivalent content of bound phenolic compounds. The total amino acid profiles of the two samples are reported in Table 2. We found a slight decrease of the amount of amino acids after cooking and after cooking + fermentation. However, this decrease does not impair the individual essential amino acid score. All of the essential amino acid scores exceed the body requirement for the age group of older children, adolescents, and adults,21 except for sulfur-containing amino acids.| Sample | Protein (N×5.4) (%db) |
Non-resistant starch (%db) | Resistant starch (%db) | Total starch (%db) | Insoluble fiber (%db) | Soluble fiber (%db) | Total fiber (%db) | Lipid (%db) | Ash (%db) | Free phenolic acid (mg GAE per g dry flour) | Bound phenolic acid (mg GAE per g dry flour) |
|---|---|---|---|---|---|---|---|---|---|---|---|
| db: % dry weight basis. Different letters in the same column indicate significant differences (p < 0.05); nd = not detected. | |||||||||||
| Cooked bean | 26.6 ± 0.1b | 41.3 ± 0.7a | 5.7 ± 0.8a | 46.9 ± 1.4a | 20.8 ± 2.1a | 2.7 ± 0.9a | 23.6 ± 1.6a | 6.8 ± 0.5a | 1.65 ± 0.01b | 2.4 ± 0.1b | 0.05 ± 0.01a |
| Cooked tempeh | 31.6 ± 0.3a | 29.6 ± 0.8b | 6.1 ± 0.6a | 35.7 ± 0.9b | 16.6 ± 0.3b | ndb | 16.6 ± 0.3b | 6.2 ± 0.8a | 1.71 ± 0.02a | 11.9 ± 0.4a | 0.06 ± 0.01a |
| Amino acids | Raw beans (g per kg protein) | Cooked beans (g per kg protein) | Cooked tempeh (g per kg protein) | Individual essential amino acid score | |
|---|---|---|---|---|---|
| Cooked beans | Cooked tempeh | ||||
| a SAAs include methionine and cysteine. b AAAs include phenylalanine, tyrosine and tryptophan. Individual amino acid scores are the ratio of amino acids of the samples compared to the established amino acid requirement values for humans within the age group of older children, adolescents, and adults.21 Measures of uncertainty are not reported because the experiment was not replicated. | |||||
| Non-essential amino acids | |||||
| Alanine | 46.8 | 44.5 | 48.8 | ||
| Arginine | 56.1 | 52.4 | 44.8 | ||
| Aspartate | 110.3 | 104.7 | 95.6 | ||
| Cysteine | 9.7 | 8.1 | 9.1 | ||
| Glutamate | 126.0 | 114.8 | 100.2 | ||
| Glycine | 40.2 | 37.3 | 34.3 | ||
| Proline | 39.8 | 39.8 | 34.1 | ||
| Serine | 55.2 | 54.9 | 46.8 | ||
| Taurine | 1.4 | 1.3 | 1.0 | ||
| Tyrosine | 39.5 | 38.5 | 39.7 | ||
| Essential amino acids | |||||
| Histidine | 101.4 | 28.1 | 30.2 | 1.8 | 1.9 |
| Isoleucine | 43.4 | 43.9 | 40.9 | 1.5 | 1.4 |
| Leucine | 82.2 | 83.1 | 71.1 | 1.4 | 1.2 |
| Lysine | 59.3 | 55.5 | 51.7 | 1.2 | 1.1 |
| Methionine | 12.5 | 12.2 | 11.7 | ||
| Phenylalanine | 47.2 | 47.6 | 43.8 | ||
| Threonine | 45.1 | 43.8 | 43.0 | 1.8 | 1.7 |
| Tryptophan | 10.1 | 11.3 | 11.3 | 1.7 | 1.7 |
| Valine | 48.6 | 49.3 | 45.9 | 1.2 | 1.1 |
| Sulfur-containing amino acids (SAAs)a | 22.2 | 20.3 | 20.8 | 0.9 | 0.9 |
| Aromatic amino acids (AAAs)b | 96.7 | 97.4 | 94.8 | 2.4 | 2.3 |
3.2. Protein and starch digestibility of cooked Jack bean and cooked Jack bean tempeh
Fig. 1 displays the PSD of CB and CT flours. CT contained a larger number of smaller particles than CB, possibly derived from the fungal mycelium. Fig. 2 reports the in vitro protein (panel A) and starch digestibility (panel B) of CB and CT, respectively. A higher concentration of free amino groups was observed at time 0 of the intestinal phase. We also observed a higher concentration of free amino groups in CT (1 mg ml−1) compared to that in CB (0.1 mg ml−1) at the beginning of the gastric phase (time 0) (data not shown). At the end of intestinal digestion, protein digestibility in CT was 4% higher than that in CB (an absolute increase), even though the difference was not statistically significant.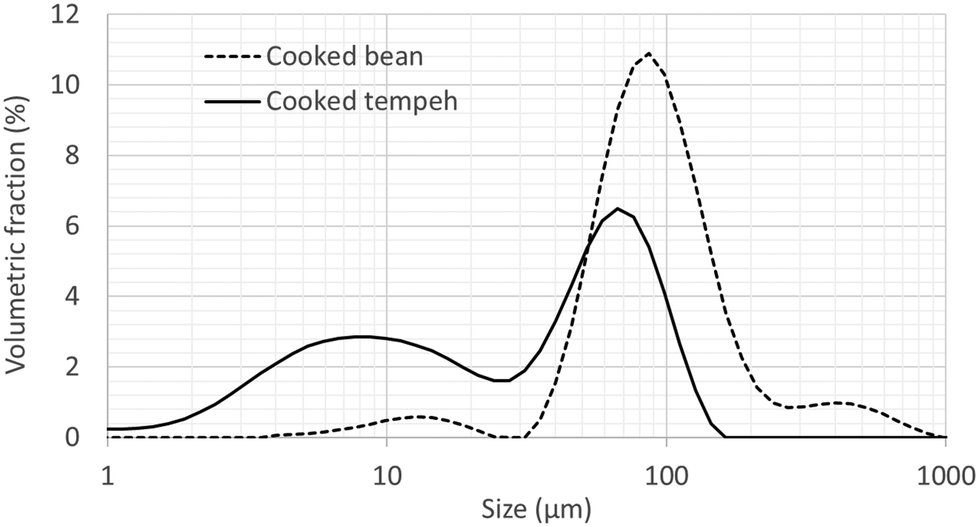 | ||
| Fig. 1 Particle size distribution of flours from cooked Jack bean (dashed line) and cooked Jack bean tempeh (full line). An averaged curve is shown for each flour (N = 3). | ||
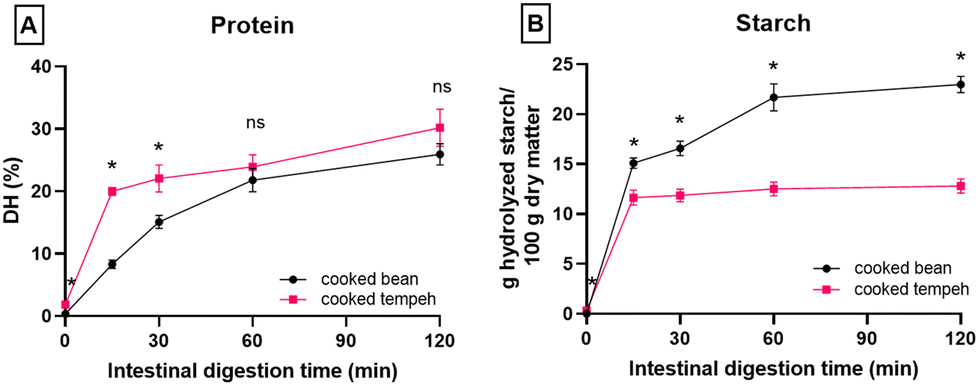 | ||
| Fig. 2 In vitro digestion of protein (A) and starch (B) of cooked Jack bean and cooked Jack bean tempeh during the intestinal phase (N = 3, mean ± standard deviations). The asterisk symbol indicates a significant difference (p < 0.05) between cooked bean and cooked tempeh at the same digestion time point. ns: no significant difference between cooked bean and cooked tempeh at the same digestion time point. | ||
Fig. 2B shows that starch is rapidly hydrolyzed by amylase during the 15 min of intestinal digestion. A gradual increase of starch hydrolysis was observed in CB but not in CT. In CT, the starch digestion remained stable after 15 min until the end of intestinal digestion. The starch digestion behavior suggests that the available starch in CT is completely digested.
3.3. Metabolite production during in vitro colonic fermentation of cooked Jack bean and cooked Jack bean tempeh
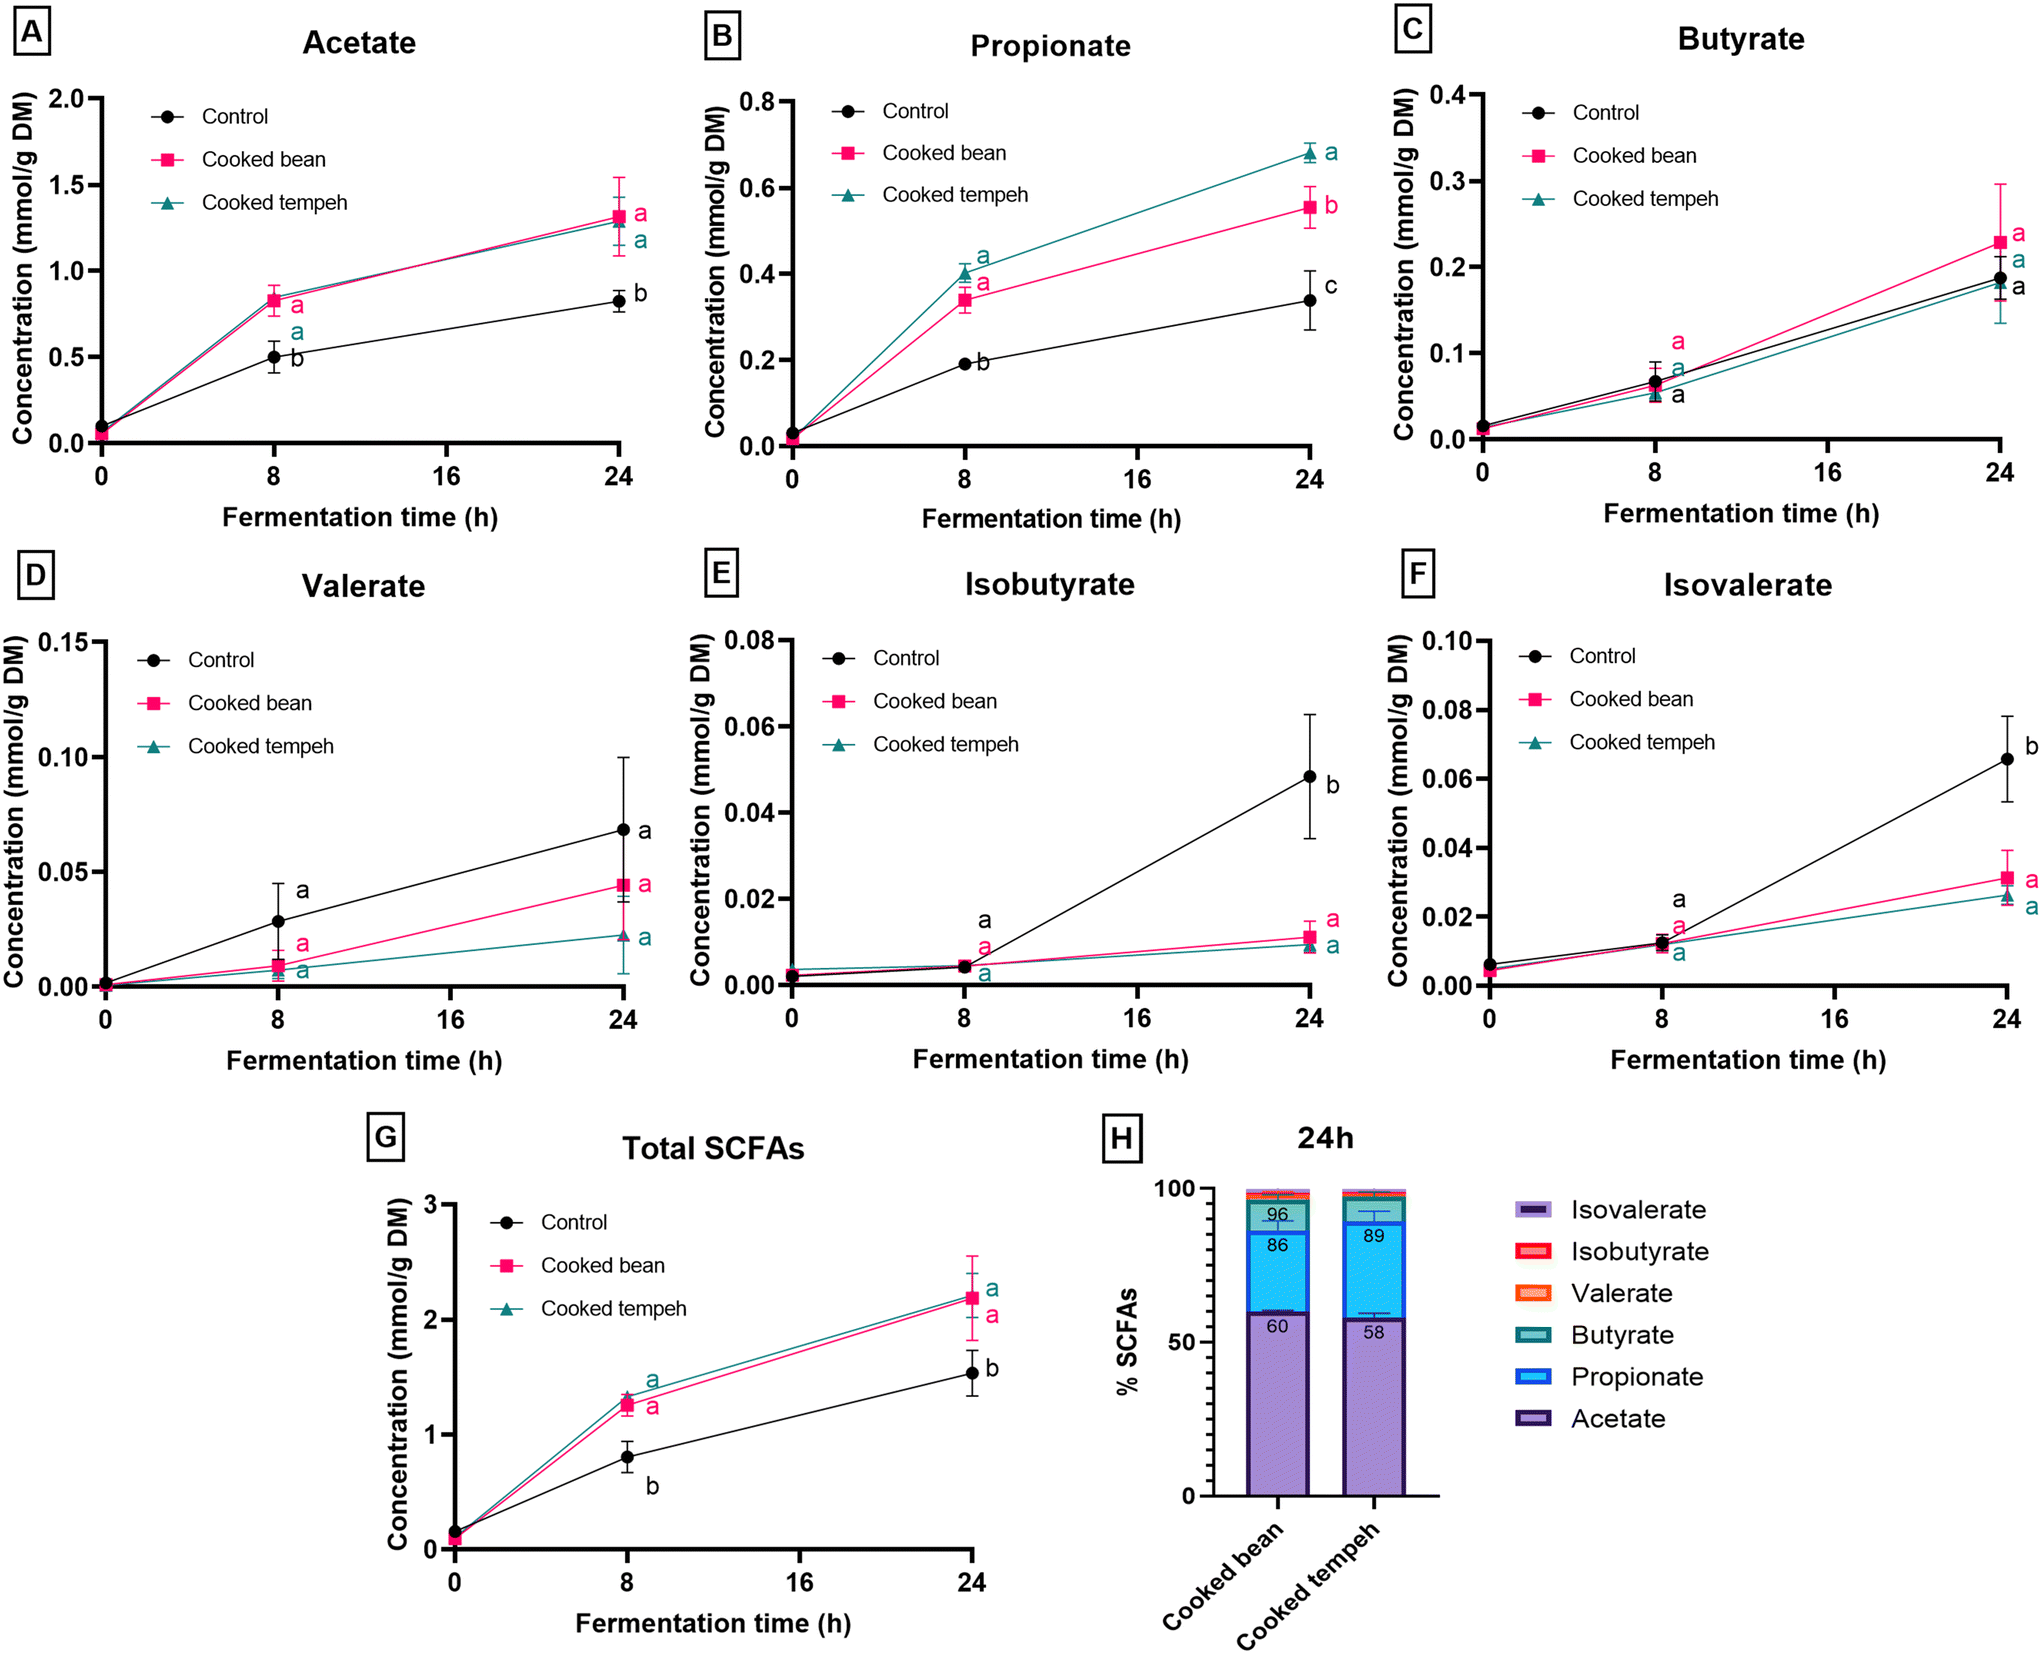 | ||
| Fig. 3 SCFAs (A–F), total SCFAs (G), and relative contribution of individual SCFAs (H) of cooked Jack bean and cooked Jack bean tempeh during in vitro colon fermentation with human inoculums. Control samples consist of inoculums and a buffer without the addition of bean samples (A–G) (N = 3, mean values with error bars that indicate the standard error of the mean). Different letters indicate a significant difference (p < 0.05) between cooked bean, cooked tempeh, and control samples at the same colonic fermentation time point. | ||
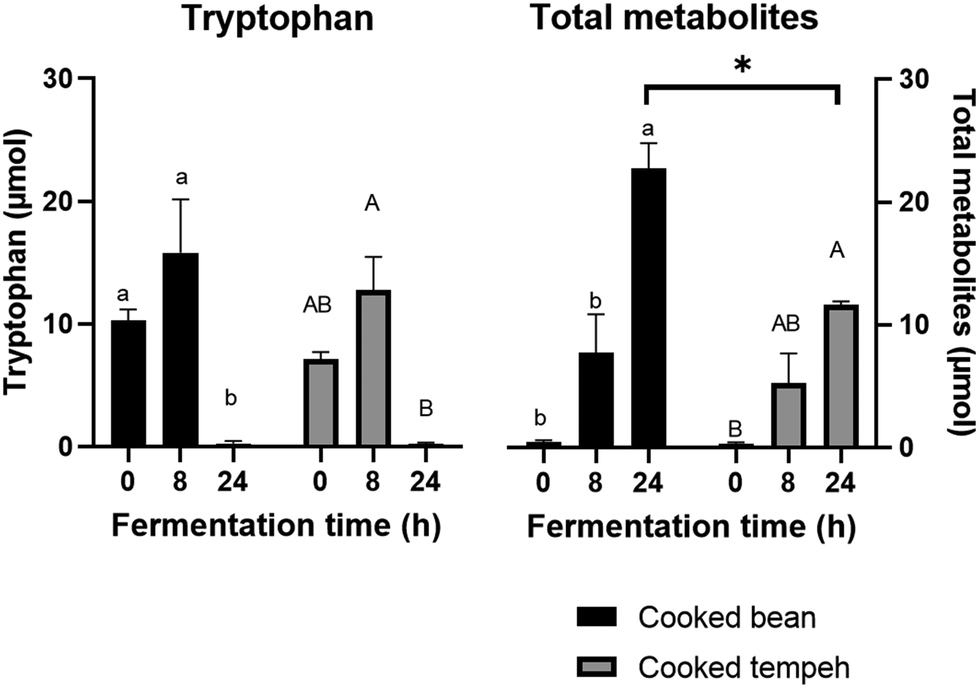 | ||
| Fig. 4 Tryptophan and total metabolites released during in vitro colonic fermentation of cooked Jack bean and cooked Jack bean tempeh. Different lowercase and uppercase letters indicate significant differences within the same sample for cooked Jack bean and cooked Jack bean tempeh, respectively. The asterisk symbol indicates a significant difference (p < 0.05) between cooked bean and cooked tempeh at the same fermentation time (N = 3, mean with error bars that indicate the standard error of the mean). | ||
Production of individual Trp metabolites namely indole, IAA, ILA, IPA, I3A, TA, Kyn, and Oxi is displayed in Fig. 5. Almost all Trp metabolites formed during fermentation and reached the highest concentration at the end of fermentation, except ILA. ILA, as an intermediate compound, showed an increase and later a decrease during colonic fermentation (p < 0.05). Trp was mostly converted into indole, accounting for approximately 95.7% and 94.6% of total metabolites from CB and CT, respectively (Table S4†). Lower formation of indole, IAA, and IPA was found in CT than in CB at 24 h of colonic fermentation (p < 0.05).
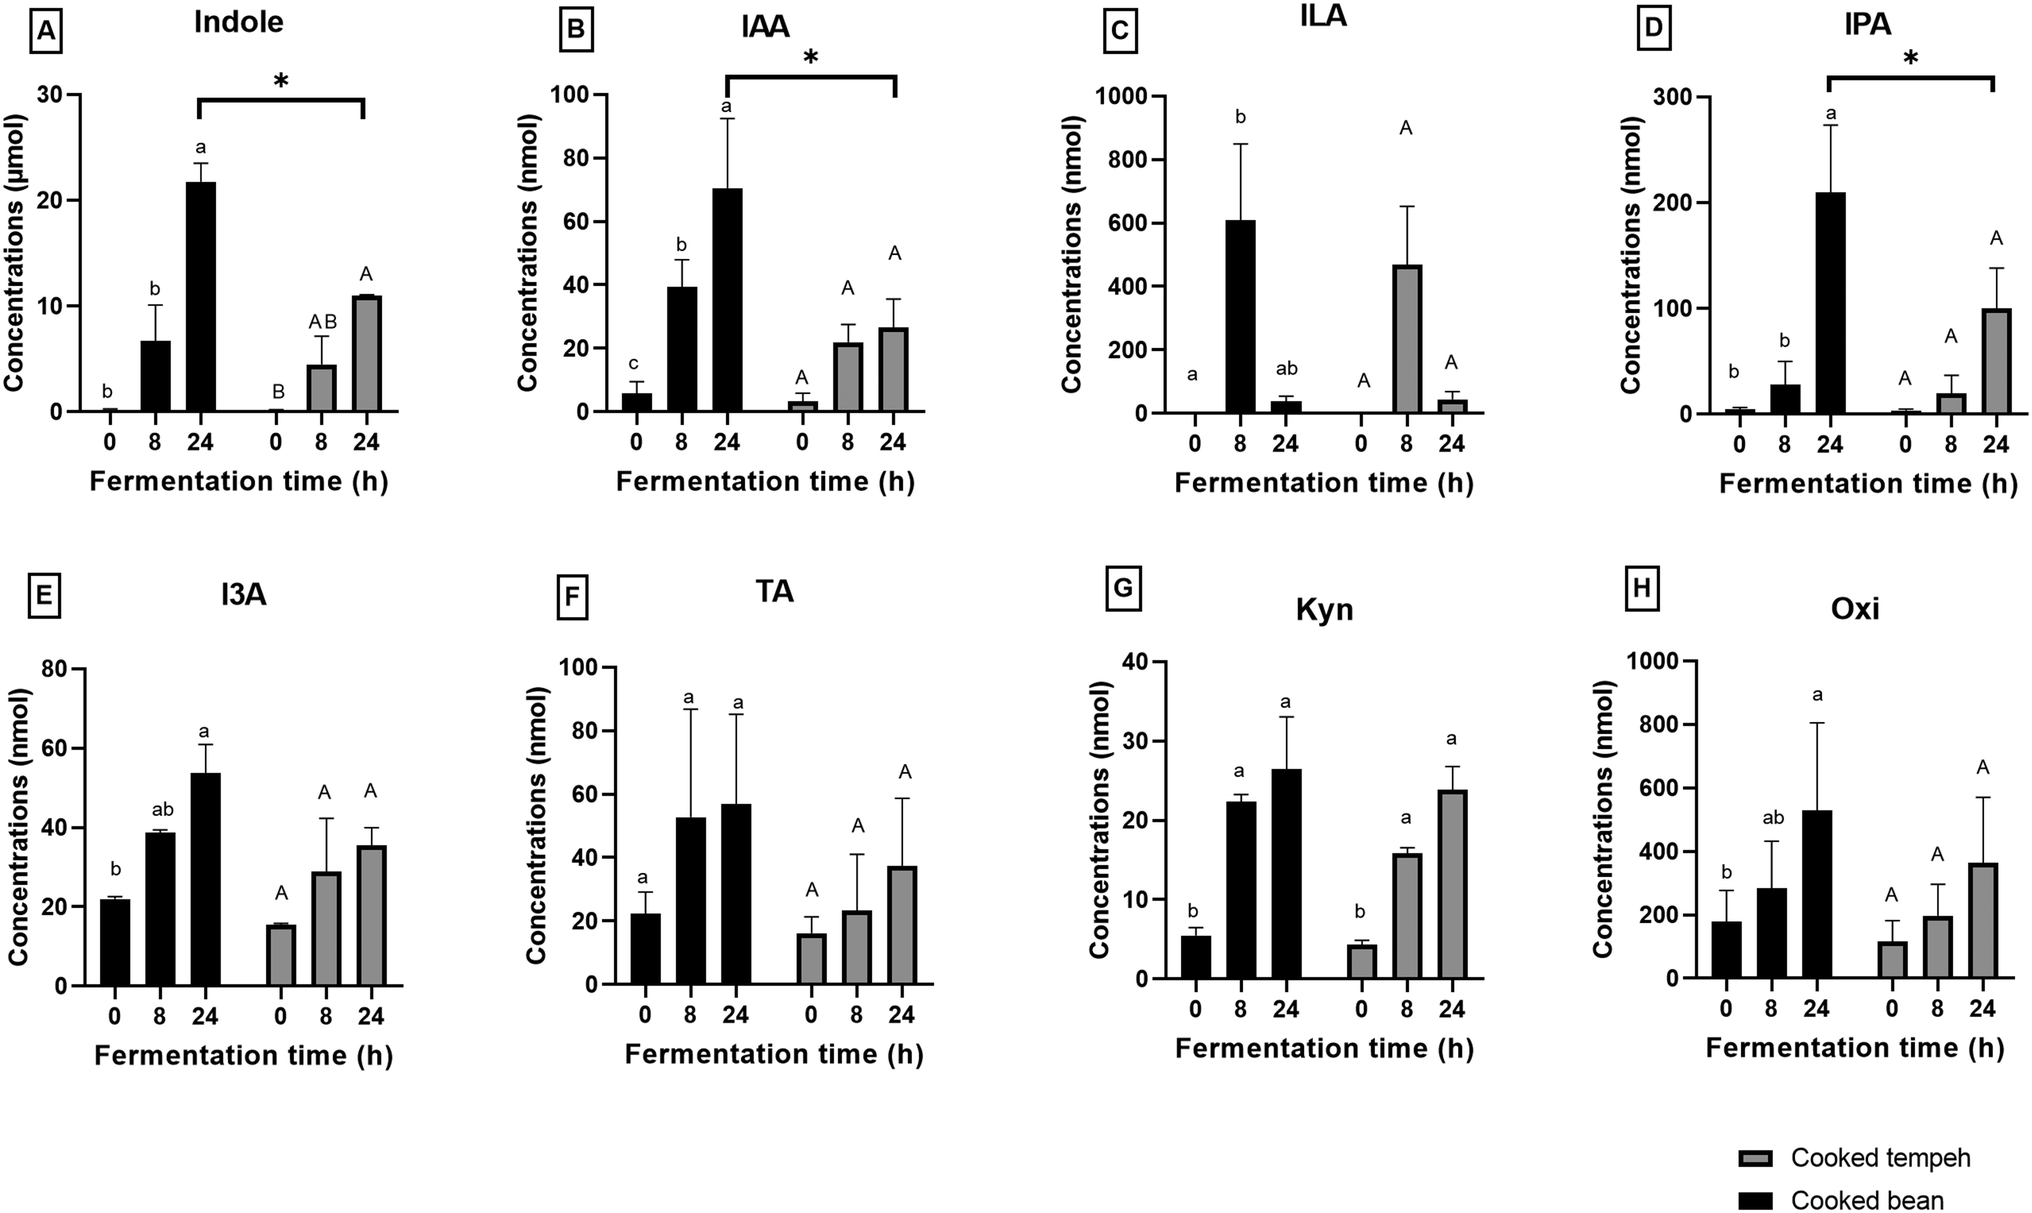 | ||
| Fig. 5 Tryptophan metabolites (A–H) produced during in vitro colonic fermentation of cooked Jack bean and cooked Jack bean tempeh. Different lowercase and uppercase letters indicate significant differences within the same sample for cooked Jack bean and cooked Jack bean tempeh (p < 0.05). The asterisk symbol indicates a significant difference (p < 0.05) between cooked bean and cooked tempeh within the same fermentation time (N = 3, mean with error bars that indicate the standard error of the mean). IAA: indole-3-acetic acid, ILA: indole-3-lactic acid, IPA: 3-indolepropionic acid, I3A: indole-3-aldehyde, TA: tryptamine, Kyn: kynurenine, and Oxi: oxindole. | ||
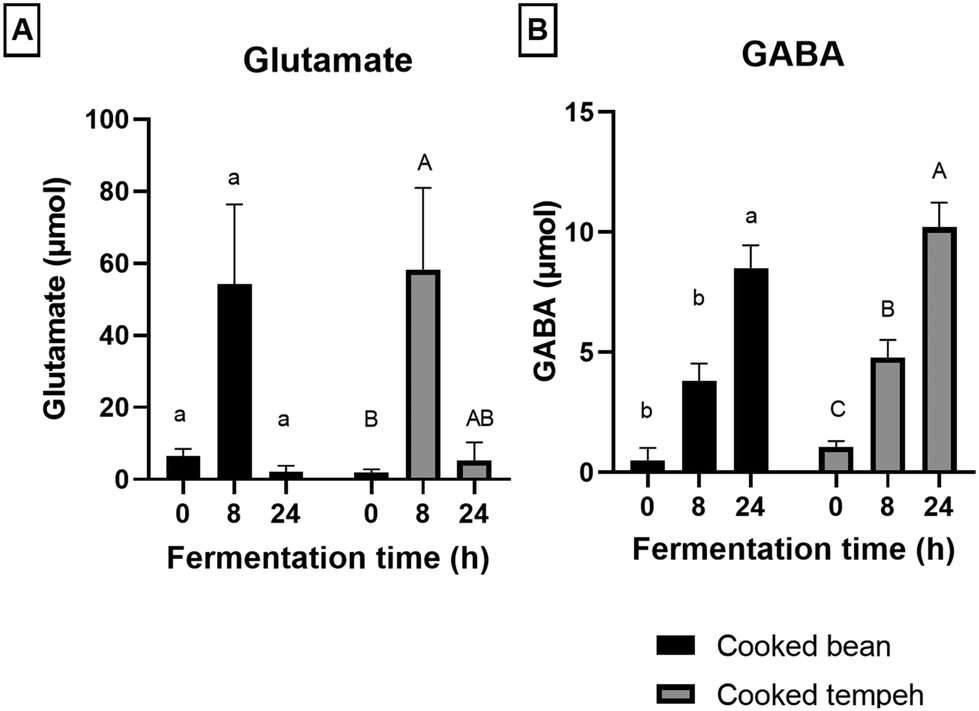 | ||
| Fig. 6 Glutamate (A) and GABA (B) produced during in vitro colonic fermentation of cooked Jack bean and cooked Jack bean tempeh. Different lowercase and uppercase letters indicate significant differences (p < 0.05) within the same sample for cooked Jack bean and cooked Jack bean tempeh, respectively. The asterisk symbol indicates a significant difference (p < 0.05) between cooked bean and cooked tempeh within the same fermentation time (N = 3, mean with error bars that indicate the standard error of the mean). | ||
4. Discussion
Rhizopus fermentation has been reported to facilitate chemical and structural changes in the food being fermented, which may further impact nutrient bioavailability and the production of microbial metabolites in the large intestine.5,36 In the present study, we compared the nutritional quality as well as the digestibility and fermentability of Jack bean tempeh with those of cooked bean, as an example of a commonly used domestic preparation. We observed several compositional differences between CB and CT (Table 1). In line with previous reports on chickpea, pigeon pea, and soybean,12 we found a higher concentration of protein in CT than in CB. This can be due to the development of the fungal biomass richer in proteins compared to the bean. Pure biomass of Rhizopus oryzae might contain protein as much as 50.6% per dry biomass.37 It is predicted that 5.9% (dry weight basis) of tempeh consists of fungal biomass.38 The growth of fungal biomass requires the utilization of starch as a carbon source, which may explain the lower total starch content in CT compared to that in CB. Lower starch content was also reported in fermented grains due to the activity of microbial enzymes.39 In another study, a decrease in monosaccharides and disaccharides was also found after Rhizopus fermentation.5 The total fiber was lower in CT than in CB. During fermentation, fungal enzymes (e.g. pectinase and xylanase) may have partly hydrolyzed insoluble fiber into soluble fiber, leading to their loss by leaching during the subsequent cooking process. Another possible explanation for the lower concentration of fiber in CT may be the utilization of a part of the fibers for fungal growth. Fungal carbohydrases will break down the polymer of the fiber, releasing sugar monomers. Glucose, fructose, galactose, maltose, and xylose have been reported to be excellent carbon sources for Rhizopus oligosporus growth.40 We found similar lipid values but a higher ash content in CT than in CB. This showed that tempeh processed material is able to retain more minerals than CB. The concentration of free phenolics is higher in CT than in CB. Phenolic compounds mostly occur in insoluble forms which are covalently bound to structural components of the cell wall.41 Fungal cell wall degrading enzymes may not only release a part of the insoluble fiber but also some phenolics in the fermented bean. In our study, however, tempeh processing retained the free phenolics better than that of the cooked bean. The duration of cooking applied for preparing cooked beans may lead to leaching of the part of free phenolics, producing larger losses in CB. In addition, CT showed a rather small change in the amino acid composition compared to raw beans than CB. From the data presented in Table 2, it appears that Jack bean proteins are of good quality, with a balanced content of essential amino acids, and this content is preserved after preparation. However, to conclude on the quality of Jack bean proteins, the true ileum digestibility of each single essential amino acid must be assessed, which has not been done yet.A higher degree of protein digestion was observed in CT compared to that in CB at the start of the gastric phase, indicating that the protein had been pre-digested during tempeh fermentation, as well as at the start of the intestinal phase (Fig. 2A). A previous study reported on the hydrolysis of legume proteins into small soluble proteins, peptides or amino acids, confirmed by the disappearance of high molecular weight polymers, which correlated with the protease activity during tempeh fermentation with Rhizopus oligosporus.5 A recent microscopy study reported the disappearance of protein, especially in the cells surrounded by mycelia.9 In our study, a small increase in protein digestibility by 4% (an absolute increase) at the end of the intestinal phase was observed. A small increase in protein digestibility (∼3% absolute increase) was also observed in a previous study.42 Even more importantly, since CT contains more proteins on a dry basis than CB, consuming the same weight of the dry matter of the two samples would result in a bigger difference in the amount of amino groups released from the matrix from CT than from CB (i.e. based on the mg L-serine released per ml digestive supernatant, Fig. S1†). Overall, the higher degree of protein digestion observed in CT than in CB can possibly be attributed to several factors: a higher degree of cell wall permeability of the bean cells, a lower level of protein aggregation, a higher fraction of smaller particle size providing a greater surface area for enzymatic attack, and a lower barrier effect of the fungal cell wall. During the fermentation process of tempeh, fungi secreted a mix of cell wall degrading enzymes which contributed to the disruption of the cell wall integrity,9 facilitating protein digestion. Prolonged heat treatment (CB: 270 min; CT: 70 min) could promote protein aggregation, which hinders protease attack during intestinal digestion.4 On the other hand, the fungal cell wall of Fusarium venenatum was reported to be a less effective barrier to proteases than plant cell walls.43 Finally, in CT, a fraction of small particles occurs, which most likely correspond to mycelium particles (Fig. 1) and the smaller particles may have offered less resistance to protease penetration.
We observed a higher amount of digested starch per g dry matter at time 0 of the intestinal phase, which indicates starch hydrolysis during tempeh fermentation (Fig. 2B). No lag phase was observed at the beginning of the intestinal phase, with starch rapidly digested in both CB and CT flours. This is different from a previous study on Jack bean intact cells, which demonstrated that in vitro starch digestion followed a logistic model with a lag phase at the beginning of intestinal digestion.13 This discrepancy is most likely due to the use of flour which included a certain fraction of free starch granules (i.e. not encapsulated into intact cells), allowing for rapid starch digestion during the initial phase of starch digestion. We observed that the amount of starch digested was smaller at the end of the intestinal phase for CT compared to CB, meaning that the same amount of dry matter from the two prepared samples was expected to produce a lower post-prandial blood glucose peak from CT. CT's starch was digested completely at 15 min of intestinal digestion but the final amount of starch digested was lower compared to that of CB. The lower amount of starch digestion in CT than in CB may be due to the lower starch content in CT. Yet, if the %starch digested is calculated (i.e. the amount of digested starch is divided by the initial amount of starch, Table S1†), CT showed lower digestibility than CB at the end of intestinal digestion. This observation deserves further investigation in terms of the structural properties of starch after tempeh fermentation. Taken together, our data indicate that fungal fermentation can increase protein digestibility while reducing the glycemic load, and thus it would be particularly beneficial from the nutritional perspective. At the end of intestinal digestion, we found that fewer pellets remained in CT compared to those in CB (data not shown), indicating a greater digestion/solubilization of matter in CT.
Non-digestible carbohydrates that escape gastrointestinal digestion are mainly converted into SCFAs by the gut microbiota. Dietary fiber has been reported to affect the microbial diversity and contribute to metabolite formation in the gut, primarily through SCFAs.44 The most abundant SCFA produced during colonic fermentation was acetate, followed by propionate and butyrate (Fig. 3A–C), in line with a prior study in kidney beans.45 Notably, a higher concentration of propionate was found after in vitro fermentation of digested CT compared to that of CB. One of the mechanisms for propionate production is via the acrylate pathway, using lactate as a substrate.46 Hence, one possible explanation may be the presence of residual lactic acid in the CT matrix (lactic acid was used in one of the cooking steps during tempeh preparation), which was not metabolized by Rhizopus and not solubilized after gastrointestinal digestion. Another explanation may be the different types of fibers in CT that can modulate the microbial ecology (i.e. composition and activity), resulting in differences in the concentration of metabolites, including propionate.47 At the end of colonic fermentation, a higher concentration of butyrate was formed compared to the control (Table S2†). In contrast, fermentation of CT produced less butyrate than the control, and no statistically significant difference was observed between CB and CT. The colonic fermentation involved the use of similar amounts of fibers for CT and CB (CB: 0.12 g of fiber, CT: 0.11 g of fiber). Therefore, we could expect the production of similar SCFAs (Fig. 3G).
When fermentable fibers are limited, the gut microbiota uses less energy-efficient sources for growth, such as amino acids from dietary or endogenous proteins. Most of the ingested dietary proteins are digested and absorbed in the small intestine; however, a significant amount of proteins may still enter the colon and be metabolized by the gut microbiota.48 In this study, a lower content of undigested protein was found in the pellet after the digestion of CT (i.e. fewer proteins were exposed to the gut microbiota, CB: 0.21 g of protein; CT: 0.18 g of protein). The lower protein digestion in CB in the small intestine suggests that it would deliver more undigested proteins in the gut than CT. We found that the starting material of CT contains higher free Trp and glutamate, than the CB flour (Table S3†), which is in line with the protease activity of Rhizopus. A unique product of protein fermentation is branched-short chain fatty acids (BCFAs) such as isobutyrate, isovalerate and 2-methylbutyrate, which are derived from branched-chain amino acids (valine, leucine and isoleucine).49 The production of branched-chain amino acids was suppressed in our study by the addition of the digested pellet of Jack bean (Table S2†). This may be due to the presence of extra fermentable carbohydrates from the digested bean that may have suppressed protein fermentation.
During colonic fermentation, Trp and glutamate were released from undigested proteins and further metabolized by the gut microbiota, producing indole derivatives and GABA, respectively, and hence a bell-shaped curve was observed, as shown in Fig. 4 and 6. This is in line with another study on soybean cells.30 Trp metabolites play a significant role as endogenous ligands for the aryl hydrocarbon receptor (AhR), impacting host immune homeostasis and barrier physiology.50,51 In addition, IPA, particularly in the presence of indole, has been identified as a ligand of the pregnane X receptor (PXR), regulating the intestinal barrier function.52 On a different note, GABA is produced from glutamate and serves as an important inhibitory neurotransmitter in the nervous system, primarily involved in modulating responses to anxiety.53 Interestingly, we also found higher levels of GABA in CT compared to those in CB which may point to its production from glutamate during fermentation already.
We found that CB produced more Trp metabolites than CT (Fig. 4) with significant differences in the concentrations of indole, IAA, and IPA (Fig. 5). The most likely explanation may be the lower protein load in the CT pellets compared to that in CB in the fermentation system. However, even after normalization of the values per g protein (Fig. S2 and S3†), we could still observe the formation of lower amounts of Trp metabolites in the CT samples, as indicated by indole, the most abundant Trp metabolite formed during colonic fermentation (Table S4†). Other factors may also have an influence on the Trp metabolites such as the fiber content and the integrity of the plant matrix. A high-fiber diet promotes the production of certain Trp metabolites such as IAA, ILA, IPA, I3A, IA, and 5-HT, while a high-protein diet favors the production of TA, Kyn, Ind, and Oxi.54 However, since the two pellets contain a similar amount of fiber, it is unlikely that the concentration of fiber may have influenced the formation of Trp metabolites. The integrity of the plant matrix, specifically of the cell wall, influences microbial catabolism by affecting the accessibility of Trp to the microbiota.30 Nevertheless, it remains uncertain whether the integrity of the bean cell wall was altered during Rhizopus fermentation, and on the other hand, the fungal cell wall may be more accessible to the microbiota enzymes. This aspect requires further investigation. Unlike indole, we found that GABA production was similar in CB and CT (Fig. 6).
5. Conclusion
In conclusion, our study showed that fungal fermentation significantly affects the nutritional quality of Jack beans, resulting in improved protein digestibility compared to that with cooked beans, while at the same time reducing the amount of digestible starch and limiting starch digestion as well as better preservation of phenolic compounds. Processing into tempeh did not affect the concentrations of SCFAs and GABA produced during in vitro fermentation but reduced the production of Trp metabolites. This work provides evidence that fungal fermentation is a useful strategy for individuals with certain dietary requirements, since it improves protein quality, and potentially controls blood sugar levels, without compromising the production of beneficial gut microbial metabolites such as SCFAs and GABA.Author contributions
Fiametta Ayu Purwandari: conceptualization, methodology, formal analysis, investigation, data curation, writing – original draft, and writing – review & editing. Vincenzo Fogliano: conceptualization, writing – review & editing, visualization, supervision, and project administration. Edoardo Capuano: conceptualization, methodology, visualization, supervision, writing – review & editing, project administration, and resources.Conflicts of interest
The authors declare that there are no conflicts of interest.Acknowledgements
We thank Christos Fryganas and Geert Meijer for their help with LC-MS and GC-FID analyses. This work was financially supported by the Indonesia Endowment Fund for Education (LPDP) (S-682/LPDP.4/2019).References
- S. P. Nayak, R. A. Lone, S. Fakhrah, A. Chauhan, K. Sarvendra and C. S. Mohanty, in Future Foods: Global Trends, Opportunities, and Sustainability Challenges, ed. R. Bhat, Academic Press, London, 2021 Search PubMed.
- K. R. Sridhar and S. Seena, Nutritional and antinutritional significance of four unconventional legumes of the genus Canavalia - A comparative study, Food Chem., 2006, 99, 267–288 CrossRef CAS.
- A. M. Rovalino-Córdova, V. Fogliano and E. Capuano, The effect of cell wall encapsulation on macronutrients digestion: A case study in kidney beans, Food Chem., 2019, 286, 557–566 CrossRef PubMed.
- M. Zahir, V. Fogliano and E. Capuano, Soybean germination limits the role of cell wall integrity in controlling protein physicochemical changes during cooking and improves protein digestibility, Food Res. Int., 2021, 143, 1–9 CrossRef PubMed.
- Y. Zhang, R. Wei, F. Azi, L. Jiao, H. Wang, T. He, X. Liu, R. Wang and B. Lu, Solid-state fermentation with Rhizopus oligosporus RT-3 enhanced the nutritional properties of soybeans, Front. Nutr., 2022, 9, 1–14 Search PubMed.
- B. Tamam, D. Syah, M. T. Suhartono, W. A. Kusuma, S. Tachibana and H. N. Lioe, Proteomic study of bioactive peptides from tempe, J. Biosci. Bioeng., 2019, 128, 241–248 CrossRef CAS PubMed.
- M. B. N. Prativi, D. I. Astuti, S. P. Putri, W. A. Laviña, E. Fukusaki and P. Aditiawati, Metabolite changes in Indonesian tempe production from raw soybeans to over-fermented tempe, Metabolites, 2023, 13, 1–16 CrossRef PubMed.
- G. I. Harry, Changes components in selected chemical and antinutritional during tempeh preparation using fresh and hardened common beans, J. Food Sci., 1989, 54, 968–970 CrossRef.
- W. Sun, J. He, H. Wang, Q. Zhang, W. Li and X. Rui, Solid-state fermentation alters the fate of red kidney bean protein during buccal and gastrointestinal digestion: Relationship with cotyledon cell wall integrity, Food Chem., 2023, 410, 1–10 Search PubMed.
- E. Puspitojati, M. N. Cahyanto, Y. Marsono and R. Indrati, Changes in amino acid composition during fermentation and its effects on the inhibitory activity of angiotensin-i-converting enzyme of jack bean tempe following in vitro gastrointestinal digestion, J. Food Nutr. Res., 2019, 58, 319–327 CAS.
- K. Polanowska, A. Grygier, M. Kuligowski, M. Rudzińska and J. Nowak, Effect of tempe fermentation by three different strains of Rhizopus oligosporus on nutritional characteristics of faba beans, LWT–Food Sci. Technol., 2020, 122, 1–9 CrossRef.
- B. S. Toor, A. Kaur and J. Kaur, Fermentation of legumes with Rhizopus oligosporus: effect on physicochemical, functional and microstructural properties, Int. J. Food Sci. Technol., 2022, 57, 1763–1772 CrossRef CAS.
- F. A. Purwandari, C. Westerbos, K. Lee, V. Fogliano and E. Capuano, Proximate composition, microstructure, and protein and starch digestibility of seven collections of Jack bean (Canavalia ensiformis) with different optimal cooking times, Food Res. Int., 2023, 170, 1–9 CrossRef PubMed.
- F. Mariotti, D. Tomé and P. P. Mirand, Converting nitrogen into protein - Beyond 6.25 and Jones’ factors, Crit. Rev. Food Sci. Nutr., 2008, 48, 177–184 CrossRef CAS PubMed.
- S. C. Lee, L. Prosky and J. W. De Vries, Determination of total, soluble, and insoluble dietary fiber in foods—Enzymatic-gravimetric method, MES-TRIS buffer: collaborative study, J. AOAC Int., 1992, 75, 395–416 CrossRef CAS.
- B. V. Mccleary and D. A. Monaghan, Measurement of resistant starch, J. AOAC Int., 2002, 85, 665 CrossRef CAS PubMed.
- M. Zavala-López and S. García-Lara, An improved microscale method for extraction of phenolic acids from maize, Plant Methods, 2017, 13, 1–11 CrossRef PubMed.
- D. A. Urias-Lugo, J. B. Heredia, J. B. Valdez-Torres, M. D. Muy-Rangel, S. O. Serna-Saldivar and S. García-Lara, Physical properties and chemical characterization of macro- and micro-nutriments of elite blue maize hybrids (Zea mays L.), Cereal Res. Commun., 2015, 43, 295–306 CrossRef CAS.
- M. L. Elling-Staats, A. K. Kies, M. S. Gilbert and R. P. Kwakkel, Over-toasting dehulled rapeseed meal and soybean meal, but not sunflower seed meal, increases prececal nitrogen and amino acid digesta flows in broilers, Poult. Sci., 2022, 101, 1–11 Search PubMed.
- ISO, 13904 Animal feeding stuffs—Determination of tryptophan content, ISO, Geneva, 2005 Search PubMed.
- FAO, Dietary protein quality evaluation in human nutrition, FAO, Rome, 2013 Search PubMed.
- P. J. M. Pelgrom, J. A. M. Berghout, A. J. van der Goot, R. M. Boom and M. A. I. Schutyser, Preparation of functional lupine protein fractions by dry separation, LWT–Food Sci. Technol., 2014, 59, 680–688 CrossRef CAS.
- A. Brodkorb, L. Egger, M. Alminger, P. Alvito, R. Assunção, S. Ballance, T. Bohn, C. Bourlieu-Lacanal, R. Boutrou, F. Carrière, A. Clemente, M. Corredig, D. Dupont, C. Dufour, C. Edwards, M. Golding, S. Karakaya, B. Kirkhus, S. Le Feunteun, U. Lesmes, A. Macierzanka, A. R. Mackie, C. Martins, S. Marze, D. J. McClements, O. Menard, M. Minekus, R. Portmann, C. N. Santos, I. Souchon, R. P. Singh, G. E. Vegaryd, M. S. J. Wickham, W. Weitschies and I. Recio, INFOGEST static in vitro simulation of gastrointestinal food digestion, Nat. Protoc., 2019, 14, 991–1014 CrossRef CAS PubMed.
- M. Minekus, M. Alminger, P. Alvito, S. Ballance, T. Bohn, C. Bourlieu, F. Carrière, R. Boutrou, M. Corredig, D. Dupont, C. Dufour, L. Egger, M. Golding, S. Karakaya, B. Kirkhus, S. Le Feunteun, U. Lesmes, A. MacIerzanka, A. MacKie, S. Marze, D. J. McClements, O. Ménard, I. Recio, C. N. Santos, R. P. Singh, G. E. Vegarud, M. S. J. Wickham, W. Weitschies and A. Brodkorb, A standardised static in vitro digestion method suitable for food-an international consensus, Food Funct., 2014, 5, 1113–1124 RSC.
- A. I. Mulet-Cabero, N. M. Rigby, A. Brodkorb and A. R. Mackie, Dairy food structures influence the rates of nutrient digestion through different in vitro gastric behaviour, Food hydrocolloids, 2017, 67, 63–73 CrossRef CAS.
- M. Zahir, V. Fogliano and E. Capuano, Food matrix and processing modulate: In vitro protein digestibility in soybeans, Food Funct., 2018, 9, 6326–6336 RSC.
- R. T. Boachie, E. Capuano, T. Oliviero, C. C. Udenigwe and V. Fogliano, Undigested glycated lentil proteins modulate the gut microbiota profile but not the metabolites in vitro, J. Funct. Foods, 2023, 107, 1–11 Search PubMed.
- S. Pérez-Burillo, S. Molino, B. Navajas-Porras, Á. J. Valverde-Moya, D. Hinojosa-Nogueira, A. López-Maldonado, S. Pastoriza and J. Á. Rufián-Henares, An in vitro batch fermentation protocol for studying the contribution of food to gut microbiota composition and functionality, Nat. Protoc., 2021, 16, 3186–3209 CrossRef PubMed.
- B. Guo, T. Oliviero, V. Fogliano, Y. Ma, F. Chen and E. Capuano, Gastrointestinal bioaccessibility and colonic fermentation of fucoxanthin from the extract of the microalga Nitzschia laevis, J. Agric. Food Chem., 2020, 68, 1844–1850 CrossRef CAS PubMed.
- Z. Huang, T. Schoones, J. M. Wells, V. Fogliano and E. Capuano, Substrate-driven differences in tryptophan catabolism by gut microbiota and aryl hydrocarbon receptor activation, Mol. Nutr. Food Res., 2021, 65, 1–9 CrossRef PubMed.
- Z. Huyan, N. Pellegrini, W. Steegenga and E. Capuano, Insights into gut microbiota metabolism of dietary lipids: the case of linoleic acid, Food Funct., 2022, 13, 4513–4526 RSC.
- Z. Huang, S. de Vries, V. Fogliano, J. M. Wells, N. van der Wielen and E. Capuano, Effect of whole foods on the microbial production of tryptophan-derived aryl hydrocarbon receptor agonists in growing pigs, Food Chem., 2023, 416, 1–10 Search PubMed.
- Z. Huang, J. Boekhorst, V. Fogliano, E. Capuano and J. M. Wells, Distinct effects of fiber and colon segment on microbiota-derived indoles and short-chain fatty acids, Food Chem., 2022, 398, 1–8 Search PubMed.
- P. H. Le, L. Verscheure, T. T. Le, Y. Verheust and K. Raes, Implementation of HPLC Analysis for γ-Aminobutyric Acid (GABA) in Fermented Food Matrices, Food Anal. Methods, 2020, 13, 1190–1201 CrossRef.
- M. Casertano, C. Fryganas, V. Valentino, A. D. Troise, P. Vitaglione, V. Fogliano and D. Ercolini, Gut production of GABA by a probiotic formula: an in vitro study, Benefic. Microbes, 2024, 1–15 Search PubMed.
- Y. Yang, T. Kameda, H. Aoki, D. E. Nirmagustina, A. Iwamoto, N. Kato, N. Yanaka, Y. Okazaki and T. Kumrungsee, The effects of tempe fermented with Rhizopus microsporus, Rhizopus oryzae, or Rhizopus stolonifer on the colonic luminal environment in rats, J. Funct. Foods, 2018, 49, 162–167 CrossRef CAS.
- S. Karimi, N. M. Soofiani, A. Mahboubi, J. A. Ferreira, T. Lundh, A. Kiessling and M. J. Taherzadeh, Evaluation of nutritional composition of pure filamentous fungal biomass as a novel ingredient for fish feed, Fermentation, 2021, 7, 1–14 CrossRef.
- R. M. J. Nout, in Food Mycology A Multifaceted Approach to Fungi and Food, ed. J. Dijksterhuis and R. A. Samson, CRC Press, Boca Raton, 2007 Search PubMed.
- M. Ilowefah, J. Bakar, H. M. Ghazali, A. Mediani and K. Muhammad, Physicochemical and functional properties of yeast fermented brown rice flour, J. Food Sci. Technol., 2015, 52, 5534–5545 CrossRef CAS PubMed.
- W. G. Sorenson and C. W. Hesseltine, Carbon and nitrogen utilization by Rhizopus Oligosporus, Mycologia, 1966, 58, 681–689 CrossRef CAS PubMed.
- B. A. Acosta-Estrada, J. A. Gutiérrez-Uribe and S. O. Serna-Saldívar, Bound phenolics in foods, a review, Food Chem., 2014, 152, 46–55 CrossRef CAS PubMed.
- M. J. R. Nout and J. L. Kiers, Tempe fermentation, innovation and functionality: Update into the third millenium, J. Appl. Microbiol., 2005, 98, 789–805 CrossRef CAS PubMed.
- R. Colosimo, A. I. Mulet-Cabero, F. J. Warren, C. H. Edwards, T. J. A. Finnigan and P. J. Wilde, Mycoprotein ingredient structure reduces lipolysis and binds bile salts during simulated gastrointestinal digestion, Food Funct., 2020, 11, 10896–10906 RSC.
- D. J. Morrison and T. Preston, Formation of short chain fatty acids by the gut microbiota and their impact on human metabolism, Gut Microbes, 2016, 7, 189–200 CrossRef PubMed.
- A. M. Rovalino-Córdova, V. Fogliano and E. Capuano, In vitro colonic fermentation of red kidney beans depends on cotyledon cells integrity and microbiota adaptation, Food Funct., 2021, 12, 4983–4994 RSC.
- A. Nogal, A. M. Valdes and C. Menni, The role of short-chain fatty acids in the interplay between gut microbiota and diet in cardio-metabolic health, Gut Microbes, 2021, 13, 1–24 CrossRef PubMed.
- E. Hosseini, C. Grootaert, W. Verstraete and T. Van de Wiele, Propionate as a health-promoting microbial metabolite in the human gut, Nutr. Rev., 2011, 69, 245–258 CrossRef PubMed.
- K. J. Portune, M. Beaumont, A. M. Davila, D. Tomé, F. Blachier and Y. Sanz, Gut microbiota role in dietary protein metabolism and health-related outcomes: The two sides of the coin, Trends Food Sci. Technol., 2016, 57, 213–232 CrossRef CAS.
- A. Koh, F. De Vadder, P. Kovatcheva-Datchary and F. Bäckhed, From dietary fiber to host physiology: Short-chain fatty acids as key bacterial metabolites, Cell, 2016, 165, 1332–1345 CrossRef CAS PubMed.
- C. Gutiérrez-Vázquez and F. J. Quintana, Regulation of the immune response by the aryl hydrocarbon receptor, Immunity, 2018, 48, 19–33 CrossRef PubMed.
- B. Lamas, J. M. Natividad and H. Sokol, Aryl hydrocarbon receptor and intestinal immunity review-article, Mucosal Immunol., 2018, 11, 1024–1038 CrossRef CAS PubMed.
- M. Venkatesh, S. Mukherjee, H. Wang, H. Li, K. Sun, A. P. Benechet, Z. Qiu, L. Maher, M. R. Redinbo, R. S. Phillips, J. C. Fleet, S. Kortagere, P. Mukherjee, A. Fasano, J. Le Ven, J. K. Nicholson, M. E. Dumas, K. M. Khanna and S. Mani, Symbiotic bacterial metabolites regulate gastrointestinal barrier function via the xenobiotic sensor PXR and toll-like receptor 4, Immunity, 2014, 41, 296–310 CrossRef CAS PubMed.
- P. Nuss, Anxiety disorders and GABA neurotransmission: A disturbance of modulation, Neuropsychiatr. Dis. Treat, 2015, 11, 165–175 Search PubMed.
- Z. Huang, J. Boekhorst, V. Fogliano, E. Capuano and J. M. Wells, Impact of high-fiber or high-protein diet on the capacity of human gut microbiota to produce tryptophan catabolites, J. Agric. Food Chem., 2022, 71, 6956–6966 CrossRef PubMed.
Footnote |
| † Electronic supplementary information (ESI) available. See DOI: https://doi.org/10.1039/d3fo05379b |
| This journal is © The Royal Society of Chemistry 2024 |