 Open Access Article
Integrated multi-omics profiling highlights the benefits of resveratrol hydroxypropyl-β-cyclodextrin inclusion complex for A53T transgenic mice through the microbiota–gut–brain axis†
Xiaodong
Sun‡
 a,
Shenglan
Feng‡
 a,
Bingqing
Qin
 a,
Junjie
Ye
 ab,
Lixia
Xie
 a,
Jianjun
Gui
 a and
Ming
Sang
 *a
*a
aResearch Center for Translational Medicine, Hubei Provincial Clinical Research Center for Parkinson's Disease at Xiangyang No.1 People's Hospital, Hubei Key Laboratory of Wudang Local Chinese Medicine Research, Hubei University of Medicine, China. E-mail: sangming@whu.edu.cn; smxd2000@126.com
bClinical Laboratory, Wuhan Asia Heart Hospital, Wuhan 430022, China
First published on 10th January 2024
Abstract
Parkinson's disease (PD) is a neurological disorder characterized by motor and gastrointestinal dysfunctions. Resveratrol is a potent antioxidant and anti-inflammatory phytoalexin known for its health-promoting benefits. However, little is known about its potential in treating PD by modulating the microbial gut-brain axis, and its clinical application has been limited due to poor water solubility, rapid metabolism, and limited systemic bioavailability. Our study aimed to evaluate the therapeutic potential of RHSD, a resveratrol-cyclodextrin inclusion complex, in treating PD through the gut-brain axis in human SNCA-transgenic (A53T) mice PD models. Building on our previous study, we prepared RHSD and compared its efficacy with uncoated resveratrol for PD treatment. The study results demonstrated that RHSD exhibited several advantages in improving motor function, alleviating cognitive impairment, restoring intestinal barrier function, and inhibiting neuropathy. Subsequently, a series of analyses, including fecal microbiota metagenomic sequencing, non-target metabolic assays, host transcriptome sequencing, and integrative analysis were performed to reveal the potential therapeutic pathways of RHSD in A53T mice. The metagenomic sequencing results indicated a significant increase in the levels of Lactobacillus murinus, Lactobacillus reuteri, Enterorhabduscaecimuris, Lactobacillus taiwanensis, and Lactobacillus animals following RHSD administration. Furthermore, metabolomics profiling showed that the levels of gut microbiome metabolites were reversed after RHSD treatment, and differential metabolites were significantly correlated with motor function and intestinal function in PD mice. The integrated analysis of microbial metabolites and host transcriptomics suggested that abnormal amino acid metabolism, mitochondrial dysfunction, oxidative stress, and neuroinflammation in the PD model were associated with the diffusion of abnormal metabolites. This study illustrates the profound impact of RHSD administration on rectifying gut microbiota dysbiosis and improving the A53T mouse model. Notably, we observed significant alterations in the proliferation and metabolism of multiple probiotic strains of Lactobacillus. Furthermore, our research supports the hypothesis that microbiota-related metabolites may regulate the transcription of host genes, including dopamine receptors and calcium stabilization. Consequently, our findings underscore the potential of RHSD as a promising therapeutic candidate for the treatment of PD through the modulation of several signaling pathways within the microbiota–gut–brain axis.
1. Introduction
Parkinson's disease (PD) is a prevalent neurodegenerative disease, affecting 2–3% of people over 65.1 PD is characterized by motor deficits, including tremors, muscular rigidity, bradykinesia, and impaired gait, and two hallmarks of the disease are the loss of dopaminergic neurons in the substantia nigra and the deposition of misfolded alpha-synuclein (α-Syn) protein in the nervous system.2 Previous studies have shown that mutant α-Syn causes non-motor symptoms in an age-dependent manner and that gut microbiota plays a role in motor deficits, microglia activation, and α-Syn pathology in mice that overexpress α-Syn.3–5 Numerous studies have revealed that PD may arise in the gut and spread to the brain through α-Syn transmission, systemic inflammation, and increased blood–brain barrier permeability.6,7 Dysbiosis of gut microbiota may play a crucial role in the gut-brain axis, which is two-way communication between the central nervous system and the enteric nervous system.8,9 Current PD treatments only manage symptoms and have side effects.10Resveratrol (RES) is a natural compound with food-drug homology and has neuroprotective mechanisms, including antioxidation, anti-inflammation, ameliorating mitochondrial dysfunction, and motor function.11,12 Zhang et al. showed that RES treatment alleviated motor and cognitive deficits in the A53T α-synuclein mouse model of PD in a dose-dependent manner and inhibited α-synuclein aggregation and cytotoxicity in vitro.13 However, one of the limitations of RES is its low oral bioavailability.14 To address this issue, in recent years, researchers have used hydrophilic materials such as hydroxypropyl beta-cyclodextrin (HP-β-CD) to encapsulate phenolic compounds including RES to improve its water solubility, stability, and bioavailability.15 HP-β-CD is amorphous, easily soluble in water, and has a “hydrophobic inside, hydrophilic outside” special three-dimensional ring structure, that can be used for drug inclusion. Our research team also prepared RES/HP-β-CD inclusion complex (RHSD) in a previous study and found that RHSD has better anti-cancer effects than the free form of RES in vivo.16 Recently, increasing evidence has indicated that resveratrol exerts its beneficial effects on health,17,18 including neuroprotective effects on PD,19 by modulating gut microbiota composition.
In this study, an A53T transgenic PD mice model was applied to compare the effect of RHSD and resveratrol on improving motor function, cognitive impairment, neuropathy, and non-motor symptoms. Then, integrated multi-omics profiling was performed to elucidate the contribution of microbiota and its metabolites in the neuroprotective effect of RHSD.
2. Materials and methods
2.1. Animals and reagents
The male A53T mutation human SNCA-transgenic mice (A53T transgenic mice) with C57BL/6J background mice were used in this study. A53T transgenic mice were donated by Professor Zhang Zhentao of Wuhan University [SCXK(E)2019-0004] and housed in a pathogen-free barrier facility at Xiangyang No.1 People's Hospital [SCXK(E)2022-0093]. RES (purity 99.0%) was purchased from Aladdin (Shanghai, China). HP-β-CD (average Mw = 1540 Da with 1.0 M substitution, hydroxypropyl moiety) were obtained from Aldrich (St Louis, MO, United States). Ethanol (95%, v/v) was purchased from Macklin Inc. (Shanghai, China). Water was double distilled and deionized. Preparation of RES/HP-β-CD Complexes (RHSD) refers to our previous research,16 an inclusion complex of 1![[thin space (1/6-em)]](https://www.rsc.org/images/entities/char_2009.gif) :
:![[thin space (1/6-em)]](https://www.rsc.org/images/entities/char_2009.gif) 1 M ratio was prepared by co-evaporation. The actual content of RES was close to 13% by mass in RHSD. ELISA kits were purchased from Solarbio Life Science (Beijing, China). Fluorescein isothiocyanate–dextran (FITC-dextran, MW: 4 kDa, FD4) was purchased from Aladdin (Shanghai, China).
1 M ratio was prepared by co-evaporation. The actual content of RES was close to 13% by mass in RHSD. ELISA kits were purchased from Solarbio Life Science (Beijing, China). Fluorescein isothiocyanate–dextran (FITC-dextran, MW: 4 kDa, FD4) was purchased from Aladdin (Shanghai, China).
2.2. Experiment procedures
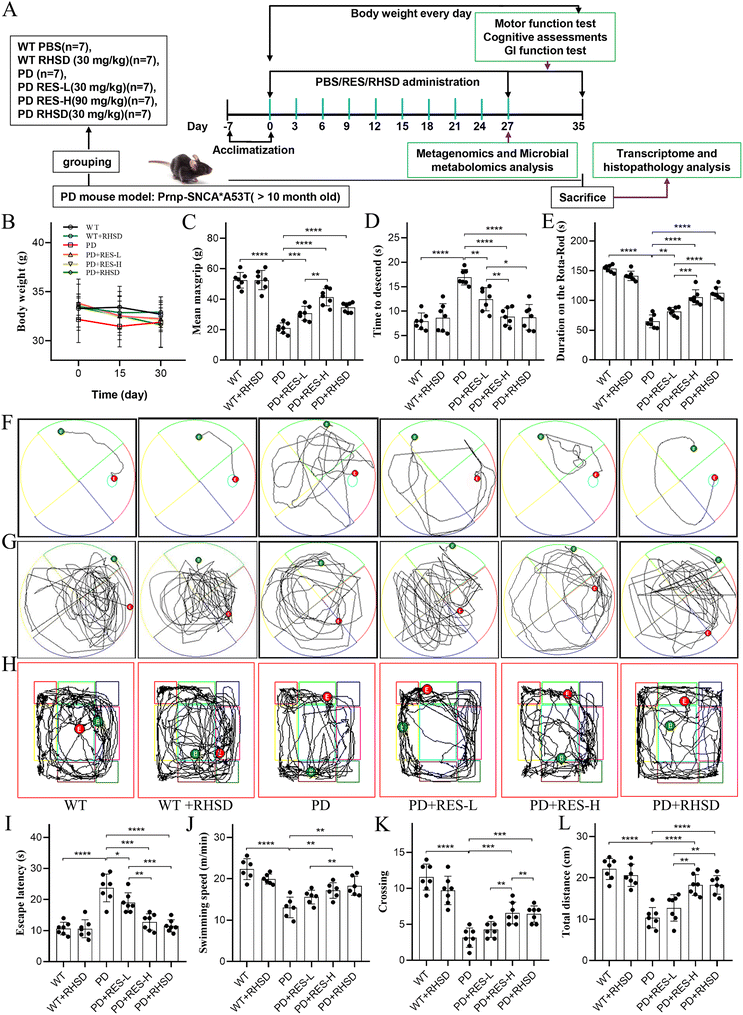
Ten-months-old male α-synuclein A53T transgenic mice and wild-type littermates were randomly assigned into six groups (WT, n = 7; WT + RHSD, n = 7; PD: A53T, n = 7; PD + RES-L: A53T + 30 mg kg−1 RES, n = 7; PD + RES-H: A53T + 90 mg kg−1 RES, n = 7; PD + RHSD: A53T + RHSD, n = 7), while wild-type mice served as the control. The RES and RHSD treatments were administered via a single oral gavage once every 3 days and lasted for one month. The dose of RHSD was administered according to the actual 30 mg kg−1 RES content. The intake of HP-β-CD is much lower than the amount reported in the literature in vivo.20–22 The schematic illustration of the experimental animal design is shown in Fig. 1A. The mice were housed in individually ventilated animal cages at 22 ± 2 °C with a 12-hour light/dark cycle. All animal procedures were carried out under the China Public Health Service Guide for the Care and Use of Laboratory Animals. Experiments involving mice and protocols were approved by the Ethical Committee of Biomedical Basic Research of Xiangyang No. 1 People's Hospital (XYYYE20210008).2.3. Motor function and gastrointestinal testing
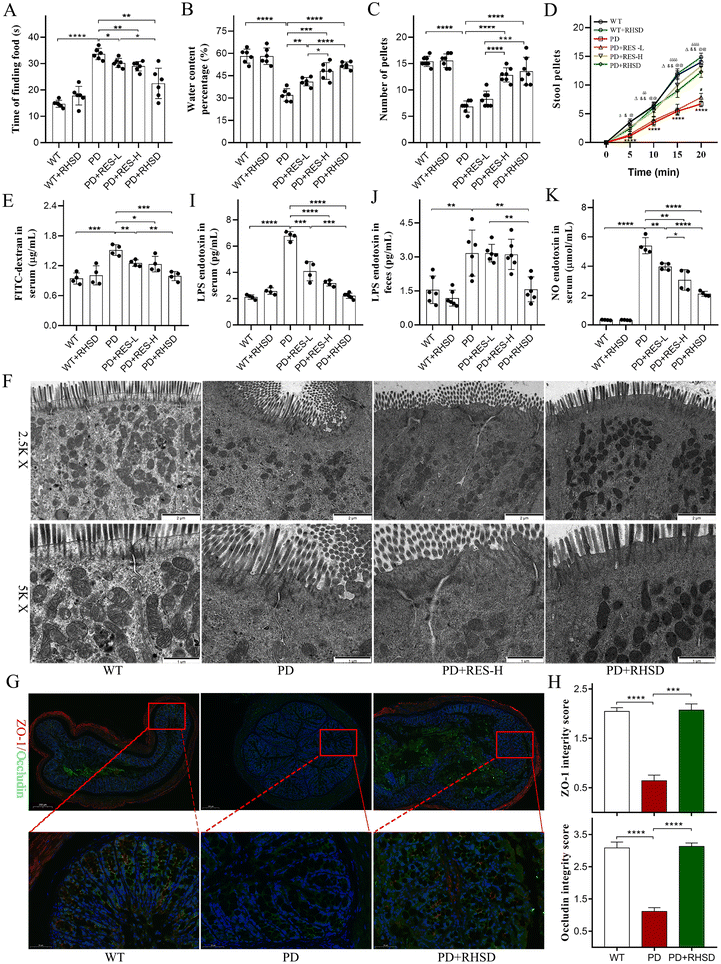
In addition, to evaluate gut motor function, fecal pellets were harvested by placing the mice in separate cages for up to 20 min and collecting the stool pellets produced every 5 min.
2.4. Enzyme-linked immunosorbent assay
Using the enzyme-linked immunosorbent assay (ELISA) kits to detect the levels of mouse NO, LPS endotoxin in serum, and LPS endotoxin in feces. The experimental procedures were carried out according to the manufacturer's instructions. The concentrations of target proteins were determined by standard protein curves.2.5. Transmission electron microscopy
Both brain and colon fresh tissues were cut into cubes of 1 mm3 in size and placed into 2.5% glutaraldehyde at 4 °C for 4 hours. Then, the tissues were fixed in 1% osmic acid at 4 °C for 2 h, followed by dehydration using gradient alcohol. Subsequently, the samples were embedded in Epon-Araldite resin for penetration, placed in a mold for polymerization, and cured by baking at 60 °C for 48 h. Later, ultra-thin sections (70 nm) were cut on Leica UC7 ultrathin slicer. Finally, the ultrastructure of tight junctions was observed with a transmission electron microscope (HITACHI, HT7800, Japan).2.6. Histopathology and immunofluorescence
Brains and colon tissue were harvested, fixed with 4% formaldehyde, embedded with paraffin, and cut into 4 μm thick sections. For histological examination of brain and colon tissue, the paraffin-embedded sections were subjected to Hematoxylin and Eosin (H&E) staining and examined under an inverted microscope (Olympus IX73).For immunofluorescence analysis of mouse brain and colon samples, 4 μm-thick colon tissue fragments were exposed to antigen retrieval (induced by heat) and incubated with anti-mouse alpha-synuclein (1![[thin space (1/6-em)]](https://www.rsc.org/images/entities/char_2009.gif) :
:![[thin space (1/6-em)]](https://www.rsc.org/images/entities/char_2009.gif) 1000; rabbit; Protientech, Wuhan China), anti-human alpha-Synuclein (phospho Ser129) (1
1000; rabbit; Protientech, Wuhan China), anti-human alpha-Synuclein (phospho Ser129) (1![[thin space (1/6-em)]](https://www.rsc.org/images/entities/char_2009.gif) :
:![[thin space (1/6-em)]](https://www.rsc.org/images/entities/char_2009.gif) 500; Rabbit; Novus Biologicals, Littleton, CO, USA), and anti-mouse Tyrosine Hydroxylase (TH) antibody (1
500; Rabbit; Novus Biologicals, Littleton, CO, USA), and anti-mouse Tyrosine Hydroxylase (TH) antibody (1![[thin space (1/6-em)]](https://www.rsc.org/images/entities/char_2009.gif) :
:![[thin space (1/6-em)]](https://www.rsc.org/images/entities/char_2009.gif) 500; GB12181, Servicebio, Wuhan China), anti-mouse GFAP (1
500; GB12181, Servicebio, Wuhan China), anti-mouse GFAP (1![[thin space (1/6-em)]](https://www.rsc.org/images/entities/char_2009.gif) :
:![[thin space (1/6-em)]](https://www.rsc.org/images/entities/char_2009.gif) 500; GB11096, Servicebio, Wuhan China), or with anti-mouse Iba1 (1
500; GB11096, Servicebio, Wuhan China), or with anti-mouse Iba1 (1![[thin space (1/6-em)]](https://www.rsc.org/images/entities/char_2009.gif) :
:![[thin space (1/6-em)]](https://www.rsc.org/images/entities/char_2009.gif) 500; GB11105, Servicebio, Wuhan China). Sections were mounted with a Pathological slicer (RM2016, Leica Instrument Co., Ltd, Germany), and imaged with a digital slice of full field on a slice scanner microscope (Pannoramic MIDI, 3DHISTECH Hungary). 2–3 fields per region per animal were imaged and compiled in ImageJ software for analysis.
500; GB11105, Servicebio, Wuhan China). Sections were mounted with a Pathological slicer (RM2016, Leica Instrument Co., Ltd, Germany), and imaged with a digital slice of full field on a slice scanner microscope (Pannoramic MIDI, 3DHISTECH Hungary). 2–3 fields per region per animal were imaged and compiled in ImageJ software for analysis.
2.7. Metagenomics
Total genomic DNA was extracted from 100 mg fecal samples using the TIANGEN Magnetic Soil and Stool DNA Kit (TIANGEN Biotech CO., Ltd Beijing, China). Purity and integrity of DNA were analyzed by agarose gel electrophoresis, and the concentration was determined using Qubit4.0, respectively. A total amount of 1 μg DNA per sample was used as input material for the DNA sample preparations. Detailed experimental procedures of Metagenomic sequencing were described in the ESI.†DIAMOND software (V0.9.9, https://github.com/bbuchfink/diamond/) is used to blast the Unigenes to the sequences of Bacteria, Fungi, Archaea, and Viruses which are all extracted from the NR database (version: 2018-01-02, https://www.ncbi.nlm.nih.gov/) of NCBI with the parameter setting are blastp, -e 1e-5. For the finally aligned results of each sequence, as each sequence may have multiple aligned results, choose the result of which the e value < the smallest e value × 10 to take the LCA algorithm which is applied to system classification of MEGAN software to make sure the species annotation information of sequences. The table containing the number of genes and the abundance information of each sample in each taxonomy hierarchy (kingdom, phylum, class, order, family, genus, species) are obtained based on the LCA annotation result and the gene abundance table. The abundance of a species in one sample equals the sum of the gene abundance annotated for the species; the gene number of a species in a sample equals the number of genes whose abundance is nonzero. Krona analysis, the exhibition of generation situation of relative abundance, the exhibition of abundance cluster heat map, PCA (R ade4 package, version 2.15.3), and NMD (R vegan package, version 2.15.3) decrease-dimension analysis are based on the abundance table of each taxonomic hierarchy. The difference between groups is tested by Anosim analysis (R vegan package, version 2.15.3). Metastats and LEfSe analysis are used to look for the different species between groups. Permutation test between groups is used in Metastats analysis for each taxonomy and get the P value, then use Benjamini and Hochberg False Discovery Rate to correct P value and acquire q value. LEfSe analysis is conducted by LEfSe software (the default LDA score is 3); finally, screen out important species by Mean Decrease Accuracy and Mean Decrease Gin, then cross-validate each model (default 10 times) and plot the ROC curve. Adopt DIAMOND software (V0.9.9) to blast Unigenes to the functional database with the parameter setting of blastp, -e 1e-5. Functional database excludes KEGG database (version 2018-01-01, https://www.kegg.jp/kegg/).
2.8. Gut bacterial metabolomics analysis
Detailed experimental procedures of sample preparation and extraction were described in the ESI.† The original data file obtained by LC-MS analysis was converted to mzML format by ProteoWizard. Peak extraction, alignment, and retention time correction were performed by the XCMS program. The “SVR” method was used to correct the peak area. Metabolic identification information was obtained by searching the laboratory's self-built database and integrating the results with information from public databases, AI prediction database, and metDNA. Finally, the R program (https://www.r-project.org/ and MetaboAnalystR) was used for principal component analysis (PCA) and orthogonal partial least-squares discriminant analysis (OPLS-DA). To screen differential metabolites, the fold change value, P-value, and VIP value of OPLS-DA were combined and the criteria were as follows: variable importance in projection (VIP) scores ≥1; p-value < 0.05; fold change ≥ 2 or <0.5. Volcano plots, linear discriminate analysis (LDA) effect size charts, and heatmaps were used to illustrate the differences in metabolites between groups. Correlation analysis of metabolites with significant differences was performed by Pearson correlation analysis. The KEGG database, HMDB database, and MebaboAnalyst (https://www.metaboanalyst.ca/) were used to perform functional annotation and pathway enrichment analysis of metabolites in difference.2.9. Microbial metagenomic sequencing and metabolites integrated analysis
Spearman correlation analysis was used to determine the correlation coefficients between differential metabolites and genes. The value range of the Spearman correlation coefficient is [−1, 1], correlation analysis was calculated by cor function of R software, and correlation significance test was calculated by cor P value Student function of WGCNA package. In addition, the differential metabolites and genes with a correlation |r| ≧ 0.8 and correlation coefficient of significance test of p-value < 0.05 were used to plot the Complex Heatmap and correlation network.2.10. RNA sequencing
Detailed experimental procedures of RNA Sequencing and data analysis were described in the ESI.† Briefly, all subsequent analyses are based on clear reads. Download the reference genome and its annotation file from the website, build the index using HISAT (V2.1.0), and compare the clean reads to the reference genome. Use String Tie v1.3.4d for new gene prediction. Use feature Counts v1.6.2/String Tie v1.3.4d to calculate the gene alignment and FPKM. FPKM is currently the most used method to estimate gene expression levels. DESeq2 v1.22.1/edgeR v3.24.3 was used to analyze the differential expression between the two groups and corrected for P-values using Benjamini & Hochberg's method. The corrected P-value and |log2![[thin space (1/6-em)]](https://www.rsc.org/images/entities/char_2009.gif) foldchange| were used as thresholds for expressing significant differences. The enrichment analysis is performed based on hypergeometric tests. In KEGG, the hypergeometric distribution test is performed in terms of paths; for GO, it is performed in GO terms. The analysis of protein interactions for the differentially expressed genes is based on the STRING database with known and predicted protein–protein interactions. For the species existing in the database, we construct the network by extracting the target gene list from the database; otherwise, use diamond v0.9.24.125 to compare the target gene sequence with the selected reference protein sequence, and then according to the selected reference species know the interaction to build a network. Use gsea-3.0.jar for gene set enrichment analysis. Use WGCNA v1.69 for weighted gene co-expression network analysis.
foldchange| were used as thresholds for expressing significant differences. The enrichment analysis is performed based on hypergeometric tests. In KEGG, the hypergeometric distribution test is performed in terms of paths; for GO, it is performed in GO terms. The analysis of protein interactions for the differentially expressed genes is based on the STRING database with known and predicted protein–protein interactions. For the species existing in the database, we construct the network by extracting the target gene list from the database; otherwise, use diamond v0.9.24.125 to compare the target gene sequence with the selected reference protein sequence, and then according to the selected reference species know the interaction to build a network. Use gsea-3.0.jar for gene set enrichment analysis. Use WGCNA v1.69 for weighted gene co-expression network analysis.
2.11. Integrated analysis of microbial differential metabolites and host transcriptomics
Pearson correlation analysis was used to determine the correlation coefficients between microbial differential metabolites and host genes correspondingly. In addition, we selected the differential metabolites and genes with a |cor| > 0.8, and p value < 0.05 to plot the map of the correlation network using the Cytoscape software (v3.6.1).2.12. Statistical analysis
Microbial, metabolites, and RNA sequencing statistical analysis are described in detail above. Excluding these, datasets were analysed within the GraphPad Prism version 8 (GraphPad Software, La Jolla, CA, USA). Pairwise comparisons were generated with two-tailed t-tests. Comparisons of groups were generated with one-way ANOVA. Results with a p-value < 0.05 were considered to be statistically significant.3. Results
3.1. Resveratrol treatment alleviates motor symptoms and cognitive decline in the A53T-PD mouse model and hydroxypropyl-β-cyclodextrin encapsulation increases its efficacy
It is well known that PD is characterized by dyskinesia, autonomic dysfunction, and cognitive impairment,24 and motor disorders and cognitive decline commonly occur in the A53T-PD mouse models at 9–16 months of age.25 To evaluate the protective effects of resveratrol administration on PD, the A53T mice and WT littermate control were treated with low dosages of RES (30 mg kg−1, RES-L), high dosages of RES (90 mg kg−1, RES-H), and RHSD (30 mg kg−1), followed by a panel of behavioral tests and cognitive function tests. As illustrated in Fig. 1A, three behavioral tests were performed to assess the motor functions of mice from different groups, including the Rota-Rod test for the motor coordination of mice from different groups, the grip strength test for muscle force of limbs, and the pole test for motor balance. In addition, the Morris water maze test and open field test were performed to assess the cognitive function (Fig. 1A). As shown in Fig. 1C–E, the A53T mice were showed significant motor deficits compared to the WT mice, including decreased scores of the pole test (Fig. 1C), reduced limb muscle strength (Fig. 1D), and shorter duration on the rod (Fig. 1E). In the Morris water maze test (Fig. 1F and G), longer latency (Fig. 1I), slower swimming (Fig. 1J), and less frequent visits to the target quadrant (Fig. 1K) of A53T mice compared with WT mice. In the open field test (Fig. 1H), the groups of mice exhibited comparable levels of locomotor activity (total distance traveled) (Fig. 1L). On the contrary, resveratrol treatment alleviated motor and cognitive deficits in the A53T-PD mouse model in a dose-dependent manner, and the efficacy of RHSD (30 mg kg−1) was more significant than same dose RES, indicating that RHSD could induce a remarkable recovery from the motor ability and the spatial memory disorder of PD mice. However, no differences were observed in WT mice treated with or without RHSD. Furthermore, there was no significant difference in body weight between A53T-PD mice and wild-type mice, resveratrol treatment also unremarkably changed the weight of the mice (Fig. 1B).3.2. Resveratrol treatment alleviates gastrointestinal dysfunctions and rebuilds the intestinal barrier of the A53T-PD mice model
Recent research has linked central neuropathology in Parkinson's disease to increased barrier permeability of the colon.26 Given the common occurrence of dyssomnia, gastrointestinal symptoms, and intestinal barrier deterioration in PD patients, our study aimed to measure the impact of scent perception, gastrointestinal functions, and intestinal barrier on PD pathology. In our study, we found that PD patients took longer to find food compared to the wildtype (WT) group (Fig. 2A). However, this was significantly shortened by administration of RES-L, RES-H, and RHSD (Fig. 2A). Furthermore, we collected fecal pellets to measure the water content percentage and colon motility. A53T mice presented with markedly reduced fecal water content percentages (Fig. 2B) and pellet numbers (Fig. 2C), which were significantly elevated by RES administration in a dose-dependent manner. Notably, RHSD was more effective than RES-L (Fig. 2B and C). Additionally, the study revealed significant differences in fecal output frequencies between PD group mice and WT group mice (indicated by a 20 min fecal collection experiment) (Fig. 2D). Nevertheless, treatment with RES-H and RHSD significantly increased the fecal output at each observed time point. However, the effect of RES-L was observed solely in the last time point.In addition to testing the functions and structures of intestinal barriers, an in vivo intestinal permeability assay was performed to measure the concentration of FITC-dextran in the serum. Higher concentration of FITC-dextran indicates heightened gut permeability. The PD group had increased concentration of FITC-dextran compared to the WT group, while RES-L, RES-H, and RHSD administration significantly reduced serum FD4 concentrations (Fig. 2E). TEM analysis was also conducted to detect changes in the structures of intestinal barriers. Results showed impaired epithelium with sparse microvilli and decreased and discontinuous electron-dense material with wider paracellular gaps in the colon slides of A53T mice. After RHSD treatment, the epithelium was present with regularly organized microvilli and intact tight junctions (Fig. 2F). Immunofluorescence staining was used to measure tight junction protein expression in the colon. Results showed disrupted and decreased expression of ZO-1 and Occludin in the PD group. RHSD administration preserved ZO-1 and Occludin expression and integrity (Fig. 2G and H). To test whether the restoration of intestinal barriers could lead to decreased LPS levels, serum LPS levels were measured using ELISA. Results showed that LPS levels in the serum of the A53T group were elevated to more than three times those of the WT group. Conversely, RES-L, RES-H, and RHSD administration significantly reduced serum LPS levels (Fig. 2I). Consistently, the level of LPS in the feces of A53T mice was significantly elevated, while RHSD treatment reduced the abnormal LPS levels (Fig. 2J). These data suggest that RES preserves the intestinal barrier impairment in the A53T transgenic mouse model.
Abnormal NO pathways are associated with Parkinson's disease.27 Given recent evidence that elevated NO mediates axonal degeneration and activates cyclooxygenases to provoke neuroinflammation. NO also instigates a down-regulated secretion of brain-derived neurotrophic factor (BDNF), which is essential for neuronal survival, development and differentiation, synaptogenesis, and learning and memory.28 The abnormal serum concentration of NO in the A53T transgenic mouse model was detected by ELISA analysis. As shown in Fig. 2K, the serum concentration of NO in the A53T group was significantly higher than those in the WT group (Fig. 2K). In contrast, resveratrol treatment reduced serum NO levels in the A53T mouse model in a dose-dependent manner, and the efficacy of RHSD was more significant than the same dose RES, indicating that resveratrol could significantly restore the serum NO level of A53T mice and H-β-CD encapsulation increases its efficacy (Fig. 2K).
3.3. Resveratrol treatment reduced the accumulation of α-Syn and restored homeostasis in the colon of A53T-PD mice model
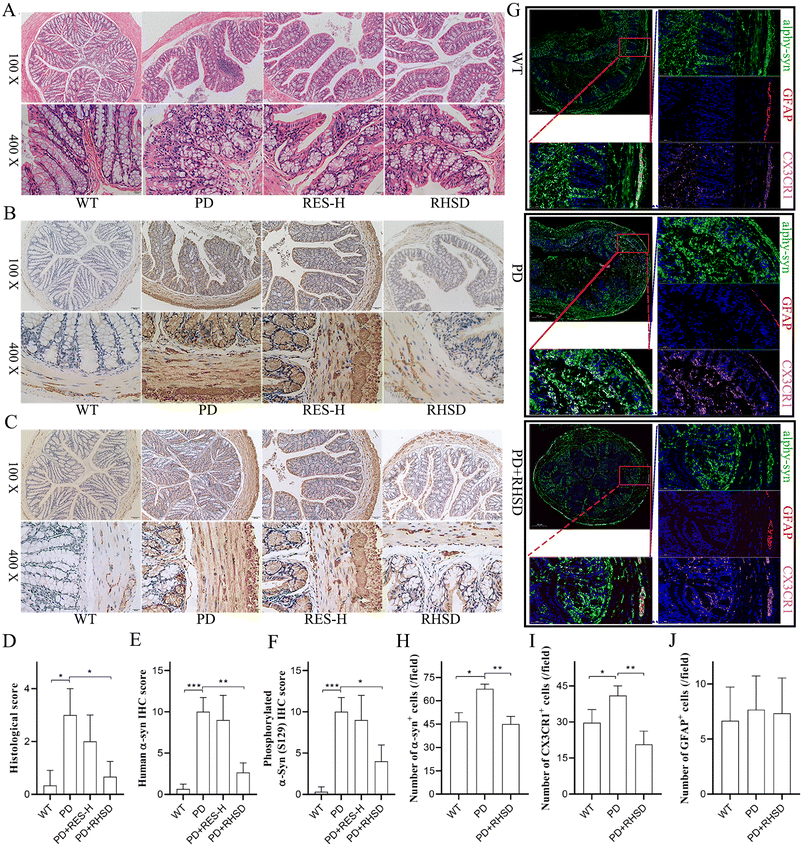
In recent years, there has been increasing recognition of a low-grade inflammatory state in the gut of Parkinson's disease (PD) patients. There is substantial evidence that prodromal lesions appear in the bowel in a significant fraction of PD patients up to 20 years before the onset of central nervous system (CNS) manifestations.29 In this study, we used H&E staining to evaluate immune infiltration and epithelium impairment in the colon. The H&E histological scores were remarkably higher in the A53T mice than in the WT group, while treatment with high-dose resveratrol (RES-H) and RHSD reduced the scores significantly (Fig. 3A and D). These findings suggest that RES-H and RHSD treatment significantly attenuate PD-related histological characteristics and inflammation in the colon of A53T transgenic mice. It has been debated whether the submucosal detection of α-Syn + Lewy neurites in colon biopsy samples is specific for PD.30–32 Human α-Syn overexpressing transgenic mice exhibit insoluble α-Syn aggregates within enteric neurons, which precedes onset of subcortical changes.33 To determine the inhibiting effects of resveratrol administration on α-Syn aggregation in A53T transgenic mice, the expression of α-Syn and Ser129-phosphorylated α-synuclein (S-129 α-Syn) in the colonic mucosa and muscular layers were measured by immunohistochemistry staining. Results showed increased expression of α-Syn (Fig. 3B and E) and S-129 α-Syn (Fig. 3C and F) in the PD group, whereas RHSD administration significantly decreased the expression of α-Syn and phosphorylated α-Syn. It has been demonstrated that mice have a “monocyte waterfall” from circulation to the intestine to maintain the macrophage pool in the gut in a CCR2-dependent manner.34 These monocytes terminally become mature resident Ly6Clow/− CX3CR1hi MHC-IIhi macrophages that express IL-10 and maintain intestinal homeostasis in the resting intestine.34,35 Additionally, compelling evidence has shown that enteric glia are important homeostatic cells of the intestine. Bidirectional communication between enteric glia and immune cells contributes to gastrointestinal immune homeostasis.36 However, it was not reported whether intestinal macrophages and enteric glia are disordered by insoluble α-Syn aggregates. Therefore, we used GFAP and CX3CR1 to label enteric glia and intestinal resident macrophages respectively. Global scanning imaging was performed by immunofluorescence detection to observe the co-localization and expression levels of α-Syn with the glial cells and macrophages. As shown in Fig. 3G–J, the large accumulation of α-Syn in the colon of A53T mice was significantly inhibited by RHSD treatment (Fig. 3G and H). The number of GFAP+ cells had no significant difference between the groups (Fig. 3G and J). The number of CX3CR1+ cells was remarkably higher in the A53T mice group than in the WT group, while RHSD administration reduced the number of CX3CR1+ cells significantly (Fig. 3G and I). In addition, we also observed that α-Syn co-localized with GFAP in the colon mucosa and co-localized with CX3CR1 in the submucosa (Fig. 3G). These findings suggest that RHSD restored intestinal homeostasis disrupted by the accumulation of insoluble α-Syn in A53T transgenic mice.3.4. RHSD administration attenuates PD-associated histological features in the substantia nigra and striatum of the A53T transgenic mice
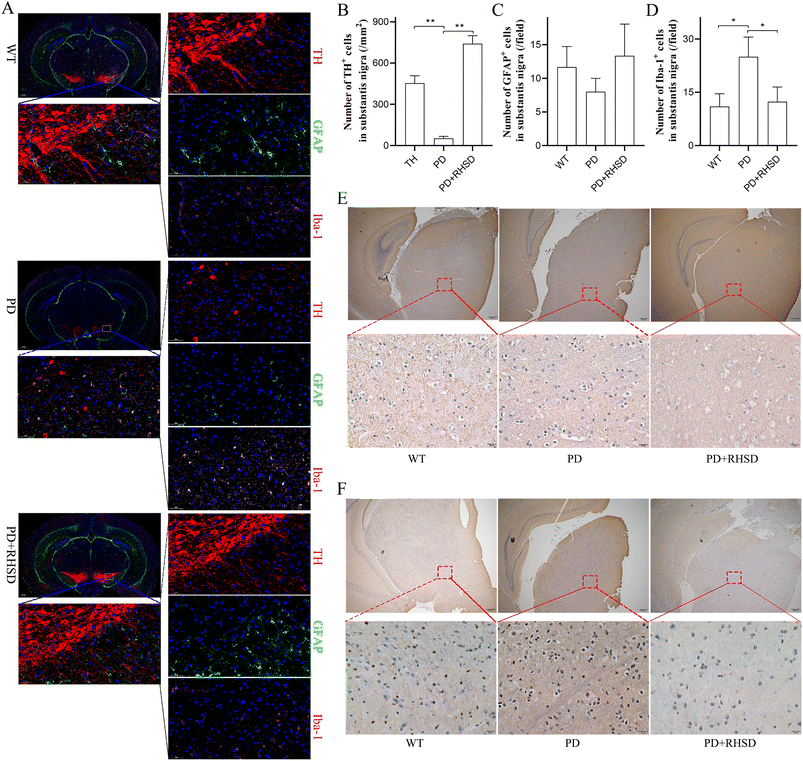
To further investigate how RHSD treatment protects dopaminergic neurons, we conducted immunofluorescence staining of the substantia nigra (SN) and striatum regions to detect the number of dopaminergic neurons and the activation of glial cells. We used tyrosine hydroxylase (TH) as the marker for dopaminergic neurons, GFAP for astrocytes, and Iba-1 for microglia. The number of dopaminergic neurons in the SN and striatum of the RHSD treatment group increased significantly compared to the A53T group (Fig. 4A, B, Fig. S1A and B†). The number of Iba-1+ cells showed a significant reduction in both the SN and striatum regions of the RHSD administration group compared to the A53T group (Fig. 4A, D, Fig. S1A and D†). However, RHSD administration did not significantly reduce the number of GFAP+ cells in either the SN or striatum regions of the A53T group (Fig. 4A, C, Fig. S1A and C†). These results suggest that RHSD treatment reversed PD-associated neuroinflammation primarily by inhibiting microglia activation. Another important hallmark of PD, α-Syn and S-129 α-Syn expression, was also measured using immunohistochemistry staining in the SN and striatum regions. The results showed that the expression of α-Syn and phosphorylated α-Syn was significantly increased in the PD group, whereas RHSD administration significantly decreased the expression of both proteins (Fig. 4E, F, Fig. S1E and F†).3.5. RHSD reverses gut dysbiosis in A53T transgenic mice
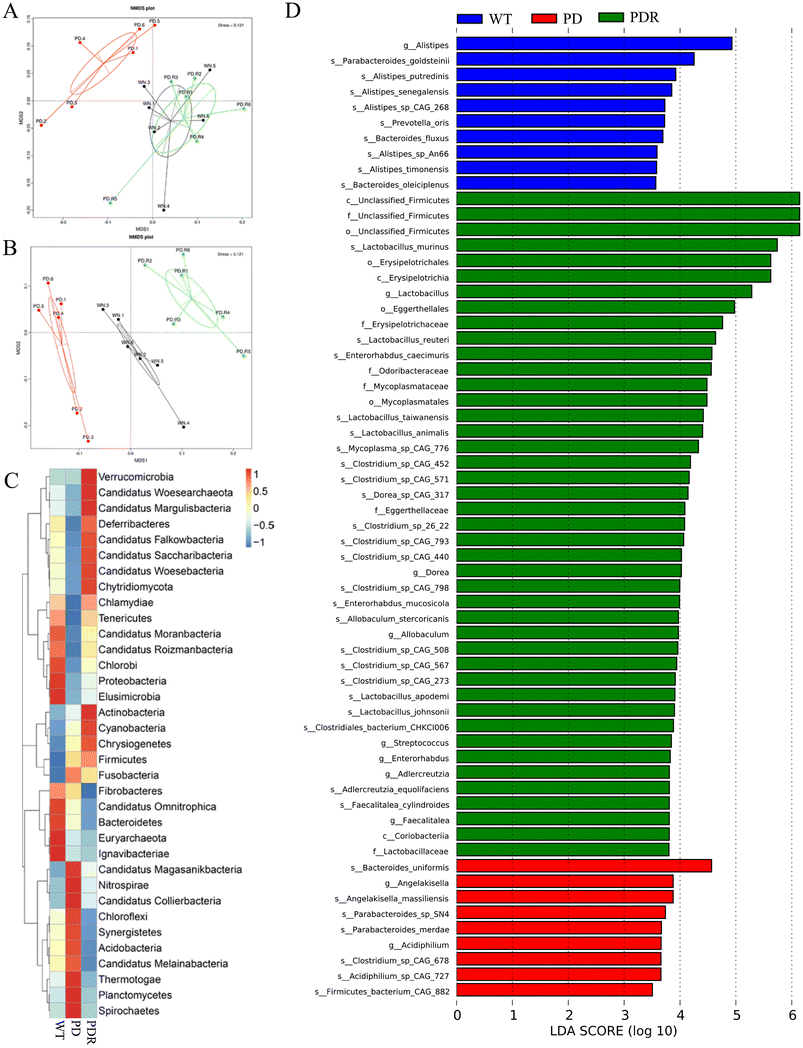
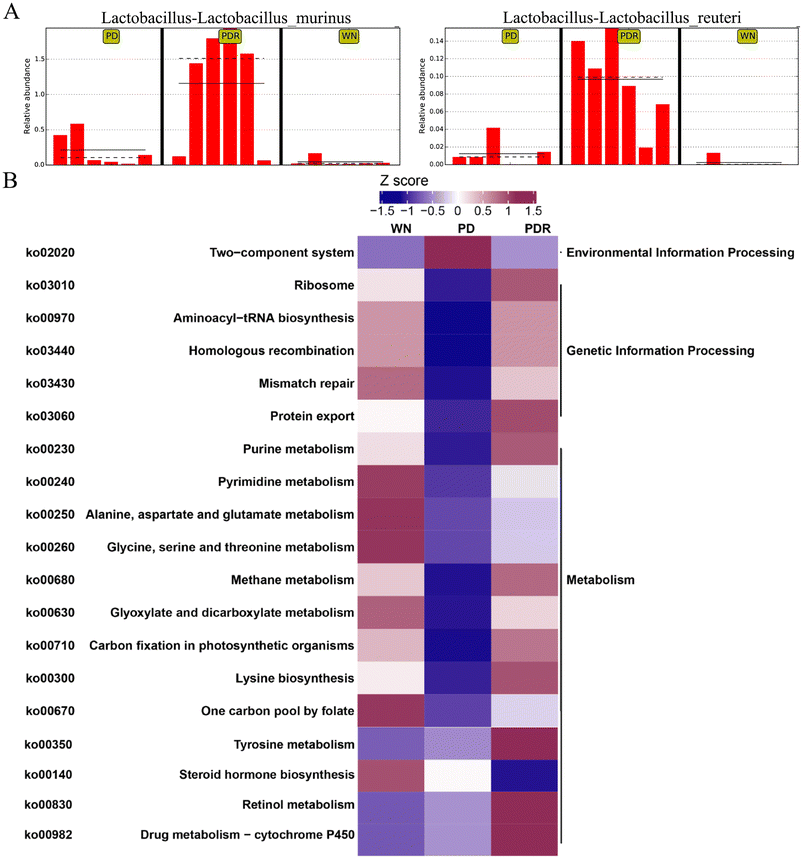
In recent years, accumulating reports have found that intestinal microbiota dysbiosis plays a vital role in the occurrence and development of Parkinson's disease,37,38 and this feature also exists in animal models of PD. Alterations and oscillations of the gut microbiota precede the onset of neuropathy and motor dysfunction, as observed in the A53T mouse model.39 To explore how RHSD administration protects the A53T transgenic mouse model by modulating microbiome community structures, we carried out metagenomic sequencing on fecal samples from mice in the WT, A53T, and RHSD treatment groups. NMDS decrease-dimension analysis showed that the fecal microbiota of A53T transgenic mice was different from that of WT mice based on the abundance of each taxonomic hierarchy, while the material similarity of the RHSD group was like that of the WT group. The analysis of NMDS based on the phylum and species level is presented in Fig. 5A and B (stress < 0.2, NMDS analysis is reliable). Bray–Curtis PcoA showed clear separation among groups, consistent with the correlation heatmap (Fig. S2A and S2B†). To further identify the critical bacteria that contribute to the development of PD, we used Metastats and LEfSe analysis to look for different species between groups at the phylum level (Fig. S2D and S2E†) and species level (Fig. 5C). The histogram of LDA value distribution and evolutionary branching plots show biomarkers with statistical differences between groups (Fig. 5D). Lactobacillus murinus and Lactobacillus reuteri are the intestinal probiotics that were significantly increased by RHSD (Fig. 6A). To find the specific bacterial species that might mediate the metabolic benefits of RHSD, we analyzed metagenomics data at the species level. A total of 1![[thin space (1/6-em)]](https://www.rsc.org/images/entities/char_2009.gif) 289
289![[thin space (1/6-em)]](https://www.rsc.org/images/entities/char_2009.gif) 948 genes were annotated in the WT group, while only 1
948 genes were annotated in the WT group, while only 1![[thin space (1/6-em)]](https://www.rsc.org/images/entities/char_2009.gif) 184
184![[thin space (1/6-em)]](https://www.rsc.org/images/entities/char_2009.gif) 096 genes were annotated in A53T mice. Different from the reduced species number found in the A53T group, RHSD supplementation increased the gene number to 1
096 genes were annotated in A53T mice. Different from the reduced species number found in the A53T group, RHSD supplementation increased the gene number to 1![[thin space (1/6-em)]](https://www.rsc.org/images/entities/char_2009.gif) 391
391![[thin space (1/6-em)]](https://www.rsc.org/images/entities/char_2009.gif) 317 (Fig. S2C†). Additionally, a total of 174 species were aberrant in A53T mice and reversed by RHSD treatment, determined with the double criteria of both fold change >2 (or <0.5) and p < 0.01. The differential species were mainly from the Firmicutes, Proteobacteria, Bacteroidetes, and Actinobacteria phyla. Among them, 44 species were reduced in the PD group and reversed by RHSD treatment, mostly from the Proteobacteria and Bacteroidetes phyla, while the other 130 species showed opposite changes, mostly from the Firmicutes, Proteobacteria, Bacteroidetes, and Actinobacteria phyla (Fig. S3†). Moreover, we removed unclassified species and selected those with stricter double criteria of both fold change >2 (or <0.05) and p < 0.001 in the RHSD treatment group, as shown in Table S1.† These data suggest that RHSD plays an essential role in regulating gut microbiota composition in A53T transgenic mice. We further performed a functional analysis of KEGG pathway enrichment to interpret the functions of the significantly altered bacteria. A total of 35 KEGG pathways at level 2 were identified (Fig. S2F†), and 19 KEGG pathways at level 3 were identified (Fig. 6B). The altered flora mainly belonged to genetic information processing and metabolism pathways in A53T mice and was significantly reversed by RHSD treatment, including the ribosome, protein export, purine metabolism, methane metabolism, carbon fixation in photosynthetic organisms, lysine biosynthesis, and drug metabolism-cytochrome P450.
317 (Fig. S2C†). Additionally, a total of 174 species were aberrant in A53T mice and reversed by RHSD treatment, determined with the double criteria of both fold change >2 (or <0.5) and p < 0.01. The differential species were mainly from the Firmicutes, Proteobacteria, Bacteroidetes, and Actinobacteria phyla. Among them, 44 species were reduced in the PD group and reversed by RHSD treatment, mostly from the Proteobacteria and Bacteroidetes phyla, while the other 130 species showed opposite changes, mostly from the Firmicutes, Proteobacteria, Bacteroidetes, and Actinobacteria phyla (Fig. S3†). Moreover, we removed unclassified species and selected those with stricter double criteria of both fold change >2 (or <0.05) and p < 0.001 in the RHSD treatment group, as shown in Table S1.† These data suggest that RHSD plays an essential role in regulating gut microbiota composition in A53T transgenic mice. We further performed a functional analysis of KEGG pathway enrichment to interpret the functions of the significantly altered bacteria. A total of 35 KEGG pathways at level 2 were identified (Fig. S2F†), and 19 KEGG pathways at level 3 were identified (Fig. 6B). The altered flora mainly belonged to genetic information processing and metabolism pathways in A53T mice and was significantly reversed by RHSD treatment, including the ribosome, protein export, purine metabolism, methane metabolism, carbon fixation in photosynthetic organisms, lysine biosynthesis, and drug metabolism-cytochrome P450.
3.6. RHSD reverses metabolomic changes in A53T transgenic mice
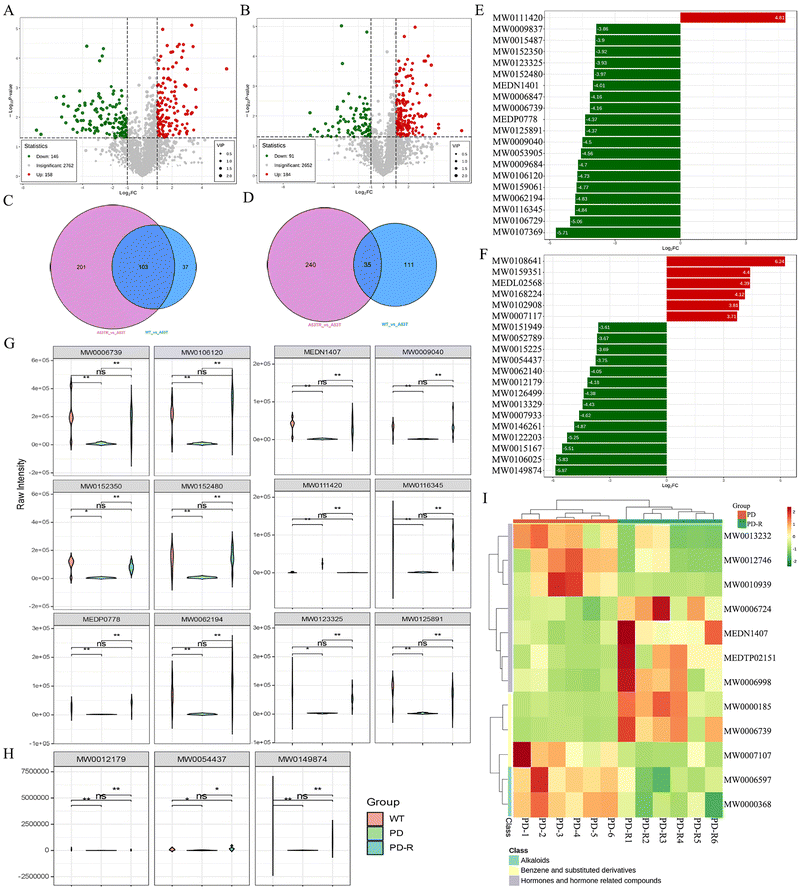
Several studies have identified compositional and metabolic alterations in the Parkinson's microbiota that have been strongly linked to the development and progression of the disease.40,41 To elucidate the effect of RHSD on gut microbial metabolism in A53T mice, untargeted metabolic profiling using LC/MS in positive and negative modes was performed on fecal samples. The unsupervised PCA, which was performed to visualize the general differences among samples, showed clear separation among groups in both positive and negative modes (Fig. S4A and B†).Differential metabolites in RHSD treatment group were shown on the volcano plot compared with the A53T group in both positive and negative modes (Fig. 7A and B). The differential metabolites were displayed in Venn diagrams that were significantly altered in two between-group comparisons (Fig. 7C for positive modes and Fig. 7D for negative modes). A total of 103 and 35 different metabolites were selected with the criteria of either VIP > 1 (multivariate statistical analysis), p < 0.05 (univariate statistics), and fold change ≥2 or ≤0.5 in positive and negative modes (Fig. 7C and D). Most of the different metabolites are related to amino acids and their metabolites (28 and 6), Benzene and substituted derivatives (24 and 5), and Aldehyde, Ketones, and Esters (11 and 4) in positive and negative modes. The top 20 metabolites with fold differences are shown in the TopFcBarChart of both positive and negative modes (Fig. 7E and F). Similar results were also shown in differential metabolite radar maps (Fig. S4C and D†). Among them, 11 metabolites were significantly decreased and one metabolite was significantly increased in A53T mice, which was reversed by RHSD administration in positive modes (Fig. 7G). In addition, 3 metabolites were significantly altered in A53T mice and reversed by RHSD administration in the negative mode (Fig. 7H). The compounds corresponding to the index are given in Table S2.†
Further, we next carried out the KEGG function annotation and enrichment analysis on the all-differential metabolites. Differential metabolite clustering heatmap of KEGG pathways covered 2 classes of metabolites including Hormones and hormone-related compounds, Alkaloids, and Benzene and substituted derivatives in positive modes (Fig. 7I). Among them, estriol (MEDN1407) and desmethylcitalopram (MW0006739) were enriched through differential enrichment analysis (Fig. 7I). Arginine and proline metabolism, Steroid hormone biosynthesis, Drug metabolism-cytochrome P450, and Ovarian steroidogenesis were enriched significantly P-value (Fig. S4E and F†). It is interesting to note that the metabolism of terpenoids and polyketides, amino acid metabolism, and drug metabolism-cytochrome P450 were also identified based on altered bacterial function (Fig. S2F†), the steroid hormone biosynthesis seemed no correlation with bacterial function (Fig. 6B). However, we have also noted that terpenoids regulate estrogen synthesis via aromatase CYP19, a key step rate-limiting enzyme and a member of the cytochrome P450 superfamily.42 Additionally, desmethylcitalopram is a routine treatment for Generalized anxiety disorder.43 These findings suggested that RHSD was effective in reversing endogenous α-Syn induced dysregulated metabolism, which may be attributed to its ability to regulate gut microbiota composition and metabolism.
3.7. RHSD modulates gut microbiome metabolites in A53T transgenic mice
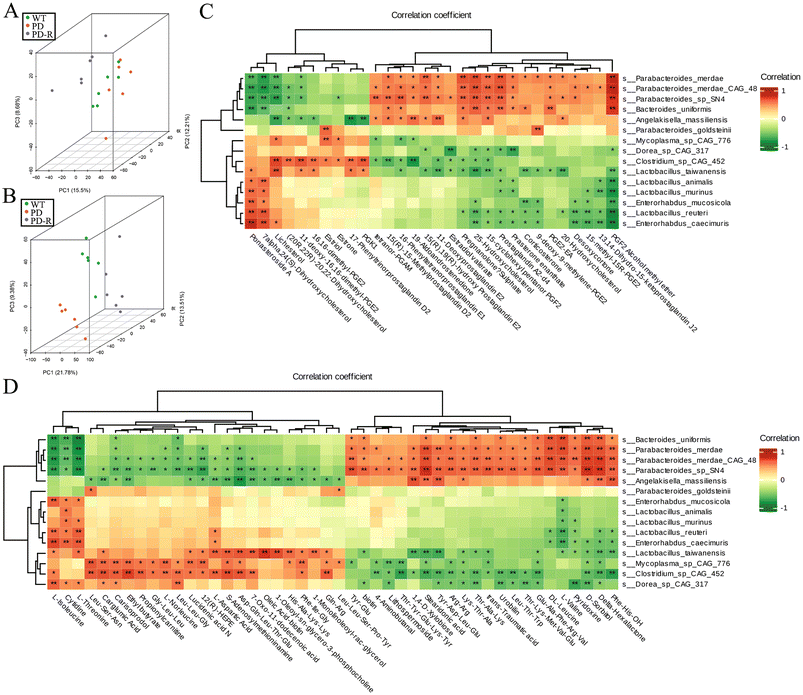
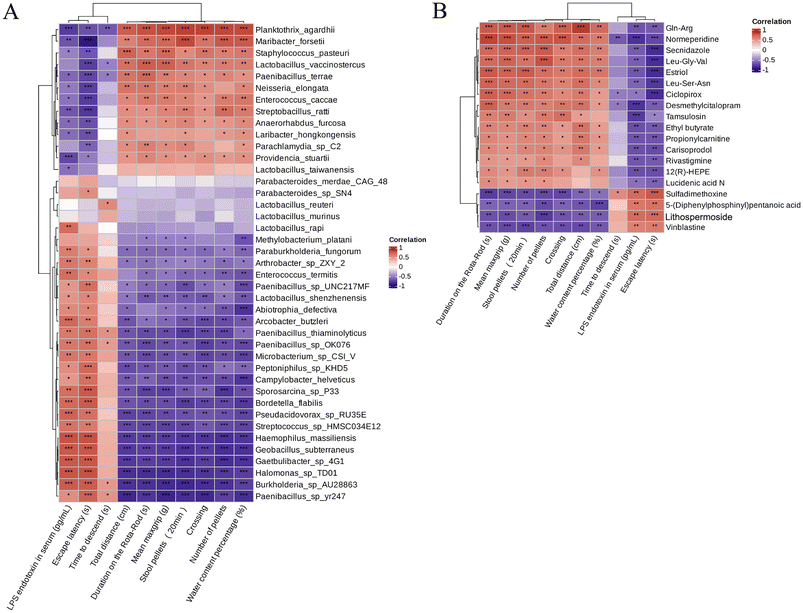
Spearman's correlation analysis was used to perform the correlation analysis between the 30 hormone-related compounds (Table S3†) and biomarker species, as well as the 46 other metabolites (Table S4†) and biomarker species. Principal Component Analysis (PCA) of the metabolome and microbiome directly showed that the PDR group was closer to the WT group in metabolome among sample groups (Fig. 8B), and the analysis of microbiome at the species level was consistent (Fig. 8A). The upregulated metabolites by RHSD negatively correlated with the biomarkers of A53T transgenic mice, and positively correlated with the biomarkers of RHSD administration group mice. On the contrary, many other metabolites downregulated by RHSD were positively correlated with the biomarkers of A53T transgenic mice and negatively correlated with the biomarkers of RHSD administration group mice (Fig. 8C and D).Furthermore, to better interpret the correlations of these significantly altered bacteria and metabolites, Spearman's correlation analysis was performed between the significantly difference bacterial species and the 19 metabolites with fold difference which was reversed by RHSD administration (Table S2†). The results showed that the high abundance of microflora in A53T mice feces was positively correlated with the high content of Lithospermoside, 5-(Diphenylphosphinyl) pentanoic acid, Sulfadimethoxine, and Vinblastine (Fig. S5A†). We noted that the high abundance of bacteria in the feces of A53T mice was closely related to inflammation and other pathological phenomena. For example, Arcobacter butzleri is an emerging enteric pathogen increasingly identified in intestinal infectious diseases and is likely under-reported in neurodegenerative diseases.44,45 Interestingly, the 19 metabolites were not significantly correlated with Lactobacillus_murinus and Lactobacillus_reuteri, but were significantly correlated with Lactobacillus_vaccinostercus, Lactobacillus_rapi, and Lactobacillus_shenzhenensis (Fig. S5A†). In addition, the level of Secnidazole, Leu-Gly-Val, Ciclopirox, and Estriol was positively correlated with Lactobacillus_vaccinostercus (Fig. S5B†). It has been shown that Lactobacillus spp. in the gut microbiota exerts anti-inflammatory effects by repairing the damaged gut barrier, suppressing pro-inflammatory factors in the lymphatic circulation, and improving the ratio of regulatory versus pathogenic T cells.46 Our study highlights the important role of bacteria and metabolites in resveratrol-associated beneficial effects in A53T transgenic mice.
To investigate the correlations between gut microbiota and differences metabolites with symptoms of PD in A53T mice, the relationship between the 41 most abundant species/19 differences metabolites and the behavioral performance, fecal pellets output, intestinal barrier function was analyzed (Fig. 9). Correlation analysis results suggest that bacteria with higher abundance in A53T mice were associated with poor motor, cognitive, and gut function, and bacteria with altered RHSD were positively associated with recovery of motor and nonmotor functions (Fig. 9A). Time to descend, LPS endetoxin in serum, and Escape latency were positively correlated with the high content of Lithospermoside, 5-(Diphenylphosphinyl) pentanoic acid, Sulfadimethoxine, and Vinblastine in A53T mice, the upregulated metabolites by RHSD negatively correlated with Time to descend, LPS endetoxin in serum, and Escape latency (Fig. 9B). These correlation results collectively support the involvement of the microbiota–gut–brain axis in the development of the A53T transgenic mice and the protective effects of RHSD treatment on this model.
3.8. RHSD affects transcriptomics changes in A53T transgenic mice
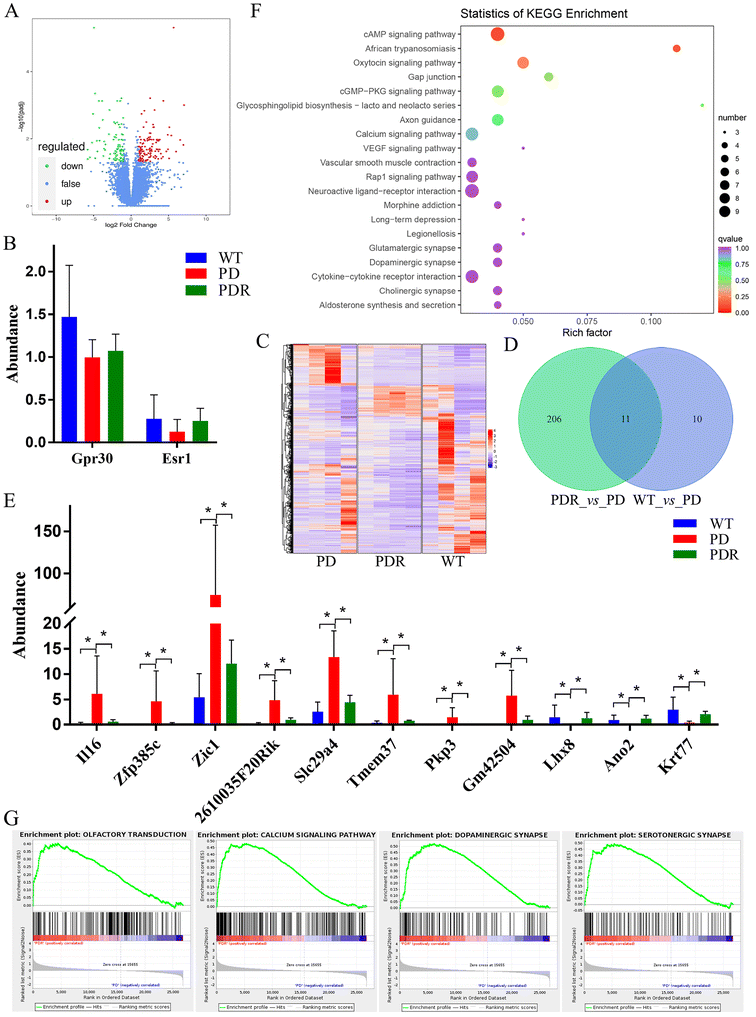
Using Fragments Per Kilobase of transcript per Million fragments mapped (FPKM) as an indicator to measure the level of transcript or gene expression, this study aimed to screen for differential genes. The screening conditions for differential genes were |log2![[thin space (1/6-em)]](https://www.rsc.org/images/entities/char_2009.gif) fold change| ≧ 1 and FDR < 0.05. The results showed that 217 differential genes were screened, of which 126 were expressed up-regulated and 91 were expressed down-regulated in the volcano map (Fig. 10A). To explore the differences in the expression of estrogen receptor in the midbrain of A53T transgenic mice, we determined the expression of Gpr30 and Esr1. The results showed that estrogen receptors were up-regulated by RHSD in A53T transgenic mice, but no significant difference (Fig. 10B). In total, 698 genes were differentially regulated (FC ± 1.5, false discovery rate [FDR]-corrected p < 0.05) by RHSD in three comparison groups (Fig. 10C). There were 11 genes that were aberrant in A53T mice and reversed by RHSD treatment (Fig. 10D). Among them, 8 genes were expressed up-regulated and 3 genes were expressed down-regulated in A53T transgenic mice, while RHSD reversed (Fig. 10E). Pathway significant enrichment analysis was performed using the pathway in KEGG database as a unit, and a hypergeometric test was applied to find out the pathway significantly enriched in differentially expressed genes compared with the whole genome background (Fig. 10F). It is interesting to note that the pathway of olfactory transduction, calcium signaling pathway, dopaminergic synapse, and serotonergic synapse were enriched by RHSD treatment (Fig. 10G).
fold change| ≧ 1 and FDR < 0.05. The results showed that 217 differential genes were screened, of which 126 were expressed up-regulated and 91 were expressed down-regulated in the volcano map (Fig. 10A). To explore the differences in the expression of estrogen receptor in the midbrain of A53T transgenic mice, we determined the expression of Gpr30 and Esr1. The results showed that estrogen receptors were up-regulated by RHSD in A53T transgenic mice, but no significant difference (Fig. 10B). In total, 698 genes were differentially regulated (FC ± 1.5, false discovery rate [FDR]-corrected p < 0.05) by RHSD in three comparison groups (Fig. 10C). There were 11 genes that were aberrant in A53T mice and reversed by RHSD treatment (Fig. 10D). Among them, 8 genes were expressed up-regulated and 3 genes were expressed down-regulated in A53T transgenic mice, while RHSD reversed (Fig. 10E). Pathway significant enrichment analysis was performed using the pathway in KEGG database as a unit, and a hypergeometric test was applied to find out the pathway significantly enriched in differentially expressed genes compared with the whole genome background (Fig. 10F). It is interesting to note that the pathway of olfactory transduction, calcium signaling pathway, dopaminergic synapse, and serotonergic synapse were enriched by RHSD treatment (Fig. 10G).
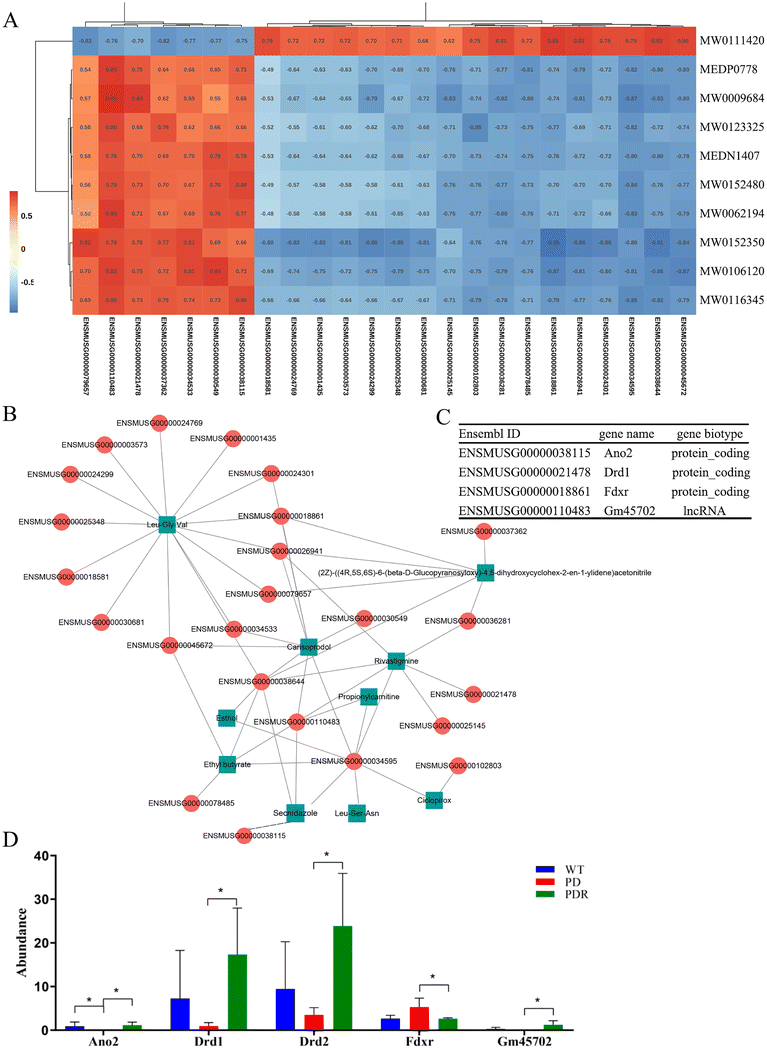
3.9. Integrated analysis of microbial differential metabolites and host transcript profiles
The first step was to perform a correlation analysis between differential microbial metabolites and host genes detected between the A53T and A53TR groups. The Spearman correlation coefficients for differential metabolites and genes were calculated using the R software. Based on the calculated values of |cor| > 0.8 and p-value < 0.05, the Cytoscape software was used to plot the heatmap and network of correlation for differential metabolites and genes (Fig. 11A and B). One of the primary genes positively correlated with Lithospermoside and negatively correlated with Leu-Gly-Val was Ferredoxin reductase (Fdxr) (Fig. 11A and C). Fdxr is in the mitochondrial inner membrane and is orthologous to human FDXR. A previous study found that Fdxr mutant mouse brain tissues had increased astrocytes, which could potentially be associated with neurodegeneration.47 The data from this study further sheds light on the pathogenic mechanism of FDXR-mediated central neuropathy and suggests an avenue for mechanistic studies that could ultimately aid in treatment. Anoctamin 2 (Ano2) was positively correlated with Leu-Ser-Asn and Secnidazole (Fig. 11A and C). Ano2 is orthologous to human ANO2 and is expressed in various bodily regions.48 Our findings suggest that resveratrol could potentially restore olfactory function by regulating the metabolism of intestinal microbes in A53T transgenic mice. Additionally, dopamine receptors D1 (Drd1) were positively correlated with Rivastigmine (Fig. 11A and D). Drd1 is orthologous to human DRD1 and regulates spines in striatal direct-pathway and indirect-pathway neurons, with knockout Drd1 mice commonly used as models of PD.49 In conclusion, microbial metabolites were found to be correlated with host transcription regulation that is associated with Parkinson's disease progression.4. Discussion
The beneficial effects of resveratrol on health have been shown to be closely related to the alteration of gut microbiota composition and function, as well as metabolites.18,50,51 However, there is still a lack of experimental evidence that resveratrol improves Parkinson's disease by regulating intestinal microecology. Numerous investigations indicate that gut microbiota dysbiosis plays a significant role in PD pathogenesis.52,53 Meanwhile, more in vivo studies have shown that changes in gut microbiota could advance the early disease process of neurodegeneration in PD,54 and accelerate the neuropathology and motor dysfunction in a transgenic PD mouse model.6 Strikingly, a recent study revealed that the altered gut microbiota of A53T transgenic mice can be detected as early as 2 months old. However, neuropathology changes and motor deficits were only observed starting at 6 months old.39 As illustrated in our current research, the A53T transgenic mice had GI dysfunctions, intestinal barrier injury, hyposmia, motor deficits, and cognitive decline compared to the littermate control. Further histological analysis of the brain tissues revealed the degeneration of TH-positive cells (dopaminergic neurons), an increasing presence of activated microglia, and the cytoplasmic accumulation of α-Syn in the substantia nigra and striatum region of A53T transgenic mice, which is consistent with other studies.13,39,55 Conversely, GI function, intestinal barrier function, olfactory function, motor skills, and cognitive ability of A53T mice were significantly improved, and the number of dopaminergic neurons increased while activated microglia cells decreased after RES/RHSD treatment. Interestingly, RHSD was more effective than an equal dose of RES in improving motor and non-motor symptoms associated with PD, indicating HP-β-CD as a carrier in the formation of an amorphous inclusion complex seems to be a promising approach to improve the biological activity and bioavailability of resveratrol. Taken together, it is suggested that RHSD significantly improved motor and non-motor symptoms in A53T transgenic mice, which also supports the theory that resveratrol has potent neuroprotective effects.13,14,50,56 Furthermore, numerous investigations have demonstrated gut microbial dysbiosis and alterations of microbial metabolites in PD patients.40,57 Moreover, dietary polyphenols can improve the mucus layer, villus morphology, and tight junction protein levels in mice, and these functions have been shown to be related to the regulation of microbial flora composition and function.18,58 In conclusion, we speculate that the improvement of motor and non-motor symptoms of A53T mice by RHSD was related to the regulation of gut microbiota.Based on the above results, we deciphered the functional and metabolic profile of gut dysbiosis and explored the correlation and underlying mechanism between the gut microbial metabolites and host transcription regulation in A53T mice older than 10 months through multi-omics analyses. The metagenomic and metabolic profiling revealed that RHSD partially reversed α-Syn overexpression-induced changes of bacterial structure and function, as well as metabolism. Terpenoids and polyketides metabolism pathway, steroid hormone biosynthesis, and arginine and proline metabolism pathway may play important roles in the improvement of metabolic disorders by RHSD. We noticed that terpenoids and polyketides metabolism and amino acid metabolism were reduced in A53T mice and tended to be reversed by RHSD administration in metagenomic function analysis. Meanwhile, terpenoids and polyketides metabolism and amino acid metabolism were also significantly changed based on metabolites pathway enrichment analysis. In addition, two differentially changed metabolites, Leu-Ser-Asn and Leu-Gly-Val, are from the arginine and proline metabolism pathway. As we know, the metabolism of arginine is essential to repair the intestinal barrier.59 Our study also supports that microbial amino acid metabolism may serve as a potential mechanism link.60 Correlation analysis distinctly showed that the abnormally elevated metabolites such as Lithospermoside, 5-(Diphenylphosphinyl) pentanoic acid, Vinblastine, and Sulfadimethoxine in A53T mice were positively correlated with bacteria closely related to inflammation, such as Bordetella flabilis61 and Haemophilusmassiliensi.62 Other metabolites reversed by resveratrol were positively associated with anti-inflammatory and antioxidant stress-related microbes, such as Aanaerorhabdusfurcosus.63 These results suggest that RHSD can regulate the structure and metabolic function of the flora by selectively inhibiting or promoting the growth of different types of intestinal microorganisms, thereby promoting the health of an organism.57 At the same time, we noted that RHSD significantly upregulated the abundance of Lactobacillus_murinus and Lactobacillus_reuteri, and although their correlation with metabolites was not significant, the functions of Lactobacillus that can anti-inflammatory and repair intestinal mucosal barrier are known.46
Given that microbial metabolites function as one of the primary modes by which the gut microbiota exerts important and diverse effects on host physiology, we employed integrative analyses between microbial metabolites with transcriptome sequencing of host midbrain tissue to explore the possible pathway of the neuroprotective effect of resveratrol. Transcriptome analysis has revealed that RHSD reverses the abnormal expression of 11 genes, including Ano2, which is closely related to olfactory recovery. With RHSD administration, genes related to Olfactory transduction, Calcium signaling pathway, Dopaminergic synapse, and Serotonergic synapse were upregulated. Intriguingly, integrated analysis revealed that the upregulation of Ano2, Drd1, and Gm45702 correlated positively with the metabolites (Rivastigmine, Secnidazole, Leu-Ser-Asn) upregulated by RHSD, and negatively with the metabolite (Lithospermoside) downregulated by RHSD. On the contrary, the expression lever of Fdxr correlated negatively with the metabolites (Leu-Gly-Val) upregulated by RHSD and positively with the metabolite (Lithospermoside) downregulated by RHSD. Recent studies suggest that an FDXR mutation results in mitochondrial iron overload and associated depolarization of the mitochondrial membrane, which supports the hypothesis that FDXR affects mitochondrial iron homeostasis and leads to neurodegeneration.64 Lithospermoside is the only one of the differential metabolites detected that belongs to Hydrocarbon derivatives.
Numerous studies have found that resveratrol can improve survival rates and neurobehavioral deficits in PD models, especially when administered alongside its anti-inflammatory, antioxidant, and anti-apoptotic effects.13,14 However, resveratrol's poor water solubility and low bioavailability have limited its clinical applications. HP-β-CD is a chemical widely used to encapsulate phenolic compounds.15 Studies in the field of materials engineering have shown that polyvinylpyrrolidone and HP-β-CD nanofibers loaded with resveratrol can effectively improve the solubility and physicochemical properties of resveratrol. The resveratrol/HP-β-CD inclusion complex significantly inhibited Na+ and K+-ATPase activities and improved creatine kinase activity in Type 1 diabetes rats. We also encapsulated resveratrol with HP-β-CD, which has been shown to improve its water solubility, stability, and bioavailability.16 As aforementioned, RHSD was more effective than an equal dose of RES alone, indicating that HP-β-CD as an excipient can enhance the biological activity and bioavailability of resveratrol. Interestingly, preclinical and clinical data suggest that HP-β-CD can be used as an active pharmaceutical ingredient in the treatment of various neurological diseases,65 such as inhibition of intracellular cholesterol accumulation through plasma membrane interactions, which plays a beneficial role in Niemann-Pick type C disease,20,66 and the promising neuroprotective effect in Alzheimer's disease by cholesterol transport and Aβ clearance.21,67 While previous research has shown the neuroprotective effects of HP-β-CD in MPTP-induced PD mouse models by increasing the autophagy,22 further independent controlled trials are required to verify the neuroprotective effects of HP-β-CD in PD animal models. Moreover, whether HP-β-CD plays a neuroprotective role by regulating the composition and metabolism of intestinal microbiota is also a question worth exploring in the future.
Overall, we improved motor dysfunction and pathological progression of A53T mice by encapsulating resveratrol using HP-β-CD due to its poor absorption. Our study analyzed the effect of RHSD on the microbiome, metabolic profile, and host transcript profiles in A53T transgenic mice using a combination of metagenomics sequencing, LC-MS based metabolomics, and RNA sequencing analysis. Our results, as shown in Fig. 12, provides unequivocal evidence of the protective effects of resveratrol on an A53T transgenic PD mouse model. Further multi-omics analyses demonstrate that RHSD administration reverses the gut microbiota dysbiosis both gut microbiota composition and metabolism to protect the PD mouse model, in which suppression of the inflammation mediated by the harmful bacteria in the gut possibly plays a significant role. Moreover, we prove the significance of microbiota dysbiosis in α-Syn over expression-induced PD pathogenesis and supplement the underlying mechanisms of the microbiota–gut–brain axis in the development of PD. Further studies should be conducted to investigate the molecular mechanisms of the RHSD's effect on gut microbes and metabolites in PD.
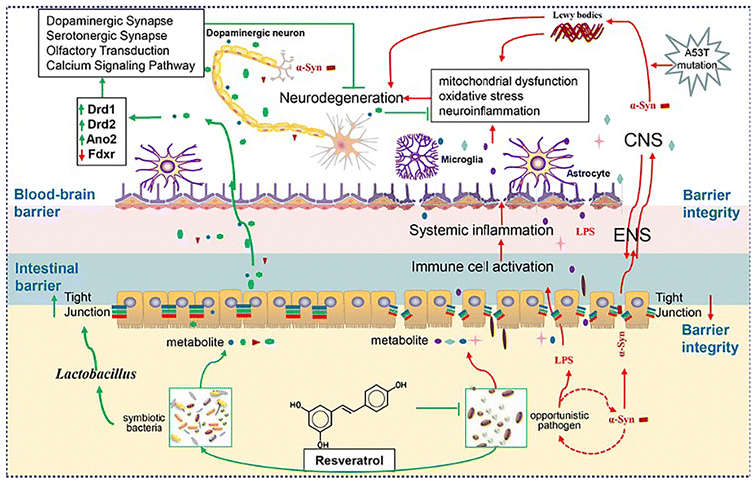 | ||
| Fig. 12 Schematic diagram of the protective effects of RHSD administration on the A53T transgenic Parkinson's disease mice through the microbiota–gut–brain axis. | ||
Author contributions
Ming Sang conceived of and designed the experiments. Shenglan Feng, Bingqing Qin, Junjie Ye, Lixia Xie, and Jianjun Gui performed the experiments. Xiaodong Sun and Ming Sang analyzed the data. Xiaodong Sun and Shenglan Feng wrote the manuscript. Ming Sang, Jianjun Gui and Lixia Xie revised the manuscript.Conflicts of interest
All authors declare that there is no conflict of interest.Data availability
The datasets of Metagenomic sequencing and RNA-sequencing in this study are available in the Sequence Read Archive (SRA) repository, https://www.ncbi.nlm.nih.gov/sra/PRJNA951464 and https://www.ncbi.nlm.nih.gov/sra/PRJNA948694. Metabolomics data have been deposited to the EMBL-EBI Metabolights database (MTBLS7625).Acknowledgements
This work was supported by grants from the Experimental Animal Resources Development and Utilization Project of Hubei Province of China (2020DFE025), the Innovative Team Project from the Institute of Medicine and Nursing at Hubei University of Medicine (2017YHKT02), the Foundation of Health Commission of Hubei Province (WJ2023M161), Hubei Science and Technology Project (2023BCB140), the Scientific and Technological Project of Xiangyang City of Hubei Province (2022YL27B), and Innovative Research Program for Graduates of Hubei University of Medicine (YC2022003, YC2022008, YC2023006). We are grateful thank Wuhan Metware Biotechnology Co., Ltd for assisting in sequencing and bioinformatics analysis.References
- A. Ascherio and M. A. Schwarzschild, The epidemiology of Parkinson's disease: risk factors and prevention, Lancet Neurol., 2016, 15, 1257–1272 CrossRef PubMed.
- W. Poewe, K. Seppi, C. M. Tanner, G. M. Halliday, P. Brundin, J. Volkmann, A. E. Schrag and A. E. Lang, Parkinson disease, Nat. Rev. Dis. Primers, 2017, 3, 17013 CrossRef PubMed.
- F. Soldner, Y. Stelzer, C. S. Shivalila, B. J. Abraham, J. C. Latourelle, M. I. Barrasa, J. Goldmann, R. H. Myers, R. A. Young and R. Jaenisch, Parkinson-associated risk variant in distal enhancer of alpha-synuclein modulates target gene expression, Nature, 2016, 533, 95–99 CrossRef CAS PubMed.
- H. A. Lashuel, C. R. Overk, A. Oueslati and E. Masliah, The many faces of alpha-synuclein: from structure and toxicity to therapeutic target, Nat. Rev. Neurosci., 2013, 14, 38–48 CrossRef CAS PubMed.
- Y. Niu, X. Guo, Y. Chen, C. E. Wang, J. Gao, W. Yang, Y. Kang, W. Si, H. Wang, S. H. Yang, S. Li, W. Ji and X. J. Li, Early Parkinson's disease symptoms in alpha-synuclein transgenic monkeys, Hum. Mol. Genet., 2015, 24, 2308–2317 CrossRef CAS PubMed.
- T. R. Sampson, J. W. Debelius, T. Thron, S. Janssen, G. G. Shastri, Z. E. Ilhan, C. Challis, C. E. Schretter, S. Rocha, V. Gradinaru, M. F. Chesselet, A. Keshavarzian, K. M. Shannon, R. Krajmalnik-Brown, P. Wittung-Stafshede, R. Knight and S. K. Mazmanian, Gut Microbiota Regulate Motor Deficits and Neuroinflammation in a Model of Parkinson’s Disease, Cell, 2016, 167, 1469–1480.e12 CrossRef CAS PubMed.
- Y. Yan, S. Ren, Y. Duan, C. Lu, Y. Niu, Z. Wang, B. Inglis, W. Ji, Y. Zheng and W. Si, Gut microbiota and metabolites of alpha-synuclein transgenic monkey models with early stage of Parkinson's disease, npj Biofilms Microbiomes, 2021, 7, 69 CrossRef CAS PubMed.
- A. Fasano, N. P. Visanji, L. W. Liu, A. E. Lang and R. F. Pfeiffer, Gastrointestinal dysfunction in Parkinson's disease, Lancet Neurol., 2015, 14, 625–639 CrossRef CAS PubMed.
- E. Anis, A. Xie, L. Brundin and P. Brundin, Digesting recent findings: gut alpha-synuclein, microbiome changes in Parkinson's disease, Trends Endocrinol. Metab., 2022, 33, 147–157 CrossRef CAS PubMed.
- M. J. Armstrong and M. S. Okun, Diagnosis and Treatment of Parkinson Disease: A Review, J. Am. Med. Assoc., 2020, 323, 548–560 CrossRef PubMed.
- W. Marx, J. T. Kelly, S. Marshall, J. Cutajar, B. Annois, A. Pipingas, A. Tierney and C. Itsiopoulos, Effect of resveratrol supplementation on cognitive performance and mood in adults: a systematic literature review and meta-analysis of randomized controlled trials, Nutr. Rev., 2018, 76, 432–443 CrossRef PubMed.
- C. F. Su, L. Jiang, X. W. Zhang, A. Iyaswamy and M. Li, Resveratrol in Rodent Models of Parkinson's Disease: A Systematic Review of Experimental Studies, Front. Pharmacol., 2021, 12, 644219 CrossRef CAS PubMed.
- L. F. Zhang, X. L. Yu, M. Ji, S. Y. Liu, X. L. Wu, Y. J. Wang and R. T. Liu, Resveratrol alleviates motor and cognitive deficits and neuropathology in the A53T alpha-synuclein mouse model of Parkinson's disease, Food Funct., 2018, 9, 6414–6426 RSC.
- E. Tellone, A. Galtieri, A. Russo, B. Giardina and S. Ficarra, Resveratrol: A Focus on Several Neurodegenerative Diseases, Oxid. Med. Cell. Longevity, 2015, 2015, 392169 Search PubMed.
- D. Escobar-Avello, J. Avendano-Godoy, J. Santos, J. Lozano-Castellon, C. Mardones, D. von Baer, J. Luengo, R. M. Lamuela-Raventos, A. Vallverdu-Queralt and C. Gomez-Gaete, Encapsulation of Phenolic Compounds from a Grape Cane Pilot-Plant Extract in Hydroxypropyl Beta-Cyclodextrin and Maltodextrin by Spray Drying, Antioxidants, 2021, 10, 1130 CrossRef CAS PubMed.
- X. Hao, X. Sun, H. Zhu, L. Xie, X. Wang, N. Jiang, P. Fu and M. Sang, Hydroxypropyl-beta-Cyclodextrin-Complexed Resveratrol Enhanced Antitumor Activity in a Cervical Cancer Model: In Vivo Analysis, Front. Pharmacol., 2021, 12, 573909 CrossRef CAS PubMed.
- A. Chaplin, C. Carpene and J. Mercader, Resveratrol, Metabolic Syndrome, and Gut Microbiota, Nutrients, 2018, 10, 1651 CrossRef PubMed.
- T. T. Cai, X. L. Ye, R. R. Li, H. Chen, Y. Y. Wang, H. J. Yong, M. L. Pan, W. Lu, Y. Tang, H. Miao, A. M. Snijders, J. H. Mao, X. Y. Liu, Y. B. Lu and D. F. Ding, Resveratrol Modulates the Gut Microbiota and Inflammation to Protect Against Diabetic Nephropathy in Mice, Front. Pharmacol., 2020, 11, 1249 CrossRef CAS PubMed.
- J. Tao, Y. An, L. Xu, Y. Wang, C. Wang, P. Li, M. Li, D. Yan, M. Wang, G. Zhong and M. Wu, The protective role of microbiota in the prevention of MPTP/P-induced Parkinson's disease by resveratrol, Food Funct., 2023, 14, 4647–4661 RSC.
- Y. Tanaka, Y. Yamada, Y. Ishitsuka, M. Matsuo, K. Shiraishi, K. Wada, Y. Uchio, Y. Kondo, T. Takeo, N. Nakagata, T. Higashi, K. Motoyama, H. Arima, S. Mochinaga, K. Higaki, K. Ohno and T. Irie, Efficacy of 2-Hydroxypropyl-beta-cyclodextrin in Niemann-Pick Disease Type C Model Mice and Its Pharmacokinetic Analysis in a Patient with the Disease, Biol. Pharm. Bull., 2015, 38, 844–851 CrossRef CAS PubMed.
- J. Yao, D. Ho, N. Y. Calingasan, N. H. Pipalia, M. T. Lin and M. F. Beal, Neuroprotection by cyclodextrin in cell and mouse models of Alzheimer disease, J. Exp. Med., 2012, 209, 2501–2513 CrossRef CAS PubMed.
- J. Jarazo, K. Barmpa, J. Modamio, C. Saraiva, S. Sabate-Soler, I. Rosety, A. Griesbeck, F. Skwirblies, G. Zaffaroni, L. M. Smits, J. Su, J. Arias-Fuenzalida, J. Walter, G. Gomez-Giro, A. S. Monzel, X. Qing, A. Vitali, G. Cruciani, I. Boussaad, F. Brunelli, C. Jager, A. Rakovic, W. Li, L. Yuan, E. Berger, G. Arena, S. Bolognin, R. Schmidt, C. Schroder, P. M. A. Antony, C. Klein, R. Kruger, P. Seibler and J. C. Schwamborn, Parkinson's Disease Phenotypes in Patient Neuronal Cultures and Brain Organoids Improved by 2-Hydroxypropyl-beta-Cyclodextrin Treatment, Mov. Disord., 2022, 37, 80–94 CrossRef CAS PubMed.
- J. Zha, X. M. Liu, J. Zhu, S. Y. Liu, S. Lu, P. X. Xu, X. L. Yu and R. T. Liu, A scFv antibody targeting common oligomeric epitope has potential for treating several amyloidoses, Sci. Rep., 2016, 6, 36631 CrossRef CAS PubMed.
- A. Abeliovich and A. D. Gitler, Defects in trafficking bridge Parkinson's disease pathology and genetics, Nature, 2016, 539, 207–216 CrossRef PubMed.
- M. Stanojlovic, J. P. Pallais, M. K. Lee and C. M. Kotz, Pharmacological and chemogenetic orexin/hypocretin intervention ameliorates Hipp-dependent memory impairment in the A53T mice model of Parkinson's disease, Mol. Brain, 2019, 12, 87 CrossRef PubMed.
- I. S. C. D. van and P. Derkinderen, The Intestinal Barrier in Parkinson's Disease: Current State of Knowledge, J. Parkinson's Dis., 2019, 9, S323–S329 Search PubMed.
- J. K. Y. Tse, Gut Microbiota, Nitric Oxide, and, Microglia as Prerequisites for Neurodegenerative Disorders, ACS Chem. Neurosci., 2017, 8, 1438–1447 CrossRef CAS PubMed.
- J. Laranjinha, C. Nunes, A. Ledo, C. Lourenco, B. Rocha and R. M. Barbosa, The Peculiar Facets of Nitric Oxide as a Cellular Messenger: From Disease-Associated Signaling to the Regulation of Brain Bioenergetics and Neurovascular Coupling, Neurochem. Res., 2021, 46, 64–76 CrossRef CAS PubMed.
- M. G. Stokholm, E. H. Danielsen, S. J. Hamilton-Dutoit and P. Borghammer, Pathological alpha-synuclein in gastrointestinal tissues from prodromal Parkinson disease patients, Ann. Neurol., 2016, 79, 940–949 CrossRef CAS PubMed.
- M. Rao and M. D. Gershon, The bowel and beyond: the enteric nervous system in neurological disorders, Nat. Rev. Gastroenterol. Hepatol., 2016, 13, 517–528 CrossRef CAS PubMed.
- D. Hilton, M. Stephens, L. Kirk, P. Edwards, R. Potter, J. Zajicek, E. Broughton, H. Hagan and C. Carroll, Accumulation of alpha-synuclein in the bowel of patients in the pre-clinical phase of Parkinson's disease, Acta Neuropathol., 2014, 127, 235–241 CrossRef CAS PubMed.
- J. M. Woulfe, M. T. Gray and G. Munoz, Colonic mucosal alpha-synuclein lacks specificity as a biomarker for Parkinson disease, Neurology, 2015, 85, 834 CrossRef PubMed.
- P. J. Hallett, J. R. McLean, A. Kartunen, J. W. Langston and O. Isacson, alpha-Synuclein overexpressing transgenic mice show internal organ pathology and autonomic deficits, Neurobiol. Dis., 2012, 47, 258–267 CrossRef CAS PubMed.
- C. C. Bain, A. Bravo-Blas, C. L. Scott, E. G. Perdiguero, F. Geissmann, S. Henri, B. Malissen, L. C. Osborne, D. Artis and A. M. Mowat, Constant replenishment from circulating monocytes maintains the macrophage pool in the intestine of adult mice, Nat. Immunol., 2014, 15, 929–937 CrossRef CAS PubMed.
- W. Chen, D. Liu, C. Ren, X. Su, C. K. Wong and R. Yang, A Special Network Comprised of Macrophages, Epithelial Cells, and Gut Microbiota for Gut Homeostasis, Cells, 2022, 11, 307 CrossRef CAS PubMed.
- O. Vesely, S. Baldovska and A. Kolesarova, Enhancing Bioavailability of Nutraceutically Used Resveratrol and Other Stilbenoids, Nutrients, 2021, 13, 3095 CrossRef CAS PubMed.
- Q. Wang, Y. Luo, K. Ray Chaudhuri, R. Reynolds, E. K. Tan and S. Pettersson, The role of gut dysbiosis in Parkinson's disease: mechanistic insights and therapeutic options, Brain, 2021, 144, 2571–2593 CrossRef PubMed.
- Y. Fan and O. Pedersen, Gut microbiota in human metabolic health and disease, Nat. Rev. Microbiol., 2021, 19, 55–71 CrossRef CAS PubMed.
- F. Liang, C. Y. Chen, Y. P. Li, Y. C. Ke, E. P. Ho, C. F. Jeng, C. H. Lin and S. K. Chen, Early Dysbiosis and Dampened Gut Microbe Oscillation Precede Motor Dysfunction and Neuropathology in Animal Models of Parkinson’s Disease, J. Parkinson’s Dis., 2022, 12, 2423–2440, DOI:10.3233/JPD-223431.
- M. S. Cirstea, A. C. Yu, E. Golz, K. Sundvick, D. Kliger, N. Radisavljevic, L. H. Foulger, M. Mackenzie, T. Huan, B. B. Finlay and S. Appel-Cresswell, Microbiota Composition and Metabolism Are Associated With Gut Function in Parkinson's Disease, Mov. Disord., 2020, 35, 1208–1217 CrossRef CAS PubMed.
- Y. Liang, L. Cui, J. Gao, M. Zhu, Y. Zhang and H. L. Zhang, Gut Microbial Metabolites in Parkinson's Disease: Implications of Mitochondrial Dysfunction in the Pathogenesis and Treatment, Mol. Neurobiol., 2021, 58, 3745–3758 CrossRef CAS PubMed.
- J. Guo, Y. Yuan, D. Lu, B. Du, L. Xiong, J. Shi, L. Yang, W. Liu, X. Yuan, G. Zhang and F. Wang, Two natural products, trans-phytol and (22E)-ergosta-6,9,22-triene-3beta,5alpha,8alpha-triol, inhibit the biosynthesis of estrogen in human ovarian granulosa cells by aromatase (CYP19), Toxicol. Appl. Pharmacol., 2014, 279, 23–32 CrossRef CAS PubMed.
- J. R. Strawn, J. A. Mills, H. Schroeder, S. A. Mossman, S. T. Varney, L. B. Ramsey, E. A. Poweleit, Z. Desta, K. Cecil and M. P. DelBello, Escitalopram in Adolescents With Generalized Anxiety Disorder: A Double-Blind, Randomized, Placebo-Controlled Study, J. Clin. Psychiatry, 2020, 81 DOI:10.4088/JCP.20m13396.
- T. H. Y. Tan, S. M. Tham and P. A. Tambyah, Arcobacter Butzleri in an AIDS Patient, Case Rep. Infect. Dis., 2022, 2022, 6983094 Search PubMed.
- C. Ruiz de Alegria Puig, M. Fernandez Martinez, D. Pablo Marcos, J. Aguero Balbin and J. Calvo Montes, Outbreak of Arcobacter butzleri? An emerging enteropathogen, Enferm. Infecc. Microbiol. Clin., 2023, 41, 169–172 CrossRef.
- Q. Mu, H. Zhang, X. Liao, K. Lin, H. Liu, M. R. Edwards, S. A. Ahmed, R. Yuan, L. Li, T. E. Cecere, D. B. Branson, J. L. Kirby, P. Goswami, C. M. Leeth, K. A. Read, K. J. Oestreich, M. D. Vieson, C. M. Reilly and X. M. Luo, Control of lupus nephritis by changes of gut microbiota, Microbiome, 2017, 5, 73 CrossRef PubMed.
- J. Slone, Y. Peng, A. Chamberlin, B. Harris, J. Kaylor, M. T. McDonald, M. Lemmon, M. A. El-Dairi, D. Tchapyjnikov, L. A. Gonzalez-Krellwitz, E. A. Sellars, A. McConkie-Rosell, L. G. Reinholdt and T. Huang, Biallelic mutations in FDXR cause neurodegeneration associated with inflammation, J. Hum. Genet., 2018, 63, 1211–1222 CrossRef PubMed.
- A. B. Stephan, E. Y. Shum, S. Hirsh, K. D. Cygnar, J. Reisert and H. Zhao, ANO2 is the cilial calcium-activated chloride channel that may mediate olfactory amplification, Proc. Natl. Acad. Sci. U. S. A., 2009, 106, 11776–11781 CrossRef CAS PubMed.
- L. M. Suarez, O. Solis, A. Sanz-Magro, S. Alberquilla and R. Moratalla, Dopamine D1 Receptors Regulate Spines in Striatal Direct-Pathway and Indirect-Pathway Neurons, Mov. Disord., 2020, 35, 1810–1821 CrossRef CAS PubMed.
- C. Grinan-Ferre, A. Bellver-Sanchis, V. Izquierdo, R. Corpas, J. Roig-Soriano, M. Chillon, C. Andres-Lacueva, M. Somogyvari, C. Soti, C. Sanfeliu and M. Pallas, The pleiotropic neuroprotective effects of resveratrol in cognitive decline and Alzheimer's disease pathology: From antioxidant to epigenetic therapy, Ageing Res Rev, 2021, 67, 101271 CrossRef CAS PubMed.
- A. D. Inchingolo, G. Malcangi, A. M. Inchingolo, F. Piras, V. Settanni, G. Garofoli, G. Palmieri, S. Ceci, A. Patano, N. De Leonardis, C. Di Pede, V. Montenegro, D. Azzollini, M. G. Garibaldi, Z. Kruti, A. Tarullo, G. Coloccia, A. Mancini, B. Rapone, A. Semjonova, D. Hazballa, M. T. D’Oria, M. Jones, L. Macchia, I. R. Bordea, A. Scarano, F. Lorusso, G. M. Tartaglia, C. Maspero, M. Del Fabbro, L. Nucci, K. Ferati, A. B. Ferati, N. Brienza, A. Corriero, F. Inchingolo and G. Dipalma, Benefits and Implications of Resveratrol Supplementation on Microbiota Modulations: A Systematic Review of the Literature, Int. J. Mol. Sci., 2022, 23, 4027 CrossRef CAS PubMed.
- E. M. Hill-Burns, J. W. Debelius, J. T. Morton, W. T. Wissemann, M. R. Lewis, Z. D. Wallen, S. D. Peddada, S. A. Factor, E. Molho, C. P. Zabetian, R. Knight and H. Payami, Parkinson's disease and Parkinson's disease medications have distinct signatures of the gut microbiome, Mov. Disord., 2017, 32, 739–749 CrossRef CAS PubMed.
- J. F. Cryan, K. J. O'Riordan, K. Sandhu, V. Peterson and T. G. Dinan, The gut microbiome in neurological disorders, Lancet Neurol., 2020, 19, 179–194 CrossRef CAS PubMed.
- M. C. Houser and M. G. Tansey, The gut-brain axis: is intestinal inflammation a silent driver of Parkinson’s disease pathogenesis?, NPJ. Parkinson’s Dis., 2017, 3, 3 CrossRef PubMed.
- R. Sirabella, M. J. Sisalli, G. Costa, K. Omura, G. Ianniello, A. Pinna, M. Morelli, G. M. Di Renzo, L. Annunziato and A. Scorziello, NCX1 and NCX3 as potential factors contributing to neurodegeneration and neuroinflammation in the A53T transgenic mouse model of Parkinson's Disease, Cell Death Dis., 2018, 9, 725 CrossRef PubMed.
- M. G. Dos Santos, L. E. Schimith, C. Andre-Miral, A. L. Muccillo-Baisch, B. D. Arbo and M. A. Hort, Neuroprotective Effects of Resveratrol in In vivo and In vitro Experimental Models of Parkinson's Disease: a Systematic Review, Neurotoxic. Res., 2022, 40, 319–345 CrossRef CAS PubMed.
- M. F. Sun and Y. Q. Shen, Dysbiosis of gut microbiota and microbial metabolites in Parkinson's Disease, Ageing Res. Rev., 2018, 45, 53–61 CrossRef CAS PubMed.
- P. Wang, J. Gao, W. Ke, J. Wang, D. Li, R. Liu, Y. Jia, X. Wang, X. Chen, F. Chen and X. Hu, Resveratrol reduces obesity in high-fat diet-fed mice via modulating the composition and metabolic function of the gut microbiota, Free Radicals Biol. Med., 2020, 156, 83–98 CrossRef CAS PubMed.
- A. Nakamura, S. Kurihara, D. Takahashi, W. Ohashi, Y. Nakamura, S. Kimura, M. Onuki, A. Kume, Y. Sasazawa, Y. Furusawa, Y. Obata, S. Fukuda, S. Saiki, M. Matsumoto and K. Hase, Symbiotic polyamine metabolism regulates epithelial proliferation and macrophage differentiation in the colon, Nat. Commun., 2021, 12, 2105 CrossRef CAS PubMed.
- Y. Zhang, X. He, Y. Qian, S. Xu, C. Mo, Z. Yan, X. Yang and Q. Xiao, Plasma branched-chain and aromatic amino acids correlate with the gut microbiota and severity of Parkinson's disease, NPJ Parkinsons Dis., 2022, 8, 48 CrossRef CAS PubMed.
- P. A. Vandamme, C. Peeters, M. Cnockaert, E. Inganas, E. Falsen, E. R. B. Moore, O. C. Nunes, C. M. Manaia, T. Spilker and J. J. LiPuma, Bordetella bronchialis sp. nov., Bordetella flabilis sp. nov. and Bordetella sputigena sp. nov., isolated from human respiratory specimens, and reclassification of Achromobacter sediminum Zhang, et al. 2014 as Verticia sediminum gen. nov., comb. nov, Int. J. Syst. Evol. Microbiol., 2015, 65, 3674–3682 CrossRef CAS PubMed.
- C. I. Lo, S. A. Sankar, B. Fall, B. Sambe-Ba, S. Diawara, M. W. Gueye, O. Mediannikov, C. Blanc-Tailleur, B. Wade, D. Raoult, P. E. Fournier and F. Fenollar, High-quality draft genome sequence and description of Haemophilus massiliensis sp. nov, Stand. Genomic Sci., 2016, 11, 31 CrossRef PubMed.
- H. Kim, T. Park, I. Kwon and J. Seo, Specific inhibition of Streptococcus bovis by endolysin LyJH307 supplementation shifts the rumen microbiota and metabolic pathways related to carbohydrate metabolism, J. Anim. Sci. Biotechnol., 2021, 12, 93 CrossRef CAS PubMed.
- J. D. Slone, L. Yang, Y. Peng, L. F. Queme, B. Harris, S. J. S. Rizzo, T. Green, J. L. Ryan, M. P. Jankowski, L. G. Reinholdt and T. Huang, Integrated analysis of the molecular pathogenesis of FDXR-associated disease, Cell Death Dis., 2020, 11, 423 CrossRef CAS PubMed.
- M. Vecsernyes, F. Fenyvesi, I. Bacskay, M. A. Deli, L. Szente and E. Fenyvesi, Cyclodextrins, blood-brain barrier, and treatment of neurological diseases, Arch. Med. Res., 2014, 45, 711–729 CrossRef CAS PubMed.
- A. Cougnoux, M. R. Pergande, F. Serna-Perez and S. M. Cologna, Investigation of 2-Hydroxypropyl-beta-Cyclodextrin Treatment in a Neuronal-Like Cell Model of Niemann-Pick Type C Using Quantitative Proteomics, J. Am. Soc. Mass Spectrom., 2023, 34, 668–675 CrossRef CAS PubMed.
- Y. Ishitsuka, T. Irie and M. Matsuo, Cyclodextrins applied to the treatment of lysosomal storage disorders, Adv. Drug Delivery Rev., 2022, 191, 114617 CrossRef CAS PubMed.
Footnotes |
| † Electronic supplementary information (ESI) available. See DOI: https://doi.org/10.1039/d3fo03667g |
| ‡ These authors contributed equally to this work. |
| This journal is © The Royal Society of Chemistry 2024 |

