 Open Access Article
Creative Commons Attribution 3.0 Unported Licence
AI and CV based 2D-CNN algorithm: botanical authentication of Indian honey
Dilpreet Singh
Brar
 *a,
Ashwani Kumar
Aggarwal
b,
Vikas
Nanda
a,
Sudhanshu
Saxena
c and
Satyendra
Gautam
cd
aDepartment of Food Engineering and Technology, Sant Longowal Institute of Engineering and Technology, Longowal, 148106, Punjab, India. E-mail: singhdilpreetbrar98@gmail.com
bDepartment of Electrical and Instrumentation Engineering, Sant Longowal Institute of Engineering and Technology, Longowal, 148106, Punjab, India
cFood Technology Division, Bhabha Atomic Research Centre, Trombay, Mumbai-85, India
dHomi Bhabha National Institute, Anushaktinagar, Mumbai-94, India
First published on 6th November 2023
Abstract
The market and aesthetic value of honey relies on the source of nectar collected by a honeybee from a specific flower, and the authenticity of honey based on botanical origin is of prime concern in the market. A deep learning framework based on the 2D-CNN model was used for the botanical authentication of Indian unifloral honey varieties. An inexpensive and robust analysis methodology based on computer vision (CV) was fabricated to determine the botanical authentication of honey varieties. The required .mp4 videos were recorded using a camera fixed on a stand with an adjustable distance. The developed model was trained using images which were extracted from the captured .mp4. The extracted data set of images for classification was fed to a developed 2D-CNN which was further validated using various performance metrics, namely, accuracy, precision, specificity, F1-score, and AUC-ROC. The value of AUC-ROC was more than 0.98 for most classes of unifloral honey varieties used for classification. The obtained results demonstrated that this experimental approach, in amalgamation with the developed 2D-CNN model, outperforms the existing algorithms used for evaluating food quality attributes. Henceforth, this novel approach would positively benefit the honey industry and the honey consumer regarding honey authentication—moreover, it encourages researchers to exploit this application of hybridised technology in food quality assurance and control.
Sustainability spotlightThis research is an innovation in technology to tackle the honey authentication problem in the market to support honey producers and consumers. The proposed work is based on a deep learning method for determining the botanical origin of honey. A very cheap, simple, and promising technology is proposed in this research. This work will solve the issue of honey authentication, which is directly related to food quality and security around the world. Moreover, the AI-based methods for botanical classification of honey will support small farmers to state the production of unifloral honey to get a higher price, and results of this study demonstrate that this application can take the food quality evaluation as an advancement in Food Industry 4.0. |
1. Introduction
Honey is a naturally sweet substance produced from the secretions of the honeybee. The bees collect nectar from single or multiple flowering sources, flow by enzymatic breakdown into simple sugars, and mature it in the bee hive, followed by honey harvesting.1 The botanical source (pollen count) determines the honey varieties, as honey produced from the nectar of two or more flowers is categorised as multi-floral, and if the pollen grain from one single flower contributes more than 45% to the total it is considered unifloral honey as described by Honey Commission Delegated Regulation (EU) PDO-PT-0268-AM01.2 Therefore, honey's absolute value depends on the source of nectar from which a bee produces the honey.3Authentication of a food product is an exercise in which the food has compatibility with described standards.4 In the case of honey authentication, this term refers to true botanical and geographical origin and is free from any adulteration with sugar syrups and low-grade honey.5 Therefore, the botanical origin is the primary parameter determining the economical cost of the honey variety in the market. Furthermore, the unique bioactive composition of nectar collected by a bee from a specific flower adds peculiar value to the unifloral honey, which increases the market cost of the unifloral varieties in contrast to multifloral honey.6 India has diversity in flora due to distinct climatic zones and seasons7—thanks to the diversity in floral sources and the hard work of the migratory beekeepers of the nation, a plethora of unifloral varieties have been produced in the nation with different therapeutic properties.8,9 In addition, due to the limited production, extensive demand and high cost, the unifloral honey varieties have been extensively targeted for economically motivated adulteration.10 Primarily, cheap or low-grade honey has been used to increase volume and mimic the colour of specific unifloral honey varieties. In addition, illegitimate labelling is done by many processors to delude customers and sell unethical honey in the market.5 Whilst people have been increasing their concern about honey authenticity, this has only been based on sugar syrup adulteration, they have been entirely nescient regarding the botanical authenticity of honey.11,12
Conventional and contemporary methodologies used for honey authentication based on botanical origin are pollen analyses (Melissopalynology) and the detection of specific biomarkers (using DNA methods, HPLC, SCIR, FTIR, NMR, Hyperspectral Image system).3,13 However, these sophisticated technologies are expensive, require operational experts and lack feasibility for widespread application (out of reach for many producers as well as research labs). All these disadvantages of present technology raise a need to develop robust, proficient, and economical methods which can be accessible to every honey handler, whether he is a producer or a consumer.5,13 In the last few years, the application of Artificial Intelligence (AI) based technology has increased in the domain of food science and technology. Various sensors based on feature learning algorithms have been developed for food quality evaluation.14,15 This approach has been evolving as the researchers have shown interest in improving existing models like CNN, ANN etc. As a result, these models have become more robust, economical and accessible.16 Recently a new technology based on computer vision science has been prevailing in different domains of science, and even is successful in quality evaluation of agricultural produce.17 The computer vision (CV) science using image classification based on a 2D-CNN algorithm has been used in a limited way in the determination of food authentication based on geographical origin, botanical origin, process parameter control etc. moreover, the existing technology need more exploitation for the uplifting of food safety and security throughout the globe.18,19
In food quality evaluation, data based on hyperspectral images were used to classify specific quality attributes, for instance, adulteration in honey, milk, and meat. Therefore, the data generated from the HSI (hyperspectral imaging) camera needs a high profile computing system.20 These methods are undoubtedly accurate but expensive in terms of instrumental and operational costs. Moreover, the CNN models used for the classification of food authentication were slow and had low accuracy. Therefore, an improved, robust algorithm is required for data processing which would be extremely accurate in terms of classification.13,21 The proposed research is based on developing a cheap and reliable feature-learning algorithm for honey authentication based on botanical origin based on a computer vision technology. In this work, a generalised programme was written using python as a scripting language in Google Colab, which automatically processes the input data as a video clip and shows the final results. To date, no such robust method based on the 2D-CNN algorithm has been available at the industrial and commercial level for honey authentication. Therefore, this study aims to develop an accessible AI-based honey authentication method to aid the honey market at the global level. Furthermore, this work will encourage other field researchers to exploit this approach for food quality evaluation so that every person can evaluate the quality of their food.
2. Methods and materials
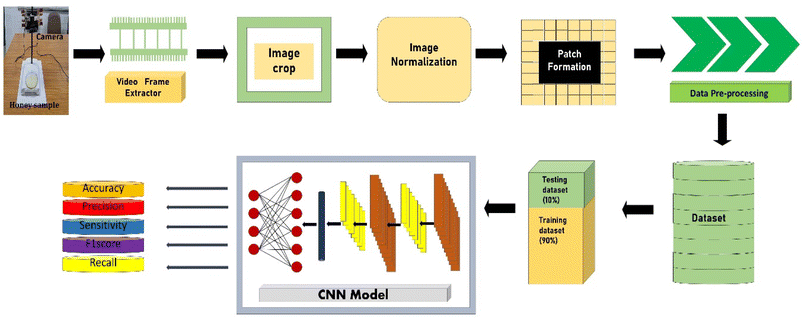
The proposed method works on the framework as shown in Fig. 1.2.1. Sample preparation
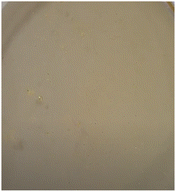
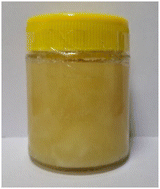
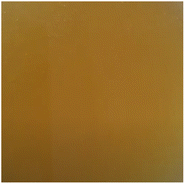
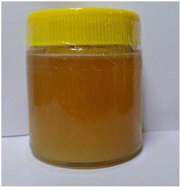
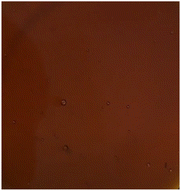
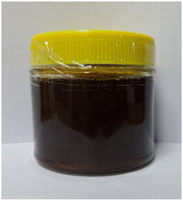
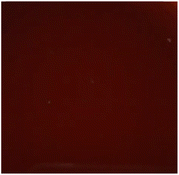
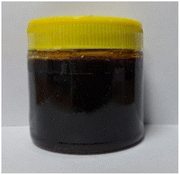
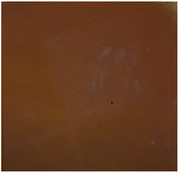
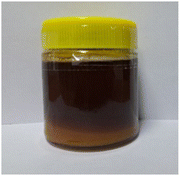
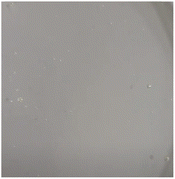
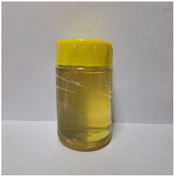
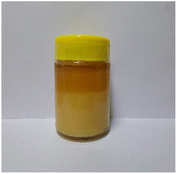
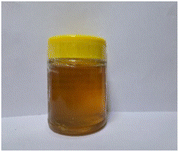
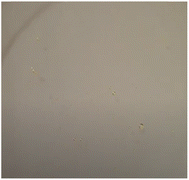
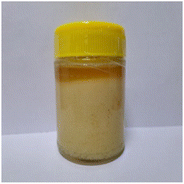
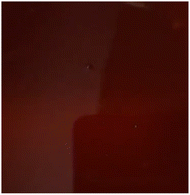
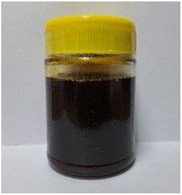
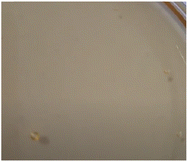
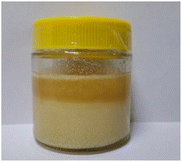
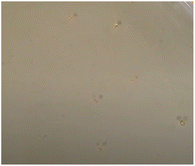
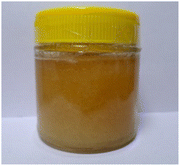
The analyses were performed on different unifloral honey varieties produced in India. Fourteen unifloral honey samples were procured from different geographical locations across India for determination of honey sample authenticity based on botanical origin. The pollen percentage analyses were performed using the melissopalynology technique (unifloral honey >45% pollen from a single botanical source).22 The honey was heated up to 45 °C with continuous stirring for uniform heat transfer to melt down the honey crystals. This is important to get uniform and better data for processing in the model. The honey samples used for classification based on botanical authentication are shown in Table 1. The 14 unifloral and multi-floral honey varieties were tagged as classes from 1 to 14.| Class of sample | Common name of honey | Botanical source and pollen percentage | Image | Raw honey |
|---|---|---|---|---|
| a Different varieties of Indian honey are coded as different classess from 1 to 14 as shown in above table. The pollen percentage of unifloral varieties is mentioned along with botanical source. | ||||
| 1 | Apple honey | Malus domestica (83%) |
|
|
| 2 | Muskmelon | Cucumis melo (65%) |
|
|
| 3 | Jammun | Syzygium cumini (67%) |
|
|
| 4 | Stinless bee honey | Multi-floral |
|
|
| 5 | Wilde bee honey | Multi-floral |
|
|
| 6 | Acacia (Kashmir) | Acacia torta (78%) |
|
|
| 7 | Spiti vally honey | Multi-floral |
|
|
| 8 | Plectranthus/forest spurflower | Plectranthus fruticosus (79%) |
|
|
| 9 | Apricot | Prunus armeniaca (62%) |
|
|
| 10 | Thyme | Thymus vulgaris (80%) |
|
|
| 11 | Phari kikar | Acacia Karoo (69%) |
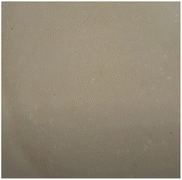
|
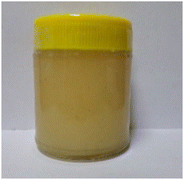
|
| 12 | Jand | Prosopis cineraria (59%) |
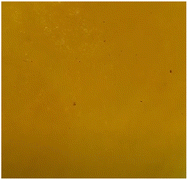
|
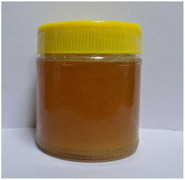
|
| 13 | Litchi | Litchi chinensis (77%) |
|
|
| 14 | Sarso/mustard | Brassica (89%) |
|
|
2.2. Experimental setup
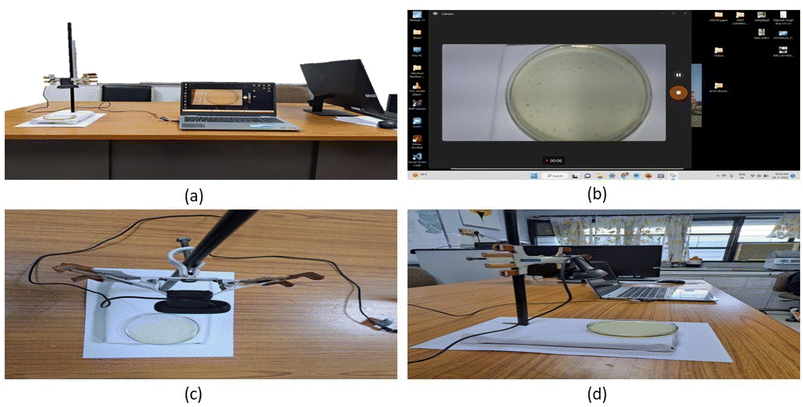
The honey sample was taken in a 25 ml Petri plate (Make-Boro 3.3 by ABC India). The data generation for training and testing of the model was done by extracting image data from an .mp4 video recorded by a fixed camera on a stand. The sample was kept under that camera at a 15–20 cm gap, adjustable according to the focus required. The size of the image captured by the camera was 1440 × 1440 × 3, with a frame rate of 30 per second and a total of 300 frames were captured for each sample of the test. Controlled atmosphere was used to record the video so that minimum hindrances were caused by light, temperature (25 °C) and relative humidity (30%). The experimental setup is shown in Fig. 2.2.3. Data pre-processing
The image frames were extracted from the captured video sequences. The extracted frames were cropped into uniform dimensions (1440 × 1440 × 3) to reduce the chances of error and increase the model's accuracy. The primary function of cropping the image is to shred the boundary pixels and convert the image's dimension so that the image would be a multiple of 32 × 32 × 3. Here in the model, the frame size used for training and testing is 32. The video frames Va, were cropped into the image Vc as shown in eqn (1).| Vc(i,j) = Va(i − δx, j − δy) | (1) |
| V(i,j) = Vc(i − pα, j − qα) | (2) |
The CNN-based deep learning model is not much used for honey authentication. The existing 2-D CNN model used for image processing for classification had a complex processing algorithm, this was slow and needed more innovation to improve the classification accuracy. Due to this, an efficient methodology is required for data processing. Henceforth, to get the high classification ability of the model, researchers need to design and develop their own robust, economical, and feasible models.18,23,24
2.4. Model architecture
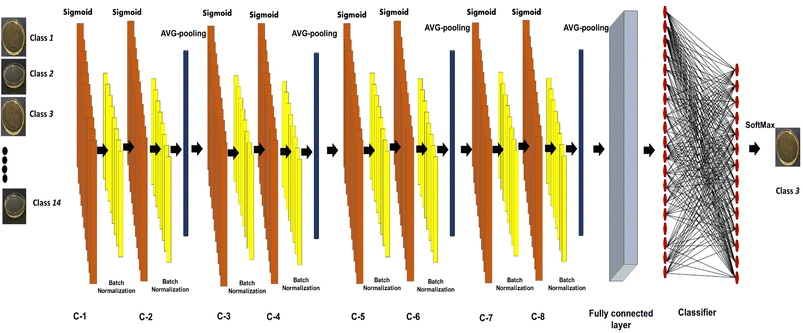
The presented model uses a feature learning algorithm with 8 convolutional layers. After each convolutional layer (parameter 147584), batch normalisation (parameter 512) is carried out, meaning eight batch normalisation layers exist. After two consecutive convolutional and batch normalisation layers, a pooling (Maxpooling (16 × 16 × 32)) layer is fitted, a total of 4 Maxpooling layers were used in this model. Each layer in the set of 8 layers performs the task of extracting features in a hierarchical way, the first layer is responsible for extracting the simplest features whereas the last layer, that is the eighth layer, extracts the most complex features in the honey samples. The reason for selecting 8 layers is based on the adequate overlapping of the probability density function for the honey samples under consideration. The input of the patches' spatial and temporal dependencies was fed to the convolutional layer, consisting of a 5 × 5 × 1 kernel size and stride of 1. Eqn (3) was used as the convolutional operation. The size of the convolved image is reduced by using the Avg-pooling layer. The Avg-pooling improves the model robustness against position variation and rotation by reducing the dimensionality. Moreover, during feature mapping the Avg-pooling layer retains the average values of extracted features, additionally it smooths the image without losing the essential features of the image data. Furthermore, with the input of n pooling and convolutional layers, the model returns the nth pooling layer driving out of the nth set followed by a flattened layer, which is further processed for classification in a regular neural network. After a nonlinear combination, various high-level features were described by a flattened layer (fully connected layer). A fully-connected layer (size 2048) consists of 3 dense layers and 3 dropouts. The sigmoid activation function was applied to increase the nonlinearity of the network. Additionally, the parameters of the sigmoid activation function viz. slope, point of inflection and maximum asymptote are used optimally. Moreover, this function is used because it overcomes the problem of vanishing gradients. The softmax function is used because of the fact that this work involves a multiclass classification problem in authentication of 14 honey varieties. The size of the input layer was 32 × 32 × 3 which further connected to a 32 × 32 × 3 2D-convolutional layer. The total convolutions were 896, followed by 512 batch normalisation parameters. The total number of parameters was 1![[thin space (1/6-em)]](https://www.rsc.org/images/entities/char_2009.gif) 911
911![[thin space (1/6-em)]](https://www.rsc.org/images/entities/char_2009.gif) 516 from which 1
516 from which 1![[thin space (1/6-em)]](https://www.rsc.org/images/entities/char_2009.gif) 909
909![[thin space (1/6-em)]](https://www.rsc.org/images/entities/char_2009.gif) 852 were trainable and 1664 were non-trainable. The convolution operation was
852 were trainable and 1664 were non-trainable. The convolution operation was  | (3) |
 | (4) |
A sigmoid activation function is applied to the convolved image patches (eqn (5)) which was used to determine the nonlinear response R in convolved image patches.
| R = sigmoid(CP) | (5) |
A linear transformation is applied after the sigmoid activation function as given in eqn (6).
| Q2 = WTA + b | (6) |
The final output was acquired by giving the mineralised data to a softmax function as given in eqn (7).
| Q3 = softmax(Q2) | (7) |
 | (8) |
2.5. Performance metrics
Concerning the performance of the developed model, various performance metrics were applied for validation, which was calculated by using acquired data of true positive (TP), true negative (TN), false positive (FP), and false negative (FN) based on the confusion matrix obtained after training and testing of the model. Accuracy, precision, recall, specificity, F1-score and ROC-AUC were calculated.233. Results and discussion
In this study, a 2D-Convolutional Neural Network (CNN) based computer vision methodology is used to evaluate the botanical authentication of different honey varieties form India. Fourteen different honey varieties were collected from different locations in India, from which three are multifloral and 11 are unifloral. The authentication was pre-determined by a conventional method (melissopalynology) to detect pollen percentage in honey. Out of the total samples, 11 showed more than 59% of pollen from a single botanical source (Table 1). Therefore, these were categorised as unifloral varieties according to CAC 2001 and IHC (unifloral honey has >45% pollen from one botanical source).In this work, a code was written in Google Colab using Python language. The model was generalised to increase the robustness and create a data set of Red Green Blue (RGB) images (authenticated honey samples) from video sequences captured by a standard camera. The whole program must run only once; it produces RGB images from video sequences, crops them, makes patches from each image, and creates an automated array for labels where images were saved. The data set was made using 90% of the total images for training the model and 10% for testing the developed CNN model for classification. The total number of image patches of size 32 × 32 × 3 used for training and testing was 8![[thin space (1/6-em)]](https://www.rsc.org/images/entities/char_2009.gif) 505
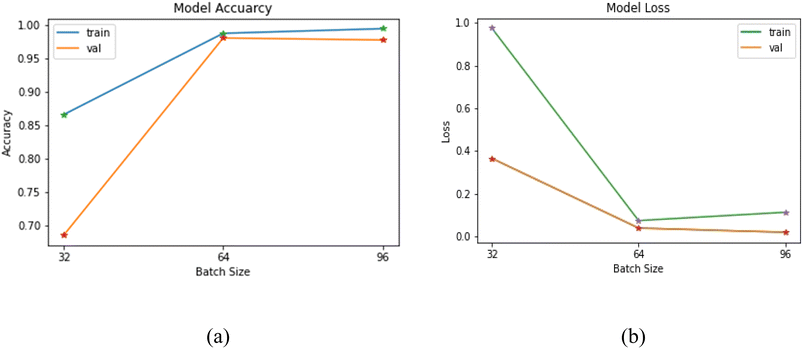
505![[thin space (1/6-em)]](https://www.rsc.org/images/entities/char_2009.gif) 000, which were fed to the 2D-CNN model. The data was fed in batches for training and testing of the model. The batch size plays a critical role in the overall performance of the model.25 The selection of batch size depends upon various factors such as variability in the data, data distribution, redundancy in the data, and diversity in data. It was discovered that taking a batch size equal to the total number of images will put an extra load on the system memory, and the model may crash during the process; therefore, batch size has a significant effect on the performance of the model.25 The batch size of 32 was selected empirically after repeated experimentation with different batch sizes ranging from 32 to 96 in steps of 16. The model's training was done using three different batch sizes that are 32, 64 and 96. The size was chosen by considering the correlation of neighbouring pixels in each frame of the honey sample. The obtained results were plotted to understand batch size's effect on the model accuracy and model loss as shown in Fig. 4(a) and (b), respectively. The training and model validation accuracy was lowest when the model was executed at 32 batch size. However, with an increase in the batch size from 32 to 96, an exponential spike was observed in model training and validation accuracy. The maximum model validation accuracy was obtained at a batch size of 64. The model loss was minimized with the increase in batch size of 64, while further increased in batch size decreased the model validation loss (batch size 96). This behaviour is in line with the study of Kandel and Castelli,25 they concluded the significance of batch size during model optimization for classification problem in neural networking.
000, which were fed to the 2D-CNN model. The data was fed in batches for training and testing of the model. The batch size plays a critical role in the overall performance of the model.25 The selection of batch size depends upon various factors such as variability in the data, data distribution, redundancy in the data, and diversity in data. It was discovered that taking a batch size equal to the total number of images will put an extra load on the system memory, and the model may crash during the process; therefore, batch size has a significant effect on the performance of the model.25 The batch size of 32 was selected empirically after repeated experimentation with different batch sizes ranging from 32 to 96 in steps of 16. The model's training was done using three different batch sizes that are 32, 64 and 96. The size was chosen by considering the correlation of neighbouring pixels in each frame of the honey sample. The obtained results were plotted to understand batch size's effect on the model accuracy and model loss as shown in Fig. 4(a) and (b), respectively. The training and model validation accuracy was lowest when the model was executed at 32 batch size. However, with an increase in the batch size from 32 to 96, an exponential spike was observed in model training and validation accuracy. The maximum model validation accuracy was obtained at a batch size of 64. The model loss was minimized with the increase in batch size of 64, while further increased in batch size decreased the model validation loss (batch size 96). This behaviour is in line with the study of Kandel and Castelli,25 they concluded the significance of batch size during model optimization for classification problem in neural networking.
In addition to batch size, the number of epochs is an essential parameter for a model's training. Therefore, the proposed model was validated by observing the effect of epoch number on the accuracy, validation accuracy, loss and validation loss. The results were evaluated by plotting these parameters against a number of epochs (n = 50), as shown in Fig. 5. As per the observations from Fig. 4(a) and (b), the maximum accuracy and the minimum loss were reported in a batch of 64 and 96 (almost equal, Fig. 5(a) and (b). Furthermore, these batches showed negligible effect on the accuracy and loss from the first to the last epoch number. However, much variation was observed in validation accuracy and loss from the first to the last epoch for the small batch size (32).
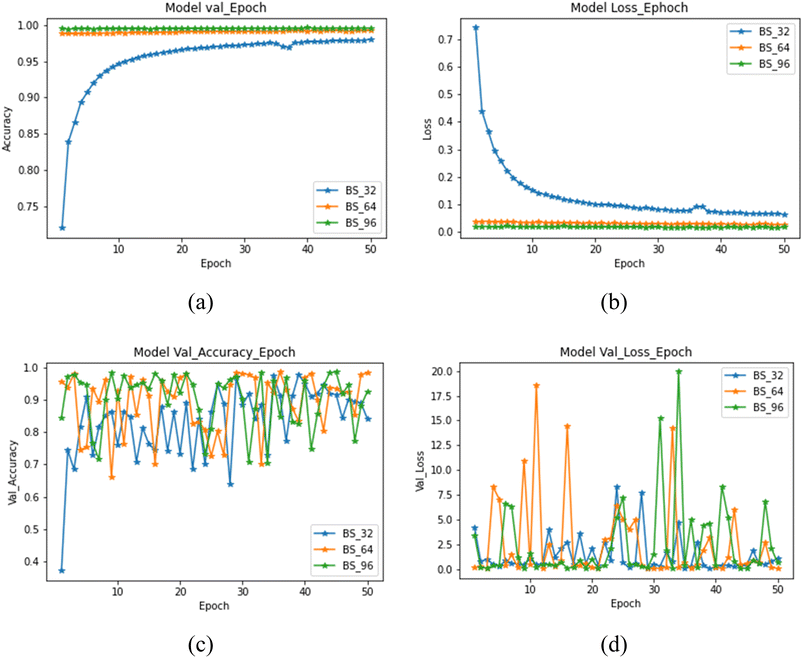 | ||
| Fig. 5 (a) Accuracy vs. epoch (b) loss vs. epoch (c) validation accuracy vs. epoch (d) validation loss vs. epoch. | ||
In contrast, the maximum value of validation accuracy and validation loss was documented in 64 batch size (Fig. 5(c) and (d)). Therefore, based on the observations, it can be interpreted that a minimum batch size of 64 is essential for the model's training to interpret the classification of different honey varieties. Hence, it can be concluded that smaller batch size is unsuitable for training this model.
The AUC-ROC curve is used to evaluate the classification ability of a model to differentiate between two different classes. The greater the area under the ROC curve the greater the classification accuracy of a specific model. The plot of the AUC-ROC curve obtained from all 14 classes is shown in Fig. 6. The minimum area under the ROC curve was observed in the honey variety in class 8 and class 9, which was 0.84 and 0.92, respectively. However, all other classes of honey had an area under the curve of more than 0.97, which means the model has outperformed the existing methods used for honey authentication and other food quality evaluations. All in all, these results were obtained due to the ability of a model to classify the honey based on botanical origin. The botanical origin of honey has a visible effect on its colour; hence we can conclude that the colour differentiation directly influences the model results. The classes that showed the lower value of AUC-ROC compared to others were due to their colour similarities.
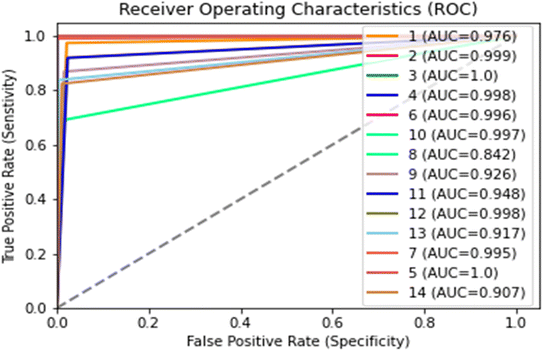 | ||
| Fig. 6 ROC-AUC curve obtained from different classes of various Indian honey varieties (number 1 to 14 are honey classes). | ||
The confusion matrix from the model obtained has information on true positive (TP), true negative (TN), false positive (FP), and false negative (FN) after the processing data set, having images from 14 classes of different honey varieties (Tables 2 and 3, respectively). The performance metrics for the evaluation of the model were calculated based on data acquired from the confusion matrix. The metrics calculated are illustrated in Table 4. It can be observed that class 7 and class 3 have the maximum accuracy, precision, recall, specificity, and F1-score value. The various performance metrics were used to optimise the model used for honey authentication, and an optimisation problem was formulated using these metrics.
| Actual | |||||||||||||||
|---|---|---|---|---|---|---|---|---|---|---|---|---|---|---|---|
| Predicted | 1 | 2 | 3 | 4 | 5 | 6 | 7 | 8 | 9 | 10 | 11 | 12 | 13 | 14 | |
| 1 | 1443 | 0 | 0 | 0 | 0 | 0 | 365 | 5 | 5 | 0 | 23 | 1 | 0 | 189 | |
| 2 | 0 | 2030 | 0 | 0 | 0 | 0 | 0 | 1 | 0 | 0 | 0 | 0 | 0 | 0 | |
| 3 | 0 | 0 | 1987 | 0 | 0 | 0 | 0 | 0 | 0 | 0 | 0 | 0 | 0 | 0 | |
| 4 | 0 | 0 | 0 | 2056 | 0 | 0 | 0 | 0 | 0 | 0 | 0 | 4 | 0 | 0 | |
| 5 | 0 | 0 | 0 | 0 | 2056 | 0 | 0 | 0 | 0 | 0 | 0 | 2 | 0 | 0 | |
| 6 | 0 | 1 | 0 | 6 | 1 | 2006 | 0 | 0 | 0 | 0 | 0 | 0 | 0 | 1 | |
| 7 | 7 | 0 | 0 | 0 | 0 | 0 | 1992 | 25 | 1 | 0 | 18 | 0 | 0 | 7 | |
| 8 | 0 | 0 | 0 | 0 | 0 | 0 | 302 | 1579 | 65 | 0 | 26 | 6 | 0 | 155 | |
| 9 | 2 | 0 | 0 | 0 | 2 | 0 | 150 | 145 | 1376 | 0 | 173 | 6 | 0 | 155 | |
| 10 | 0 | 0 | 0 | 0 | 13 | 0 | 0 | 0 | 0 | 2014 | 0 | 0 | 0 | 0 | |
| 11 | 0 | 0 | 0 | 0 | 0 | 0 | 16 | 42 | 34 | 0 | 1952 | 0 | 0 | 5 | |
| 12 | 0 | 0 | 0 | 0 | 1 | 0 | 1 | 0 | 0 | 0 | 0 | 1957 | 0 | 0 | |
| 13 | 0 | 0 | 1 | 0 | 0 | 0 | 0 | 0 | 0 | 0 | 0 | 0 | 2039 | 0 | |
| 14 | 30 | 0 | 0 | 0 | 0 | 0 | 83 | 21 | 16 | 0 | 138 | 0 | 0 | 1750 | |
| Class | TP | TN | FP | FN |
|---|---|---|---|---|
| 1 | 1443 | 24![[thin space (1/6-em)]](https://www.rsc.org/images/entities/char_2009.gif) 846 846 |
39 | 579 |
| 2 | 2030 | 24![[thin space (1/6-em)]](https://www.rsc.org/images/entities/char_2009.gif) 287 287 |
2 | 1 |
| 3 | 1978 | 24![[thin space (1/6-em)]](https://www.rsc.org/images/entities/char_2009.gif) 393 393 |
1 | 0 |
| 4 | 2056 | 24![[thin space (1/6-em)]](https://www.rsc.org/images/entities/char_2009.gif) 218 218 |
6 | 14 |
| 5 | 2056 | 24![[thin space (1/6-em)]](https://www.rsc.org/images/entities/char_2009.gif) 210 210 |
17 | 11 |
| 6 | 2006 | 24![[thin space (1/6-em)]](https://www.rsc.org/images/entities/char_2009.gif) 319 319 |
10 | 9 |
| 7 | 1992 | 2400 | 908 | 58 |
| 8 | 1579 | 24![[thin space (1/6-em)]](https://www.rsc.org/images/entities/char_2009.gif) 538 538 |
239 | 415 |
| 9 | 1376 | 24![[thin space (1/6-em)]](https://www.rsc.org/images/entities/char_2009.gif) 843 843 |
121 | 634 |
| 10 | 2014 | 24![[thin space (1/6-em)]](https://www.rsc.org/images/entities/char_2009.gif) 300 300 |
9 | 13 |
| 11 | 1952 | 23![[thin space (1/6-em)]](https://www.rsc.org/images/entities/char_2009.gif) 971 971 |
378 | 97 |
| 12 | 1957 | 24![[thin space (1/6-em)]](https://www.rsc.org/images/entities/char_2009.gif) 415 415 |
19 | 2 |
| 13 | 2029 | 24![[thin space (1/6-em)]](https://www.rsc.org/images/entities/char_2009.gif) 271 271 |
0 | 1 |
| 14 | 1750 | 24![[thin space (1/6-em)]](https://www.rsc.org/images/entities/char_2009.gif) 189 189 |
373 | 288 |
In this experiment, the model's application is to determine honey's botanical origin; higher accuracy is required over other metrics. In terms of accuracy, it might be higher in one model in contrast to another, in which precision and specificity might be greater and vice versa. This detailed analysis of the botanical authentication of honey can be used to formulate an optimisation problem using various performance metrics. An optimised metric μ is represented in eqn (9) for such a case.
| μ = α(accuracy) + β(precision) + γ(specificity) | (9) |
Our work was compared with previous research. A similar study was conducted by Zhang on New Zealand honey.26 The results of CNN classification using a dataset generated from a Hyperspectral camera showed a classification accuracy of around 90%. Moreover, they validated the model accuracy and model loss at different epochs, which are identical to trends in our study. In another study, the botanical classification of bee pollens was done with an image feature extraction algorithm in which the author claims the 100% accuracy of the model to classify between different pollens.27 Furthermore, various feature learning models were applied to hyperspectral images of adulterated honey with varying concentrations of sugar syrup. The validation accuracy of the model was 0.84, which is lower than our proposed model.28 In a previous study, Shafiee et al.29 proposed a method using hyperspectral imaging (HIS) technology to determine honey adulteration; HIS data is used to predict honey adulteration using the ANN model, with a model accuracy of 95%. Ponce et al.30 proposed a study on other food items in which they classified the different varieties of olives using the 2D-CNN model, resulting in a rate of classification of 95.91%. A number of in-line quality evaluation studies were performed for food products like meat and food packages using the HIS technology in combination with 2-D and 3-D CNN models.31,32 The accuracy for model validation to classify high-quality products from adulterated and low-quality products was around 0.92.33 All the reported methods were based on expensive hyperspectral technology. On the other hand, our approach was simple and economical, outperforming other similar techniques based on food identification. Moreover, to our knowledge, an application based on image feature extraction using the 2D-CNN model to classify different Indian honey varieties is a novel approach that may find potential for applications in evaluating different food quality attributes.
Based upon the exhaustive experiments and tuning of the model using a number of model parameters, it is observed that deep learning based botanical authentication of Indian honey performs better than the conventional image features extractions in terms of accuracy, specificity, sensitivity, recall, percision, F1 score etc.
4. Conclusion
In today’s fast-growing society, the population is increasing their consciousness of high-quality food. Therefore, a rapid, reliable and economical methodology is required to assist the food industry and consumers in quality evaluation. This becomes possible with the advent of AI-based technology in food technology. This work proposed an innovative approach based on computer vision science using an improved 2D-CNN algorithm and fabricated data processing functions prior to model training and testing. The trained model showed better results than standard tests, which were evaluated using model performance metrics. All in all, it can be proved from the model's output that this modus operandi can be used for non-destructive honey authentication based on botanical origin. Furthermore, this application of AI technology would encourage researchers to exploit its application in a particular domain to improve the existing methods to best serve society. This technique is a pioneer in the field of food quality evaluation, specifically in the case of honey authentication. Our research team is developing other feature-learning models using a similar approach for detecting honey adulteration using various sugar syrups.Author contributions
The manuscript was written through contributions of all authors. All authors have given approval to the final version of the manuscript. These authors contributed equally.Conflicts of interest
There are no conflicts to declare.Acknowledgements
This investigation was supported by Bhabha Atomic Research Centre, Trombay, Mumbai under BRNS (Board of Research in Nuclear Sciences) Project (sanction letter: 55/14/16/2020) awarded to Dr Vikas Nanda.References
- A. M. Machado, A. Tomás, P. Russo-Almeida, A. Duarte, M. Antunes, M. Vilas-Boas, M. G. Miguel and A. C. Figueiredo, Quality assessment of Portuguese monofloral honeys. Physicochemical parameters as tools in botanical source differentiation, Food Res. Int., 2022, 111362, DOI:10.1016/j.foodres.2022.111362.
- Commission Delegated Regulation (EU), PDO-PT-0268-AM01 relating to "Mel dos Açores", Official Journal of the European Union C 384/16, 2019 Search PubMed.
- S. Soares, L. Grazina, J. Costa, J. S. Amaral, M. B. P. P. Oliveira and I. Mafra, Botanical authentication of lavender (Lavandula spp.) honey by a novel DNA-barcoding approach coupled to high resolution melting analysis, Food Control, 2018, 86, 367–373 CrossRef CAS.
- G. P. Danezis, A. S. Tsagkaris, F. Camin, V. Brusic and C. A. Georgiou, Food authentication: Techniques, trends & emerging approaches, TrAC, Trends Anal. Chem., 2016, 85, 123–132 CrossRef CAS.
- D. S. Brar, K. Pant, R. Krishnan, S. Kaur, P. Rasane, V. Nanda, S. Saxena and S. Gautam, A comprehensive review on unethical honey: Validation by emerging techniques, Food Control, 2023, 145, 109482, DOI:10.1016/j.foodcont.2022.109482.
- R. Balkanska, K. Stefanova and R. Stoikova–Grigorova, Main honey botanical components and techniques for identification: A review, J. Apic. Res., 2020, 59(5), 852–861 CrossRef.
- S. Hatfield, E. Marino, K. P. Whyte, K. D. Dello and P. W. Mote, Indian time: time, seasonality, and culture in Traditional Ecological Knowledge of climate change, Ecol. Processes, 2018, 7(1), 1–11 Search PubMed.
- A. Devi, J. Jangir and K. A. Anu-Appaiah, Chemical characterisation complemented with chemometrics for the botanical origin identification of unifloral and multifloral honeys from India, Food Res. Int., 2018, 107, 216–226 CrossRef CAS PubMed.
- G. A. Nayik, B. N. Dar and V. Nanda, Physico-chemical, rheological and sugar profile of different unifloral honeys from Kashmir valley of India, Arabian J. Chem., 2019, 12(8), 3151–3162 CrossRef CAS.
- D. Stefas, N. Gyftokostas, P. Kourelias, E. Nanou, C. Tananaki, D. Kanelis, V. Liolios, V. Vasileios Kokkinos, C. Bouras and S. Couris, Honey discrimination based on the bee feeding by Laser Induced Breakdown Spectroscopy, Food Control, 2022, 134, 108770, DOI:10.1016/j.foodcont.2021.108770.
- K. Wang, Z. Wan, A. Ou, X. Liang, X. Guo, Z. Zhang, L. Wu and X. Xue, Monofloral honey from a medical plant, Prunella Vulgaris, protected against dextran sulfate sodium-induced ulcerative colitis via modulating gut microbial populations in rats, Food Funct., 2019, 10(7), 3828–3838 RSC.
- A. J. Siddiqui, S. G. Musharraf, M. I. Choudhary and A. Rahman, Application of analytical methods in authentication and adulteration of honey, Food Chem., 2017, 217, 687–698 CrossRef CAS PubMed.
- Y. Liu, H. Pu and D. W. Sun, Efficient extraction of deep image features using convolutional neural network (CNN) for applications in detecting and analysing complex food matrices, Trends Food Sci. Technol., 2021, 113, 193–204 CrossRef CAS.
- A. Soni, M. Al-Sarayreh, M. M. Reis and G. Brightwell, Hyperspectral imaging and deep learning for quantification of Clostridium sporogenes spores in food products using 1D-convolutional neural networks and random forest model, Food Res. Int., 2021, 147, 110577 CrossRef CAS PubMed.
- L. Lu, Z. Hu, X. Hu, D. Li and S. Tian, Electronic tongue and electronic nose for food quality and safety, Food Res. Int., 2022, 112214, DOI:10.1016/j.foodres.2022.112214.
- F. Zeng, W. Shao, J. Kang, J. Yang, X. Zhang, Y. Liu and H. Wang, Detection of moisture content in salted sea cucumbers by hyperspectral and low field nuclear magnetic resonance based on deep learning network framework, Food Res. Int., 2022, 156, 111174, DOI:10.1016/j.foodres.2022.111174.
- A. R. Di Rosa, F. Leone, F. Cheli and V. Chiofalo, Fusion of electronic nose, electronic tongue and computer vision for animal source food authentication and quality assessment–A review, J. Food Eng., 2017, 210, 62–75 CrossRef.
- P. Ma, C. P. Lau, N. Yu, A. Li, P. Liu, Q. Wang and J. Sheng, Image-based nutrient estimation for Chinese dishes using deep learning, Food Res. Int., 2021, 147, 110437, DOI:10.1016/j.foodres.2021.110437.
- A. M. Jiménez-Carvelo, A. González-Casado, M. G. Bagur-González and L. Cuadros-Rodríguez, Alternative data mining/machine learning methods for the analytical evaluation of food quality and authenticity–A review, Food Res. Int., 2019, 122, 25–39 CrossRef PubMed.
- G. Kim, H. Lee, I. Baek, B. K. Cho and M. S. Kim, Quantitative detection of benzoyl peroxide in wheat flour using line-scan short-wave infrared hyperspectral imaging, Sens. Actuators, B, 2022, 352, 130997, DOI:10.1016/j.snb.2021.130997.
- A. Hassoun, S. Jagtap, G. Garcia-Garcia, H. Trollman, M. Pateiro, J. M. Lorenzo, M. Trif, A. Rusu, R. M. Aadil, V. Šimat, J. Cropotova and J. S. Câmara, Food quality 4.0: From traditional approaches to digitalized automated analysis, J. Food Eng., 2023, 337, 111216, DOI:10.1016/j.jfoodeng.2022.111216.
- Codex Alimentarius Commission, Revised Standards for Honey. Codex Standard 12–1981. Rev 1 (1987), Rev 2 (2001), FAO, Rome, 2001 Search PubMed.
- M. Yang, X. Liu, Y. Luo, A. J. Pearlstein, S. Wang, H. Dillow, K. Reed, Z. Jia, A. Sharma, B. Zhou, D. Pearlstein and B. Zhang, Machine learning-enabled non-destructive paper chromogenic array detection of multiplexed viable pathogens on food, Nat. Food, 2021, 2(2), 110–117 CrossRef PubMed.
- K. Shankar, S. Kumar, A. K. Dutta, A. Alkhayyat, A. J. A. M. Jawad, A. H. Abbas and Y. K. Yousif, An automated hyperparameter tuning recurrent neural network model for fruit classification, Mathematics, 2022, 10(13), 2358 CrossRef.
- I. Kandel and M. Castelli, The effect of batch size on the generalizability of the convolutional neural networks on a histopathology dataset, ICT Express, 2020, 6(4), 312–315 CrossRef.
- G. Zhang and W. Abdulla, New Zealand honey botanical origin classification with hyperspectral imaging, J. Food Compos. Anal., 2022, 109, 104511, DOI:10.1016/j.jfca.2022.104511.
- H. Menad, F. Ben-Naoum and A. Amine, Deep Convolutional Neural Network for Pollen Grains Classification, in JERI, 2019 Search PubMed.
- Y. Shao, Y. Shi, G. Xuan, Q. Li, F. Wang, C. Shi and Z. Hu, Hyperspectral imaging for non-destructive detection of honey adulteration, Vib. Spectrosc., 2022, 118, 103340, DOI:10.1016/j.vibspec.2022.103340.
- S. Shafiee, G. Polder, S. Minaei, N. Moghadam-Charkari, S. Van Ruth and P. M. Kuś, Detection of honey adulteration using hyperspectral imaging, IFAC-Pap., 2016, 49(16), 311–314 Search PubMed.
- J. M. Ponce, A. Aquino and J. M. Andújar, Olive-fruit variety classification by means of image processing and convolutional neural networks, IEEE Access, 2019, 7, 147629–147641 Search PubMed.
- M. Al-Sarayreh, M. Reis, W. Qi Yan and R. Klette, Detection of red-meat adulteration by deep spectral–spatial features in hyperspectral images, J. Imaging, 2018, 4(5), 63 CrossRef.
- L. D. Medus, M. Saban, J. V. Francés-Víllora, M. Bataller-Mompeán and A. Rosado-Muñoz, Hyperspectral image classification using CNN: application to industrial food packaging, Food Control, 2021, 125, 107962 CrossRef.
- M. Al-Sarayreh, M. M. Reis, W. Q. Yan and R. Klette, Potential of deep learning and snapshot hyperspectral imaging for classification of species in meat, Food Control, 2020, 117, 107332 CrossRef CAS.
| This journal is © The Royal Society of Chemistry 2024 |

