
 Open Access Article
 This Open Access Article is licensed under a Creative Commons Attribution-Non Commercial 3.0 Unported Licence
Assessing the realism of clean energy projections†
Fatemeh
Rostami
 a,
Piera
Patrizio
bc,
Laureano
Jimenez
a,
Carlos
Pozo
*a and
Niall
Mac Dowell
bc
a,
Piera
Patrizio
bc,
Laureano
Jimenez
a,
Carlos
Pozo
*a and
Niall
Mac Dowell
bc
aDepartament d’Enginyeria Quimica, Universitat Rovira i Virgili, Tarragona 43007, Spain. E-mail: carlos.pozo@urv.cat
bCenter for Environmental Policy, Imperial College London, London SW7 2AZ, UK
cCenter for Process Systems Engineering, Imperial College London, London SW7 2AZ, UK
First published on 18th June 2024
Abstract
Although pivotal in the climate change discourse, integrated assessment models (IAMs) often face criticism for their overly optimistic projections. In this contribution, we critically examine IAM limitations in the context of clean energy technologies and critical materials. IAMs project a very substantial increase in clean energy technology deployment by 2050. When considering diverse technology types and their material requirements – information missing from IAMs – we find that this may represent a substantial 571-fold surge in selenium demand and a 531-fold increase in gallium, figures that seem difficult to achieve. This challenges not only the capacity of material reserves but also the rate at which these can be produced. To address this gap, we propose establishing a direct link between industrial assets and required materials through simple constraints on material availability. We illustrate the capabilities of this approach by estimating the achievable clean energy capacities by 2050. We find potential shortages in the capacity developed for clean energy technologies compared to IAM projections that may result in deviations from the Paris agreement target by 0.06–0.95 °C. Therefore, incorporating material constraints and technological diversity into IAMs presents a valuable opportunity to enhance their predictive accuracy and guide evidence-based policymaking. Including these aspects in IAMs and decision-support tools will make them more useful in shaping a sustainable yet realistic energy sector.
Broader contextIntegrated assessment models (IAMs) play a crucial role in shaping academic discussions and influencing policy strategies related to climate change and mitigation. This contribution highlights that these complex models often lack detailed considerations of diverse technology types and their material requirements, leading to optimistic projections. To demonstrate this, we translate the capacity of clean energy technologies forecasted by IAMs into the corresponding requirements for 36 materials. These include critical minerals, rare earth elements, platinum group materials, and structural materials. Our calculations reveal that meeting capacity projections from IAMs requires scaling materials supply chains up at an unprecedented rate. This raises concerns regarding the availability of materials and our capacity to meet climate goals. Integrating material availability constraints and enhanced technology resolution into IAMs, we observe significant deviations from their projected capacities. The primary hurdle lies in the rate of materials supply, rather than their scarcity. This contribution not only quantifies potential shortages in technologies developed capacity and the need to increase materials production rates but also emphasizes the crucial role of incorporating these factors into IAMs for more accurate predictions. The findings from this study provide crucial insights for evidence-based policymaking, aiming at a seamless transition towards sustainable energy systems. |
1. Introduction
While wealthier individuals may have the means to shield themselves from the effects of global warming, approximately 200 million people would face unprecedented temperature increases, impacting energy security and poverty alleviation policies.1,2 Carbon mitigation options look promising for addressing this challenge, yet delays in clean energy technology development will render the 1.5 °C target unattainable.3 Therefore, a comprehensive understanding of the needs to develop these technologies at the required scale will illuminate the challenges ahead and drive the search for solutions to achieve the targets ambitioned.Integrated assessment models (IAMs) serve as crucial tools in guiding academic discussions and shaping policy strategies in the realm of climate change and mitigation. Their impact transcends academia, influencing policy frameworks and global initiatives dedicated to reducing greenhouse gas (GHG) emissions.4 Recognized for their significance, these models are now integral components of the International Panel of Climate Change's (IPCC) assessment reports, which many countries rely on to inform their policymaking efforts.5
IAMs use scenario-based inputs to qualitatively project diverse hypothetical futures for natural and human subsystems.4,6 In the former subsystem, IAMs include a quantitative representation of a set of Earth-system processes,6 while in the latter, these models calculate energy supply and demand to meet simulated human population requirements.6 It is this last subsystem that can be seen as the heart of any IAM, with equations describing the assumed behaviours of consumers, producers, and regulators.6
Despite their widespread use, IAMs face scrutiny regarding their modelling structures and perceived limitations.4,6 In the past, studies underscored the need for IAMs to capture the nuances of human behaviour related to energy consumption, especially in mobility sectors.7 Similar studies aiming to infuse socio-technical insights into IAMs reported notable deviations in IAMs projections after including these considerations.8 While recognizing IAMs' pivotal role in shaping low-carbon pathways and guiding policymaking, later studies have raised concerns about their political impartiality at the science-policy nexus.9 Consequently, attempts have been made to incorporate concepts from international and national public policies into IAM scenarios, aiming to enhance transparency and align pathways with the goals of the Paris Agreement.10 Koasidis et al. (2023) highlighted that IAMs, with their assumptions of perfect markets and knowledge over a certain future, alone are insufficient to navigate through multifaceted crises.11 Criticism extends to their depiction of technological diffusion and the underlying transition processes.4 Real-world complexities influencing technology diffusion rates—such as policy, technology characteristics, infrastructure compatibility, and public acceptance—are inadequately represented in IAMs, if at all.12 All these often result in overly optimistic projections that neglect challenges inherent in industrial transformations, creating a significant knowledge gap at the science–policy interface.13–16 This gap influences policy agendas and undermines the policy relevance of IAMs, ultimately affecting the expected pace and the direction of progress.17
Such dichotomy is a fundamental challenge that we will elaborate on in the context of critical materials and their impact on our ability to deploy for clean energy technologies (CETs) at the expected rate. To this end, we will take advantage of CET projections that are consistent with the Paris agreement according to eight prevalent IAMs,18 and quantify the tangible challenges to achieving them. In essence, these challenges stem from the inability of IAMs to establish a physical link between industrial assets and the materials required to build them.4,5 In addition, we will study the impact of the limited technological resolution of IAMs on the reliability of their predictions by exploring the relationship between various technology types and some problematic materials. Finally, considering realistic material supplies, we will estimate attainable CET capacities and translate them into more realistic temperature targets, illustrating a potential way forward for IAMs. Doing these analyses is very necessary since it is a long time that international organizations started warning of soaring costs of CETs and potential delays in decarbonization due to mineral shortages, highlighting the entrance into the age of big shovels.19
Hence, this contribution critically examines IAMs limitations in the context of CETs, shedding light on the fundamental gap between IAM projections and real-world practicalities. Our findings, obtained for 36 materials and based on 25 IAMs scenarios, advocate for a nuanced, integrated approach to bridge this gap and better align IAM insights with the pragmatic imperatives of policymaking.
2. Methodology
To assess the feasibility of IAM projections and to identify the effect of constraints not included in IAMs, we aim to evaluate the amount of 36 materials needed to deploy five CETs under “Below 1.5 °C” and “1.5 °C low overshoot” temperature targets, both consistent with the Paris agreement. These include batteries (both mobile and stationary), concentrated solar power (CSP), electrolyzers, photovoltaic (PV) panels, and wind turbines.We start by determining the annual capacity projected for each of these technologies for 2020–2050, incorporating data from 25 scenarios generated with eight different IAMs (Table S2, ESI†).20 Hereinafter, whenever we refer to IAMs, we specifically refer to the IAMs and scenarios outlined in Table S2 (ESI†). Each of these models and scenarios contributes to our comprehensive understanding of potential future trajectories, allowing us to encompass a wide spectrum of possibilities in our analysis. This wide scope is necessary due to the complexity and uncertainty inherent in projecting the capacity of CETs.
IAMs provide the projected capacities for various technologies in different units, which requires some calculations to obtain capacity values in GW for all of them. In addition, we estimate the replacements needed to compensate for retired facilities and incorporate them into IAM projections. Calculation details are provided in Section A of the ESI.†
IAMs only provide information at the archetypal technology level. However, technology designs can vary in practice, as can material requirements (Table 1). Hence, we focus on two market contribution scenarios provided by the German Aerospace Center (i.e., Continued and Technological Change) to distribute IAMs’ capacity projections among various technology types.21 These market scenarios predict how different technology types will contribute to the overall technology market in the following decades.
| Technology category | Technology type | Technology full name |
|---|---|---|
| Battery | LFP | Lithium ferro phosphate |
| NCA | Lithium nickel cobalt aluminum | |
| NMC111 | Lithium nickel manganese cobalt (composition Ni/Mn/Co = 1/1/1) | |
| NMC622 | Lithium nickel manganese cobalt (composition Ni/Mn/Co = 6/2/2) | |
| NMC811 | Lithium nickel manganese cobalt (composition Ni/Mn/Co = 8/1/1) | |
| LiS | Lithium sulfide | |
| LiO | Lithium oxide | |
| Concentrated solar power | FC | Fresnel collector |
| PT | Parabolic trough | |
| ST | Solar tower | |
| Electrolyzers | Alkaline | Alkaline electrolyzer |
| PEM | Proton exchange membrane electrolyzer | |
| Photovoltaic panels | C-Si | Crystalline silicon |
| CIGS | Copper indium gallium diselenide | |
| CdTe | Cadmium-telluride | |
| Wind turbines | AG | Asynchronous generator |
| HTS-DD | High temperature superconductor – direct drive | |
| SG-E-DD | Synchronous generator – electrically excited – direct drive | |
| SG-PM-HS | Synchronous generator – permanent magnet – high speed gear | |
| SG-PM-MS | Synchronous generator – permanent magnet – middle speed gear | |
| SG-PM-DD | Synchronous generator – permanent magnet – direct drive |
In the next step, we quantify the material consumption per GW, often referred to as material intensity. We use two material intensity scenarios: one based on current intensities and another that factors in the impact of learning curves.21,22 The latter scenario assumes that material intensities decrease over time due to new manufacturing approaches and technological advancements, consequently lessening material requirements.
Combining 25 IAM scenarios with two projections for the market contribution and two trajectories for material intensities (see Table 2), we generate 100 different pathways for the demand of each of the 36 materials used in constructing various CETs. Then, these material demands will be compared with the current material supply infrastructure to critically assess the feasibility of achieving the technology capacities envisioned by the IAMs. For further details on these calculations, refer to Section B of the ESI.†
| Market contribution | Material intensity | Colour/symbol |
|---|---|---|
| Continued | Base | Red |
| Continued | Learning | Red (*) |
| Technological change | Base | Blue |
| Technological change | Learning | Blue (*) |
Finally, we will approach the problem from the opposite perspective, employing a bottom-up methodology to estimate the capacity of CETs that could be achieved considering current infrastructure and realistic projections for their growth rate. To this end, we formulate an optimization model to meet IAMs projections while considering constraints on materials supply and reserve capacities. Quantifying the disparity between realistic estimates and IAM projections is crucial for different reasons. In the context of IAMs, these calculations will provide a quantitative estimate for the error stemming from insufficient technological resolution and key missing linkages between different sectors in the model. Then, in the context of climate change mitigation, we can estimate the temperature increase stemming from the shortfall in deploying CETs, questioning the ability of IAM projections to achieve timely progress toward the 1.5 °C target. In addition, we modify the previous model to investigate the minimum material recycling rates needed to meet the CET capacities outlined by the 25 IAM scenarios. We do this for two market trends, two material intensity forecasts, and three material production rates, generating a total of 300 different results (i.e., 12 variations for each of the 25 IAM scenarios). Further details on these calculations can be found in Sections C and D of the ESI.†
3. Results and discussion
3.1 IAMs envision a rapid increase in the deployment of clean energy
Fig. 1 depicts the capacity of CETs added annually between 2020 and 2050 across the eight IAMs and the 25 scenarios considered (Table S2, ESI†), expressed as the ratio over 2020 values. The figure depicts important variations across scenarios, reflecting the uncertainty in the projected capacity for each technology.20 These variations stem from the different choices each model and scenario makes for specific interventions to meet climate goals, including carbon pricing, technology deployment, lifestyle, or coal retirement policies.20 A detailed breakdown of the various scenarios and their underlying assumptions is provided in Section A of the ESI.† Note that not all the scenarios include projections of all the technologies assessed (see circles within each panel).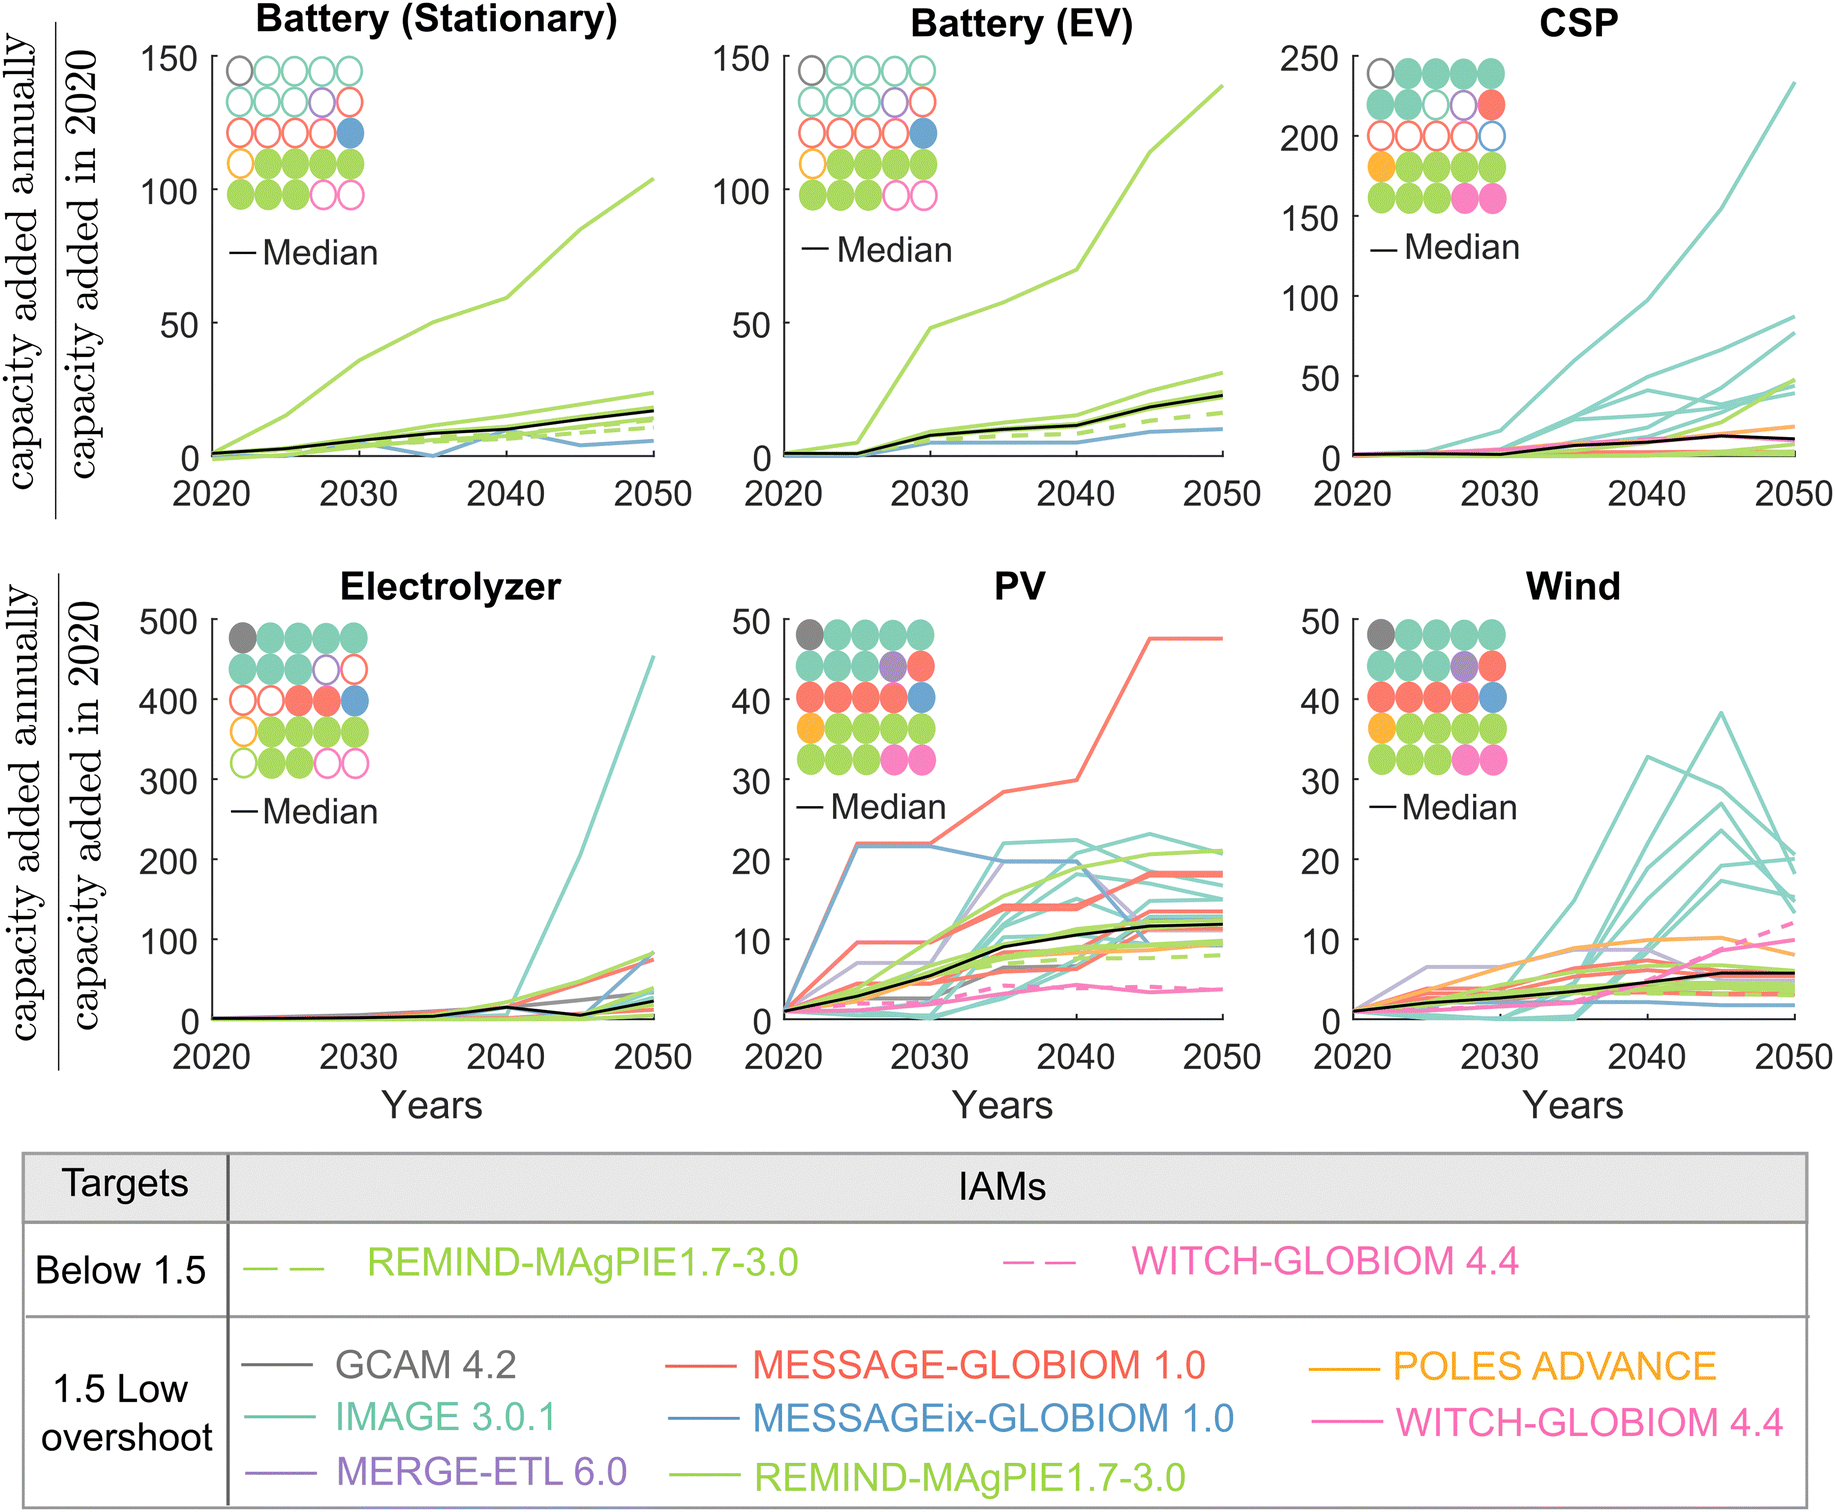 | ||
| Fig. 1 Projections for the capacity of clean energy technologies added annually based on selected IAMs and scenarios (see Table S2, ESI†). Scenarios represented with dashed lines are compatible with the “Below 1.5” target, while solid lines correspond to scenarios for the “1.5 °C low overshoot” target. Capacities for 2020 serve as the baseline for estimating capacity ratios in subsequent years. The only exception are electrolyzers, whose baseline year depends on the scenario (i.e., the first year with non-zero capacity projections is used in each case). Circles in each panel correspond to the different scenarios for each IAM, sorted in the same order as in Table S2 (ESI†) and using the colour code indicated in the legend. These are used to indicate the scenarios providing capacity projections for the corresponding technology (i.e., those with filled circles). For each technology, the median value is derived by considering its available IAM scenarios. CSP: concentrated solar power, EV: electric vehicles, PV: photovoltaics. | ||
Despite existing variations, Fig. 1 illustrates an overall increasing trend in the projected deployment of technologies over time, with some noteworthy exceptions that mainly affect PV and wind. For example, scenarios from the MESSAGE-GLOBIOM model depict rapid growth in PV capacity from 2020 to 2025, followed by either a continuous rise or a constant trend, depending on the scenario. In contrast, some models like IMAGE project a decline in the annual deployment of PV and wind beyond 2040. Overall, according to median estimates, the capacity of PV panels added annually in 2050 is projected to be 10.5 times greater than in 2020, while for wind turbines, it is expected to be about 5 times higher.
The remaining CETs show smaller variations across scenarios. The median capacities added annually for stationary batteries, EV batteries, and CSPs are projected to reach 19, 24, and 37 times those of 2020, respectively. As an exception, the “PEP_1p5C_red_eff” scenario from the “REMIND-MAgPIE 1.7-3.0” model projects battery deployment reaching 104 (stationary) and 139 (EV) times the 2020 values. This scenario is characterized by comprehensive carbon pricing.
Similarly, the “IMA15-TOT” scenario from “IMAGE 3.0.1” projects significantly high deployment for CSP (234 times 2020 levels) and electrolyzers (454-fold increase compared to 2030 estimates). This scenario is based on assumptions such as reduced use of CO2-intensive transportation, and rapid adoption of the best available technologies, placing its projections significantly above the median.20
To analyze the impact of these variations, we present Fig. 2, illustrating the cumulative capacity developed for these technologies over the present and subsequent decades.
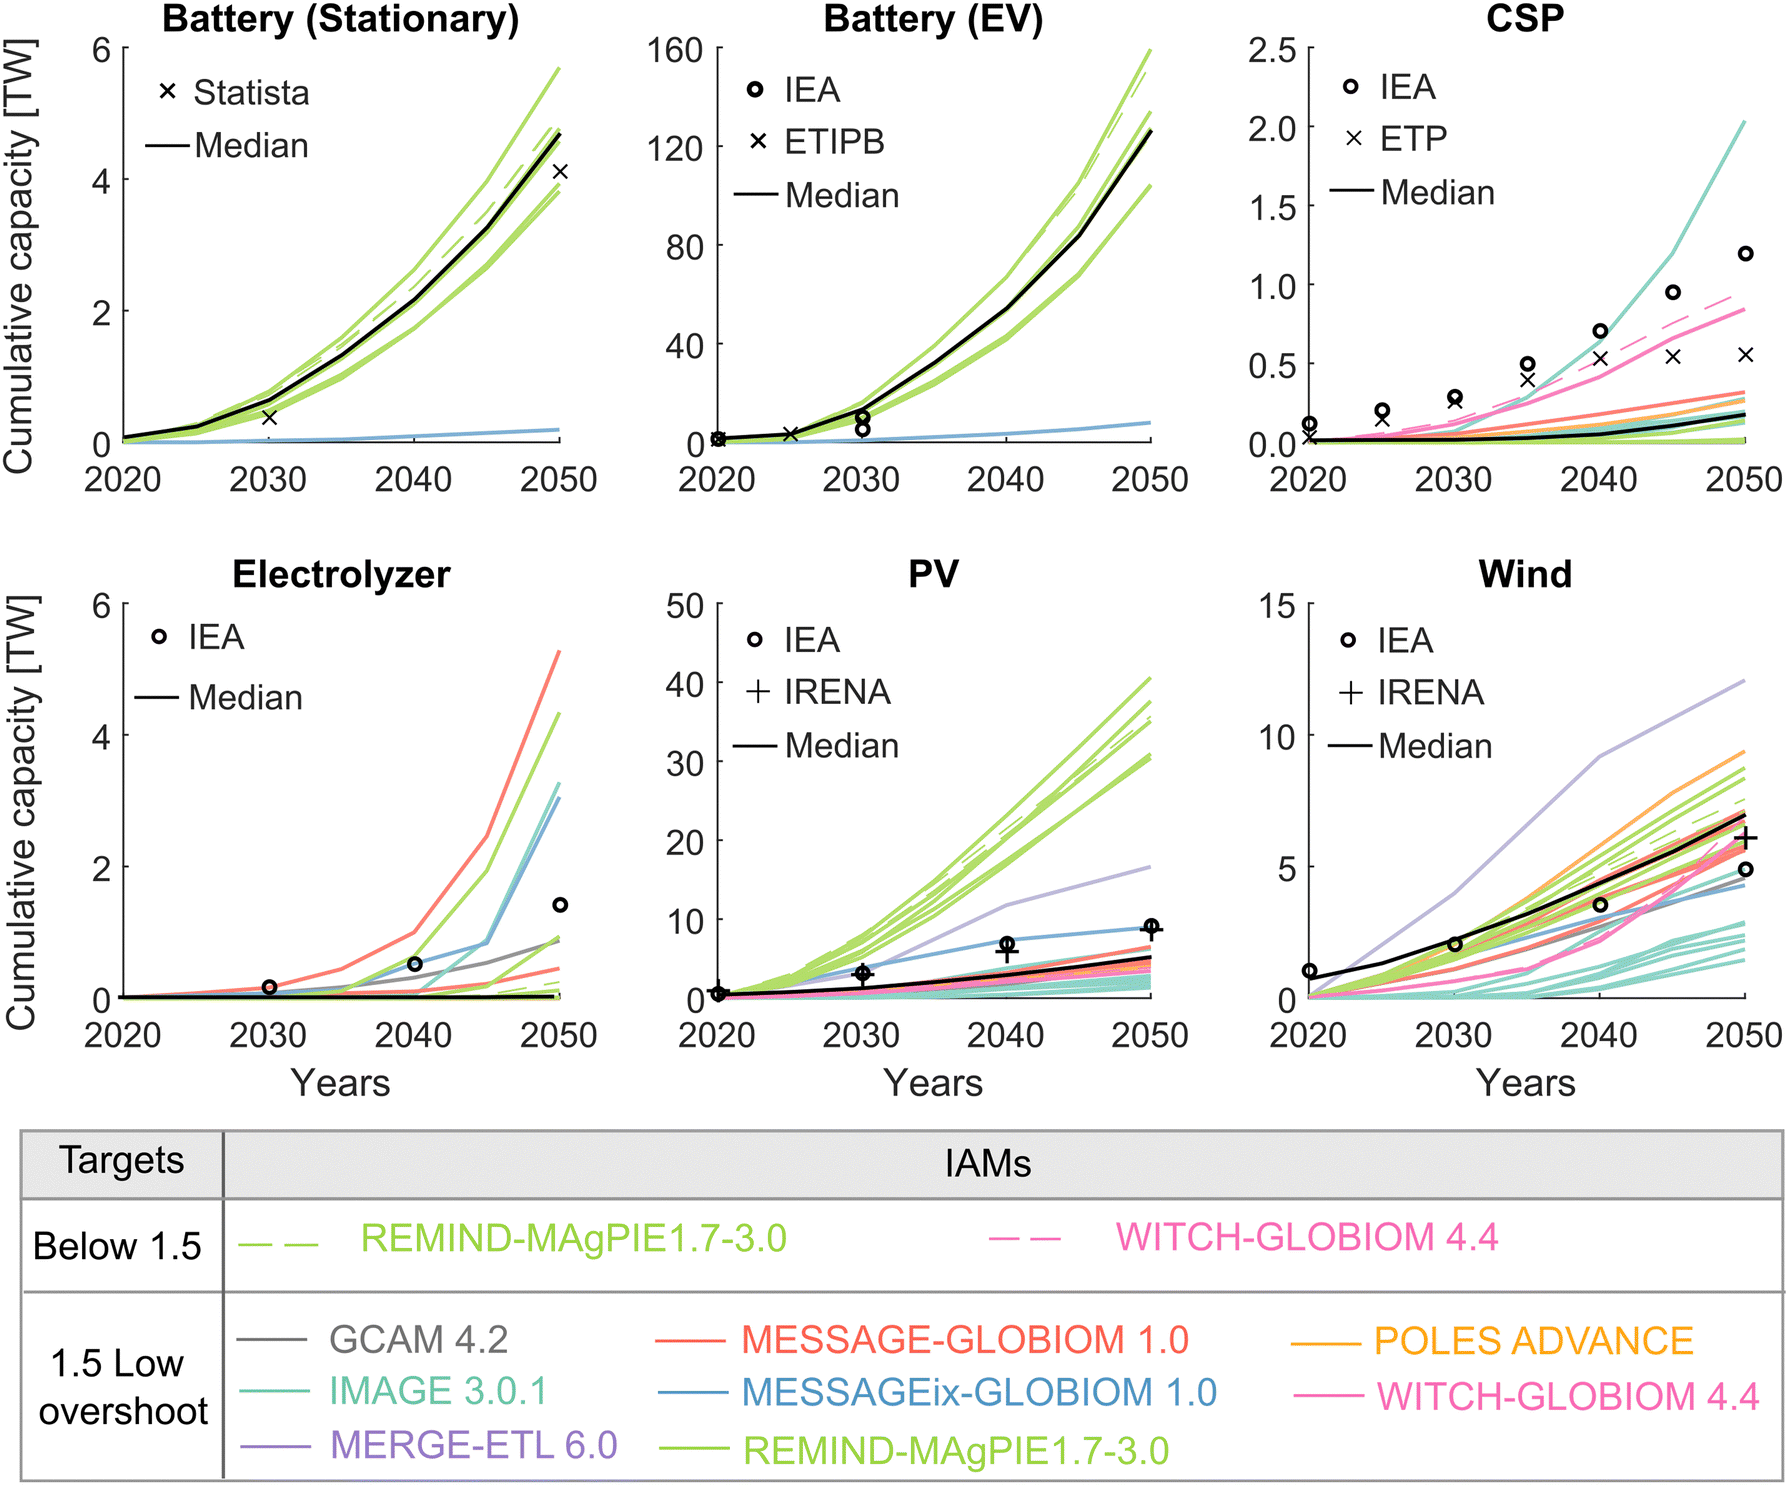 | ||
| Fig. 2 Cumulative projected capacity of clean energy technologies based on selected IAMs and scenarios (Table S2, ESI†). Markers in each panel represent data from additional sources used for comparison: circles show IEA projections,23–25 plus signs denote IRENA data,26 and cross signs correspond either to data from the European Technology and Innovation Platform for Battery (ETIPB),27 from Statista (for stationary batteries projections),28 or from the energy technology perspectives (ETP) (for CSP).29 Black lines present the median of IAM projections. | ||
Fig. 2 depicts a rising trend across all scenarios that impact our ability to achieve these forecasts (see later discussion in Section 3.5). Notably, the application of batteries for EVs, estimated at around 159 TW by 2050, shows the highest cumulative capacity, although this number may vary based on the assumptions for some technical parameters (refer to Section A of the ESI†). Following this, PV comes in at 41 TW, followed by wind at 12 TW. The remaining options stay below 6 TW by 2050.
To provide context, we also compare our estimates with projections from other sources such as the European Technology and Innovation Platform for Battery (ETIPB), the energy technology perspectives (ETP), the international energy agency (IEA), the international renewable energy agency (IRENA), and Statista, all of which focus more specifically on energy-related aspects. We observe that the median among IAM projections allocate smaller capacity to CSPs (169 GW in 2050), electrolyzers (10 GW), and PV panels (5100 GW) compared to estimates from other studies,23,26–31 yet the median projections for batteries (4700 GW for stationary and 126 TW for EVs in 2050) and for wind turbines (7000 GW) are consistent with other projections. More importantly, all the projections from other sources fall within the range of IAM scenarios considered in the analysis, highlighting the robustness of our estimations. The only exception are small discrepancies for CSP between 2020 and 2040, which, ultimately, would have little impact in material shortages (see later discussion around Fig. 5).
In addition, our estimations closely match existing real-world data. For instance, the actual capacity of PV panels added in 2020 was 84 GW,32 close to the average of the values predicted by IAMs (94.5 GW). Similarly, the development of wind turbines is at the range, with the actual 111 GW capacity added in 2020,32 well within the IAM forecasts (i.e., 7–154 GW).
We also note that the share of the total capacity added in 2050 to replace retired facilities is very small, reflecting the modest capacity of clean energy technologies installed during the past decades (Fig. S2, ESI†). However, a challenging decade is expected to start in 2050, when major replacements for batteries, PV panels, and wind turbines are anticipated to commence, given their expected lifetime (i.e., about 15 years for batteries and 30 years for PV panels and wind turbines).33,34
The timing and magnitude of this surge may vary based on technology quality and durability; aspects necessarily overlooked in already complex IAMs. High-quality materials can extend the durability and lifespan of these technologies, delaying the need for replacements and materials recycling. Furthermore, real-world dynamics involved in developing and replacing retired CETs are multifaceted, including mine exploration, technological advancements, economic factors, supply chain stability, and operational conditions, making it very complex to accurately estimate the year that each technology is going to be retired.
The challenge caused by technology retirement and replacement could be controlled by developing material recycling facilities, an issue that will be further explored in Section 3.6.
Hence, even if most IAMs already impose limits on the penetration of technologies, this first analysis is in agreement with the body of literature suggesting that these might be over-optimistic.4 The feasibility of attaining envisioned levels in deploying CETs is hard to grasp, and more tangible data on material requirements and supply would be needed for this purpose. The issues starting a call for urgent improvements in permitting, mining, and manufacturing systems. Hence, in the next section, we will translate the projections of installed capacity for these new technologies into material demand to ascertain whether IAMs' estimates are realistically feasible given the current landscape of materials supply and its potential growth.
3.2 Materials market dynamics are an obstacle to achieving IAM projections
We next evaluate the annual demand that the development of CETs would impose on 36 distinct materials under each class mentioned in Table 2 for each of the 25 IAM scenarios considered. We start by performing a preliminary analysis to identify those whose supply is expected to be most challenging (see Section B.6 for further details, ESI†), finding an especially concerning situation for the 16 elements depicted in Fig. 3. We will refer to these as problematic materials (results for the remaining materials are provided in Fig. S3 in the ESI†). We also compare our estimates with the material demands provided by Wang et al.,34 and those reported in the IEA critical mineral data explorer (see Table S16, ESI†).35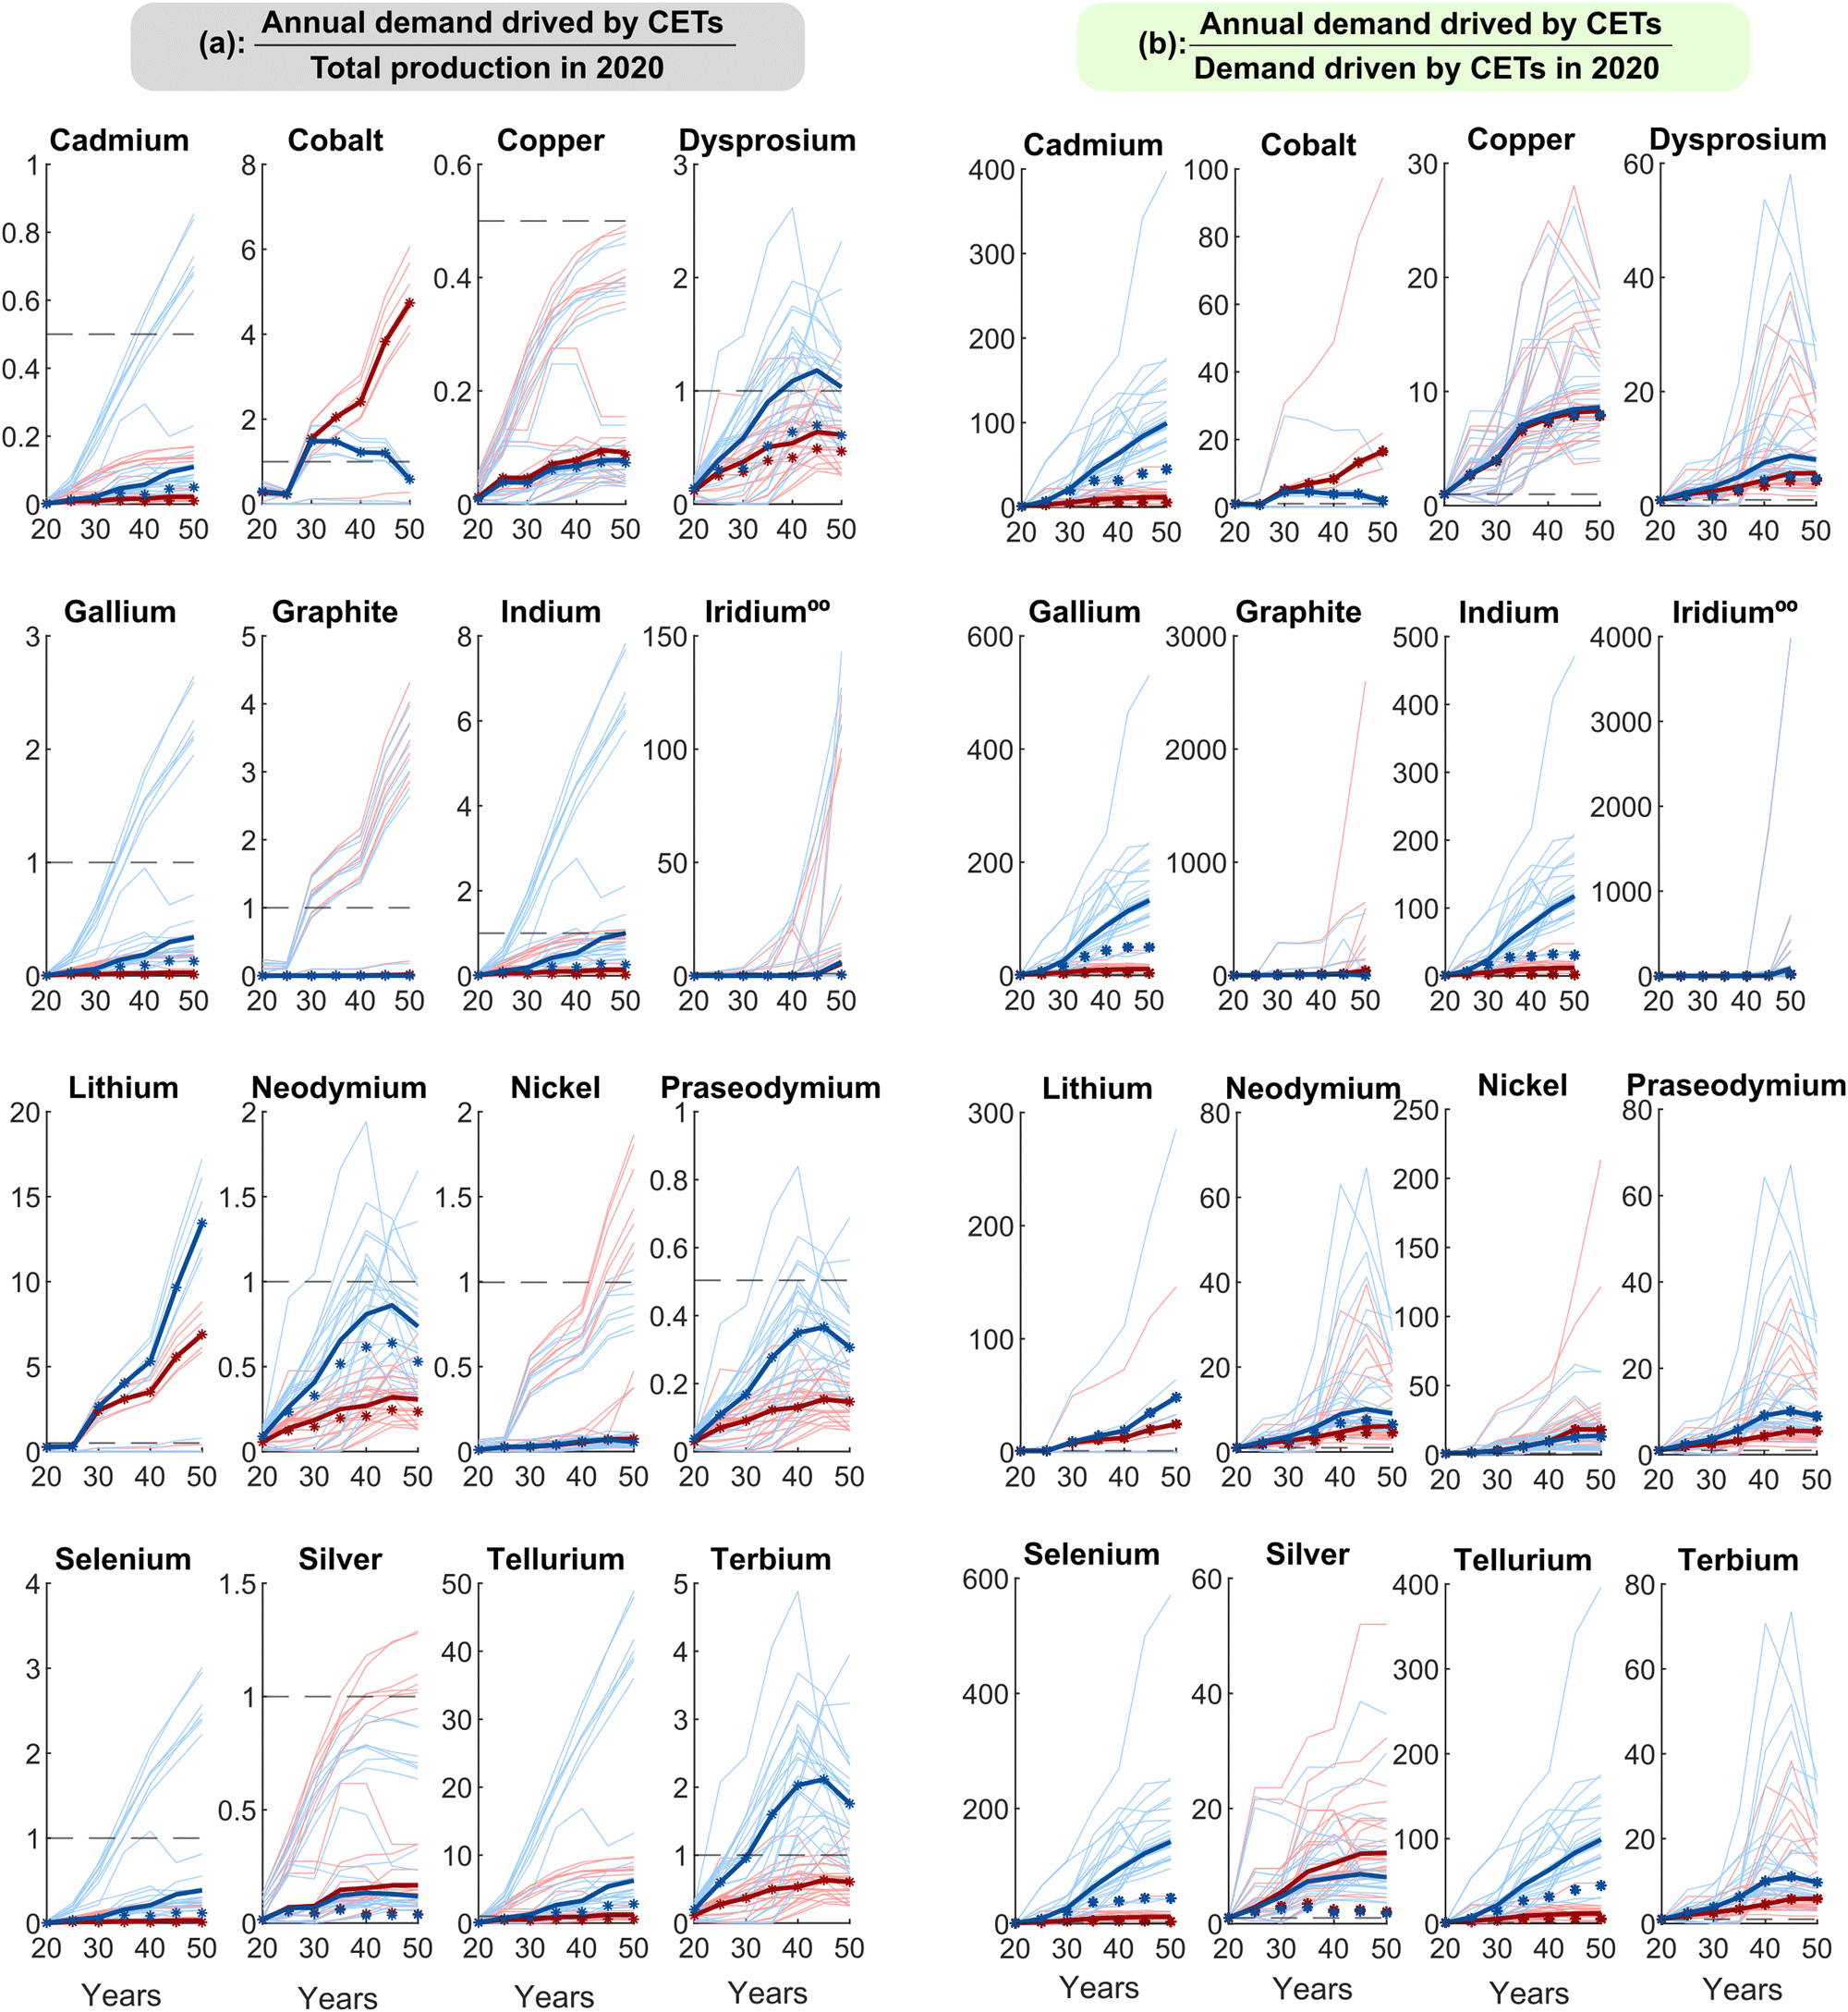 | ||
Fig. 3 Material demands from clean energy technologies. Panel (a) compares the demand for materials from clean energy technologies with their production rate dedicated to all sectors in 2020. Panel (b) represents materials demand from clean energy technologies compared with their estimated demand in 2020. OO: Iridium, primarily used in electrolyzers, does not exhibit demand until 2030 and therefore relies on this year or later years, depending on the scenario, as the basis for calculations. Dashed horizontal lines at y = 0.5 for cadmium, copper, and praseodymium and at y = 1 for other materials have been included for comparison. Timeframes are indicated as follows: 20![[thin space (1/6-em)]](https://www.rsc.org/images/entities/char_2009.gif) :2020, 30:2030, 40:2040, 50:2050. The results of the continued trend and technological change are distinguished by red and blue colours (see Table 2). In both cases, the median is depicted with a thicker line. The effect of the reductions in material intensities due to learning curves is indicated with star signs, only for median projections. CETs: clean energy technologies. :2020, 30:2030, 40:2040, 50:2050. The results of the continued trend and technological change are distinguished by red and blue colours (see Table 2). In both cases, the median is depicted with a thicker line. The effect of the reductions in material intensities due to learning curves is indicated with star signs, only for median projections. CETs: clean energy technologies. | ||
We find that, for all these elements except for cadmium, copper, and praseodymium, the annual demand for the development of CETs alone can potentially exceed their current production for all sectors at some point before 2050 (see line at y = 1 in Fig. 3a). Indeed, the demand-to-production ratio for iridium, tellurium, lithium, indium, cobalt, and terbium could increase up to 143, 49, 17, 8, 6, and 5 respectively. Reaching these figures would require an increase in the production capacity of these materials which seems unattainable for over 30 years. Failure to do so could lead to material shortages and supply chain disruptions, ultimately hindering our progress toward the temperature target defined by the Paris Agreement.
The situation seems less critical for other elements since their median demand does not exceed their current production levels. However, increasing production rates may still be difficult for certain materials like cadmium, gallium, indium, and iridium, as they are byproducts of other elements. This issue is further discussed in the next section.
The crucial point to note here is that IAMs project the total capacity for each archetypal technology, like PV, without distinguishing between different technology types, such as CdTe, CIGS, and CSi panels, irrespective of material assets. This makes it difficult for IAMs to capture factors such as market drivers, innovation, or inertia.36 As each technology type has unique material requirements, allocating capacity to them directly influences the materials needed and the ability to meet the projected capacity. Hence, the demand for some elements is contingent on the market contribution scenario, as illustrated by the red vs. blue lines. Take cobalt as an example. The demand for this element would rise in a continued market trend (red lines in Fig. 3) but decrease in scenarios where technological changes replace cobalt-type batteries with cobalt-free alternatives37 (blue lines; further elaborated in Section 3.4).
This effect is also observed when analysing the demand from CETs alone (i.e., without comparing it with the total production level of each material, Fig. 3b), where we discover many minerals whose annual demand would increase to sky-high levels if the technological change market trends were realised. These include cadmium (whose demand from CETs could be 398 times larger than in 2020), gallium (531), indium (471), lithium (285), nickel (214), selenium (571), and tellurium (396). In the case of cadmium, the demand is primarily driven by CdTe PV panels, which will reach a 24% market contribution by 2050 in the technological change scenario (compared with 5% in the continued market trend). This difference could significantly affect cadmium demand, potentially raising its price and affecting other applications, such as its use in plastic stabilizers and pigments.38 Meanwhile, the technological change scenario assigns a smaller contribution to C–Si panels, making it a safe bet when considering silver supply limitations.
On the other hand, indium, and tellurium, which have displayed a high supply risk in Fig. 3a, are likely problematic when considering their demand from CETs (Fig. 3b), as this will affect their availability for other sectors and, consequently, their price.
The demand for elements used in electrolyzers, like graphite and iridium, could skyrocket to 2600 and 4000 times their estimated demand in 2020. This happens in IAM scenarios allocating a very minor capacities to this technology initially, followed by a rapid growth. However, considering the median values, which are arguably more likely to occur, the situation for these elements is not as critical.
Overall, some technology types will benefit from particular market scenarios while others may face disadvantages. We acknowledge that modelling detailed markets competing for materials, whose prices vary according to their respective elasticities and demands, might be out of reach of current IAMs. However, even in this case, it should still be possible to simulate distinct market trends, introduced exogenously into the model formulation, similarly to what is done today to limit technology diffusion rates. What is clear is that allocating the capacity of each CET into their various types, while considering material accessibility constraints (market availability), along with material reserve capacities, is vital for achieving the level of technological development required for some temperature targets. Incorporating these pieces of information is essential for any IAM aiming at providing more realistic predictions. In addition, it is imperative to include in IAMs other CETs overlooked here, like fuel cells or electric motors, since their development will increase the demand for critical materials such as dysprosium, neodymium, nickel, and silver.21 This inclusion will enable future studies to assess these technologies and anticipate potential challenges more accurately.
On the other hand, we observe that the demand for materials is also influenced by the effects of learning curves, denoted by the star signs in Fig. 3. Cadmium, dysprosium, gallium, indium, neodymium, selenium, silver, and tellurium, serve as prime examples of this phenomenon. However, there are many challenges ahead of attaining these intensity reduction levels.39 Therefore, aside from investments aimed at boosting material production rates, expanding the capacity of both mine and mineral refineries, there is a need for research and development efforts focused on reducing technology dependencies on these challenging materials. Ultimately, IAMs should consider the effect of technological advancements and link them to material constraints to become suitable for modelling future technology capacities.5
In this context, material recycling is essential in circumventing supply disruptions and preserving finite resources.40 However, previous studies report that, even after employing improved recycling processes, supply may still fall short of demand,41 an issue further investigated in Section 3.6.
In any case, the retirement of technologies is expected to occur mainly after 2050, resulting in a market of obsolete technologies that can be used for materials recycling. Before 2050, materials replacement remains an option (Table S20, ESI†), provided it does not compromise technology performance, an issue necessitating thorough examination. For example, sulphur dioxide is a potential alternative to selenium dioxide, yet it exhibits comparatively lower energy efficiency. Additionally, bismuth, calcium, lead, phosphorus, selenium, and sulphur are among the elements viable for replacing tellurium in numerous free-machining steels, but often result in decreased efficiency or altered product characteristics. Similarly, graphene has been engineered as a substitute for indium tin oxide electrodes in solar cell technology.38 However, improper material incorporation in PV panels would lead to reduced efficiency, thus resulting in more units and increased land requirements to achieve the same service.
Currently, most IAMs overlook the explicit representation of material cycles, ignoring how materials move through the stages of production, use, and disposal.5 Omitting such information makes them myopic to additional constraints that may limit mitigation trajectories in practice. Considering the level of aggregation of industrial activities in IAMs, we acknowledge the challenge of representing complex industrial networks for material production, manufacturing, and recycling. However, we also claim the need to improve the link between mitigation trajectories and underground realities. Hence, as a first step towards further evolving IAMs, we advocate considering at least different technology types and linking them to the availability of materials through the corresponding material intensities and learning curves. This simple modification would add little mathematical complexity while adding a new layer of constraints to obtain more realistic estimates.
3.3 Additional challenges are foreseen for coproducts
Elements sometimes coexist within rock formations, resulting in what is known as a “guest element”, acquired as a byproduct during the extraction of the so-called primary or “host” element.38,42 An illustrative instance is the worldwide production of iridium, 98% of which is obtained as a byproduct of platinum extraction.42 Sourcing guest elements in large quantities could potentially be problematic as they have limited, if any, dedicated extraction activities today.In this section, we examine the demand for host elements necessitated by CETs and use it to derive the amount of the corresponding guest elements that would be generated as byproducts in the process. Then, we use these values as benchmarks (i.e., denominator) to compare the specific demand for guest elements originating from CETs (numerator). For materials that this ratio lies above one, shortages could be experienced unless additional actions are implemented. Further details on the calculations are provided in Section B.5 (ESI†).
As shown in Fig. 4, based on the median values, the annual demand for all elements except for gallium and silver may exceed their annual production as byproducts. This suggests that, in certain cases, larger quantities of their host elements might need to be extracted to meet the required demand for the guest element.
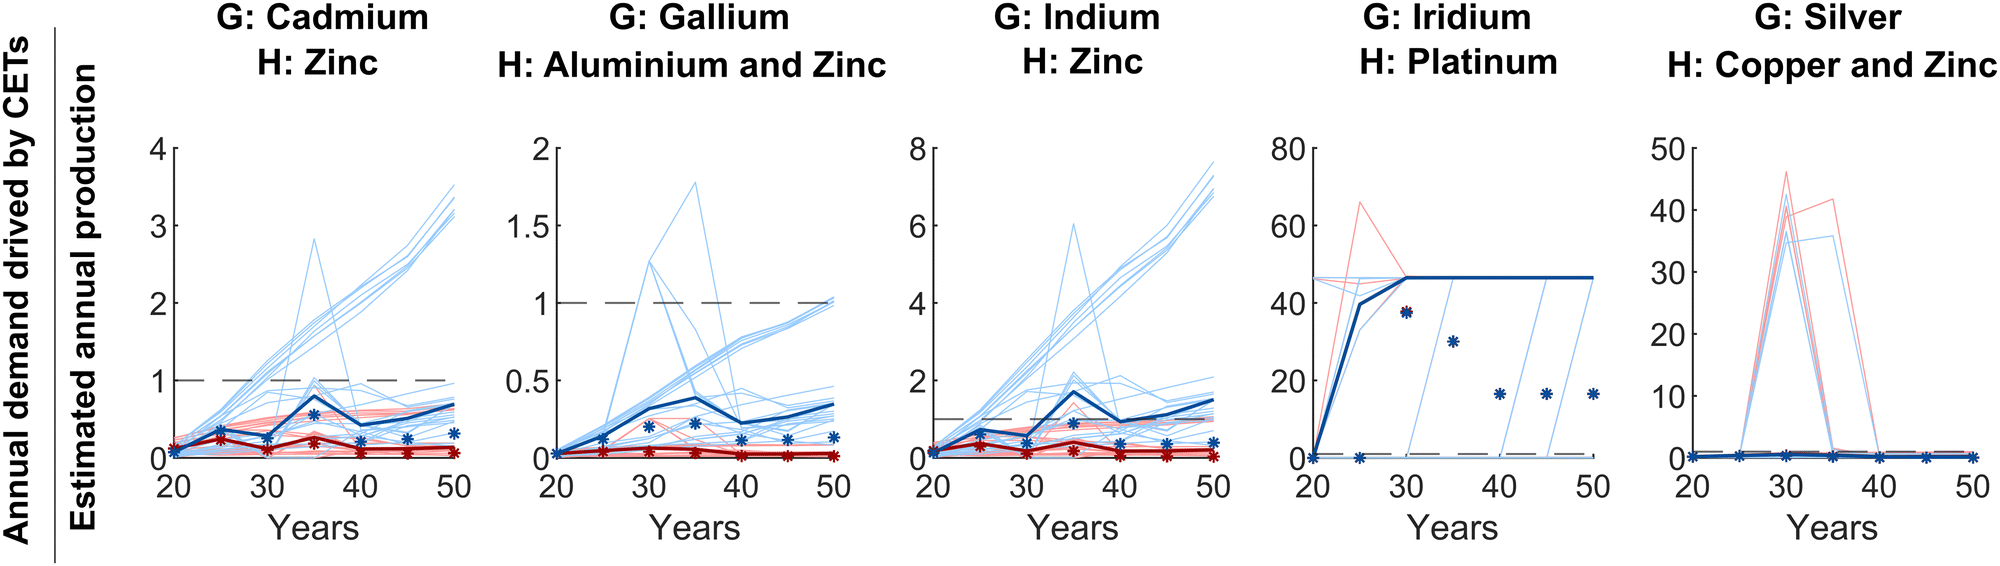 | ||
| Fig. 4 Ratio between the annual demand for guest elements and their potential production as byproducts. We have included a horizontal dashed line at y = 1 to aid comparison. In most of the IAMs scenarios, there is almost no demand value for iridium and platinum before 2030, as the development of their host technology, electrolyzers, commences mainly after 2030. Timeframes are indicated as 20:2020, 30:2030, 40:2040, and 50:2050. The results of the continued trend and technological change are distinguished by red and blue colours (see Table 2). In both cases, the median is depicted with a thicker line. The effect of the reductions in material intensities due to learning curves is indicated with star signs, only for median projections. CETs: clean energy technologies. | ||
For cadmium, gallium, and indium, scenarios based on the technological change market contribution (blue lines) present a more challenging situation owing to the higher share of CdTe and CIGS PV panels in the market. Specifically, when considering the median values, the market contribution plays a decisive role for indium.
The continued market scenario seems effective in addressing these elements, yet it might not suit all materials. For example, it resolves the issue of indium supply by reducing contributions from CIGS and CdTe panels, yet the increased penetration of CSi PV panels would result in a higher demand for other problematic elements like silver (Fig. 3). This challenge is somewhat alleviated when considering the effect of learning curves, as indicated by the star signs. This highlights the importance of investing in material-related research when advancing CETs, particularly concerning these elements.
In the case of iridium, its median demand would rapidly surge to 46.5 times the annual production that could be obtained from its host element (platinum). Fortunately, reducing iridium intensity seems attainable thanks to a recent breakthrough by Torrero et al., who developed an advanced catalyst with a ten-fold reduction in iridium loading.43 Nevertheless, even with these improvements, iridium demand would escalate to 16.5 times the amount that can be produced as a byproduct. An alternative solution could involve replacing iridium in platinum–iridium alloys with elements such as tungsten, nickel, ruthenium, osmium, copper, gold, rhodium, or palladium. However, this substitution might alter the resulting alloy's electrical resistance and thermal expansion coefficients.44
Challenges related to other guest elements like cadmium, gallium, or indium are generally less significant than iridium. The same conclusion could be reached for silver based on median values, yet challenges may arise between 2025 and 2040 if the development of wind turbines and, in turn, the demand for zinc (host) is small.
On the other hand, we note that other sectors also require host elements, which could potentially lead to an increased production of guest elements. For instance, 75% of the global copper supply caters to non-energy sectors.30 In this context, surpluses of host or guest elements could impact their pricing and the associated CETs. For instance, while zinc is not problematic, it attracts attention because it is linked with cadmium, gallium, indium, and silver. Consequently, its production rate and price are interlinked with and influenced by the supply of its guest elements and their prices.
Capturing all these connections, which could ultimately affect the market shares of the different technology types, would be very challenging for IAMs unless they are linked to more detailed sector-specific partial equilibrium models.45,46 Integrating these models into current IAMs, where industrial sectors are highly aggregated, will necessitate time. As a compromise solution in the interim, IAMs could incorporate constraints on materials supply, considering specific bonds between guest and host elements. This represents an opportunity for IAM developers since models that link technology types with constraints on materials supply can capture the effect of various market contribution scenarios more effectively. Again, this highlights the importance of considering technology types and modelling the supply of, at least, key problematic elements to ensure that IAMs can offer a more realistic representation of the range of actions available to combat climate change.
3.4 Increasing technological resolution in IAMs is imperative
We next dig further into the intricate connections between various CET types and problematic materials so as to evaluate the consequences of potential material shortages in developing specific designs (Fig. 5). Ribbons in the figure symbolize the connections between the materials and their corresponding technology hosts based on material intensity values for 2020. All these materials, except for cobalt, copper, praseodymium, graphite, lithium, and nickel, are expected to exhibit a reduction in their material intensity over the decades due to learning curves, which could benefit technology development (please refer to Fig. S4 to visualize the effect of learning curves on technologies available in the 2050 market, ESI†). We note that not all the 36 materials studied (Table S5, ESI†) are included in Fig. 5. Instead, we focus only on problematic materials outlined in Fig. 3.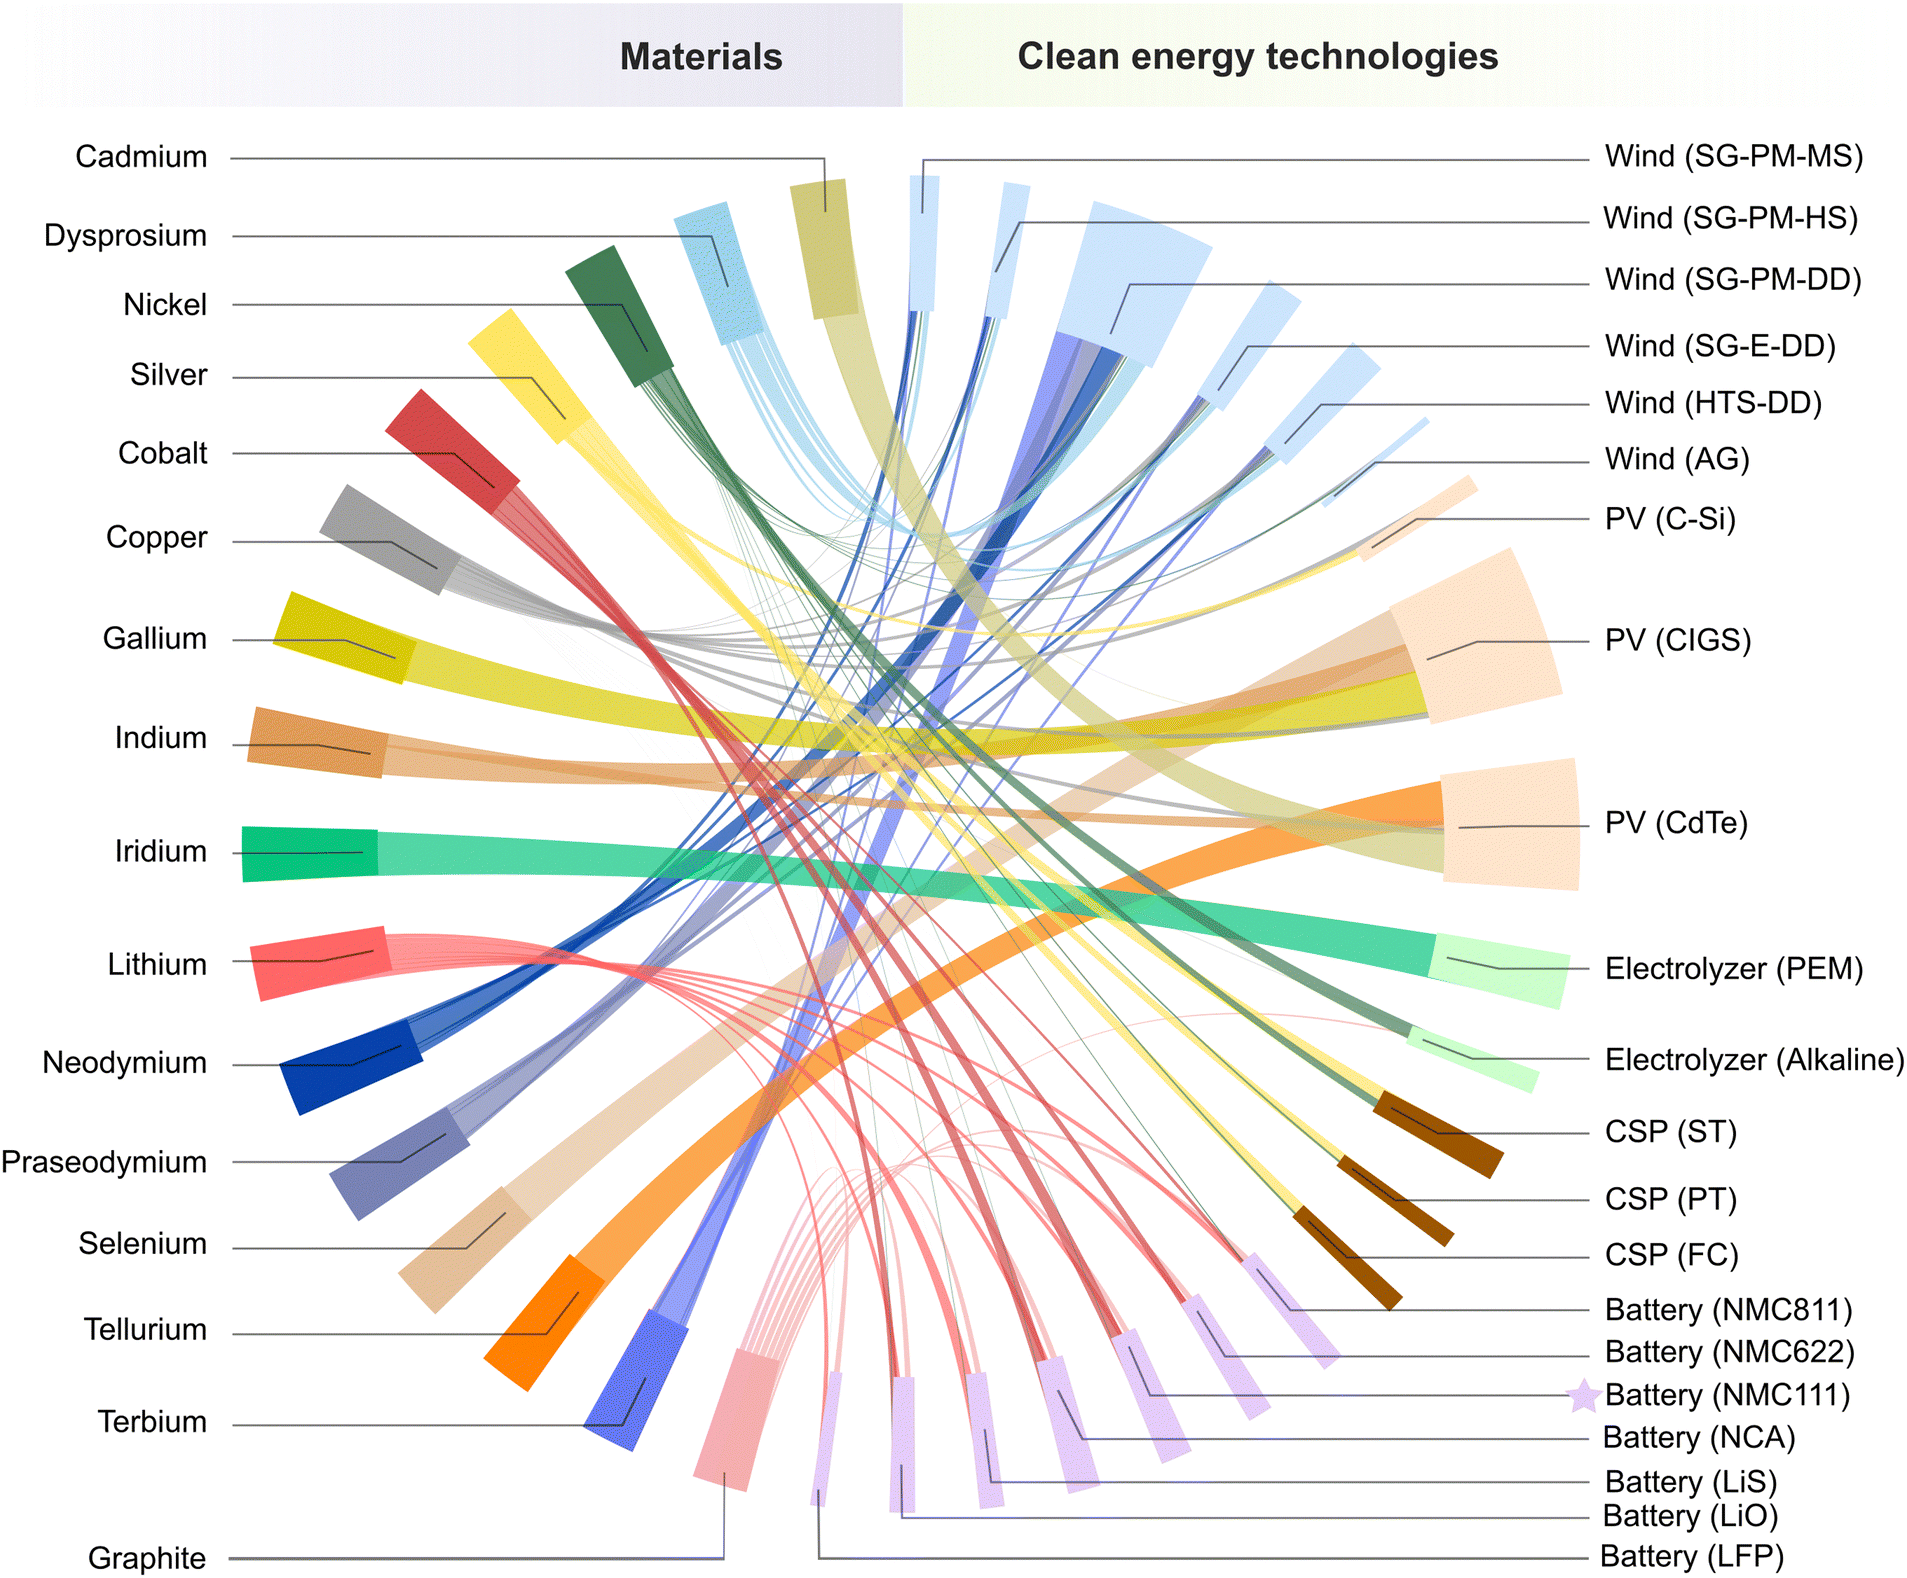 | ||
| Fig. 5 Links between materials (left-hand side) and clean energy technologies (right-hand side), based on material intensity values in 2020. The width of the ribbons is proportional to material intensity values. Technologies that will disappear by 2050 according to both market contribution scenarios are distinguished by a star. Material intensity values have been normalized to ensure visibility (see Section B.7 of the ESI†). For clarity, technology types are enclosed in brackets, with the corresponding acronyms found in Table 1. | ||
Considering the right-hand side of the figure, it becomes evident that all types of PV panels heavily rely on problematic materials, which raises concerns about our capacity to develop this technology at the expected rate. The situation is particularly concerning for CIGS panels, which demand three problematic elements: indium, whose annual production should increase by up to 8-fold over the next three decades (Fig. 3a), as well as gallium and selenium, both signalling a potential price increase owing to additional demand from competing sectors (Fig. 3b). Consequently, developers might opt to prioritize the development of CSi and even CdTe types to mitigate the potential scarcity or price increase in elements associated with CIGS panels. However, this shift could also threaten the supply of silver. Based on Fig. 3a, the demand-to-supply ratio for silver could slightly exceed one, while Fig. 3b shows that the demand from CETs could rise up to 53 times that of 2020. This indicates that, while such a shift may be feasible, it would have higher costs for CSi panels and may also affect CSPs development. Specifically, all types of CSPs show a high dependency on silver, while ST-type CSPs also require nickel, primarily used by the electrolyzers.
Most IAMs model investments in technologies based on the economic performance of competing alternatives considering perfectly functioning markets.6,12 This approach often reflects first-best policies, providing valuable optimal scenarios for benchmarking.12 However, these models may not encompass all real-world complexities. Real-life policy and consumer choices do not always align with purely economic rationality.4 While attempting to incorporate these aspects into models, including IAMs, may seem ambitious, establishing a direct link between technology assets and the specific amounts and types of materials required for their construction appears more straightforward. This approach, although still not perfect, would allow IAMs to immediately discard infeasible situations with marginal modelling and computational effort.
For instance, our calculations suggest that if the focus shifts to CdTe panels, it will further strain the supply of cadmium and tellurium. As shown in Fig. 3, tellurium is among the most problematic elements due to its production rate and potential price increase, while cadmium is a byproduct showing signs of price surges due to its rapidly increasing demand. Therefore, an IAM including some constraints on the availability of materials might opt for CSi panels. Ideally, IAMs should also include the effect of technological advancements on material intensities, as they can draw a significantly different picture of the landscape of CETs (Fig. S4, ESI†).
All these issues are not exclusive to PV panels. Similarly, wind turbines, especially the SG-PM-DD turbine type, will face challenges in their development. Even considering the new technology types that may appear in the market (Fig. S4, ESI†), all types have a link with some of these problematic materials. Their main obstacles are rare earth elements, which include dysprosium, neodymium, praseodymium, and terbium. These elements are crucial components in the permanent magnets of wind turbines.22 While alternative options exist, rare earth elements are considered irreplaceable due to their superior performance.47 According to the technological change market, by 2050, the focus will shift to any wind turbine type rather than SG-PM-DD due to its dependency on praseodymium. Although praseodymium's demand-to-production ratio never exceeds 0.8 (Fig. 3a), its potential price increase could be the critical point (Fig. 3b).
The situation is also critical for PEM electrolyzers due to their reliance on iridium and, consequently, on platinum (iridium's host element). Alkaline electrolyzer development faces challenges given its dependency on nickel and graphite. However, if both technologies eventually achieve the intensity values targeted in their learning curves, PEM electrolyzers may gain an advantage over alkaline electrolyzers (Fig. S4, ESI†), enabling them to lead the market. Hence, the consideration in any model of material availability and material intensities, varying over time, could result in different market trends compared to those externally defined. On the other hand, IAMs opting for the simulation of exogenous market shares could spot whether these are attainable if the IAM accounts for material flows, as advocated here.
Cobalt, nickel, copper, graphite, and lithium pose challenges for battery development. Among them, copper is also in demand for PV and wind technologies, and nickel is needed by CSPs and electrolyzers as well. All these elements are experiencing significant demand increases, potentially leading to competition with other applications and affecting battery costs. Lithium, which is more demanded from LiS battery types33 (not relevant in 2020; see Fig. S4, ESI†), is also identified as an element requiring a substantial increase in its production (Fig. 3). Technology learning curves do not greatly impact different battery types. Still, the disappearance of NMC111 and the introduction of new battery types like LiS and LiO into the market would influence the demand for materials, particularly for cobalt and lithium. However, a different trajectory for the development of batteries in particular, and CETs in general, might arise due to shortages in material availability or sudden price surges within this sector. Additionally, including explicit projections for EVs and their battery requirements in IAMs would be beneficial for future studies, enhancing their comprehensiveness and accuracy.
All these factors can profoundly affect adopting the associated types of CETs, which are inherently intertwined with the materials sector. Consequently, fluctuations in material supply pose a tangible barrier to realizing the projected capacities envisioned by IAMs, which, today, are myopic to these material flows, technology types, and their market shares.
3.5 Introducing material flows into IAMs to obtain more realistic solutions
In previous sections, we highlighted the limitations preventing IAMs from providing reliable projections. In this section, we illustrate a straightforward method to enhance these models. Departing from their capacity projections for technology archetypes, we employ a bottom-up approach to evaluate the realistic deployment capacity of different types of CETs. This evaluation considers (a) material availability constraints and (b) different technology types. This will allow us to identify the designs with the lowest dependence on problematic materials and quantify the gap between realistic estimates and the projections outlined by IAMs.To attain these objectives, we have developed an optimization model that places constraints on the availability of the 36 materials assessed in this study. These constraints serve two purposes. Firstly, they limit the demand for each material based on the reserves assessed in 2020, which is crucial for minerals like cobalt, indium, selenium, silver, and tellurium, for which the demand may exceed reserve capacity (Fig. S5, ESI†). Secondly, they constrain the share of any material dedicated to advancing CETs based on 2020 levels. This simulates the situation where other sectors demanding these materials grow proportional to the clean energy sector. Note that we do not integrate these constraints directly into IAM formulations; instead, we build a separate model that takes advantage of the capacity for CETs projected by IAM.
Acknowledging that future pathways might not necessarily follow the pattern of past transitions, we project the production rate of the different materials in coming years based on historical trends, which depicts an average annual growth of metal mining of 2.7% since the 1970s.48 We also conduct a sensitivity analysis by varying this increase between 0.7% and 4.7% (i.e., historical trend ±2%); we will refer to these as the pessimistic and optimistic scenarios.
Regarding technological resolution, our model covers 21 technology types across five technology archetypes (Table 1). Each technology type has specific material requirements, which may vary over time depending on the trends followed by material intensity (i.e., base vs. learning), ultimately affecting material demands.
The aim of this model is to mathematically demonstrate whether IAM projections for CETs are achievable considering the aforementioned constrains in material availability and supply. To this end, we estimate the capacity of a given technology archetype (e.g., PV) by combining the individual capacities that can be developed for the corresponding technology types (i.e., C–Si, CIGS and CdTe panels) according to the materials available, and minimize the disparities compared to IAM projections. As an example, we try to meet the PV capacity projected from IAMs by developing any type of PV panels. We perform this analysis across the 25 IAM scenarios, considering three different materials production rates and two materials intensity trends. The outcome is a range of potential capacity shortages, illustrated in Fig. 6(a), as well as the preferred technology types based on materials availability considerations, as presented in Fig. 6(b). Refer to Section C in the ESI† for more details on the model.
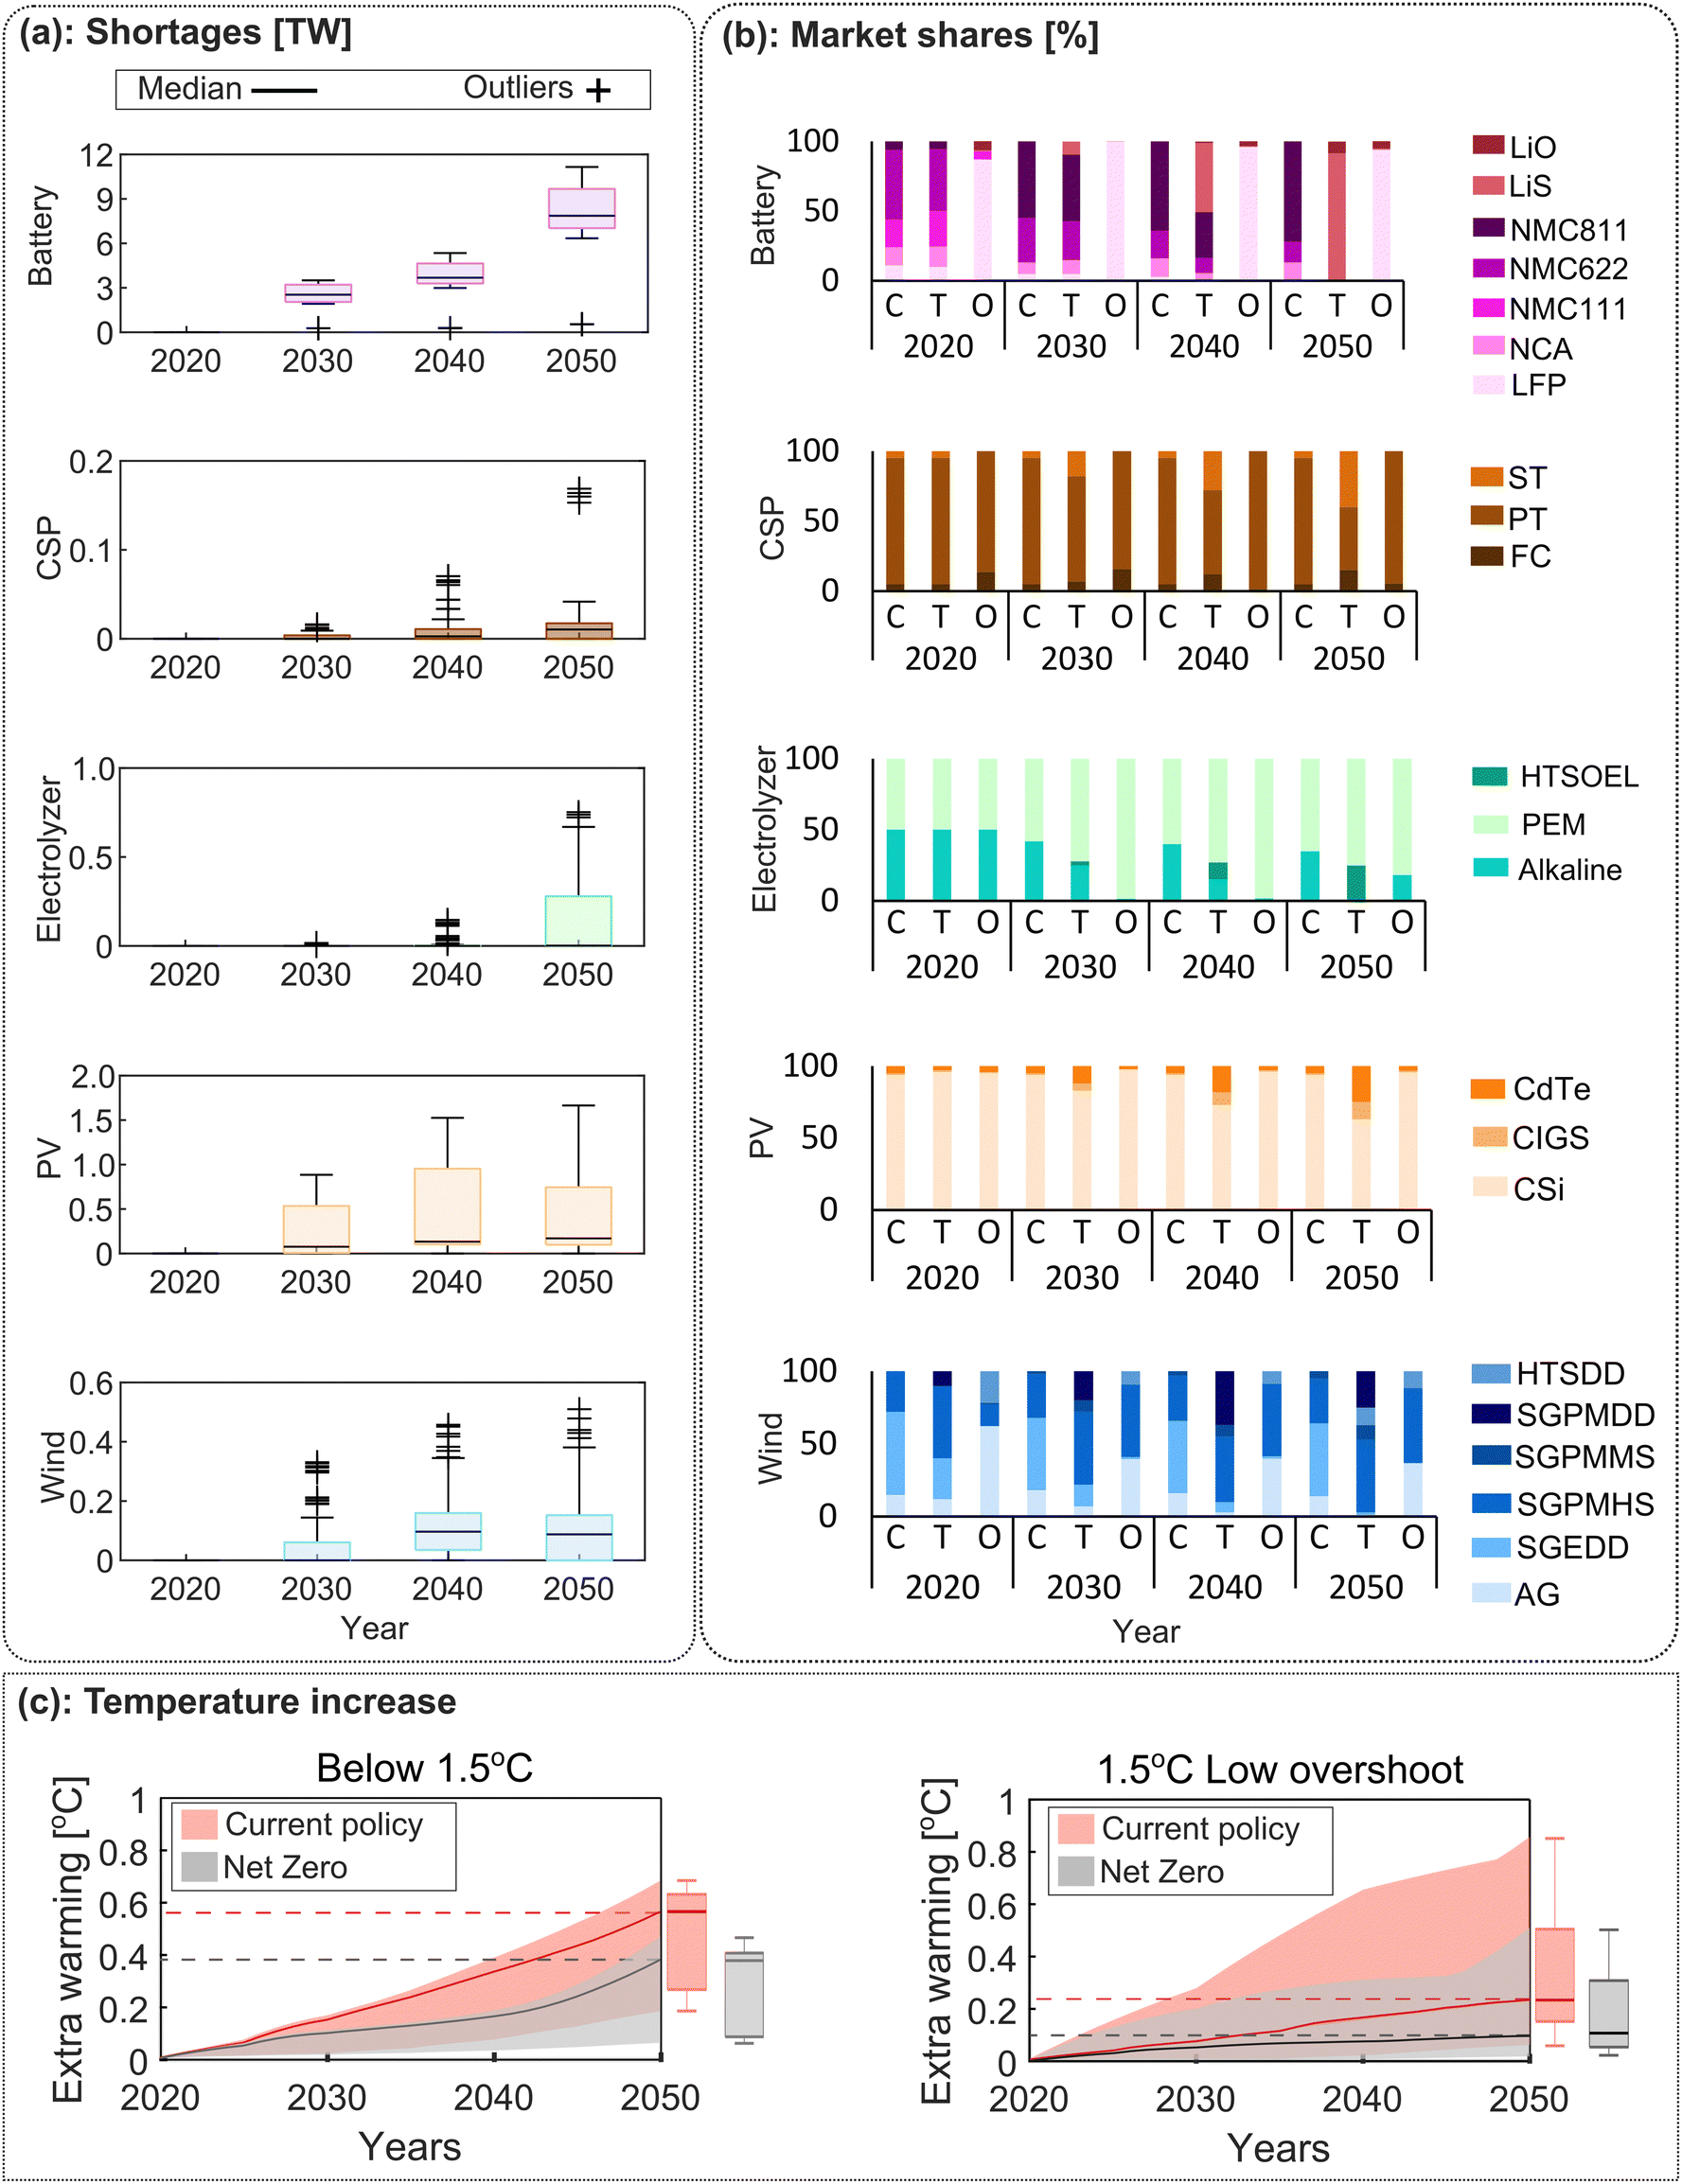 | ||
| Fig. 6 Assessment of shortage capacities in clean energy technologies development. (a) Shortage in developed capacity of clean energy technologies for each year obtained from the optimization model. The boxplot in each instance represents the disparity between the technology's optimized capacity and IAM projections, illustrating the variability of this shortage as a function of potential fluctuations in material production rates and their intensity; (b) market share of different technology types based on a continued trend (C), technological change trend (T), and the optimization model (O); (c) extra warming due to the shortages in the capacity of CETs based on carbon intensity values for “below 1.5 °C” and “1.5 °C low overshoot” temperature targets. The solid line inside each curve corresponds to the median value obtained from six sets of the results (i.e., three material production rates and two different material intensity trajectories) for each of the 25 IAM scenarios. | ||
Fig. 6a offers a comprehensive overview of the outcomes for each of the five technology archetypes assessed, unveiling varying challenges. Our model indicates that, while each technology faces potential shortages, achieving projected capacities for electrolyzers may be feasible based on median values. However, it is important to note that if material supply grows according to our pessimistic estimates, electrolyzer capacity could decrease significantly (e.g., a 752 GW shortfall), primarily due to iridium unavailability. This decline would represent a 99% shortfall compared to the projections from MESSAGEix-GLOBIOM 1.0 (Fig. S6, ESI†), which anticipated a high development rate and cumulative capacity for electrolyzers, particularly after 2045 (Fig. 1 and 2). Similarly, potential shortages of copper and neodymium would prevent us from reaching IAM projections for wind turbines, with a median shortage of around 88 GW or 54% lower capacity by 2050. These would be even higher for scenarios projecting simultaneous increased wind and PV capacity such as CD-LINKS_NPi2020_400 based on WITCH-GLOBIOM 4.4 (435 GW shortage in wind capacity in 2050, see Fig. S6, ESI†).
The median shortfall is less pronounced for CSP (10.4 GW in 2050). However, under a pessimistic situation, we could lose the entire 169 GW projected for this technology in the IMA15-TOT scenario from IMAGE 3.0.1 model. It is worth noting that this scenario envisions the most rapid escalation in annual installed capacity of the CSPs and the highest cumulative installed capacity by 2050 (Fig. 1 and 2).
Even more profound challenges arise when meeting IAM projections for batteries and PV panels. Focusing solely on mobility batteries, our estimates indicate a consistent shortfall, reaching up to 11.1 TW or 94% of the capacity estimated based on the REMIND-MAgPIE 1.7-3.0 for this technology in 2050 (Fig. S6, ESI†). Median values also reveal remarkable shortages that start this decade. This underscores the critical need for mineral production rates to outpace the 4.7% annual increase assumed here for the optimistic scenario, or for a substantial allocation of minerals to develop CETs to meet battery projections. Shortages are also apparent for PV panels when compared with ambitious projections of REMIND-MAgPIE 1.7-3.0, reaching up to 1.6 TW or 94% in 2050, mainly due to the limited availability of copper. Similar challenges are observed for gallium, graphite, indium, selenium, silicon, and tellurium, whose supply would be completely exhausted in certain years. These results reveal that including constraints on materials availability would increase the accuracy of IAM projections. Either expectations for rate of these technologies development will have to be scaled back, or rate of material production will have to be scaled up, or both.
While a brief surge in annual mineral production may be feasible for a limited period, sustaining such high rates for about three decades poses significant challenges. This becomes crucial, especially if we aim to shield other economic sectors from the repercussions of the rapid development of CETs. In the backdrop of COP28, where some countries aim to triple global renewable power generation capacity by 2030,49 a reevaluation of IAM capacity projections is imperative. We suggest that these projections should consider material availability, an issue not perceived as problematic in the past but demonstrated to be essential here.
Considering the present and future landscape of materials supply, certain technology types emerge as the most reliable bets for deploying clean energy (Fig. 6b). These include LFP batteries, PT CSPs, PEM electrolyzers, CSi PV panels, as well as AG and SG-PM-HS wind turbines. These technologies exhibit increased capacity in our optimization model compared to continued and technological change market contributions. Indeed, we already anticipated potential shortages in the developed capacity of PV panels and a heightened focus on CSi panels in Sections 3.2–3.4. In addition, by running our model and failing to meet IAM projections, we mathematically demonstrated that the two (or any other) market trend scenarios are, by definition, infeasible when considering IAM projections.
In any case, it is important to note that under a free-market scenario where developers and customers might opt for technology types different from those selected by our model, disparities from IAM capacity projections may exceed our estimations. Hence, we underscore the importance of factoring in specific technology types in IAM capacity projections for each archetypal technology.
Similarly, here, we adopted a conservative approach whereby the availability of guest elements was not based on the production of their host elements but only limited by the growth in their supply. This is equivalent to assuming that dedicated extractions could take place if needed.
Notably, technological innovation and reductions in material intensities hold promise in alleviating potential shortages in technology development, yet competition among different technologies for the same materials may lead to unintended consequences. For instance, reductions in material intensities could result in additional 23 GW of PV panels in 2050. However, this would bring a decrease of 11 GW in the capacity for wind turbines owing to the reduced availability of materials like aluminium, copper, and nickel, also used in PV panels.
While our analysis is limited to CETs, it is important to note that material constraints will inevitably impact other aspects of any IAM into which they would be introduced. As an illustrative example, the capacity projected for PV by the GENeSYS-MOD model under no climate assessment target is nearly three times the median capacity projected across the 25 scenarios in our study, while its projection for wind aligns closely with the upper bound of the projection ranges in Fig. 2.20 Indeed, some models anticipate cost reductions for CETs based on technological advancements and, in consequently, they assign significant capacity to these technologies, independent of climate considerations. Therefore, we expect a more realistic depiction of future scenarios by incorporating these constraints into any IAMs. Adding material constraints will not only impact the deployment of CETs but also other aspects connected with the various sectors within each model. These impacts may vary depending on the model and scenario used, as each model depicts reality differently.
While we recognize that our assumptions may not perfectly align with reality, they arguably offer an upper bound on the actual availability of materials and, consequently, CETs. For instance, our model implicitly assumes free global flow of raw materials, while the global trade landscape is far from friction-free, and geopolitical tensions and transportation requirements would further affect the availability of materials and technology costs. For instance, the value chains of PV panels rely on minerals like copper and aluminium, typically sourced from China and Africa, assembled in developing Asian economies, and distributed worldwide.50 This emphasizes the importance of addressing regional supply constraints and associated challenges in future studies.
Establishing a direct link between industrial assets and required materials represents a pragmatic starting point to address material supply chain complexities and technology development challenges. Despite its limitations, this approach lays the groundwork for more comprehensive solutions that target the root causes of optimistic projections.
On the other hand, any shortfall in the capacity developed for CETs would directly impact our ability to achieve the 1.5 °C target of the Paris Agreement. To illustrate this, we estimate the additional GHG emissions that would be released due to shortages in the capacities projected for various technologies, and translate them into the corresponding temperature raise. This is achieved by compensating shortages in CETs (compared with IAM projections) with equivalent services (e.g., electricity or transportation) offered by business-as-usual options (e.g., grid electricity or diesel cars). We exclude electrolyzers from this analysis, assuming that the hydrogen they produce would be used in chemistry (instead of energy) applications.
Arguably, the carbon intensity of these alternative options will vary over time, reason why we employ prospective life cycle assessment51 to calculate their associated GHG emissions between 2020 and 2050. Acknowledging that the technology trajectories obtained with our optimization model do not correspond to any specific IAM scenario, we use two conflicting scenarios to estimate the carbon intensities of these alternative services. On the one hand, the current policy (CP) scenario considers the second Shared Socio-economic Pathway (SSP2) and a representative concentration pathway with a radiative forcing level of 3.4 (RCP3.4), allowing global warming to exceed 2 °C. This scenario would provide an upper bound on carbon emissions, reflecting a situation where a slow decarbonization results in failing to meet the Paris Agreement. This is arguably consistent with scenarios for which our model discerns significant shortages in CETs. On the other hand, the net zero (NZ) scenario aligns with SSP1 and RCP 1.9, prioritizing the deployment of CETs and other measures to limit global warming to 1.5 °C. Thus, NZ serves as a lower bound for the carbon footprint of the alternative services, and thus, is better aligned with scenarios with minor shortages of CETs. Acknowledging the uncertainty associated with both estimates, we opted to assess the 25 IAM scenarios analysed with the two carbon intensities, avoiding the need to arbitrarily match each of the 25 IAM scenarios considered with one of the two carbon intensity trajectories (i.e., CP vs. NZ). This approach results a wide range of estimates that better covers all potential realization of uncertainties. Further details can be found in Section D of the ESI.†
Fig. 6c illustrates the additional warming for the different cases analysed. CET shortages in scenarios consistent with the “Below 1.5” temperature target could result in a median temperature raise of additional 0.38 °C (0.06–0.46 °C) under NZ. The situation would be even worse under CP, where the median extra warming would reach 0.56 °C (0.18–0.68 °C), underscoring the urgency of decarbonizing the electricity grid and the mobility sector by embracing renewables or alternative options like biofuels.52
The situation is slightly milder for scenarios consistent with the “low overshoot” temperature target, where shortages in CETs would translate into additional 0.10 °C (0.01–0.50 °C) under NZ. Still, the temperature could raise by additional 0.85 °C in the most pessimistic estimations. It is important to note that the values provided for these scenarios should be further increased by 0.10 °C to reflect the overshoot.53
Overall, these findings resonate with previous observations that IAMs can sometimes offer overly optimistic trajectories for climate change mitigation. In this case, the optimism stems from a lack of technological resolution together with information regarding the material flows, essential for constructing clean energy assets. Adding these two pieces of information into IAMs, while moderately simple, could dramatically change the outcome of these models, as demonstrated by these calculations.
3.6 Could material recycling be the solution?
Arguably, recycling retired technologies can significantly impact material availability, mitigating the shortages and supply chain disruptions anticipated in the previous sections. It can also reduce the need for long-distance transport of materials, making them available in regions lacking the corresponding natural assets.Motivated by these factors, we next estimate the minimum recycling rates that would be required for each material to meet the CET projections from IAMs. To accomplish this task, we employ a second optimization model, similar to the one described in the preceding section, where we integrate recycling as an option to increase material supply. We run our model 12 times for each of the 25 IAM scenarios, each considering a different combination of the two market trends, the two material intensity projections, and the three annual production rates for each material. This entails a total of 300 (i.e., 25 × 12) estimates for each material. Further details about the model are outlined in Section C of the ESI.†
Results are presented in Fig. 7, where we illustrate the recycling rates required as a percentage of the annual production of each material. If available, current recycling rate are also depicted for comparison. Materials excluded from this figure demonstrate an almost negligible need for recycling.
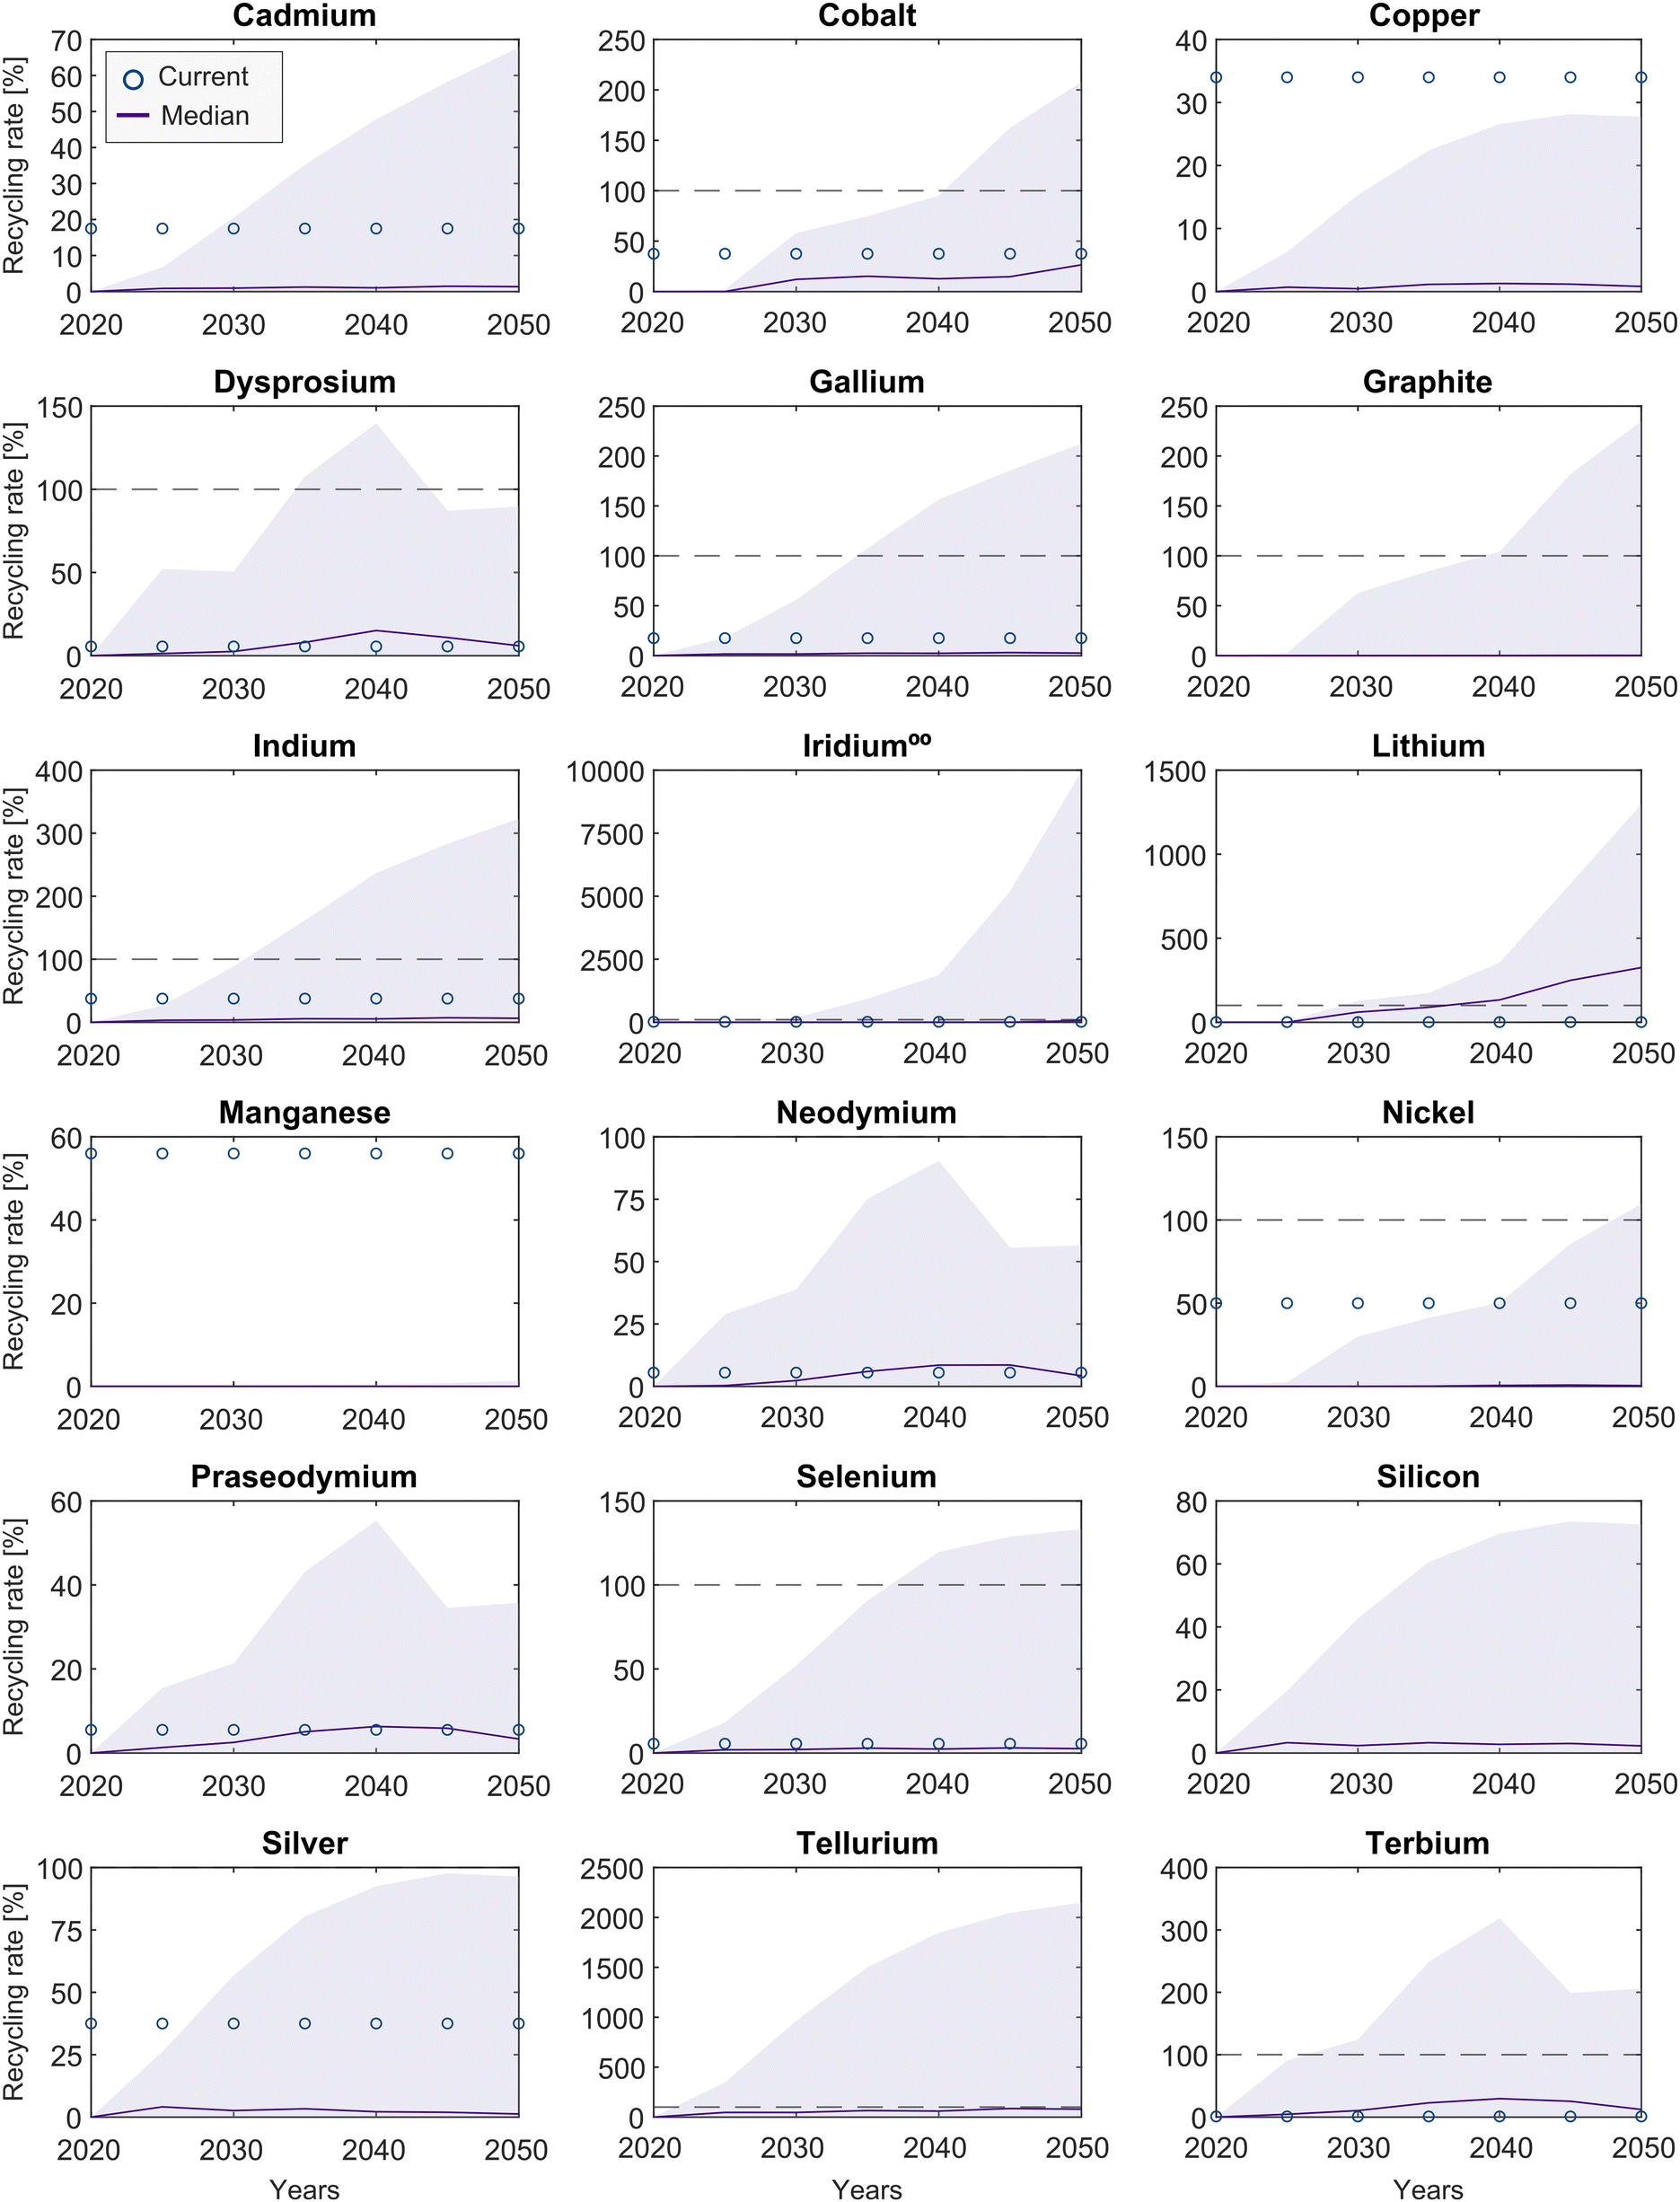 | ||
| Fig. 7 Material recycling rates required to meet IAM capacity projections, expressed as a percentage of annual production. The area presents the range resulting by considering 12 sets of results (i.e., three production rates, two market contribution trends, and two material intensity projections) for each of the 25 IAM scenarios. The purple line denotes the median recycling rate required for each material to meet IAM projections. The circles represent the current recycling rates (Table S12, ESI†). For graphite, silicon, and tellurium current recycling data is not available. Materials not depicted in this figure do not show any need for recycling, based on the scenarios analysed. | ||
Comparison between existing recycling rates and the median values depicted in Fig. 7 underscores the urgent necessity for increasing recycling rates, particularly for lithium (escalating from 1% to 325%), iridium (rising from 17% to 64%), and terbium (elevating from 1% to 12%), but also for silicon, dysprosium, and graphite (all within 0.2–2.2%). For materials like lithium, this would imply recycling more material than produced annually (i.e., the median recycling required in 2050 equals 325% its annual production rate in the same year). Hence, achieving these numbers would require dismantling obsolete devices from several years, a strategy that cannot be maintained forever. In addition, the current recovery of precious metals from electronic waste primarily involves smelting and leaching, resulting in prolonged purification processes and adverse environmental impacts.54
Moreover, with the exception of copper and manganese, the remaining materials show a probability that the current recycling rate is insufficient and needs to be increased. This underscores the necessity for further research on minerals recycling and additional investments to establish recycling units. Both endeavours require significant time, emphasizing the urgency to commence and prioritize these efforts.
3.7 Limitations and uncovered issues
Before concluding the findings, we turn our attention to the main limitations and issues uncovered in this study:1. The projections of technology capacities, market contributions, and material intensities used in our estimations are all dynamic parameters subject to change over time. This inherent variability introduces uncertainty into the conclusions, which could be mitigated by revisiting estimates as newer data become available.
2. Our estimates for the capacity of each technology that could be deployed based on material availability (Section 3.5) rely on the assumption of a friction-free market. This assessment could be enhanced by considering the regional availability of each material, the corresponding transportation requirements, socio-economic factors, and environmental constraints to provide a more accurate representation of real-world practicalities.
3. The discovery of new technological designs using alternative materials, material substitution, and recycling practices are factors that can significantly impact material demands in practice. Incorporating these considerations could enhance the accuracy of projections for material demands.
4. Beyond the scope of the technologies evaluated in this study, the demand for other technologies (e.g., electric motors, fuel cells) will also influence material markets. Recognizing and accounting for these broader technological spectrums is essential for a more comprehensive understanding of material market dynamics.
5. Finally, we note that the replacement of obsolete CET facilities results in a minor contribution on material demands in our analysis, owing to the temporal scope we consider. However, these might play an important role from 2050 onwards, the magnitude of which will depend on the lifespan eventually achieved by the different technologies.
4. Conclusions
In this contribution, we critically discuss the plausibility of scenarios developed from essential yet imperfect IAMs, in the context of clean energy technologies and the associated critical materials. We base our assessment on 25 scenarios consistent with the Paris agreement, sourced from eight different IAMs.We find that IAMs foresee a steep surge in the annual deployment rate of clean energy technologies. Trying to achieve these projections would exert immense pressure on material supply chains over the next three decades, increasing today's demand from clean energy technologies by up to 571 (for selenium) and current production levels by up to 143 (for iridium). This information, omitted from IAM formulations, is evidence of how optimistic their estimates are since it is hard to believe that the required mining, refining, and manufacturing levels can be achieved in less than 30 years.
Also absent from IAMs, we observe that the expected market contribution of the different technology types (e.g., diverse types of PV panels) and the anticipated change in material intensities over time strongly impact material demand trajectories. For instance, assuming a technological change market trend, rare earth elements such as dysprosium, neodymium, and terbium look prone to material shortages, compromising the manufacture of SG-PM-DD wind turbines. This trend would also put elements such as tellurium, lithium, indium, and selenium at risk and, ultimately, might hamper the development of CdTe PV panels and LiS batteries, among others.
In the realm of IAMs, technological investments serve as a pivotal mechanism to decide among various technologies based on their capital and operational costs, but at a much lower resolution regarding technology types. In addition, IAMs predict technology capacities, ignoring materials availability, which is analogous to forecasting bioenergy potentials neglecting the amount of land that can be used for biomass cultivation. Moreover, while IAMs predominantly focus on the cost-effectiveness of technology deployment, it is arguable that consumers or policy choices might not follow economically rational patterns. This delineation in rationality underscores the complexity of IAMs and the necessity for a more comprehensive integration of real-world market frictions and decision-making dynamics to enhance their predictive accuracy and applicability within the broader economic landscape.
Arguably, to do science-based policymaking, the tools providing the pieces of evidence need to be fit for purpose. In this case, IAMs could be improved by integrating bottom-up energy technology models with top-down aggregated economic equilibrium models. Alternatively, tailored constraints in IAMs could be informed based on dedicated models for specific sectors.
As a first step towards more sophisticated efforts, we underscore the profound impact that slight adjustments can exert on the projected capacities of clean energy within IAMs. Specifically, we evaluated the feasibility of achieving the capacity projections from IAMs by employing a bottom-up approach considering material availability constraints and a higher technological resolution. Results underscored significant shortages in the capacity developed annually for batteries (0–11.1 TW) and PV panels (0–1.6 TW), questioning our capacity to achieve the projections envisioned by the ambitious IAMs. Replacing this lack of clean energy with conventional alternatives to provide the same services, we find that the cumulative additional emitted carbon by 2050 would be about 279–530 Gt CO2-eq, which translates into additional 0.06–0.95 °C above the targeted 1.5 °C. Material recycling could certainly help in bridging these gaps, yet our estimations suggest that current recycling rates for materials are insufficient and need to be increased. In some cases, like lithium, the required recycling rate exceeds its annual production. Hence, incorporating material availability constraints and technological diversity into IAMs offers an opportunity to enhance their predictive accuracy at the cost of marginal mathematical complexity.
In addition to helping provide better advice to policymakers, this opens new research avenues in other scientific fields. For instance, while our calculations offer a more realistic estimation compared to those obtained solely from IAMs, they remain a dramatic simplification of reality, overlooking market elasticities, other environmental issues such as water consumption and dust spreading of mining activities, land use change, and social aspects like miners and farmers rights, among others. This suggests further refinement and frequent updates as newer data become available to provide realistic and timely projections in an evolving landscape. In conclusion, IAMs require continuous improvements to align their predictions more closely with real-world complexities. This alignment could better reflect the dynamic realities of material availability within the clean energy sector, greatly enhancing the relevance of IAMs in the scientific and political spheres.
Author contributions
Fatemeh Rostami: conceptualization, data curation, formal analysis, investigation, methodology, software, validation, visualization, writing – original draft, writing – reviewing and editing. Piera Patrizio: conceptualization, data curation, methodology. Laureano Jimenez: funding acquisition, reviewing, resources, supervision. Carlos Pozo: conceptualization, formal analysis, funding acquisition, investigation, methodology, resources, software, supervision, visualization, writing – reviewing and editing. Niall Mac Dowell: conceptualization, formal analysis, methodology, reviewing and editing, supervision, validation.Conflicts of interest
There are no conflicts to declare.Acknowledgements
The authors acknowledge grants PID2021-127713OA-I00, PID2021-123511OB-C33, and PID2021-124139NB-C22 funded by MCIN/AEI/10.13039/501100011033 and by “FEDER, UE”, grant TED2021-129851B–I00 funded by MCIN/AEI/10.13039/501100011033 by the European Union NextGenerationEU/PRTR, and grant CNS2023-144890 funded by MICIU/AEI/10.13039/501100011033 and by the European Union NextGenerationEU/PRTR.References
- Why ideas of ‘planetary boundaries’ must uphold environmental justice, Nature, 2023, 618(7963), 7, DOI:10.1038/d41586-023-01749-9 , https://pubmed.ncbi.nlm.nih.gov/37259006/.
- B. Sovacool, R. J. Heffron, D. McCauley and A. C. Goldthau, Energy decisions reframed as justice and ethical concerns, Nat. Energy, 2016, 1, 16024 CrossRef , Available: https://api.semanticscholar.org/CorpusID:156910795.
- K. E. N. Sexton and J. Adgate, Looking at environmental justice from an environmental health perspective, J. Exposure Anal. Environ. Epidemiol., 1999, 9(1), 3–8, DOI:10.1038/sj.jea.7500021 , https://pubmed.ncbi.nlm.nih.gov/10189622/.
- I. Keppo, et al., Exploring the possibility space: taking stock of the diverse capabilities and gaps in integrated assessment models, Environ. Res. Lett., 2021, 16(5), 053006, DOI:10.1088/1748-9326/abe5d8.
- S. Pauliuk, A. Arvesen, K. Stadler and E. G. Hertwich, Industrial ecology in integrated assessment models, Nat. Clim. Change, 2017, 7(1), 13–20, DOI:10.1038/nclimate3148.
- M. Harfoot, D. P. Tittensor, T. Newbold, G. McInerny, M. J. Smith and J. P. W. Scharlemann, Integrated assessment models for ecologists: the present and the future, Glob. Ecol. Biogeogr., 2014, 23(2), 124–143, DOI:10.1111/geb.12100.
- D. L. McCollum, et al., Improving the behavioral realism of global integrated assessment models: An application to consumers’ vehicle choices, Transp. Res. D: Transp. Environ., 2017, 55, 322–342, DOI:10.1016/j.trd.2016.04.003 , https://www.sciencedirect.com/science/article/pii/S1361920915300900.
- M. A. E. van Sluisveld, et al., Aligning integrated assessment modelling with socio-technical transition insights: An application to low-carbon energy scenario analysis in Europe, Technol. Forecast. Soc. Change, 2020, 151, 119177, DOI:10.1016/j.techfore.2017.10.024.
- L. van Beek, J. Oomen, M. Hajer, P. Pelzer and D. van Vuuren, Navigating the political: an analysis of political calibration of integrated assessment modelling in light of the 1.5 °C goal, Environ. Sci. Policy, 2022, 133, 193–202, DOI:10.1016/j.envsci.2022.03.024.
- M. Roelfsema, et al., Developing scenarios in the context of the Paris Agreement and application in the integrated assessment model IMAGE: a framework for bridging the policy-modelling divide, Environ. Sci. Policy, 2022, 135, 104–116, DOI:10.1016/j.envsci.2022.05.001.
- K. Koasidis, A. Nikas and H. Doukas, Why integrated assessment models alone are insufficient to navigate us through the polycrisis, One Earth, 2023, 6(3), 205–209, DOI:10.1016/j.oneear.2023.02.009.
- F. Creutzig, P. Agoston, J. C. Goldschmidt, G. Luderer, G. Nemet and R. C. Pietzcker, The underestimated potential of solar energy to mitigate climate change, Nat. Energy, 2017, 2(9), 17140, DOI:10.1038/nenergy.2017.140.
- K. Anderson, Wrong tool for the job: Debating the bedrock of climate-change mitigation scenarios, Nature, 2019, 573(7774), 348 CrossRef CAS PubMed.
- K. Anderson and J. Jewell, Debating the bedrock of climate-change mitigation scenarios, Nature Publishing Group UK, London, 2019 Search PubMed.
- A. Gambhir, I. Butnar, P.-H. Li, P. Smith and N. Strachan, A review of criticisms of integrated assessment models and proposed approaches to address these, through the lens of BECCS, Energies, 2019, 12(9), 1747 CrossRef CAS.
- K. Anderson and G. Peters, The trouble with negative emissions, Science, 2016, 354(6309), 182–183, DOI:10.1126/science.aah4567.
- H. M. Pereira, et al., Scenarios for global biodiversity in the 21st century, Science, 2010, 330(6010), 1496–1501 CrossRef CAS PubMed.
- G. Luderer, et al., Environmental co-benefits and adverse side-effects of alternative power sector decarbonization strategies, Nat. Commun., 2019, 10(1), 5229 CrossRef PubMed.
- D. Yergin, The Age of Big Shovels. Accessed: Apr. 25, 2024. Available: https://musicgitars.com/best-happy-music-ever/.
- D. Huppmann, et al., IAMC 1.5 °C Scenario Explorer and Data hosted by IIASA. Integrated Assessment Modeling Consortium & International Institute for Applied Systems Analysis, 2018 DOI:10.22022/SR15/08-2018.15429.
- S. Schlichenmaier and T. Naegler, May material bottlenecks hamper the global energy transition towards the 1.5 °C target?, Energy Reports, 2022, 8, 14875–14887, DOI:10.1016/j.egyr.2022.11.025.
- S. Carrara, P. Alves Dias, B. Plazzotta and C. Pavel, P. O. of the E. Union, Raw materials demand for wind and solar PV technologies in the transition towards a decarbonised energy system, Luxembourg, 2020 DOI:10.2760/160859.
- P. Lusty, et al., Study on future UK demand and supply of lithium, nickel, cobalt, manganese, and graphite for electric vehicle batteries, 2022 Search PubMed.
- I. E. A., The Role of Critical Minerals in Clean Energy Transition, IEA, Paris, 2022. Available: https://www.iea.org/reports/the-role-of-critical-minerals-in-clean-energy-transitions Search PubMed.
- International Energy Agency, World Energy Outlook 2017, 2017 DOI:10.1787/weo-2017-en.
- IRENA, Future of solar photovoltaic deployment, investment, technology, grid integration and socio-economic aspects (A Global Energy Transformation paper), International Renewable Energy Agency, Nov. 2019. Available: https://www.irena.org/-/media/Files/IRENA/Agency/Publication/2019/Nov/IRENA_Future_of_Solar_PV_2019.pdf.
- Batteries Europe, European Technology and Innovation Platform on Batteries, 2020, Available: https://ec.europa.eu/newsroom/ener/items/696024.
- Energy Post, Projected power sector battery storage capacity demand worldwide in 2030 and 2050, by scenario, Statista. Accessed: Apr. 26, 2024. Available: https://www.statista.com/statistics/1417888/forecast-battery-storage-capacity-demand-worldwide-by-scenario/.
- IEA, Technology Roadmap Concentrating Solar Power, Paris, 2010. Accessed: Apr. 26, 2024. Available: https://iea.blob.core.windows.net/assets/663fabad-397e-4518-802f-7f1c94bc2076/csp_roadmap.pdf.
- IEA, The Role of Critical Minerals in Clean Energy Transitions, Paris, May 2021. Accessed: Aug. 22, 2023. Available: https://www.iea.org/reports/the-role-of-critical-minerals-in-clean-energy-transitions.
- IEA, World Energy Outlook 2022, Paris, Oct. 2022. https://www.iea.org/reports/world-energy-outlook-2022.
- IRENA, Word Adds Record New Renewable Energy Capacity in 2020, International Renewable Energy Agency. https://www.irena.org/News/pressreleases/2021/Apr/World-Adds-Record-New-Renewable-Energy-Capacity-in-2020.
- F. Rostami, Z. Kis, R. Koppelaar, L. Jiménez and C. Pozo, Comparative sustainability study of energy storage technologies using data envelopment analysis, Energy Storage Mater., 2022, 48, 412–438, DOI:10.1016/j.ensm.2022.03.026.
- S. Wang, et al., Future demand for electricity generation materials under different climate mitigation scenarios, Joule, 2023, 7(2), 309–332, DOI:10.1016/j.joule.2023.01.001 , https://www.sciencedirect.com/science/article/pii/S2542435123000016.
- IEA, Critical Minerals Data Explorer, IEA, Paris, 2023. https://www.iea.org/data-and-statistics/data-tools/critical-minerals-data-explorer.
- F. W. Geels, F. Berkhout and D. P. van Vuuren, Bridging analytical approaches for low-carbon transitions, Nat. Clim. Change, 2016, 6, 576–583, DOI:10.1038/nclimate2980 , https://www.nature.com/articles/nclimate2980.
- S. S. Sharma and A. Manthiram, Towards more environmentally and socially responsible batteries, Energy Environ. Sci., 2020, 13(11), 4087–4097, 10.1039/D0EE02511A.
- Mineral commodity summaries 2023, Reston, VA, 2023. Accessed: Apr. 21, 2023. Available: https://pubs.usgs.gov/periodicals/mcs2023/mcs2023.pdf.
- S. Liu, et al., Operando deconvolution of the degradation mechanisms of iron–nitrogen–carbon catalysts in proton exchange membrane fuel cells, Energy Environ. Sci., 2023, 16(9), 3792–3802, 10.1039/D3EE01166F , https://pubs.rsc.org/en/content/articlelanding/2023/ee/d3ee01166f.
- P. Zhu, et al., Built-in anionic equilibrium for atom-economic recycling of spent lithium-ion batteries, Energy Environ. Sci., 2023, 16(9), 3792–3802, 10.1039/D3EE00571B , https://pubs.rsc.org/en/content/articlelanding/2023/ee/d3ee00571b.
- P. Wang, et al., Platinum Shortage Threatens China's Hydrogen Ambition for Carbon Neutrality, 2023 DOI:10.2139/ssrn.4329451.
- N. T. Nassar, T. E. Graedel and E. M. Harper, By-product metals are technologically essential but have problematic supply, Sci. Adv., 2015, 1(3) DOI:10.1126/sciadv.1400180 , https://www.science.org/doi/10.1126/sciadv.1400180.
- J. Torrero, et al., High Performance and Durable Anode with 10-Fold Reduction of Iridium Loading for Proton Exchange Membrane Water Electrolysis, Adv. Energy Mater., 2023, 13(23) DOI:10.1002/aenm.202204169 , https://onlinelibrary.wiley.com/doi/full/10.1002/aenm.202204169.
- H. Schmidbaur and J. L. Cihonski, Noble Metals (Chemistry), in Encyclopedia of Physical Science and Technology, ed. R. A. Meyers, Academic Press, New York, 3rd edn, 2003, pp. 463–492 DOI:10.1016/B0-12-227410-5/00481-6.
- C. W. Frei, P.-A. Haldi and G. Sarlos, Dynamic formulation of a top-down and bottom-up merging energy policy model, Energy Policy, 2003, 31(10), 1017–1031, DOI:10.1016/S0301-4215(02)00170-2.
- C. Böhringer and T. F. Rutherford, Combining bottom-up and top-down, Energy Econ., 2008, 30(2), 574–596, DOI:10.1016/j.eneco.2007.03.004.
- R. Pell, et al., Towards sustainable extraction of technology materials through integrated approaches, Nat. Rev. Earth Environ., 2021, 2(10), 665–679, DOI:10.1038/s43017-021-00211-6.
- N. LePan, Visualizing the Size of Mine Tailings, Elements, Nov. 2023. Available: https://elements.visualcapitalist.com/visualizing-the-size-of-mine-tailings/ Search PubMed.
- IEA, COP28 and IEA High-Level Dialogues conclude with strong consensus on energy transition, IEA. Accessed: Dec. 31, 2023. Available: https://www.iea.org/news/cop28-and-iea-high-level-dialogues-conclude-with-strong-consensus-on-energy-transition.
- R. Fu, et al., Tracing metal footprints via global renewable power value chains, Nat. Commun., 2023, 14(1), 3703, DOI:10.1038/s41467-023-39356-x.
- S. Wei, R. Sacchi, A. Tukker, S. Suh and B. Steubing, Future environmental impacts of global hydrogen production, Energy Environ. Sci., 2024, 17(6), 2157–2172, 10.1039/D3EE03875K , https://pubs.rsc.org/en/content/articlelanding/2024/ee/d3ee03875k.
- R. Cabrera-Jiménez, J. M. Mateo-Sanz, J. Gavaldà, L. Jiménez and C. Pozo, Comparing biofuels through the lens of sustainability: a data envelopment analysis approach, Appl. Energy, 2022, 307 DOI:10.1016/j.apenergy.2021.118201 , https://www.sciencedirect.com/science/article/pii/S0306261921014690.
- IPCC, Summary for Policymakers, in Climate Change 2022: Impacts, Adaptation and Vulnerability, ed. H.-O. Pörtner, D. C. Roberts, E. S. Poloczanska, K. Mintenbeck, M. Tignor, A. Alegría, M. Craig, S. Langsdorf, S. Löschke, V. Möller and A. Okem, Cambridge, UK and New York, NY, USA, 2022 DOI:10.1017/9781009325844.001.
- B. Deng, D. X. Luong, Z. Wang, C. Kittrell, E. A. McHugh and J. M. Tour, Urban mining by flash Joule heating, Nat. Commun., 2021, 12(1), 5794, DOI:10.1038/s41467-021-26038-9.
Footnote |
| † Electronic supplementary information (ESI) available. See DOI: https://doi.org/10.1039/d4ee00747f |
| This journal is © The Royal Society of Chemistry 2024 |