Achieving superior oxygen evolution of perovskite via phase transition and electrochemical reconstruction strategy

Yi-ru Hao a, Hui Xue a, Jing Sun a, Niankun Guo a, Tianshan Song a, Hongliang Dong e, Zhonglong Zhao *c, Jiangwei Zhang *b, Limin Wu *bd and Qin Wang *ab
aCollege of Chemistry and Chemical Engineering, Inner Mongolia University, Hohhot 010021, China. E-mail: qinwang@imu.edu.cn
bCollege of Energy Materials and Chemistry, Inner Mongolia University, Hohhot 010021, China. E-mail: zjw11@tsinghua.org.cn
cSchool of Physical Science and Technology, Inner Mongolia University, Hohhot 010021, China. E-mail: zlzhao@imu.edu.cn
dDepartment of Materials Science and State Key Laboratory of Molecular Engineering of Polymers, Fudan University, Shanghai 200433, China. E-mail: lmw@fudan.edu.cn
eCenter for High Pressure Science and Technology Advanced Research, Shanghai 201203, China

Received 14th December 2023 , Accepted 20th March 2024

First published on 21st March 2024


Abstract

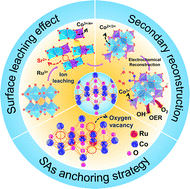
Surface reconstruction is an effective strategy to improve the OER performance of perovskites. However, understanding the reconstruction kinetics of perovskites and revealing real active sites for the OER remain elusive. Herein, we propose a secondary reconstruction strategy including phase transformation and electrochemical reconstruction to promote the electrocatalytic performance of perovskite. The as-prepared perovskite SrCoO2.52 is first reconstructed into Ru atomically dispersed spinel Co3O4 (RuSA-Co3O4) by selective leaching, whose surface is further reconfigured into CoOOH through electrochemical reconstruction. The RuSA-Co3O4/CoOOH catalyst with massive oxygen vacancies exhibits an ultralow overpotential of 175 mV at 10 mA cm−2 and maintains stability for up to 1000 h, which is the best perovskite-derived electrocatalyst to date. In situ XAS analysis and DFT calculations indicate that the valence states of Co species and isolated Ru single atoms are optimized and combined with –O ligands to form Co–O–O and Ru–O–O active sites. The secondary reconstruction can effectively regulate the electronic structure of the active metals thus providing the optimal adsorption energy for the reaction intermediates to promote the charge transfer in the OER process.


Broader context

Surface reconstruction serves as an effective strategy for significantly enhancing the catalytic activity of perovskite oxides. However, surface reconstruction of most perovskite oxides often leads to the formation of amorphous motifs, thereby diminishing substrate utilization and resulting in a limited enhancement in catalytic performance. Meanwhile, the true active site of the catalyst in the OER process remains elusive. Herein, the perovskite SrCoO2.52 undergoes complete reconstruction into spinel Co3O4 through the introduction of Ru, successfully achieving a unique crystal transformation of the catalyst that effectively modulates the electronic structure of the active metal. It is further verified that Co–O–O and Ru–O–O formed by electrochemical reconstruction of catalysts are the real active centers in the OER process. This study opens a new avenue for the design of highly active perovskite OER electrocatalysts and provides an in-depth understanding of the surface reconstruction mechanism.

Introduction

Driven by growing concerns about environmental pollution and energy crisis, the development of alternative energy storage and conversion devices is vital to the strategic goal of energy sustainability.1 As one of the most important half-reactions in electrochemical water splitting, the oxygen evolution reaction (OER) is seriously hindered by the slow kinetics due to the complex and continuous four proton-coupled electron transfer process.2 Noble metal-based catalysts, such as RuO2 and IrO2, are well-known as the most effective OER catalysts, but their scarcity, high cost, and unsatisfactory durability severely hamper their widespread applications.3 Therefore, it is highly desirable to develop cost-effective and efficient OER electrocatalysts. Perovskite oxides have been considered to be one of the most promising electrocatalysts due to their ordered atomic arrangement, unique electronic structure, and structure flexibility.4 Perovskite oxides usually have the common molecular formula ABO3, in which the A-site metals are mostly alkaline earth or rare-earth metals with relatively large ionic sizes, while the B-site metals are usually transition metals.5 SrCoO2.52 has a unique ABO2.5 perovskite structure with a large amount of oxygen vacancies. At present, there have been many research reports on the application of SrCoO2.5+δ in the fields of magnetism, strain, and solid oxide fuel cell electrodes.6,7 However, the intrinsic OER catalytic activity of SrCoO2.5+δ perovskite oxide is still far from desirable due to their low electrical conductivity, insufficient accessible active sites, and high adsorption free energy of intermediates.8

Various strategies like metal doping, reconstruction engineering, and defect regulation have been developed to promote the catalytic performance of perovskite oxides by increasing the accessible active sites, tailoring the electronic structure, and optimizing the adsorption/desorption capacity for oxygen-containing intermediates.9,10 In general, the surface reconstruction of perovskite oxides and the selective leaching behavior of the A-site or B-site ions can be observed simultaneously.11 The surface reconstruction triggered by the metal leaching effect is beneficial for increasing the adsorption of OH and improving the activity of perovskite, thus accelerating the kinetics of the OER.12 The selective leaching of A-site cations can activate B-site metals of perovskite oxides to form unique local structural environments, thus promoting electrocatalytic activity.13 At present, the surface reconstruction strategy of perovskite oxides is mainly derived from the formation of amorphous motifs by sacrificing the crystal structure of the catalyst surface.14,15 However, the amorphous structure of the catalyst in the OER process significantly decreases the utilization rate of the substrate, and it is difficult to detect the exact structure of the surface phase and the active sites. Therefore, it is very valuable and challenging to effectively utilize the reconstruction strategy to achieve the fundamental transformation of the ABO3 crystal structure, optimize the valence states of the active metals, and design highly active and stable electrocatalysts with full crystalline phases. Moreover, it is worth noting that during the OER, the electronic structure and local atomic environment of ABO3 inevitably continue to undergo restructuring, such as phase transition, defect formation, and valence state changes, which may form some active catalytic species.16,17 However, the structure–activity relationship between the transformation of the catalyst structure and the change in the catalytic reaction kinetics is still unclear. In the continuous self-reconstruction of perovskites, the identification of the true active ingredient is also very difficult. Therefore, it is of great significance to monitor the real active sites of catalysts during the real-time reconstruction of catalysts.

To work out this issue, herein, we propose a secondary reconstruction strategy including phase transformation and electrochemical reconstruction. The introduction of Ru3+ induces selective leaching of Sr2+ at the A-site, making the phase transformation of perovskite SrCoO2.52 into the Ru atomically dispersed spinel Co3O4 electrocatalyst (RuSA-Co3O4). Then through the secondary electrochemical reconstruction, a layer of CoOOH is formed on the surface of RuSA-Co3O4 of the catalyst. Accordingly, the as-synthesized RuSA-Co3O4/CoOOH electrocatalyst presents outstanding OER activity, with an ultra-low overpotential of 175 mV at 10 mA cm−2, which is superior to those of all previously reported perovskite-derived OER electrocatalysts. The valence states of Co species and isolated Ru single atoms are optimized and combined with –O ligands to form Co–O–O and Ru–O–O active sites. The secondary reconstruction can effectively regulate the electronic structure of the active metals in the catalyst, thus providing the optimal adsorption energy for the reaction intermediates and promoting the charge transfer in the OER process.

Results and discussion

Crystal phase reconstruction and Ru atomic-level dispersion

To be specific, a pure phase perovskite SrCoO2.52 was synthesized by the traditional sol–gel method. Ru3+ ions, which are hydrolyzed and deposited on the surface of SrCoO2.52, as shown in Fig. 1a, induce the selective leaching of Sr2+ at the A-site, successfully transforming the phase structure of the perovskite into spinel. Subsequently, a specific anode voltage was applied to the prepared RuSA-Co3O4 by cyclic voltammetry (CV) to promote the electrochemical reconstruction of the catalyst surface to RuSA-Co3O4/CoOOH, and generate more catalytic active species. The XRD pattern indicates that SrCoO2.52 with high crystallinity is successfully obtained, corresponding to the standard pure phase perovskite (JCPDS No. 40-1018) and belonging to the Pm[3 with combining macron]m space group (Fig. S1, ESI). Interestingly, after the addition of Ru3+, the distinct diffraction peak at 36.8° is ascribed to the (311) plane of Co3O4 (JCPDS No. 43-1003), and no correlated peak of Ru is observed, indicating the successful structural reconstruction of perovskite into spinel Co3O4 (Fig. S2a, ESI). Furthermore, the crystal structure information of RuSA-Co3O4 is obtained by PDF Rietveld refinement (Fig. S2b, ESI). After the electrochemical reconstruction, the XRD pattern of RuSA-Co3O4/CoOOH showed obvious characteristic peaks of Co3O4 (Fig. S2c, ESI).
image file: d3ee04338j-f1.tif
Fig. 1 Synthesis and microstructure characterization of the electrocatalyst. (a) The in situ structural reconstruction process of SrCoO2.52, (b) and (c) HAADF-STEM images of RuSA-Co3O4, and the insets of (c) showing the corresponding intensity distributions marked by dashed boxes of different colors. (d) HAADF-STEM image of RuSA-Co3O4/CoOOH and corresponding intensity distributions. (e) EELS and elemental mapping results of RuSA-Co3O4/CoOOH.

SEM and TEM images showed the crystal structure reconstruction of the smooth surface bulk perovskite SrCoO2.52 after the introduction of RuCl3·xH2O. The spacing of 0.28 nm is ascribed to the (220) crystal face of Co3O4, confirming the transformation of perovskite to spinel (Fig. S3 and S4, ESI). Meanwhile, the signal of the Sr element is not observed in the EDS spectra and line scans of RuSA-Co3O4 (Fig. S5 and S6, ESI). The decay of the Co signal in the line scan and the color of the centrifuged solution indicate that the introduction of Ru3+ can make complete leaching of Sr2+ ions as well as partial leaching of Co3+ ions (Fig. S5, ESI). This is due to the better thermodynamic stability of the B-site cations in perovskite, thus the A-site Sr2+ ions are more easily dissolved and leached.18 Furthermore, since the signal intensity of aberration-corrected high-angle annular dark-field scanning transmission electron microscopy (HAADF-STEM) is proportional to the square of the atomic number, Ru single atoms dispersed on the Co3O4 substrate exhibit brighter white spots and regular atomic arrangements (Fig. 1b).19 Meanwhile, the local intensity distribution map of HAADF-STEM shows that the Ru atoms occupy the lattice position of the Co atoms (regions 1, 2, and 3 insets in Fig. 1c and Fig. S7, ESI). The aberration-corrected HAADF-STEM reveals that the spacing of 0.24 nm in RuSA-Co3O4 corresponds to the (311) plane of Co3O4, demonstrating the successful reconstruction of the crystal structure (Fig. 1c). The bright spots of Ru atoms further indicate that Ru single-atoms are uniformly dispersed in the lattice of Co3O4. HAADF signal analysis shows that the distances between the bright spots of Ru atoms are 0.28 nm and 0.24 nm (Fig. 1c and Fig. S8, ESI), which indicates that Ru is successfully anchored and atomically dispersed on the Co3O4 (311) lattice arrays.20 Elemental mapping confirms the high dispersion of Ru in RuSA-Co3O4 (Fig. S8c and S9, ESI). Inductively coupled plasma optical emission spectroscopy (ICP-OES) shows that the Ru content in the RuSA-Co3O4 sample is 7.7% (Table S1, ESI). Aberration-corrected HAADF-STEM is used to further characterize the phase changes after the electrochemical reconstruction of RuSA-Co3O4. HAADF-STEM reflects the increase of crystal face spacing, which may be due to the dynamic change of the Co3O4 surface crystal phase. However, Ru atoms remain stable and uniformly dispersed in the lattice array (Fig. 1d). In order to determine the distribution of atoms in the catalyst, the EELS and elemental mapping of the catalyst further showed that Ru is dispersed in the catalyst as single atom (Fig. 1e). The Brunauer–Emmett–Teller (BET) measurements showed that after the phase reconstruction of the perovskite, the specific surface area and average pore diameter of RuSA-Co3O4 increased significantly, which are 253.56 m2 g−1 and 6.2 nm, respectively, much higher than the 1.47 m2 g−1 of SrCoO2.52 (Fig. S10a and b, ESI). After the secondary electrochemical reconstruction, the pore size of RuSA-Co3O4/CoOOH increased (8.4 nm), while the specific surface area decreased (40.85 m2 g−1) (Fig. S10c and d, ESI). This may be due to the reconstruction of a layer of CoOOH on the surface, which caused the pores to collapse and partially blocked them.

Structural characterization of catalyst phase transition

XPS was used to study the surface elemental composition and valence states of the catalyst after secondary reconstruction. In the high-resolution XPS spectrum of SrCoO2.52, the Sr 3d can be fitted into two sets of Sr 3d5/2 and 3d3/2 double peaks. These two peaks can be ascribed to surface-bound Sr (Sr-surface) and lattice-bound Sr (Sr-lattice), respectively (Fig. 2a).21 It is worth noting that after the introduction of RuCl3·xH2O, the content of Sr2+ in RuSA-Co3O4 decreases sharply, and no obvious Sr characteristic peak can be found in Fig. 2a. This is owing to the fact that the Sr–O bond at the A-site in SrCoO2.52 is weaker than the Co–O bond at the B-site, and Sr species is more easily dissolved and leached from the catalyst than Co species. Thus the introduction of Ru3+ eventually leads to crystal structure changes and further reconstruction.22 The Co 2p spectrum of the RuSA-Co3O4 catalyst can be fitted to two pairs of peaks corresponding to Co2+ and Co3+, respectively.7 This indicates that the structure of the perovskite is reconstructed into a spinel structure, which breaks the original valence balance, optimizes the electron configuration, and produces more Co2+ with a low oxidation state. The Co2+ is considered to be the optimal intermediate transition valence state, which facilitates the formation of Co2+/Co3+ redox coupling in the catalyst.23 The XPS spectra of Co 2p of RuSA-Co3O4/CoOOH demonstrated an increase in the content of Co3+, indicating that the electrochemical reconstruction optimized the ratio of Co2+/Co3+ in the catalyst (Fig. S11a, ESI). The binding energies of 463.2 and 465.1 eV from Ru 3p XPS spectra are ascribed to Ru4+ and Ru3+ species, respectively (Fig. S11b, ESI).24 Lattice oxygen (metal–O, 530.0 eV, O1), surface-adsorbed superoxide oxygen associated with oxygen defects (O22−/O, 531.6 eV, O2), hydroxyl or surface-adsorbed oxygen (–OH/O2, 532.4 eV, O3), and the H2O molecules physically adsorbed or chemically adsorbed (533.4 eV, O4) can be found from the XPS spectrum of O 1s in RuSA-Co3O4 and RuSA-Co3O4/CoOOH (Fig. S11c, ESI).25
image file: d3ee04338j-f2.tif
Fig. 2 Characterization of the local electronic structure. (a) XPS spectra of Sr 3d for different catalysts. (b) EPR spectrum. (c) XANES spectrum, (d) phase-corrected Fourier transform EXAFS k2χ(k) spectra of Co K-edges, (e) XANES spectrum, (f) Phase-corrected Fourier transform EXAFS k2χ(k) spectra of Ru K-edge, (g) χ(R) spatial spectral fitting curve of Ru K-edge, and WT-EXAFS plots of (h) Ru foil, (i) RuSA-Co3O4, and (j) RuO2.

The unsaturation concentration of unpaired electrons is detected by electron paramagnetic resonance (EPR). As shown in Fig. 2b, the enhanced signal (g = 2.002) indicates that after the introduction of Ru3+, more lattice vacancies are generated owing to the leaching of Sr2+, resulting in a higher content of oxygen vacancies defects in RuSA-Co3O4.26 The center of the d-band is determined based upon the valence band of the catalyst surface measured by UPS (Fig. S12a, ESI). According to calculations, the d-band centers of SrCoO2.52, RuSA-Co3O4, and RuSA-Co3O4/CoOOH catalysts are 5.26, 5.19, and 5.14 eV, respectively (Fig. S12b, ESI). The results show that the center of the d-band of RuSA-Co3O4/CoOOH is significantly shifted to the Fermi level after secondary reconstruction. The closer the center of the d-band is to the Fermi level, the stronger the binding energy between the catalyst and the reaction intermediate is, indicating that the anchoring of Ru single atoms after crystal phase reconstruction can effectively tailor the adsorption energy of the reaction intermediate, which is conducive to the electrocatalytic reaction.27 This is consistent with the Sabatier theory that moderate binding energy between the catalyst surface and the reaction intermediates will be beneficial to the catalytic reaction.28

X-ray absorption spectroscopy (XAS) is used to further study the local coordination environment and electronic structure of the catalyst. As observed in Fig. 2c, the Co K-edge X-ray absorption near edge structure (XANES) spectra of RuSA-Co3O4 exhibits an obvious edge absorption property similar to that of standard Co3O4. Compared with the front peak of SrCoO2.52, the absorption edge energy of RuSA-Co3O4 has a negative shift, indicating that the valence state of Co species in RuSA-Co3O4 is decreased, which is consistent with the XPS results. The k2-weighted Co K-edge X-ray absorption fine structure (EXAFS) is analyzed by best fit, and the structural parameters can be extracted (Fig. S13 and Table S2, ESI). As seen from phase-corrected Fourier transform extended EXAFS (FT-EXAFS) spectra of RuSA-Co3O4, three prominent peaks located at 1.8, 2.73, and 3.4 Å can be attributed to the Co-O coordination in the first shell, Cooct–O–Cooct(Ru) coordination in the second shell, and Cotet–O–Cotet coordination, where oct and tet represent octahedra and tetrahedra, respectively (Fig. 2d and Fig. S14a–c, ESI).29 Wavelet transform analysis of Co K-edge k3-weighted EXAFS further demonstrates scattering path signals in SrCoO2.52 as well as RuSA-Co3O4 (Fig. S14d–f, ESI). Besides, the Co–O and Cooct–O–Cooct(Ru) coordination in RuSA-Co3O4 is slightly negatively shifted compared with those of SrCoO2.52 and Co3O4, suggesting a strong interaction between Ru and Co species.30 The electronic structure and coordination environment of Ru species is also studied. The XANES spectrum of the Ru K-edge shows that the absorption edge of RuSA-Co3O4 is located between Ru foil and RuO2, demonstrating that Ru in RuSA-Co3O4 has a lower oxidation state than RuO2 (Fig. 2e). The phase-corrected FT-EXAFS spectrum of the Ru K-edge shows a distinct peak at 2.7 Å, corresponding to the Ru–Ru coordination of Ru foil (Fig. 2f).31 It is worth mentioning that there is no Ru–Ru coordination in RuSA-Co3O4, confirming the atomic-level dispersion of Ru, which is consistent with the HAADF-STEM results.32 The least squares EXAFS fitting analysis shows that RuSA-Co3O4 has a Ru–O coordination number of 5 and an average bond length of 1.81 Å in the first shell (Fig. 2f and g, Fig. S15, and Table S3, ESI). Compared with the Ru–O coordination number of 6, the unsaturated coordination of Ru–O in RuSA-Co3O4 further confirms the existence of oxygen vacancy defects, which is consistent with wavelet transform analysis of Ru K-edge k3-weighted EXAFS.33 Meanwhile, the Ru–Ru scattering path located at 9.5 Å−1 is not detected in RuSA-Co3O4, further verifying the atomic-scale dispersion of Ru (Fig. 2h–j).

Identification of surface electrochemical reconstruction

Spinel RuSA-Co3O4 was further reconstructed by applying anode voltage to form active components that are more favorable to the OER. The secondary electrochemical reconstruction of the RuSA-Co3O4 catalyst at different voltages was further studied by in situ Raman spectroscopy. The original RuSA-Co3O4 shows five typical Raman modes of spinel Co3O4 at the open circuit potential (OCP) (Fig. 3a).34 And the Raman peak at 190 cm−1 is attributed to the F2g symmetric vibration mode, which is attributed to the vibration of bivalent tetrahedral cobalt [CoO4] in Co3O4. The Raman peaks at 464, 511, 600, and 664 cm−1 correspond to the Eg, F2g, F2g, and A1g symmetric vibration modes of octahedral cobalt [CoO6] in Co3O4, respectively.35 When the applied voltage is increased to 1.36 V vs. RHE, the Raman peak of [CoO4] decreases, while the Raman peak of CoOOH appears, indicating that the catalyst has been reconstructed.36 Furthermore, when the voltage is higher than 1.56 V vs. RHE, the Raman peak of CoOOH is stronger, and the Raman peak of A1g (664 cm−1) is obviously negative shift, further indicating that the catalyst is extensively reconstructed into CoOOH at high potentials.
image file: d3ee04338j-f3.tif
Fig. 3 In situ spectrum characterization and OER reaction mechanism. (a) In situ Raman spectra of RuSA-Co3O4 at 1.16–1.86 V vs. RHE. (b) XANES spectrum, (c) EXAFS spectra of Ru K-edges at different voltages. (d) Potential-dependent structure of Ru K-edge FT-EXAFS spectra. (e) XANES spectrum, (f) EXAFS spectra of Co K-edges at different voltages. (g) Potential-dependent structure of Co K-edge FT-EXAFS spectra. (h) Schematic of electron transfer during the OER of RuSA-Co3O4.

XPS spectra at different voltages show the evolution of the catalyst surface structure. The increase of voltage leads to a certain degree of a positive shift in the peaks of Ru 3d5/2 and Ru 3d3/2, indicating the rise of the Ru valence state (Fig. S16a, ESI).20 The lattice oxygen (M–O) at 530.0 eV shifts positively as the voltage increases (Fig. S16b, ESI), showing stronger M–O covalence.37 However, as the voltage increases to 0.5 V, the proportion of lattice oxygen drops dramatically and cannot be observed at 0.7 V, while the proportion of hydroxyl oxygen increases (46.1%). This indicates that lattice oxygen detached from the catalyst surface and adsorbed more OH, and then CoOOH is gradually formed. Simultaneously, the dominant peak attributed to Co3+ becomes stronger with the increase of voltage, which further proves that the valence state of Co species increases. The Co species have different degrees of dissolution due to their physical and chemical modifications (Fig. S16c, ESI).38 Hence, the separation of lattice oxygen and the electrochemical dissolution of metals promote the secondary reconstruction of the catalyst. The limited cationic solubility of metal oxides at the anode potential may cause the metal to redeposit on the surface in the form of hydroxyl/hydroxide layers, further leading to structural restructuring.39 Moreover, it can be seen from the CV curve that the peak at ∼1.33 V in the first CV cycle corresponds to the Co2+/Co3+ redox coupling. The local redox peak at ∼1.2 V in the second CV cycle indicates the production of CoOOH, which is in line with the results of XPS (Fig. S17, ESI).40

Effective active structure favorable to the OER

In situ XAS characterization was performed at different reaction voltages (0.1 V, 0.5 V, and 0.7 V) to study the surface structure evolution of RuSA-Co3O4/CoOOH during the dynamic OER process, and the real active components of the catalyst are determined. The Ru K-edge XANES spectrum in Fig. 3b shows that the absorption edge energy of the front peak of RuSA-Co3O4 has a positive shift with the increase of reaction voltage, indicating that the valence state of Ru increases. The first derivatives of the Ru K-edge are obtained, and linear fitting is performed with the corresponding Ru foil, RuO2, and RuO4 as references (Fig. S18, ESI). The average valence state of Ru in RuSA-Co3O4 is determined to be 3.87. The k2-weighted Ru K-edge structure was analyzed by using the optimal fitting method, and the structural parameters of Ru were extracted at different voltages (Fig. S19 and Table S4, ESI). In the Ru K-edge FT-EXAFS spectrum, the peak of RuSA-Co3O4 at 1.81 Å is attributed to the Ru–O bond in the first coordination shell. Compared with the pristine FT-EXAFS results, the bond length of Ru–O in the RuSA-Co3O4/CoOOH presents a trend of first lengthening and then shortening during the process of voltage rise. That is, the dynamic change of the Ru–O bond length of RuSA-Co3O4/CoOOH is increased from 1.81 Å (OCP) to 1.90 Å (0.1 V), then decrease to 1.87 Å (0.5 V), and finally decrease to 1.84 Å (0.7 V) (Fig. 3c). This indicates that the Ru site in RuSA-Co3O4/CoOOH has excellent adsorption/desorption ability to oxygen-containing intermediates during the reaction, which is more beneficial for the OER. This trend is further verified by the structural change process of Ru K-edges (Fig. 3d). Moreover, RuSA-Co3O4/CoOOH Ru K-edge scattering path signals with different coordination structures at 0.5 V and 0.7 V are observed (Fig. S20 and S21, ESI). Meanwhile, the coordination of Ru–O–O and Ru–O–Co(Ru) exists simultaneously at 0.5 V. And at 0.7 V, the peak at Ru–O–Co(Ru) weakens while the peak at Ru–O–O continues to strengthen. In the process of gradually applying voltage, the enhancement of the peak at 2.7 Å indicates that Ru is effectively activated and easily combines with electrophilic oxygen groups (–O) to form Ru–O–O. This is considered to be the active site of the OER because the electrophilic –O ligand of Ru–O–O can promote the formation of O2 through nucleophilic attack, thus improving the performance of the OER.41,42

Simultaneously, the Co K-edge XANES spectrum shows that, with the increase of reaction voltage, the valence state of Co species in RuSA-Co3O4/CoOOH gradually increases (Fig. 3e). The first-derivatives of the Co K-edge XANES curves are obtained and linearly fitted with the corresponding Co foil and Co2O3 as references (Fig. S22, ESI). The average valence state of Co in RuSA-Co3O4 is determined to be 2.71. With the voltage increases, the valence state of Co approaches +3, further proving that electrochemical reconstruction produces CoOOH on the surface. The k2-weighted Co K-edge structure at different voltages was analyzed by the best-fitting method, and the Co structural parameters were extracted (Fig. S23 and Tables S5–S7, ESI). In the Co K-edge FT-EXAFS spectrum, the peak of RuSA-Co3O4/CoOOH at 1.8 Å is attributed to the Co–O bond in the first coordination shell, which has a dynamic contraction bond environment during the OER (Fig. 3f). The Co–O bond length becomes shorter and the coordination number decreases at 0.1 V and then returns to the initial when the voltage increases to 0.5 V and 0.7 V. Similarly, the Co K-edge structural change process of RuSA-Co3O4/CoOOH further confirms this trend (Fig. 3g). The results show that during the voltage application process, lattice oxygen is detached from the catalyst surface to form more oxygen vacancy defects, and more active sites are formed when hydroxyl oxygen is further adsorbed and coordinated with metal. The Co K-edge and WT of RuSA-Co3O4/CoOOH demonstrate the scattering path at 0.1 V and 0.5 V (Fig. S24 and S25, ESI). The gradually enhanced Co–O–O coordination formed at 2.7 Å and Ru–O–O indicate that Co and Ru and their bridging electrophilic O ligands act as active sites, which synergistically promote the electrocatalytic performance.43 Meanwhile, with the increase of voltage, the Co–O–Co coordination splitting at 3.4 Å and 3.7 Å due to the formation of the CoOOH during secondary electrochemical reconstruction. This indicates that the electrochemical reconstruction of the catalyst enhances the binding of metal to –O/–OH, thus enhancing the adsorption/desorption capacity of oxygen-containing intermediates on the catalyst surface.

Fig. 3h shows the electrochemical reconstruction mechanism of RuSA-Co3O4 in the OER process from three perspectives: electron transfer, oxygen type conversion, and Ru–O bonding. (1) The electrochemical reconstruction process is followed by the adsorption evolution mechanism (AEM) pathway and activated CoOOH active substances form on the catalyst surface.44 Meanwhile, the increase of metal valence states indicates that Co and Ru have excellent oxidation performance, and the synergistic effect of the two sites can enhance the electronic interaction, thus significantly improving the electrocatalytic performance. (2) The bond between the lattice oxygen and the metal is broken and separated to further adsorb hydroxyl oxygen, indicating that oxygen vacancies are still formed during the reaction, which promotes the formation of more accessible Co–O–O and Ru–O–O active sites on the catalyst surface. (3) At the same time, the dynamic evolution of the Ru–O coordination bond shows that the Ru site can well promote the electrostatic adsorption/desorption of oxygen intermediates, facilitate the formation of Ru–O–O active sites, and significantly improve the slow kinetics of the OER.

Electrochemical performance for oxygen evolution

The electrocatalytic performance of different catalysts for the OER is evaluated in a 1.0 M KOH electrolyte (Fig. S26 and S27, ESI). The results display that the RuSA-Co3O4/CoOOH manifests the optimal OER performance, as demonstrated by an ultra-low overpotential of 175 mV at 10 mA cm−2. It is significantly lower than those of RuSA-Co3O4 (195 mV), SrCoO2.52 (525 mV), Ru/Co3O4 (310 mV), RuO2 (260 mV), and IrO2 (300 mV) (Fig. 4a). Moreover, the RuSA-Co3O4/CoOOH catalyst has the smallest Tafel slope, indicating its fastest OER reaction kinetics (Fig. 4b). Meanwhile, the RuSA-Co3O4/CoOOH catalyst was loaded on clean carbon paper and its stability was measured at 10 mA cm−2 for 1000 h by using chronopotentiometry.45 As demonstrated in Fig. 4c, the potential of RuSA-Co3O4/CoOOH hardly decreases, indicating excellent electrochemical stability of RuSA-Co3O4/CoOOH. Meanwhile, after the stability test, the crystal phase and electronic structure of the catalyst are almost unchanged, indicating that the catalyst has a stable structure (Fig. S28, ESI). In addition, at a high overpotential of 290 mV, the faradaic efficiency of RuSA-Co3O4/CoOOH for the oxygen evolution reaction is close to 100% (Fig. 4d), indicating that the catalyst has a high oxygen generation efficiency. The electrochemically active surface area (ECSA) is tested by cyclic voltammetry (CV) cycling at different scanning speeds in the non-faradaic potential range, and then the CV curves are used to fit the electric double layer capacitance (Cdl) values of the catalysts (Fig. S29, ESI). As seen from Fig. 4e the Cdl of the RuSA-Co3O4/CoOOH (24.6 mF cm−2) is higher than those of RuSA-Co3O4 (20.2 mF cm−2), SrCoO2.52 (0.6 mF cm−2), and Ru/Co3O4 (3.4 mF cm−2), indicating that RuSA-Co3O4/CoOOH exhibits a larger active surface area for electrocatalysis and more accessible active sites, which are conducive to the enhancement of electrochemical performance. The intrinsic catalytic activity of the catalysts is further evaluated by calculating the turnover frequency (TOF). The TOF value of RuSA-Co3O4/CoOOH at an overpotential of 300 mV is 17.62 s−1, far beyond those of RuSA-Co3O4 (13.65 s−1), SrCoO2.52 (0.019 s−1), and Ru/Co3O4 (0.735 s−1), demonstrating its excellent OER activity. Electrochemical impedance spectroscopy is a valid auxiliary method to study the kinetics of the catalytic reaction and the resistance of charge transfer. The equivalent series resistance of the catalyst mainly comes from the solution resistance (Rs).46 It can be seen from Fig. 4f that the RuSA-Co3O4/CoOOH catalyst has the lowest Rct value, indicating faster electron transport during the OER process, which is derived from the regulation of the electronic structure by phase transition and oxygen vacancy. Compared with the recently reported perovskite/spinel and noble metal-based catalysts, the present RuSA-Co3O4/CoOOH exhibits the record lowest OER overpotential, which is the best perovskite-derived OER electrocatalysts so far (Fig. 4g and Tables S8–S10, ESI). In addition, a water-splitting device is assembled by using the RuSA-Co3O4/CoOOH and the commercial Pt/C (20 wt%) catalysts (Fig. S30a, ESI). The results show that the overpotential can reach 1.44 V at 10 mA cm−2, indicating excellent water-splitting performance. At the same time, the current does not decrease significantly after the chronoamperometry stability test, indicating good stability of water splitting (Fig. S30b, ESI).
image file: d3ee04338j-f4.tif
Fig. 4 OER performance of RuSA-Co3O4/CoOOH. (a) LSV curves, (b) Tafel slopes, (c) Et stability, (d) Faraday efficiency of RuSA-Co3O4/CoOOH, (e) Cdl, (f) EIS of different catalysts, (g) comparison of the OER overpotential between RuSA-Co3O4/CoOOH and the spinel/perovskite catalyst.

The active components of the catalyst determined by theoretical calculations

DFT calculations were carried out to understand the oxygen evolution catalytic mechanism on RuSA-Co3O4/CoOOH. Considering the four-electron OER reaction pathway of the adsorptive evolution mechanism (AEM), in which O2 evolves from H2O through *OH, *O, and *OOH intermediates continuously (Fig. 5a).47 The recently proposed lattice oxygen mechanism (LOM) has also been considered.48–51 Among them, the surface lattice oxygen participates in the OER, which is found to be unfavorable than the AEM due to the sluggish kinetics for O–O coupling and O2 desorption (Fig. S31 and S32, ESI). Fig. 5b and c show the considered active sites on RuO2, Co3O4, RuSA-Co3O4, and RuSA-Co3O4/CoOOH, including those identified before and after the electrochemical reconstructions. Using the linear scaling relation ΔG*OOH = ΔG*OH + 3.2 identified on rutile, perovskite, spinel, rock salt, and bixbyite oxide surfaces, we plot the OER overpotential as a function of the free energies of *O and *OH, shown in Fig. 5d as a contour plot.47 The volcano plot is discovered to afford a reasonable estimate of the reaction activity on a series of metal-based OER catalysts such as atomic FeNi on W carbides and PdCu/Ir core/shell nanocrystals.52,53 As shown in Fig. 5d, the Ru site with single oxygen vacancy and simultaneously coordinated with an oxygen group (denoted as RuOO@RuSA-Co3O4CoOOH(v)) and the Co site with double oxygen vacancies (denoted as Co@RuSA-Co3O4(2v)) sit very close to the top (blue area) of the volcano plot, which is consistent with our experimental observations. To shed light on the origin of the high OER activity on RuSA-Co3O4, we plot in Fig. 5e the free energy diagrams of the OER on those Ru-based active sites. We find that the surface oxygen vacancies play a key role in improving OER activity. On the defect-free RuO2 surface, the weak binding of the *OOH intermediate on the O sites (denoted as O@RuO2) yields a high overpotential of 0.90 V for the OER at the equilibrium potential U = 1.23 V (Fig. 5e). Oxygen vacancies, however, can expose active metal sites to intermediates and increase their bindings on the surface, causing lower OER overpotentials of 0.37 V and 0.36 V on the Ru sites of RuO2 and RuSA-Co3O4 surfaces (denoted as Ru@RuO2(v) and Ru@RuSA-Co3O4(v), respectively). Besides, we find that the functionalized oxygen groups on the Ru sites play a key role in optimizing the free energies of intermediates, rendering the lowest OER overpotential on RuOO@RuSA-Co3O4CoOOH(v) (0.32 eV). These results are once again consistent with our experimental observations. Fig. 5f shows the free energy diagrams for the OER on those Co-based active sites. We find that although the binding of the OER intermediates can be decoupled on spinel-Co3O4 surfaces (O@Co3O4 and Co@Co3O4(v)) due to the formation of oxygen vacancies, spinel-Co3O4 is an inferior catalyst for the OER due to the large free energy increase for either the *OH → *O step or the *O → *OOH step. The OER overpotential on the Co sites, however, can be dramatically decreased due to the introduction of Ru SAs to the Co3O4 matrix and the formation of hydroxyl groups on the Co sites (Co@RuSA-Co3O4/CoOOH(v)). In addition, the formation of double oxygen vacancies (Co@RuSA-Co3O4(2v)) would result in more metallic Co sites for intermediate adsorption, which are also active for the OER in our calculations. This is consistent with the results of the Co K-edge EXAFS fit. These results establish that the reconstruction of the perovskite structure, the preferential reconstruction of a layer of the MOOH electrophilic oxygen/hydroxyl group in RuSA-Co3O4, and the formation of oxygen vacancy and oxidized metal sites (Ru–O–O) are responsible for the improved OER activity of RuSA-Co3O4/CoOOH catalysts.
image file: d3ee04338j-f5.tif
Fig. 5 DFT analysis of the active center of RuSA-Co3O4/CoOOH. (a) The four-electron OER reaction pathway on RuSA-Co3O4/CoOOH. Slab model for (b) the Ru-based and (c) Co-based active sites. Dark cyan, royal, red, and white spheres represent Ru, Co, O, and H atoms, respectively. (d) OER overpotential contour map in terms of the free energies of *OH and the difference between *O and *OH. Free energy diagram for the OER: (e) the Ru-based active sites of rutile–RuO2, RuSA-Co3O4, and RuSA-Co3O4/CoOOH, and (f) the Co-based active sites of spinel-Co3O4, RuSA-Co3O4, and RuSA-Co3O4/CoOOH at an equilibrium potential of 1.23 V.

Conclusions

In summary, we demonstrate the feasibility of phase transformation and electrochemical reconstruction strategies to improve the electrocatalytic performance of perovskite oxides. The phase transformation of perovskites and secondary electrochemical reconstruction surface formed CoOOH active substances, abundant oxygen vacancies, and uniform dispersion of Ru single atoms significantly accelerated the electron transfer ability, optimized the reaction energy barrier, and improved the constitutive catalytic activity. Accordingly, the prepared RuSA-Co3O4/CoOOH catalyst exhibits outstanding OER activity with an ultra-low overpotential of 175 mV at 10 mA cm−2. This study opens a new avenue for the design of highly active perovskite OER electrocatalysts and provides an in-depth understanding of the surface reconstruction mechanism.

Experimental section

Synthesis of SrCoO2.52

1 mmol Sr(NO3)2 and 2 mmol C6H8O7·H2O were dissolved in 10 mL of H2O to form solution A, and 1 mmol Co(NO3)2·6H2O was dissolved in 10 mL of H2O to form solution B. Solution A is then mixed with B and stirred at 100 °C until a pink xerogel formed. The ground xerogel was heated to 600 °C at a heating rate of 2 °C min−1 in a tube furnace under an air atmosphere for 4 h to form a solid precursor, and the temperature was further increased to 900 °C for 5 h to obtain the perovskite powder SrCoO2.52.

Synthesis of RuSA-Co3O4

100 mg of SrCoO2.52 was dispersed in 17 mL of deionized water. During 120 min of sonication (ultrasonic power of 99), 5 mL of RuCl3·xH2O solution (0.01 g mL−1) was added at 15, 45, and 75 min, respectively. The samples are collected by centrifugation, further washed with deionized water, and finally dried at 70 °C overnight to obtain Ru-Co3O4.

Synthesis of RuSA-Co3O4/CoOOH

The prepared RuSA-Co3O4 was prepared into ink and coated on the glass carbon electrode. The optimal catalyst RuSA-Co3O4/CoOOH was reconstructed successfully by CV cycling in 1 M KOH solution with a potential range of 0–0.35 V vs. Hg/HgO using a three-electrode system.

Author contributions

Y.-R. Hao conceived project synthesis, conducted relevant test analysis, and wrote the manuscript. H. Xue assisted in data analysis and manuscript writing. J. Sun, N. Guo, and T. Song assisted in relevant tests and data analysis. J. Zhang and H. Dong are responsible for EXAFS measurement and data analysis. Z. Zhao performed and wrote the DFT calculations. L. Wu revised the manuscript. Q. Wang proposed the concept and designed all the experimental studies. All authors contributed to the discussion and manuscript review.

Conflicts of interest

The authors declare no conflicts of interest.

Acknowledgements

This project was financially supported by the National Natural Science Foundation of China (NSFC U22A20107, and 22269015), the Natural Science Foundation of Inner Mongolia Autonomous Region of China (2021ZD11, 2019BS02015, and 2023MS02002), the “Grassland Talents” of Inner Mongolia Autonomous Region, the Young Talents of Science and Technology in Universities of Inner Mongolia Autonomous Region (NJYT23030), the Carbon Neutralization Research Project (STZX202218), and the National Key R&D Program of China (2022YFA1205201). We gratefully acknowledge the BL14W1 beamline and BL17B beamline of the National Facility for Protein Science (NFPS), and Shanghai Synchrotron Radiation Facility (SSRF) Shanghai for providing the beam time.

Notes and references

  1. Y. Tong, J. Wu, P. Chen, H. Liu, W. Chu, C. Wu and Y. Xie, J. Am. Chem. Soc., 2018, 140, 11165–11169 CrossRef CAS PubMed .
  2. H. Chen, L. Shi, X. Liang, L. Wang, T. Asefa and X. Zou, Angew. Chem., Int. Ed., 2020, 59, 19654–19658 CrossRef CAS PubMed .
  3. W. Wang, Y. Yang, D. Huan, L. Wang, N. Shi, Y. Xie, C. Xia, R. Peng and Y. Lu, J. Mater. Chem. A, 2019, 7, 12538–12546 RSC .
  4. R. Majee, S. Mondal and S. Bhattacharyya, Chem. Commun., 2020, 56, 8277–8280 RSC .
  5. W. Xu, N. Apodaca, H. Wang, L. Yan, G. Chen, M. Zhou, D. Ding, P. Choudhury and H. Luo, ACS Catal., 2019, 9, 5074–5083 CrossRef CAS .
  6. E. J. Crumlin, E. Mutoro, Z. Liu, M. E. Grass, M. D. Biegalski, Y.-L. Lee, D. Morgan, H. M. Christen, H. Bluhm and Y. Shao-Horn, Energy Environ. Sci., 2012, 5, 6081–6088 RSC .
  7. J. R. Petrie, H. Jeen, S. C. Barron, T. L. Meyer and H. N. Lee, J. Am. Chem. Soc., 2016, 138, 7252–7255 CrossRef CAS PubMed .
  8. H. Wang, J. Qi, N. Yang, W. Cui, J. Wang, Q. Li, Q. Zhang, X. Yu, L. Gu, J. Li, R. Yu, K. Huang, S. Song, S. Feng and D. Wang, Angew. Chem., Int. Ed., 2020, 59, 19691–19695 CrossRef CAS PubMed .
  9. H. Jiang, Q. He, X. Li, X. Su, Y. Zhang, S. Chen, S. Zhang, G. Zhang, J. Jiang, Y. Luo, P. M. Ajayan and L. Song, Adv. Mater., 2019, 31, 1805127 CrossRef PubMed .
  10. H. N. Nong, T. Reier, H.-S. Oh, M. Gliech, P. Paciok, T. H. T. Vu, D. Teschner, M. Heggen, V. Petkov, R. Schlögl, T. Jones and P. Strasser, Nat. Catal., 2018, 1, 841–851 CrossRef CAS .
  11. Y. Zuo, D. Rao, S. Ma, T. Li, Y. H. Tsang, S. Kment and Y. Chai, ACS Nano, 2019, 13, 11469–11476 CrossRef CAS PubMed .
  12. Y. Zhu, W. Zhou, J. Sunarso, Y. Zhong and Z. Shao, Adv. Funct. Mater., 2016, 26, 5862 CrossRef CAS .
  13. L. C. Seitz, C. F. Dickens, K. Nishio, Y. Hikita, J. Montoya, A. Doyle, C. Kirk, A. Vojvodic, H. Y. Hwang, J. K. Norskov and T. F. Jaramillo, Science, 2016, 353, 1011–1014 CrossRef CAS PubMed .
  14. D. Chen, C. Chen, Z. Zhang, Z. M. Baiyee, F. Ciucci and Z. Shao, ACS Appl. Mater. Interfaces, 2015, 7, 8562–8571 CrossRef CAS PubMed .
  15. Y. Zhu, J. Dai, W. Zhou, Y. Zhong, H. Wang and Z. Shao, J. Mater. Chem. A, 2018, 6, 13582–13587 RSC .
  16. E. Fabbri, M. Nachtegaal, T. Binninger, X. Cheng, B. J. Kim, J. Durst, F. Bozza, T. Graule, R. Schaublin, L. Wiles, M. Pertoso, N. Danilovic, K. E. Ayers and T. J. Schmidt, Nat. Mater., 2017, 16, 925–931 CrossRef CAS PubMed .
  17. X. Liu, J. Meng, J. Zhu, M. Huang, B. Wen, R. Guo and L. Mai, Adv. Mater., 2021, 33, 2007344 CrossRef CAS PubMed .
  18. G. Chen, Y. Zhu, H. M. Chen, Z. Hu, S. F. Hung, N. Ma, J. Dai, H. J. Lin, C. T. Chen, W. Zhou and Z. Shao, Adv. Mater., 2019, 31, 1900883 CrossRef PubMed .
  19. J. Ge, D. Zhang, Y. Qin, T. Dou, M. Jiang, F. Zhang and X. Lei, Appl. Catal., B, 2021, 298, 120557–120564 CrossRef CAS .
  20. C. Lin, J.-L. Li, X. Li, S. Yang, W. Luo, Y. Zhang, S. Kim, D.-H. Kim, S. S. Shinde, Y.-F. Li, Z.-P. Liu, Z. Jiang and J.-H. Lee, Nat. Catal., 2021, 4, 1012–1023 CrossRef CAS .
  21. X. Ge, Y. Du, B. Li, T. S. A. Hor, M. Sindoro, Y. Zong, H. Zhang and Z. Liu, ACS Catal., 2016, 6, 7865–7871 CrossRef CAS .
  22. Y. Chen, Y. Sun, M. Wang, J. Wang, H. Li, S. Xi, C. Wei, P. Xi, G. E. Sterbinsky, J. W. Freeland, A. C. Fisher, J. W. Ager III, Z. Feng and Z. J. Xu, Sci. Adv., 2021, 7, eabk1788 CrossRef CAS PubMed .
  23. Y. Wang, Y.-Q. Zhu, Z. Xie, S.-M. Xu, M. Xu, Z. Li, L. Ma, R. Ge, H. Zhou, Z. Li, X. Kong, L. Zheng, J. Zhou and H. Duan, ACS Catal., 2022, 12, 12432–12443 CrossRef CAS .
  24. H. Jiang, L. Wang, H. Kaneko, R. Gu, G. Su, L. Li, J. Zhang, H. Song, F. Zhu, A. Yamaguchi, J. Xu, F. Liu, M. Miyauchi, W. Ding and M. Zhong, Nat. Catal., 2023, 6, 519–530 CrossRef CAS .
  25. A. Grimaud, O. Diaz-Morales, B. Han, W. T. Hong, Y. L. Lee, L. Giordano, K. A. Stoerzinger, M. T. M. Koper and Y. Shao-Horn, Nat. Chem., 2017, 9, 457–465 CrossRef CAS PubMed .
  26. J. Sun, N. Guo, Z. Shao, K. Huang, Y. Li, F. He and Q. Wang, Adv. Energy Mater., 2018, 8, 1800980 CrossRef .
  27. H. Wang, J. Wang, Y. Pi, Q. Shao, Y. Tan and X. Huang, Angew. Chem., Int. Ed., 2019, 58, 2316–2320 CrossRef CAS PubMed .
  28. A. J. Medford, A. Vojvodic, J. S. Hummelshøj, J. Voss, F. Abild-Pedersen, F. Studt, T. Bligaard, A. Nilsson and J. K. Nørskov, J. Catal., 2015, 328, 36–42 CrossRef CAS .
  29. Y. Lu, T. Liu, C. L. Dong, Y. C. Huang, Y. Li, J. Chen, Y. Zou and S. Wang, Adv. Mater., 2021, 33, 2007056 CrossRef CAS PubMed .
  30. B. Pang, X. Liu, T. Liu, T. Chen, X. Shen, W. Zhang, S. Wang, T. Liu, D. Liu, T. Ding, Z. Liao, Y. Li, C. Liang and T. Yao, Energy Environ. Sci., 2022, 15, 102–108 RSC .
  31. X. Liu, F. Liu, J. Yu, G. Xiong, L. Zhao, Y. Sang, S. Zuo, J. Zhang, H. Liu and W. Zhou, Adv. Sci., 2020, 7, 2001526 CrossRef CAS PubMed .
  32. H. Fang, S. Wu, T. Ayvali, J. Zheng, J. Fellowes, P. L. Ho, K. C. Leung, A. Large, G. Held, R. Kato, K. Suenaga, Y. I. A. Reyes, H. V. Thang, H. T. Chen and S. C. E. Tsang, Nat. Commun., 2023, 14, 647–661 CrossRef CAS PubMed .
  33. H. Li, K. Liu, J. Fu, K. Chen, K. Yang, Y. Lin, B. Yang, Q. Wang, H. Pan, Z. Cai, H. Li, M. Cao, J. Hu, Y.-R. Lu, T.-S. Chan, E. Cortés, A. Fratalocchi and M. Liu, Nano Energy, 2021, 82, 105767 CrossRef CAS .
  34. R. Zhang, L. Pan, B. Guo, Z.-F. Huang, Z. Chen, L. Wang, X. Zhang, Z. Guo, W. Xu, K. P. Loh and J.-J. Zou, J. Am. Chem. Soc., 2023, 145, 2271–2281 CrossRef CAS PubMed .
  35. L. Ma, S. Chen, H. Li, Z. Ruan, Z. Tang, Z. Liu, Z. Wang, Y. Huang, Z. Pei, J. A. Zapien and C. Zhi, Energy Environ. Sci., 2018, 11, 2521–2530 RSC .
  36. X. Zhang, C. Feng, B. Dong, C. Liu and Y. Chai, Adv. Mater., 2023, 35, 2207066 CrossRef CAS PubMed .
  37. J. Zhang, J. Li, C. Zhong, P. Xi, D. Chao and D. Gao, Nano Lett., 2021, 21, 8166–8174 CrossRef CAS PubMed .
  38. J.-W. Zhao, H. Zhang, C.-F. Li, X. Zhou, J.-Q. Wu, F. Zeng, J. Zhang and G.-R. Li, Energy Environ. Sci., 2022, 15, 3912–3922 RSC .
  39. J. Bai, J. Mei, T. Liao, Q. Sun, Z. G. Chen and Z. Sun, Adv. Energy Mater., 2021, 12, 2103247 CrossRef .
  40. A. Bergmann, T. E. Jones, E. Martinez Moreno, D. Teschner, P. Chernev, M. Gliech, T. Reier, H. Dau and P. Strasser, Nat. Catal., 2018, 1, 711–719 CrossRef CAS .
  41. D. Cao, J. Wang, H. Xu and D. Cheng, Small, 2021, 17, 2101163 CrossRef CAS PubMed .
  42. J. N. Tiwari, A. M. Harzandi, M. Ha, S. Sultan, C. W. Myung, H. J. Park, D. Y. Kim, P. Thangavel, A. N. Singh, P. Sharma, S. S. Chandrasekaran, F. Salehnia, J. W. Jang, H. S. Shin, Z. Lee and K. S. Kim, Adv. Energy Mater., 2019, 1900931 CrossRef .
  43. Y. Zhu, J. Wang, T. Koketsu, M. Kroschel, J. M. Chen, S. Y. Hsu, G. Henkelman, Z. Hu, P. Strasser and J. Ma, Nat. Commun., 2022, 13, 7754–7765 CrossRef CAS PubMed .
  44. H. Zhong, Q. Zhang, J. Yu, X. Zhang, C. Wu, Y. Ma, H. An, H. Wang, J. Zhang, X. Wang and J. Xue, Adv. Energy Mater., 2023, 2301391 CrossRef CAS .
  45. Y. Duan, Z.-Y. Yu, L. Yang, L.-R. Zheng, C.-T. Zhang, X.-T. Yang, F.-Y. Gao, X.-L. Zhang, X. Yu, R. Liu, H.-H. Ding, C. Gu, X.-S. Zheng, L. Shi, J. Jiang, J.-F. Zhu, M.-R. Gao and S.-H. Yu, Nat. Commun., 2020, 11, 4789 CrossRef CAS PubMed .
  46. T. Zhao, X. Shen, Y. Wang, R. K. Hocking, Y. Li, C. Rong, K. Dastafkan, Z. Su and C. Zhao, Adv. Funct. Mater., 2021, 31, 2100614 CrossRef CAS .
  47. I. C. Man, H. Y. Su, F. Calle-Vallejo, H. A. Hansen, J. I. Martínez, N. G. Inoglu, J. Kitchin, T. F. Jaramillo, J. K. Nørskov and J. Rossmeisl, ChemCatChem, 2011, 3, 1159–1165 CrossRef CAS .
  48. X. Rong, J. Parolin and A. M. Kolpak, ACS Catal., 2016, 6, 1153–1158 CrossRef CAS .
  49. J. S. Yoo, Y. Liu, X. Rong and A. M. Kolpak, J. Phys. Chem. Lett., 2018, 9, 1473–1479 CrossRef CAS PubMed .
  50. J. T. Mefford, X. Rong, A. M. Abakumov, W. G. Hardin, S. Dai, A. M. Kolpak, K. P. Johnston and K. J. Stevenson, Nat. Commun., 2016, 7, 11053 CrossRef CAS PubMed .
  51. Z.-F. Huang, J. Song, Y. Du, S. Xi, S. Dou, J. M. V. Nsanzimana, C. Wang, Z. J. Xu and X. Wang, Nat. Energy, 2019, 4, 329–338 CrossRef CAS .
  52. M. Li, Z. Zhao, Z. Xia, M. Luo, Q. Zhang, Y. Qin, L. Tao, K. Yin, Y. Chao, L. Gu, W. Yang, Y. Yu, G. Lu and S. Guo, Angew. Chem., Int. Ed., 2021, 60, 8243–8250 CrossRef CAS PubMed .
  53. S. Li, B. Chen, Y. Wang, M. Y. Ye, P. A. van Aken, C. Cheng and A. Thomas, Nat. Mater., 2021, 20, 1240–1247 CrossRef CAS PubMed .

Footnotes

Electronic supplementary information (ESI) available. See DOI: https://doi.org/10.1039/d3ee04338j
These authors contributed equally to this work.

This journal is © The Royal Society of Chemistry 2024