 Open Access Article
Creative Commons Attribution 3.0 Unported Licence
Efficiency limits and design principles for multi-junction coloured photovoltaics†
Phoebe M.
Pearce
 *a,
Janne
Halme
 b,
Jessica Yajie
Jiang
 a and
Nicholas J.
Ekins-Daukes
 a
a
aSchool of Photovoltaic and Renewable Energy Engineering, University of New South Wales, Sydney, New South Wales 2052, Australia. E-mail: p.pearce@unsw.edu.au
bDepartment of Applied Physics, Aalto University School of Science, P.O. Box 15100, 00076 Aalto, Finland
First published on 10th January 2024
Abstract
Building-integrated photovoltaics are an emerging technology with the potential to become more widely adopted as the installed capacity of solar photovoltaics (PV) continues to increase. For building and product integration, the ability to produce cells in colours other than the standard black or dark blue appearance of crystalline silicon panels plays an important role in improving the visual appearance and promoting the adoption of PV. However, to maximize power output from limited areas and use resources in the most sustainable way possible, keeping efficiency high is critical; coloured multi-junction solar cells, which can reach higher power conversion efficiencies than single-junction devices, thus become a technology platform of interest. We report the theoretical maximum possible efficiencies for coloured two-terminal solar cells with up to six junctions in the detailed balance limit, with colour produced through reflection of incident Sunlight. A wide range of colours with a relative luminance up to Y = 0.6 can be produced with <20% maximum power loss compared to a black cells. In most cases, except for colours with very high relative luminance Y ≳ 0.85 (i.e. colours which are closer to white), a two-junction coloured cell has a higher limiting efficiency than a black single-junction cell, showing the potential of coloured multi-junction cells for applications where the aesthetics of solar panels play an important role. We find that crystalline silicon provides an excellent platform as the bottom cell in developing two and three-junction coloured cells, for example in combination with perovskites or III–V semiconductor alloys with tuneable bandgaps. In addition to reporting limiting efficiencies, we report the optimal reflectance spectra and bandgap placement for achieving a range of colours, and the trends observed in these variables for colours of varying hue and relative luminance. A numerical optimization method using multi-objective differential evolution, a type of evolutionary algorithm, was used to calculate the limiting efficiencies; the method and code used to produce the results presented are made freely available.
Broader contextSolar photovoltaics are continuing to reduce in cost and are becoming an increasingly important part of the global electricity supply. Integrating photovoltaics into e.g. buildings, products, and vehicles can provide electricity directly where it is needed, and the ability to produce solar cells in various colours facilitates adoption and acceptance of solar panels in these contexts. Multi-junction solar cells, where different parts of the solar spectrum are absorbed in different materials to more efficiently utilise the energy in Sunlight, have higher power conversion efficiencies than single-junction devices. While single-junction crystalline silicon devices currently dominate the global market, tandem cells are exceeding silicon efficiencies in lab settings, and are expected to become increasingly commercially relevant. To produce colour visible to the human eye through reflection of Sunlight, some light which would normally be used to produce electricity must be sacrificed. Here, we show that despite this, multi-junction coloured solar cells can maintain high efficiencies over a wide range of possible colours, producing more power than single-junction black solar cells if properly designed. As a result, high-efficiency coloured photovoltaics can play an important role when the installation area is restricted (e.g. on buildings, vehicles, and products) and coloured designs and maximal power output are desired. |
Introduction
With the rapidly increasing adoption of renewable energy technologies, photovoltaics (PV) have become a significant player in the electricity generation market.1 As we strive towards cleaner and sustainable energy sources, integrating PV systems into visible surfaces, such as built infrastructure,2,3 vehicles,4 and electronic products,5–8 becomes a more appealing prospect. The necessity for such integration may prompt demand for panels with colours other than the conventional dark blue or black appearance, which may not always be preferred on visible surfaces.9–11Take, for example, building-integrated photovoltaics (BIPV); integrating solar panels into the visible parts of buildings – facades and tilted roofs – serves several crucial benefits.2,3 It enhances land-use efficiency by shifting PV installations from e.g. agricultural land to existing built surfaces, reducing land-use conflicts and freeing land for agriculture, forest bioeconomy, or nature conservation. Moreover, the dual functionality of PV as building material increases material efficiency and potentially decreases the overall environmental footprint of new buildings.12,13 This becomes increasingly significant in densely populated urban areas where flat roof area is constrained.
Similarly, the adoption of vehicle-integrated PV (VIPV) in automotive design, where colours other than black command a strong premium14 presents an opportunity for extending electric vehicle range and powering on-board systems while parked, especially when far from the power grid or charging stations.4,15 Given the higher energy consumption per surface area in vehicles, the demand for high-efficiency coloured solar cells becomes more pertinent. In product integration, such as in wearables, both the aesthetic and efficiency factors are vital.16,17 Limited surface area and a priority for high efficiency may outweight cost considerations, creating a potential market for high-performance coloured PV.
In all these scenarios, solar panels become an integral part of visual design, prompting an intricate balancing act between aesthetics and efficiency. Since a coloured solar cell reflects or re-emits a portion of the visible light instead of using it for energy conversion, optimizing energy efficiency while maintaining aesthetics becomes a pivotal research problem. Prior research by Halme & Mäkinen18 has identified the interdependence of solar cell colour and efficiency, established the most efficient way (requiring the fewest reflected photons) to produce colour for solar cells, and determined the theoretical power conversion efficiency (PCE) limits for opaque coloured solar cells. However, the study by Halme & Mäkinen only covered PCE limits for single-junction solar cells (SJSCs); the PCE limits for coloured multi-junction solar cells (MJSCs), which can reach higher efficiencies than SJSCs, have not yet been addressed in the literature. Moreover, there are only a few examples demonstrating the application of colour on multi-junction solar cells;19 the focus in MJSC development has been on high power output, since aesthetics are not a key concern for the current major applications (e.g. use on satellites or for space exploration, and in concentrator PV). High PCE is a desirable trait for applications with limited area, and contributes to the sustainable production of solar power. Through more efficient solar installations, more power can be generated from the same area, reducing the need for materials and the associated environmental harm.
MJSCs could be less affected by colour than SJSCs due to their broader spectrum utilization, extending deeper into near-infrared wavelengths; on the other hand, they could face current mismatch caused by reflecting visible light for colour formation, unless the bandgap energies can be redesigned to reach new current-matching conditions. Consequently, the task of optimizing the theoretical PCE of coloured MJSCs becomes more complex as the number of junctions (sub-cell bandgaps) increases. Halme & Mäkinen showed that for SJSCs, the solar cell colour is optimally produced by one or two rectangular reflectance peaks in the visible range and that the peak positions and the solar cell bandgap energies can be optimized separately. However, in the case of MJSCs, it is less clear where the reflectance peaks should be placed if one of the sub-cell bandgaps lies in the visible region, and whether two reflectance peaks are still sufficient for optimal energy conversion. In this paper, we address these research questions through a comprehensive computational optimization study using a multi-objective differential evolution algorithm, a robust and efficient optimization method. As a result:
• We determined the PCE limits for opaque two-terminal MJSCs with 1–6 junctions for various colours, showing that many colours can be produced with minimal PCE loss relative to a black cell.
• We found that the relative efficiency loss due to colour is almost independent of the number of junctions, if the sub-cell bandgaps can be chosen to maintain current-matching.
• For ideal solar cells and colour formation, colour affects the multi-junction solar cell PCE similarly to single-junction solar cells: higher colour lightness lowers efficiency, and among equally light colours, yellow-greens produce the highest PCE.
• Two rectangular reflectance peaks are sufficient to achieve the most efficient colour formation (using the fewest reflected photons). However, if a bandgap is close to a reflectance band (which only occurs in five or six-junction cells with optimal bandgap choices), splitting the reflectance band and placing the bandgap in between the two new bands can improve current-matching and very slightly (<0.5% relative change) increase the PCE.
• We identify the optimal bandgaps and reflectance spectra for coloured MJSCs, elucidating how colour affects the optimal bandgap energy of all junctions in an MJSC due to the requirement of current-matching between the sub-cells.
• We show that highly efficient coloured multi-junction cells are feasible, with crystalline silicon as a good platform for the bottom cell in two and three-junction devices due to its close-to-optimal bandgap energy; perovskites, due to their high tuneability, could be excellent candidate materials for the top junction(s).
To facilitate wider applicability and future research, we have made our optimization code open source, under a GNU General Public License. This shared resource will enable anyone to independently verify our results, evaluate the efficiency limits for any number of junctions, arbitrary target colour coordinates and type of colour-producing reflectance spectrum, or illumination spectrum, for example for aiding the design of coloured solar cells for use under artificial indoor lighting.6,7 Coupling the code with suitable optical simulations will allow for PCE optimization of cells using real colour filter structures, aiding in the design of colour filters and solar cells equipped with colour filters, which could be achieved through e.g. Bragg reflectors inside the cell structure or as part of the cell's cover glass.20
Methods
Colour perception calculations
We assume that the colour of the cells is produced by reflecting part of the incident solar spectrum, as opposed to transmission through semi-transparent cells for e.g. windows,21,22 or through emission of any kind, for example fluorescent emission by dyes, quantum dots, or a material capable of up/down-conversion of photon energy.23 Thus, the observer sees a spectrum equal to R(λ)P(λ), where P(λ) is the spectral power distribution of the incident solar spectrum. The reflectance R(λ) is assumed to be R = 1 inside reflectance bands and R = 0 elsewhere for calculating limiting efficiencies. Earlier work theoretically inferred that such a reflectance spectrum, characterized by one or two rectangular peaks (Fig. 1a), produces all physically possible colours with the smallest possible number of reflected photos thereby maximizing the solar cell efficiency attainable with that colour.18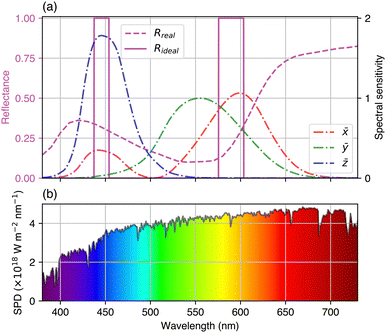 | ||
Fig. 1 (a) CIE colour-matching functions ![[x with combining macron]](https://www.rsc.org/images/entities/i_char_0078_0304.gif) , ȳ and , ȳ and ![[z with combining macron]](https://www.rsc.org/images/entities/i_char_007a_0304.gif) , shown with two reflectance spectra which will produce the Magenta colour from the ColorChecker chart.3 The real reflectance spectrum (dashed line) is measured from ColorChecker charts,3 while the rectangular reflectance spectrum (solid line) is the most efficient way (requiring the fewest photons) to produce the same colour when illuminated with an AM1.5G spectrum. (b) The spectral power distribution of the AM1.5G spectrum in the visible wavelength range. , shown with two reflectance spectra which will produce the Magenta colour from the ColorChecker chart.3 The real reflectance spectrum (dashed line) is measured from ColorChecker charts,3 while the rectangular reflectance spectrum (solid line) is the most efficient way (requiring the fewest photons) to produce the same colour when illuminated with an AM1.5G spectrum. (b) The spectral power distribution of the AM1.5G spectrum in the visible wavelength range. | ||
Colour perception by the human eye is calculated using the CIE 1931 standards.24 The colour-matching functions of the CIE standard observer are shown in Fig. 1a. Colours are represented by three coordinates, (X,Y,Z), which can be calculated from the reflectance R(λ), incident spectral power distribution P(λ) and the colour-matching functions:
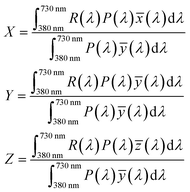 | (1) |
![[x with combining macron]](https://www.rsc.org/images/entities/i_char_0078_0304.gif) colour-matching function, which is a mixture of the CIE red, green and blue (RGB) colour-matching functions.
colour-matching function, which is a mixture of the CIE red, green and blue (RGB) colour-matching functions.
Following Halme & Mäkinen,18 the 24 colours of the ColorChecker colour rendition chart25 formed the basis of the optimizations. To obtain target (X, Y, Z) values for the optimization, reflectance data from real ColorChecker charts26 is used to calculate the target (X, Y, Z) coordinates under an AM1.5G spectrum27 using eqn (1). Consequently, the resulting colour coordinates represent the colours which would be perceived if the ColorChecker chart was viewed under an AM1.5G spectrum. Since the AM1.5G spectrum is also used for calculations of cell efficiency, this gives self-consistent colourimetric and photovoltaic calculations. While the target colours are defined slightly differently than in Halme & Mäkinen,18 the single-junction results are nevertheless very close and follow the same trends (further details and a comparison of results with the same target coordinates are provided in Section S2 of the ESI†).
Deviation from the target colour during optimization is quantified through the maximum fractional deviation from the target colour coordinates Xt, Yt and Zt:
 | (2) |
The colour optimization process, discussed in the next section, is continued until the ΔXYZmax is lower than a chosen threshold value (set to 0.004, which was shown to lead to imperceptible colour differences from the target colour, as discussed in ESI† Section S4).
For representing the results in the CIE 1931 xy chromaticity diagram, (X, Y, Z) coordinates are converted to (x, y, Y) coordinates:
 | (3) |
As we focus on limiting efficiencies for multi-junction coloured PV and assume ideal reflectance spectra, we have neglected angular effects. The reflectivity of any real surface will depend on the angle of incidence, and the observed reflection and thus colour will depend on the viewing angle relative to the angle of incidence. Because our analysis omits angle dependencies, all colours in this work correspond to total hemispherical spectral reflectance, which, moreover, is assumed to be independent of the incident angle of light. Consequently, our results are most applicable for matte colours, i.e. coloured surfaces exhibiting significant diffuse light scattering, which is common for building materials. However, our results are not readily applicable to iridescent or glossy materials because their appearance cannot be described with a single unambiguous colour and will be dependent on the incidence angle of light and the viewing angle. Systematic analysis of colour-efficiency relationships in this case would require a different approach, which, as far as we know, has not yet been developed.
Detailed balance model
The detailed balance model was used to find the efficiency of multi-junction cells based on the bandgap of the sub-cells (Eg,i) and the reflectance as a function of incident photon energy, R(E). For each sub-cell i, the radiative recombination current density28I0,i (at short-circuit (V = 0) and assuming an ideal, wavelength-selective back reflector between sub-cells) and the light-generated current IL,i are given by: | (4) |
 | (5) |
 | (6) |
If the reflectance is ideal to produce target colours (i.e. either R = 0 or R = 1 at every wavelength, with only two R = 1 peaks necessary to produce any colour), I0,i can be expressed as the sum of the indefinite integral in the areas where R = 0:
 | (7) |
For the light-generated current IL,i, the integration limits are between the bandgap of the sub-cell being evaluated and the bandgap of the sub-cell above; for the top (highest-energy bandgap) sub-cell, the upper limit of the integral is the maximum energy in the solar spectrum data. I0,i and IL,i are calculated independently for each sub-cell. To obtain limiting efficiencies, we assume that each sub-cell is an ideal diode obeying the current–voltage relationship:
| Ii(V) = IL,i − I0,i(eqVi/kT − 1) | (8) |
Using (8), the current at the maximum power point (MPP) for each of the sub-cells considered in isolation is as follows:
IMPP,i = I(VMPP,i) = IL,i − I0,i![[thin space (1/6-em)]](https://www.rsc.org/images/entities/char_2009.gif) eVMPP,i/kT eVMPP,i/kT | (9) |
Note that in eqn (8), the final −1 term (+I0,i) is the current produced by absorption of thermal radiation from the surroundings. In eqn (9), we have neglected it, since it is much smaller than the other two terms at room temperature, standard AM1.5G illumination, and reasonable values of VMPP (typically, by more than 10 orders of magnitude).
Up to this point, we have followed the standard definitions for detailed balance calculations. In order to efficiently evaluate the current and voltage at the MPP, and thus the efficiency of the cell, we used the analytical expressions introduced by Pusch et al.33 Directly calculating the efficiency from the sub-cell bandgaps and incident spectrum using an analytical expression is significantly faster computationally than numerically finding the MPP by scanning through voltages, which becomes important when this quantity must be evaluated many times, as is the case for the differential evolution optimization algorithm discussed below.
In a two-terminal multi-junction device, the overall current will be limited by the lowest sub-cell current; we approximate the current at MPP (IMPP) of the multi-junction device by identifying the lowest IMPP,i. This is a good approximation close to current-matching;33 in our case, the most efficient cells will be close to current-matched, and deviations from the current value for less-efficient cells are not critical to the convergence of the optimization. In the equation above, VMPP,i is found using the expression:33
 | (10) |
 | (11) |
Comparing results for this analytical expression for VMPP with results calculated numerically (i.e. finding the MPP by scanning through voltages, with a step size of 0.0005 V) using the detailed balance solver in Solcore,34 we find <0.35% (relative) difference between the PCEs calculated for optimized (current-matched) cells with up to six junctions (see ESI† Section S3 for the full benchmarking results).
Differential evolution optimization
Finding the optimal reflectance spectrum and sub-cell bandgap energies is a multi-objective optimization problem. We used the open-source library pygmo35 to implement multi-objective differential evolution36 optimization in Python. The optimization involves two simultaneous objectives: to minimize the deviation from the target colour (expressed in (X, Y, Z) coordinates), and to maximize the cell efficiency. It is clear that these objectives are in conflict and will not be individually optimized by the same set of parameters; the best cell efficiency is achieved when no photons are reflected, i.e. with a black cell, and thus for any other target colour, sacrificing some efficiency is required to produce a colour within the allowed deviation ΔXYZmax as defined in eqn (2).Differential evolution37 is a type of evolutionary algorithm which can be used for global optimization of arbitrary functions over large parameter spaces, with the only requirement being an objective function which returns the fitness of a candidate solution against one or multiple objectives. The operation of the optimization algorithm is summarized in Fig. 3. The problem is defined by the light source used (e.g. AM1.5G, a black body spectrum, or any other incident spectrum of interest), the number of sub-cells, the number of reflectance peaks and their shape, maximum height, etc., and the target colour. The problem definition gives us the number of variables we need to optimize (nvars), depending on the number of sub-cells and the type of reflectance spectrum. The optimization proceeds by maintaining a population of vectors, with each vector containing a set of values for the variables being optimized (a candidate solution); in this case, the location and width of the reflectance peaks and the sub-cell bandgaps. The initial population is randomly generated within the allowed bounds. We choose some number of generations (set at 10 × nvars for the results presented), and allow the differential evolution to proceed for this number of generations on each island. At each iteration of the algorithm, each vector in the population is mutated according to a set of rules; if the mutated version of the vector performs better according to the objective function, it replaces that member of the population. To improve the chances that we are finding the best combinations of parameters, simultaneous evolution processes happen in parallel on different “islands”, each with separate a population of 10 × nvars vectors. This process continues for a pre-set number of generations (niter). We then find the overall champion vector from all the islands; this is the vector giving the highest cell efficiency while not exceeding the maximum allowed colour deviation. If this was the start of the optimization, we let the differential evolution proceed on each island for niter more generations. At the end, we compare the efficiency of the new champion population with that obtained at the end of the previous round; if it has decreased, or the difference is within the tolerance set for Δη, we end the optimization (see Fig. 3). Otherwise, we continue in batches of niter generations until the condition for convergence is met.
 | ||
| Fig. 3 Operation of the multi-objective differential evolution method used to optimize cell colour and efficiency simultaneously. | ||
Further details of the mutation and crossover rules, multi-objective decomposition method, colour threshold and convergence conditions, and convergence testing can be found in Section S2 of the ESI.† Because this is a multi-objective problem, there will not be a single best solution, but rather a continuous set of solutions with increasing colour accuracy but decreasing efficiency (a ‘Pareto front’). The code is written so that the user can look at the whole population at the end, and if desirable change e.g. the allowed colour threshold to improve the efficiency. This could be justified for example when the Pareto front suggests that a relatively small amount of colour accuracy can be exchanged for large improvement in efficiency. Visualizations of the Pareto fronts and further discussion can be found in the ESI† video files and Section S2 of the ESI.†
All code used to produce the results and figures in this paper, and the data presented, are available.38 The up-to-date version of the Python code is hosted on GitHub.39
Results
Multi-junction cell efficiency
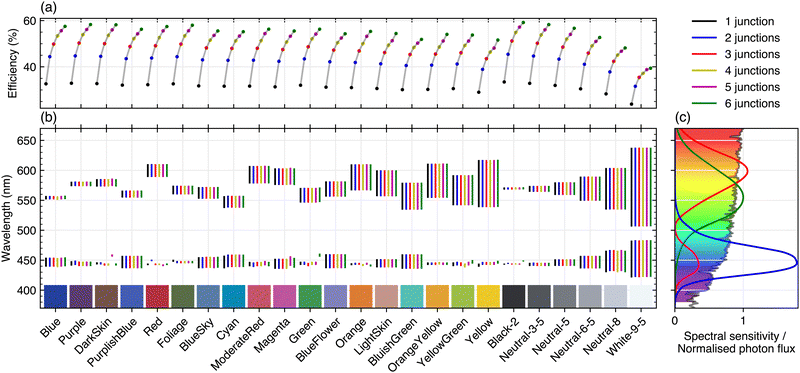
Fig. 4a shows the maximum achievable efficiency of cells with 1–6 junctions for the 24 ColorChecker passport colours. The optimal efficiencies are also listed in Table 1. Note that these limits are for series-connected sub-cells; the limits for cells with more than two terminals (e.g. three or four-terminal configurations for a tandem cell) would be higher.40 As expected, the efficiency increases with the number of junctions, and in general colours with higher relative luminance have a lower limiting efficiency since they require a larger number of photons to produce the desired colour (this confirms the results for single-junction cells, despite using a different optimization method, and extends them to cells with up to six junctions). However, some colours can be formed more efficiently due to the sensitivity of the human eye; the human eye is very sensitive to wavelengths around 550 nm, where the photon flux in the AM1.5G spectrum is also close to its maximum. This means there are many photons that can be reflected close to the peak sensitivity for yellow and green perception, giving especially efficient colour formation for yellow-green hues. The relative efficiency loss with respect to an ideal black cell (Fig. 5a) is mainly determined by the target colour rather than the number of junctions.| Name | x | y | Y | Efficiency (%) with number of junctions N | |||||
|---|---|---|---|---|---|---|---|---|---|
| N = 1 (0.001) | N = 2 (0.0007) | N = 3 (0.0009) | N = 4 (0.0009) | N = 5 (0.001) | N = 6 (0.004) | ||||
| Blue | 0.197 | 0.159 | 0.060 | 32.64 | 44.38 | 49.86 | 53.43 | 55.61 | 57.52 |
| Purple | 0.317 | 0.241 | 0.064 | 32.90 | 44.73 | 50.31 | 53.92 | 56.15 | 58.30 |
| Dark Skin | 0.420 | 0.370 | 0.102 | 32.74 | 44.53 | 50.05 | 53.64 | 55.99 | 58.19 |
| Purplish Blue | 0.224 | 0.202 | 0.116 | 32.08 | 43.52 | 48.78 | 52.25 | 54.30 | 56.26 |
| Red | 0.560 | 0.327 | 0.124 | 32.26 | 43.79 | 49.13 | 52.65 | 55.56 | 57.43 |
| Foliage | 0.361 | 0.441 | 0.133 | 32.63 | 44.37 | 49.84 | 53.42 | 55.60 | 58.01 |
| Blue Sky | 0.265 | 0.285 | 0.186 | 31.75 | 43.01 | 48.20 | 51.56 | 53.60 | 55.53 |
| Cyan | 0.207 | 0.288 | 0.194 | 31.62 | 42.81 | 47.98 | 51.29 | 53.33 | 55.19 |
| Moderate Red | 0.487 | 0.322 | 0.195 | 31.65 | 42.86 | 48.03 | 51.35 | 54.37 | 56.29 |
| Magenta | 0.400 | 0.259 | 0.199 | 31.34 | 42.39 | 47.49 | 50.75 | 53.24 | 55.52 |
| Green | 0.319 | 0.495 | 0.231 | 32.02 | 43.43 | 48.67 | 52.13 | 54.17 | 56.28 |
| Blue Flower | 0.289 | 0.273 | 0.234 | 31.20 | 42.18 | 47.24 | 50.48 | 52.46 | 54.31 |
| Orange | 0.523 | 0.405 | 0.307 | 31.00 | 41.88 | 46.89 | 50.09 | 53.20 | 55.33 |
| Light Skin | 0.406 | 0.366 | 0.351 | 30.62 | 41.30 | 46.21 | 49.37 | 51.29 | 54.41 |
| Bluish Green | 0.275 | 0.376 | 0.420 | 30.11 | 40.55 | 45.35 | 48.43 | 50.26 | 51.88 |
| Orange Yellow | 0.490 | 0.441 | 0.430 | 30.23 | 40.72 | 45.54 | 48.64 | 51.18 | 54.04 |
| Yellow Green | 0.392 | 0.496 | 0.441 | 30.57 | 41.22 | 46.12 | 49.26 | 51.18 | 53.76 |
| Yellow | 0.464 | 0.472 | 0.602 | 29.01 | 38.89 | 43.54 | 46.42 | 48.11 | 51.61 |
| Black | 0.000 | 0.000 | 0.000 | 33.79 | 45.85 | 51.76 | 55.49 | 57.82 | 59.71 |
| Black-2 | 0.332 | 0.343 | 0.032 | 33.45 | 45.42 | 51.21 | 54.89 | 57.18 | 59.19 |
| Neutral 3–5 | 0.330 | 0.344 | 0.089 | 32.85 | 44.66 | 50.22 | 53.83 | 56.04 | 58.29 |
| Neutral 5 | 0.331 | 0.346 | 0.191 | 31.96 | 43.33 | 48.56 | 51.99 | 54.04 | 56.69 |
| Neutral 6–5 | 0.332 | 0.346 | 0.359 | 30.48 | 41.09 | 45.97 | 49.10 | 51.00 | 52.71 |
| Neutral 8 | 0.333 | 0.346 | 0.588 | 28.30 | 37.81 | 42.41 | 45.11 | 46.74 | 48.17 |
| White 9–5 | 0.336 | 0.350 | 0.913 | 23.87 | 31.58 | 35.46 | 37.19 | 38.81 | 39.40 |
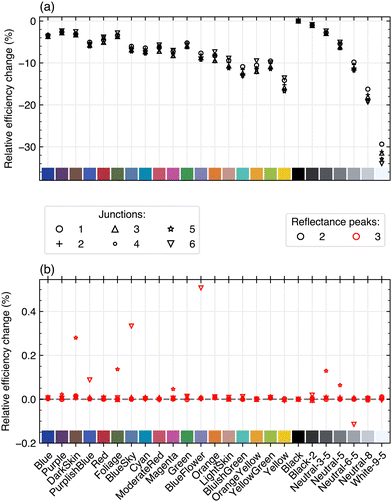 | ||
| Fig. 5 (a) Relative efficiency loss for coloured cells with 1–6 junctions and optimized bandgaps and reflectance spectra, compared to a black cell with the same number of junctions. The reflectance spectra have two rectangular peaks with height 1 (as in Fig. 4). (b) The relative change in optimized efficiency for reflectance spectra with three allowed peaks, as compared to the two-peak data shown in (a). In these plots, different symbols are used to denote different numbers of junctions, while different colours are used to differentiate the number of reflectance peaks. | ||
Effect of relative luminance
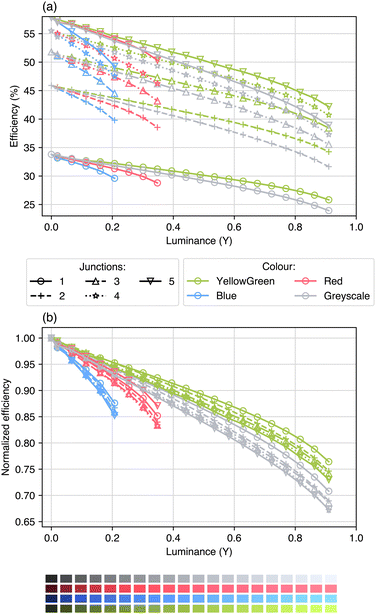
Fig. 6 shows the effect of increasing relative luminance Y at fixed values of x and y (i.e. fixed chromaticity) for four hues from the ColorChecker chart: Blue, YellowGreen, Red and neutral colours from black to white. As observed previously, the green colour has a higher limiting efficiency than the others at a given value of Y. Up to a relative luminance of around Y = 0.85, two-junction cells have a higher limiting efficiency than single-junction cells of any colour, showing that the additional junction can compensate for the loss of current due to colour formation for a wide range of colours. Additional junctions have diminishing benefits but can still provide a wide range of colours with higher limiting efficiencies; up to a relative luminance of Y = 0.6, with 1–5 junctions, all colours considered have <20% loss of maximum power compared to an ideal black cell with the same number of junctions.Reflectance peaks and bandgap placement
Fig. 4b shows the placement of the reflectance peaks for cells with 1–6 junctions and two allowed reflectance peaks. The spectral photon flux and colour-matching functions are shown for illustration on the right-hand side. We see that the position of the two reflectance peaks is constant with the number of junctions, with one peak centred close to 450 nm (the peak of the![[z with combining macron]](https://www.rsc.org/images/entities/i_char_007a_0304.gif) colour-matching function), and a second peak centred between 550 and 600 nm (the peaks of the ȳ and
colour-matching function), and a second peak centred between 550 and 600 nm (the peaks of the ȳ and ![[x with combining macron]](https://www.rsc.org/images/entities/i_char_0078_0304.gif) colour-matching functions, respectively), with its centre wavelength depending on the chromaticity of the target colour. We clearly see the reflectance bands broadening with increasing relative luminance. While there is some small variation in the exact peak placement with different numbers of junctions, this appears to be a result of the numerical optimization; there is no trend in changing peak placement with increasing number of junctions. With only two reflectance peaks, this remains true even when the optimal bandgap for the top junction shifts to the visible wavelength range, inside the reflectance bands, as can be seen in Fig. 7. However, if we allow the optimization algorithm to place three reflectance peaks, the efficiency of five or six junctions cells with some colours can be slightly improved, as shown in Fig. 5b. This happens only for cells where the optimal top cell bandgap is close to the peaks of the
colour-matching functions, respectively), with its centre wavelength depending on the chromaticity of the target colour. We clearly see the reflectance bands broadening with increasing relative luminance. While there is some small variation in the exact peak placement with different numbers of junctions, this appears to be a result of the numerical optimization; there is no trend in changing peak placement with increasing number of junctions. With only two reflectance peaks, this remains true even when the optimal bandgap for the top junction shifts to the visible wavelength range, inside the reflectance bands, as can be seen in Fig. 7. However, if we allow the optimization algorithm to place three reflectance peaks, the efficiency of five or six junctions cells with some colours can be slightly improved, as shown in Fig. 5b. This happens only for cells where the optimal top cell bandgap is close to the peaks of the ![[x with combining macron]](https://www.rsc.org/images/entities/i_char_0078_0304.gif) and ȳ colour-matching functions; in this case, the top cell voltage may be slightly improved by splitting the longer-wavelength reflectance peak and placing the bandgap in between the two new peaks. As shown in Section S4 of the ESI,† using three reflectance peaks slightly increases the total number of photons reflected to produce the colour, and reduces the total current available, and thus splitting the reflectance peak is only favourable for some cells where the top cell bandgap is in the visible region. However, since this requires forming two very narrow reflectance peaks close together, and the potential efficiency gain is extremely small (<0.5% relative, compared to two reflectance peaks), the addition of a third reflectance peak is unlikely to be of practical importance, and in most cases allowing a third reflectance peak does not change the optimal reflectance spectrum (see ESI† Fig. S8).
and ȳ colour-matching functions; in this case, the top cell voltage may be slightly improved by splitting the longer-wavelength reflectance peak and placing the bandgap in between the two new peaks. As shown in Section S4 of the ESI,† using three reflectance peaks slightly increases the total number of photons reflected to produce the colour, and reduces the total current available, and thus splitting the reflectance peak is only favourable for some cells where the top cell bandgap is in the visible region. However, since this requires forming two very narrow reflectance peaks close together, and the potential efficiency gain is extremely small (<0.5% relative, compared to two reflectance peaks), the addition of a third reflectance peak is unlikely to be of practical importance, and in most cases allowing a third reflectance peak does not change the optimal reflectance spectrum (see ESI† Fig. S8).
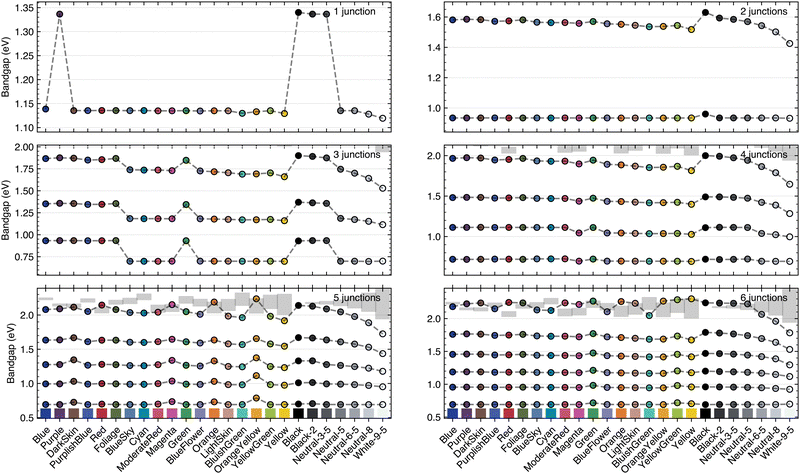 | ||
| Fig. 7 Optimized bandgap placement for all sub-cells for MJSCs with 1–6 junctions under the AM1.5G spectrum for the 24 ColorChecker colours and an ideal black cell. The reflectance bands required to produce each colour are shown as grey-shaded areas where they fall within the same energy ranges as the bandgaps (the higher-energy reflectance peak, around 450 nm (2.76 eV) is thus not shown in any of the plots). When an optimal bandgap is calculated to fall inside a reflectance band, it is shown at the high-energy edge, as explained in ESI† Section S4. | ||
When all the cell bandgaps are at wavelengths longer than those relevant for colour formation, it is possible to simplify the optimization problem by first finding the reflectance which produces the desired colour with the minimum number of photons, and then choosing cell bandgaps to maximize the efficiency.18 Depending on the desired colour, and assuming we can choose ideal bandgaps, this will be the case for a cell with up to 4 or 5 junctions (see Fig. 5b). Thus, the optimization method described above is in fact more complicated than necessary for the case of ideal reflectance peaks with fewer junctions, which will include most realistic applications. However, the advantage of the multi-objective method presented here, as compared to a two-step optimization process, is that it can be applied to realistic coloured PV implementations where the reflection is achieved using e.g. a Bragg reflector,20 so that the effect of the reflector will not be strictly isolated to only the target wavelengths and therefore affect current generation in more than one sub-cell. By applying this optimization framework to the relatively simple case of ideal reflectance peaks and detailed balance-limit cells, we can confirm its efficacy and produce limiting reference values which can inform more practical optimization studies.
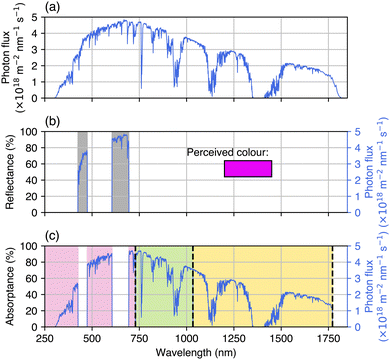
In general, the optimal bandgaps redshift as the relative luminance increases; the sub-cell(s) which lose current due to colour formation reduce their bandgap energy to adjust to a spectrum with fewer high-energy photons, and the other sub-cells must similarly shift downwards to maintain current-matching, as shown in Fig. 7. However, this trend is somewhat obscured due to sudden jumps in the optimal bandgap, which are due to atmospheric absorption bands in the AM1.5G spectrum which occur around e.g. 1.3 eV, 1.1 eV and 0.9 eV (see Fig. 2a). Within the absorption band, where photon flux is low, the optimal bandgap becomes ‘pinned’ to the high-energy side; this will give a higher VOC than the low-energy side, and since there are not many additional photons which can be absorbed, the JSC does not increase much if the bandgap is reduced. For this reason, placing the bandgap at the high-energy edge of the atmospheric absorption band gives a higher efficiency. This ‘pinning’ effect is clearly visible in the results for single and triple-junction cells in Fig. 7 as sudden shifts in the optimal bandgap. If a black-body spectrum is used instead for the optimization, these abrupt changes disappear (see ESI† Fig. S10). Due to the use of the detailed balance model and perfect (100%) reflectance peaks, a bandgap which is placed inside a reflectance band will lead to the same calculated efficiency (since absorption and emission of photons from that junction are restricted to energies above the high-energy edge of the reflectance peak). This effect is discussed and explained further in Section S4 of the ESI.†
Implications for multi-junction cell design
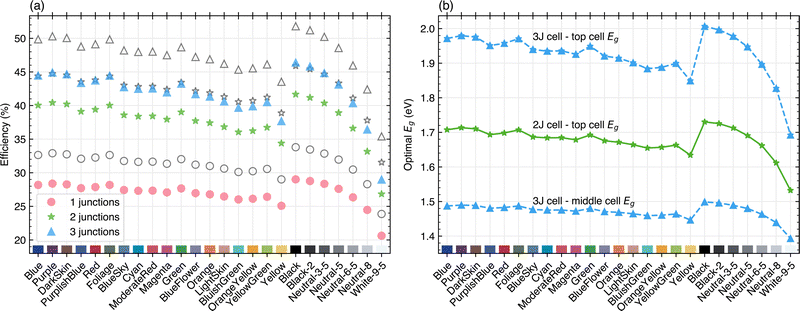
Thus far we have considered the design of MJSCs where the bandgap of each sub-cell can be tuned arbitrarily to find limiting efficiencies for coloured MJSCs. In order to explore how these limits relate to technologically relevant MJSC architectures, we will consider: (1) a two or three-junction cell with crystalline silicon (Eg = 1.12) as the bottom cell, relevant for e.g. perovskite on silicon or III–V on silicon devices, and (2) a Ga0.5In0.5P/GaAs/Ge triple-junction cell, which represents a typical high-efficiency device architecture used for space applications.As expected, reducing the ERE of the junctions causes a significant reduction in the limiting efficiency, due to an increase in J01 and associated reduction in the voltage. The limit obtained using an ERE of 1.6% for a single-junction Eg = 1.12 eV cell is 29.0%, as shown in Fig. 8a, in line with previously reported values of the efficiency limit of crystalline silicon (in the range 29.0–29.5%) when Auger recombination is taken into account.41 Most of the reduction in the efficiency compared to the unconstrained case is due to the more realistic values of the ERE, rather than due to the fixed Si bandgap, as shown in ESI† Fig. S12.
A wide range of colours can be formed for dual and triple-junction cells on Si without significant performance loss relative to a black cell. For a two-junction cell with ERE limited as described above and the bottom bandgap fixed at 1.12 eV, all colours considered can be formed with <36% efficiency loss relative to the black cell; if the three highest-luminance colours (Yellow, Neutral 8 and White 9–5) are excluded, this falls to only a <15% loss. The limiting efficiencies of all coloured two-junction cells, except for a white cell, are higher than for a single-junction black c-Si cell. For the triple-junction with a c-Si bottom junction, the maximum loss relative to the black triple-junction is 38% for a white cell, or 19% if the three lightest colours are once again excluded. With a bottom cell Eg = 1.12 eV, the optimal bandgaps for the top cell are in the ranges 1.53–1.73 eV for a two-junction device, and 1.39–1.50 eV/1.69–2.00 eV for the middle/top cell of a three-junction device. If we exclude white, these ranges change to 1.61–1.73 eV and 1.43–1.50 eV/1.82–2 eV for two and three-junction cells, respectively. These values are achievable using, for example, existing perovskite42 and III–V materials.43
Fig. 9 shows the optimized efficiency (top row) for a Si-based tandem cell at varying relative luminance values Y = 0.25, 0.50 and 0.75, for all colours which can be formed through reflectance of the AM1.5G spectrum (since there are a limited number of photons available, not all possible colours can be formed by reflecting unconcentrated Sunlight, with the gamut of possible colours decreasing as the relative luminance increases). The ERE of each junction is again fixed, as described above. The maximum efficiency at each relative luminance is indicated, and as expected, it occurs for a yellow-green colour. The red dashed line indicates where the optimized efficiency is within 99% of this maximum. Many yellow-green hues can be formed with high efficiency, with orange and blue-green shades slightly less efficient. Lighter blue and pink/red colours are the least efficient. The bottom row of plots in Fig. 9 shows the optimal top bandgap for the tandems cells of each colour; as previously observed, a higher relative luminance reduces the optimal top cell bandgap, and the overall range of optimal top cell bandgaps for an Si-based tandem cell is 1.54–1.75 eV for all possible colours in the 0.25–0.75 relative luminance range.
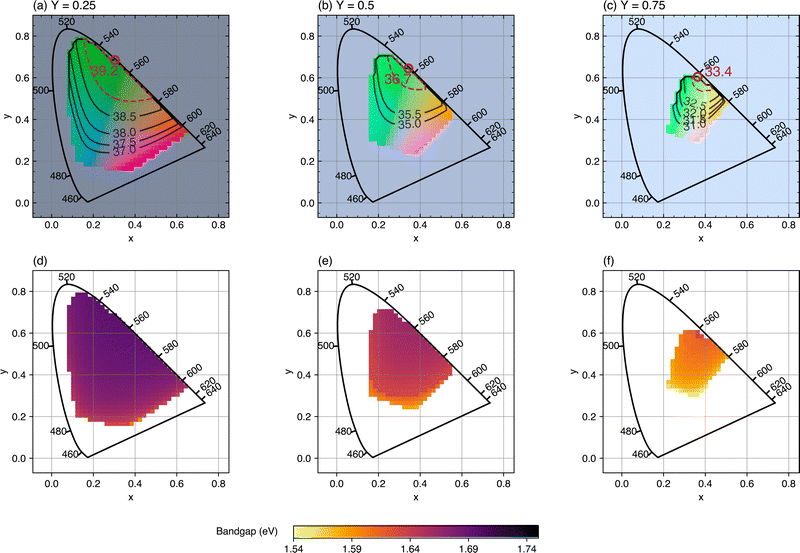 | ||
| Fig. 9 (a)–(c) Optimized efficiency for a two-junction cell with bottom junction having Eg = 1.12 (i.e. crystalline silicon) at three different relative luminance values Y. In each case, the gamut which can be achieved by reflecting the AM1.5G spectrum (i.e. the possible values of x and y at a fixed value of Y) are shown. The red circle marks the point at which the maximum conversion efficiency occurs, which is indicated in %. The dashed red line shows the area where the optimized efficiency is within 99% of the maximum efficiency and the black contours show how the efficiency changes when the chromaticity moves away from the yellow-green maximum. (d)–(f) The optimized bandgap of the top junction with increasing luminance. The external radiative efficiency is fixed at 10% for the top cell and 1.6% for the bottom cell, as in Fig. 8. | ||
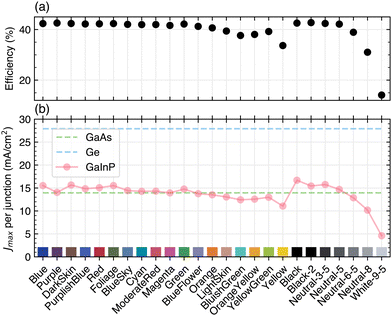 | ||
| Fig. 10 (a) Limiting efficiency and (b) current density at the maximum power point per junction for an GaInP/GaAs/Ge triple-junction cell (Eg = 1.90/1.44/0.67 eV). | ||
Fig. 10 demonstrates the detrimental effect colour formed through reflectance can have on current and thus efficiency if the junction which absorbs visible light (generally the top junction) becomes current-limiting. However, as long as the junction responsible for visible light absorption is not current-limiting in a series-connected multi-junction cell, the efficiency will not be affected by colour formation (in the ideal case of reflectance restricted only to visible wavelengths).
Conclusions
Efficiency limits for multi-junction solar cells with up to six junctions across a range of colours have been calculated for the first time, and we have presented the optimal sub-cell bandgaps and reflectance spectra required to reach these limiting efficiencies. The method introduced to solve the multi-objective optimization problem has been demonstrated to be applicable to arbitrary target colours and up to six junctions and three reflectance peaks. Two or three-junction cells across a wide range of colours offer a performance boost over a black single-junction device if effective selective reflectors can be designed. As expected, colours with higher relative luminance, requiring more photons to be reflected for colour formation, have lower limiting efficiencies, while green colours are easiest to make at fixed luminance due to the sensitivity of the human eye. We have confirmed through numerical optimization that two reflectance peaks are sufficient to produce a given colour using the smallest possible number of reflected photons.18 Although for some target colours, and only if at least one of the bandgaps is in the visible wavelength range, it is possible to reach a slightly higher efficiency (<0.5% increase in maximum power) by further splitting the reflectance peaks to increase the voltage of the top sub-cell, the small potential benefit and necessity for extremely narrow (<10 nm) reflectance peaks mean that in general, designs using at most two reflectance peaks will be more relevant in practice.Silicon-based tandems, such as perovskite on silicon, could be a promising platform for coloured PV; using realistic values for the external radiative efficiency in a detailed balance model shows a two-junction device with Si as the bottom junction could achieve efficiencies over 35% for a wide range of colours, or over 40% for a silicon-based triple-junction device.
In addition to presenting efficiency limits for a variety of device architectures, the method used has been made freely available,39 and can be applied to other device types44 or more realistic optical and device models. In this work, angular effects have been neglected, but these must be considered when designing real devices; further work is required to investigate how closely real reflecting structures could approach the limits calculated here.
Conflicts of interest
There are no conflicts of interest to declare.Acknowledgements
PMP would like to acknowledge funding from the Australian Research Council Centre of Excellence in Exciton Science. The authors would also like to acknowledge the Australian Centre for Advanced Photovoltaics (ACAP) for travel support.References
- N. M. Haegel, P. Verlinden, M. Victoria, P. Altermatt, H. Atwater, T. Barnes, C. Breyer, C. Case, S. De Wolf, C. Deline, M. Dharmrin, B. Dimmler, M. Gloeckler, J. C. Goldschmidt, B. Hallam, S. Haussener, B. Holder, U. Jaeger, A. Jaeger-Waldau, I. Kaizuka, H. Kikusato, B. Kroposki, S. Kurtz, K. Matsubara, S. Nowak, K. Ogimoto, C. Peter, I. M. Peters, S. Philipps, M. Powalla, U. Rau, T. Reindl, M. Roumpani, K. Sakurai, C. Schorn, P. Schossig, R. Schlatmann, R. Sinton, A. Slaoui, B. L. Smith, P. Schneidewind, B. Stanbery, M. Topic, W. Tumas, J. Vasi, M. Vetter, E. Weber, A. W. Weeber, A. Weidlich, D. Weiss and A. W. Bett, Photovoltaics at multi-terawatt scale: Waiting is not an option, Science, 2023, 380, 39–42 CrossRef CAS PubMed.
- C. Ballif, L.-E. Perret-Aebi, S. Lufkin and E. Rey, Integrated thinking for photovoltaics in buildings, Nat. Energy, 2018, 3, 438–442 CrossRef.
- T. E. Kuhn, C. Erban, M. Heinrich, J. Eisenlohr, F. Ensslen and D. H. Neuhaus, Review of technological design options for building integrated photovoltaics (BIPV), Energy Build., 2021, 231, 110381 CrossRef.
- B. Commault, T. Duigou, V. Maneval, J. Gaume, F. Chabuel and E. Voroshazi, Overview and Perspectives for Vehicle-Integrated Photovoltaics, Appl. Sci., 2021, 11, 11598 CrossRef CAS.
- G. Apostolou and A. H. M. E. Reinders, Overview of Design Issues in Product-Integrated Photovoltaics, Energy Technol., 2014, 2, 229–242 CrossRef.
- I. Mathews, S. N. Kantareddy, T. Buonassisi and I. M. Peters, Technology and Market Perspective for Indoor Photovoltaic Cells, Joule, 2019, 3, 1415–1426 CrossRef CAS.
- C. Polyzoidis, K. Rogdakis and E. Kymakis, Indoor Perovskite Photovoltaics for the Internet of Things—Challenges and Opportunities toward Market Uptake, Adv. Energy Mater., 2021, 11, 2101854 CrossRef CAS.
- A. Reinders, Designing with Photovoltaics, CRC Press, 1st edn, 2020 Search PubMed.
- M. Pelle, E. Lucchi, L. Maturi, A. Astigarraga and F. Causone, Coloured BIPV Technologies: Methodological and Experimental Assessment for Architecturally Sensitive Areas, Energies, 2020, 13, 4506 CrossRef CAS.
- S. A. Awuku, A. Bennadji, F. Muhammad-Sukki and N. Sellami, Myth or gold? The power of aesthetics in the adoption of building integrated photovoltaics (BIPVs), Energy Nexus, 2021, 4, 100021 CrossRef.
- E. Lucchi, S. Baiani and P. Altamura, Design criteria for the integration of active solar technologies in the historic built environment: Taxonomy of international recommendations, Energy Build., 2023, 278, 112651 CrossRef.
- T. Zhang, M. Wang and H. Yang, A Review of the Energy Performance and Life-Cycle Assessment of Building-Integrated Photovoltaic (BIPV) Systems, Energies, 2018, 11, 3157 CrossRef CAS.
- K. Liu, B. Zhu and J. Chen, Low-Carbon Design Path of Building Integrated Photovoltaics: A Comparative Study Based on Green Building Rating Systems, Buildings, 2021, 11, 469 CrossRef.
- M. Ghasri, A. Ardeshiri, N. J. Ekins-Daukes and T. Rashidi, Willingness to pay for photovoltaic solar cells equipped electric vehicles, Transp. Res. Part C: Emerging Technol., 2021, 133, 103433 CrossRef.
- K. Araki, A. J. Carr, F. Chabuel, B. Commault, R. Derks, K. Ding, T. Duigou, N. J. Ekins-Daukes, J. Gaume, T. Hirota, O. Kanz, K. Komoto, B. K. Newman, R. Peibst, A. Reinders, E. Roman Medina, M. Sechilariu, L. Serra, A. Sierra, A. Valverde and D. Zurfluh, State of the Art & Expected Benefits of PV-Powered Vehicles, International Energy Agency.
- E. Ilén, J. Halme, E. Palovuori, B. Blomstedt and F. Elsehrawy, Sun-powered textiles: Designing energy-autonomous electrotextile systems with solar cells, Aalto ARTS Books, 2022.
- F. Elsehrawy, B. Blomstedt, E. Ilén, E. Palovuori and J. Halme, Optimisation of knitted fabrics as visually concealing covers for textile-integrated photovoltaics, Sol. Energy Mater. Sol. Cells, 2023, 252, 112205 CrossRef CAS.
- J. Halme and P. Mäkinen, Theoretical efficiency limits of ideal coloured opaque photovoltaics, Energy Environ. Sci., 2019, 12, 1274–1285 RSC.
- F. Elsehrawy, K. Klockars, O. J. Rojas and J. Halme, Optical Interference Coatings Conference (OIC) 2022 (2022), paper MC.7, Optica Publishing Group, 2022, MC.7.
- B. Blasi, T. Kroyer, T. Kuhn and O. Hohn, The MorphoColor Concept for Colored Photovoltaic Modules, IEEE J. Photovoltaics, 2021, 11, 1305–1311 Search PubMed.
- R. R. Lunt, Theoretical limits for visibly transparent photovoltaics, Appl. Phys. Lett., 2012, 101, 043902 CrossRef.
- J. Bing, L. G. Caro, H. P. Talathi, N. L. Chang, D. R. Mckenzie and A. W. Y. Ho-Baillie, Perovskite solar cells for building integrated photovoltaics—glazing applications, Joule, 2022, 6, 1446–1474 CrossRef CAS.
- Y. Jiang, L. Yuanxun, R. Patterson, M. Green and N. Ekins-Daukes, A method to form colourful coatings for light harvesting devices, UNSW Invention Disclosure 2022-099.
- T. Smith and J. Guild, The C.I.E. colorimetric standards and their use, Trans. Opt. Soc., 1931, 33, 73–134 CrossRef.
- C. S. McCamy, H. Marcus and J. G. Davidson, A Color-Rendition Chart, J. Appl. Photogr. Eng., 1976, 2, 95–99 Search PubMed.
- The BabelColor Company, ColorChecker data, https://babelcolor.com/colorchecker-2.html, (accessed 16 May 2023).
- NREL, Reference Solar Spectral Irradiance: Air Mass 1.5, https://rredc.nrel.gov/solar/spectra/am1.5/, (accessed 4 August 2017).
- P. Wurfel, The chemical potential of radiation, J. Phys. C-Solid State Phys., 1982, 15, 3967–3985 CrossRef.
- U. Rau, Reciprocity relation between photovoltaic quantum efficiency and electroluminescent emission of solar cells, Phys. Rev. B: Condens. Matter Mater. Phys., 2007, 76, 085303 CrossRef.
- M. A. Green, Radiative efficiency of state-of-the-art photovoltaic cells: Radiative efficiency of photovoltaic cells, Prog. Photovolt: Res. Appl., 2012, 20, 472–476 CrossRef CAS.
- M. A. Green and A. W. Y. Ho-Baillie, Pushing to the Limit: Radiative Efficiencies of Recent Mainstream and Emerging Solar Cells, ACS Energy Lett., 2019, 4, 1639–1644 CrossRef CAS.
- D. W. deQuilettes, M. Laitz, R. Brenes, B. Dou, B. T. Motes, S. D. Stranks, H. J. Snaith, V. Bulović and D. S. Ginger, Maximizing the external radiative efficiency of hybrid perovskite solar cells, Pure Appl. Chem., 2020, 92, 697–706 CrossRef CAS.
- A. Pusch, P. Pearce and N. J. Ekins-Daukes, Analytical Expressions for the Efficiency Limits of Radiatively Coupled Tandem Solar Cells, IEEE J. Photovolt., 2019, 9, 679–687 Search PubMed.
- D. Alonso-Álvarez, T. Wilson, P. Pearce, M. Führer, D. Farrell and N. Ekins-Daukes, Solcore: a multi-scale, Python-based library for modelling solar cells and semiconductor materials, J. Comput. Electron., 2018, 17, 1099–1123 CrossRef.
- F. Biscani and D. Izzo, A parallel global multiobjective framework for optimization: pagmo, JOSS, 2020, 5, 2338 CrossRef.
- H. Li and Q. Zhang, Multiobjective Optimization Problems With Complicated Pareto Sets, MOEA/D and NSGA-II, IEEE Trans. Evol. Comput., 2009, 13, 284–302 Search PubMed.
- R. Storn and K. Price, Differential Evolution – A Simple and Efficient Heuristic for global Optimization over Continuous Spaces, Journal of Global Optimization, 1997, 11, 341–359 CrossRef.
- P. Pearce, Accompanying software and data for ‘Efficiency limits and design principles for multi-junction coloured photovoltaics DOI:10.5281/zenodo.10347600.
- P. Pearce, ECoPV, https://github.com/qpv-research-group/ECoPV.
- A. S. Brown and M. A. Green, Detailed balance limit for the series constrained two terminal tandem solar cell, Phys. E, 2002, 14, 96–100 CrossRef.
- B. A. Veith-Wolf, S. Schäfer, R. Brendel and J. Schmidt, Reassessment of intrinsic lifetime limit in n-type crystalline silicon and implication on maximum solar cell efficiency, Sol. Energy Mater. Sol. Cells, 2018, 186, 194–199 CrossRef CAS.
- Z. Song, C. Chen, C. Li, R. A. Awni, D. Zhao and Y. Yan, Wide-bandgap, low-bandgap, and tandem perovskite solar cells, Semicond. Sci. Technol., 2019, 34, 093001 CrossRef CAS.
- J. F. Geisz, R. M. France, K. L. Schulte, M. A. Steiner, A. G. Norman, H. L. Guthrey, M. R. Young, T. Song and T. Moriarty, Six-junction III–V solar cells with 47.1% conversion efficiency under 143 Suns concentration, Nat. Energy, 2020, 5, 326–335 CrossRef CAS.
- J. M. Ormaetxea Orobengoa, MSc thesis, NTNU, 2023.
Footnote |
| † Electronic supplementary information (ESI) available. See DOI: https://doi.org/10.1039/d3ee03337f |
| This journal is © The Royal Society of Chemistry 2024 |

