
 Open Access Article
 This Open Access Article is licensed under a Creative Commons Attribution-Non Commercial 3.0 Unported Licence
Spatio-temporal changes in the pre-monsoon thunderstorm activities of northeast India over the past four decades†
Arpita
Rastogi
,
J.
Kuttippurath
 * and
V. K.
Patel
* and
V. K.
Patel
CORAL, Indian Institute of Technology Kharagpur, Kharagpur, 721302, India. E-mail: jayan@coral.iitkgp.ac.in; Tel: +91 9475472847
First published on 24th April 2024
Abstract
The development of catastrophic mesoscale convective systems in the atmosphere, such as thunderstorms, is caused by several factors, the most important of which is moisture in the lower troposphere and then the instability and lifting of air parcels. In pre-monsoon, northeast and adjoining eastern India are susceptible to thunderstorms. Herein, we analyse the spatial and temporal changes in thunderstorm activities in terms of convective available potential energy (CAPE) and other parameters during the pre-monsoon period (March, April and May) in northeast (NE) and adjoining eastern India using ground-based and reanalysis data. It is observed that atmospheric instability is relatively higher in southern West Bengal and Tripura compared to the other regions in NE and adjoining eastern India, with a CAPE value of about 1500–3000 J kg−1 during pre-monsoon and 2000–3500 J kg−1 in May, indicating that these regions are more vulnerable to thunderstorms. Other thunderstorm indicators such as convective inhibition (CIN), K-index (KI) and total totals index (TTI) also exhibit relatively higher values in these regions during pre-monsoon. Causal discovery and correlation analysis reveal a positive association of thunderstorm days with CAPE and TTI, but a negative link with CIN. A significant negative trend is estimated in CAPE and other parameters in NE and eastern India during May, which is more dominant in southern West Bengal and Tripura (about −8 to −12 J per kg per year). Stability indices such as KI and TTI also show significant negative trends in NE India. There is a negative trend in thunderstorm days at Mohanbari, Barapani, Jorhat, Pasighat and Silchar, while positive trends at Dhubri, Imphal, Tezpur and Lengpui in the recent decade (2011–2020), which is consistent with the changes in thunderstorm indicators at these stations. This study provides an important insight into thunderstorm activity in areas susceptible to extreme weather events in the context of recent climate change and global warming.
Environmental significanceIn the climate change context, extreme events are becoming more devastating in terms of their occurrence and intensity. Thunderstorms pose great challenges to both humanity and environment, including the risks of hail, heavy rainfall and flash floods. We present a comprehensive analysis of recent changes in thunderstorm activity in northeast and eastern India, which are regional thunderstorm hotspots. Herein, we observe a decrease in thunderstorm activities in northeast India during pre-monsoon in the last decade. Thus, this study provides new insights into the thunderstorm activities in one of the global hotspots. |
1 Introduction
Thunderstorms are one of the most hazardous mesoscale convective systems in the atmosphere, and they occur because of several factors, such as moisture in the lower level of the atmosphere and the instability and lifting of air parcels. Thunderstorms form when large layers of warm, humid air rise to cooler regions of the atmosphere. The moisture in the updraft condenses to produce towering cumulonimbus clouds, which then precipitate. The World Meteorological Organisation (WMO) defines thunderstorm as one or more abrupt electrical discharges accompanied by a burst of light (lightning) and an acute or thundering sound. Thunderstorms create high-impact mesoscale weather phenomena, such as squalls, heavy rain and hailstorms, which result in fatalities and crop damage.Thunderstorm forecast requires a thorough understanding of its intensity, spatial and temporal changes, frequency of occurrence and trends.1,2 According to past climatology based on the data from 1951 to 1980, thunderstorms are more frequent (>40 days per year) in the northeast (NE) states, adjoining east India and parts of the southern peninsula.3 They are more dangerous in the NE states and east India, and are also known as Nor'westers because most of them move from northwest to southeast in this region. Rao and Raman4 studied the monthly and annual frequency of thunderstorms in India based on 20 years of data (1940–1959) and found that the highest thunderstorm activity occurs in the Assam, West Bengal, Jharkhand and Orissa states of India. The annual average thunderstorms in these areas exceed 75 days per year. Based on 28 years (1981–2008) of data, it has been found that there are two prominent regions of occurrence of thunderstorms in India, i.e. (i) the east-west oriented region along the foothills of Himalaya and (ii) the northwest to southeast oriented region from sub-Himalayan West Bengal to Tripura.5,6 Additionally, the monthly average of thunderstorm events is greater than 20 in Guwahati, Shillong, Imphal and Tezpur stations in April. Roy et al.7 showed that the number of thunderstorm days is highest in April and May throughout a zone spanning from the NE to West Bengal.
Surface observations with vertically resolved information allow for (accounting for the stability of the atmosphere) a better understanding of the thunderstorm dynamics in an area.8,9 Thermodynamic indices deal with the physical and dynamical progressions of the atmosphere, and they provide information regarding the conditions to cause a thunderstorm event by considering and computing the potential, conditional, latent and convective instability.10 These indicators have been frequently utilised to improve the forecasting of thunderstorms and related rainfall occurrences.11–15 The most common indices used for understanding the convective progression in a region are convective available potential energy (CAPE) and convective inhibition (CIN).16–18
Srivastava and Ray19 investigated the role of CAPE and CIN in controlling convective activities in India and found high/low values of CAPE/CIN in April 1997 in different parts of India. However, the NE region did not follow this pattern, and the lower CAPE values were associated with thunderstorm events. Based on previous studies, we can argue that CAPE cannot be the only metric for categorising Thunderstorm Day (TD) or Non-Thunderstorm Day (NTD), as a thunderstorm is a result of complex interaction processes among the land, ocean and atmosphere. Even though some studies deal with the long-term climatology of various indices derived from in situ observations across eastern India, the use of reanalysis data to compute the climatology of these indices for thunderstorm occurrences has been underexplored. There is a global climatology of CAPE/CIN using ERA-40 and ERA-5 datasets that demonstrate positive trends under convective conditions in tropical regions.20,21 However, regional analyses are yet to be performed for cause-and-effect assessment and long-term trend detection. Therefore, this study attempts to develop a climatology of key drivers for thunderstorms such as CAPE, CIN, K-index (KI) and Total Totals Index (TTI) indices, total column water vapour (TCWV) and planetary boundary layer (PBL) during pre-monsoon (March–April–May) from 1980 to 2020 for the eastern and NE India. It is important to mention that most studies on thunderstorm activities use either one index or CAPE values. However, we have chosen multiple indices, including CAPE and others, to provide a robust analysis of thunderstorm activities in the context of climate change. This analysis aims to estimate the trends of these thermodynamic indices and parameters for the study period with respect to ongoing climate change in NE and eastern India.
2 Study area
NE India (Fig. 1) can be divided into three physiographic regions: the Eastern Himalaya, the Patkai and Brahmaputra Valley Plain and the Barak Valley Plain. NE India has a humid subtropical climate with hot humid summers, strong monsoons and mild winters (near the confluence of Indo-Malayan, Indo-Chinese and Indian biogeographical domains). As monsoon winds arrive at the NE from the Bay of Bengal, these mountains pull the moist air higher, causing them to cool adiabatically and condense to clouds, which results in significant precipitation over these slopes. It is the country's wettest region, and many areas receive an average annual precipitation of 2000 mm mostly during the summer monsoon.22 The region can be divided into three broad categories according to the Köppen climatic classification: tropical, warm temperate mesothermal and snow microthermal.23 Tropical climate is experienced as the wet and dry spells in Manipur, Tripura, Mizoram and the Cachar plain south of 25° N. Much of Assam, Nagaland, northern sections of Meghalaya and Manipur, and parts of Arunachal Pradesh have warm mesothermal climate with mean temperatures ranging from 3 °C to 18 °C in the coldest months (December–January–February). The Brahmaputra valley has a humid subtropical climate with scorching summers. A climate condition with mild summers occurs at elevation from 500 to 1500 m in the eastern highlands of Nagaland, Manipur and Arunachal Pradesh. Finally, the farthest northern parts of Arunachal Pradesh have a humid continental climate with typical winter temperatures below 3 °C. West Bengal, the neighboring eastern state, has the Darjeeling Himalayan hill, Ganga delta, Rarh, coastal Sundarbans and the Bay of Bengal. The West Bengal climate can be broadly classified into two categories. Much of the sub-Himalayan West Bengal is classified as subtropical monsoon, dry winter and hot summer. Gangetic West Bengal and neighbouring southern sub-Himalayan West Bengal are of the tropical savanna type, which is hot and dry (typically in winter). | ||
| Fig. 1 Geographical location of northeast India and its adjoining east India; different states are also marked (e.g. Arunachal Pradesh and West Bengal). Elevation data are taken from AESTER. Pink dots indicate the geographical location of IMD measurement stations: Agartala (AG), Barapani (BG), Cherrapunjee (CP), Dhubri (DH), Guwahati (GW), Imphal (IM), Jorhat (JO), Lengpui (LE), Mohanbari (MO), Pasighat (PA), Shillong (SH), Silchar (SI) and Tezpur (TE). | ||
NE India is characterised by high intensity of thunderstorms. The cause of this phenomenon has not been fully understood although the geographical characteristics of the area may play a significant role in the occurrence of thunderstorms.24 During pre-monsoon, a north–south-oriented trough/wind discontinuity becomes more prominent along the northeastern peninsula. A moisture discontinuity zone develops to the east of the trough between the dry land winds and the moist winds from the periphery of the anticyclone over the Bay of Bengal, and becomes a favored zone for thunderstorm genesis.25,26 The frequency of thunderstorm days during these months is highest over a zone extending from the NE and adjoining eastern areas. The overall thunderstorm frequency increases with the increase in moisture supply from the adjacent sea. In addition, Nor'westers are commonly observed in the NE during pre-monsoon. They are characterised by the formation of thunderstorms caused by strong atmospheric vorticity and convective processes.27 The intense evaporation in the specific areas of open water bodies, such as rivers and lakes, may contribute to the formation of thunderstorms. This phenomenon is particularly prominent in the NE region of India before the onset of the monsoon season. In addition to the NE, we have also considered the adjacent east India region (West Bengal), which comprehensively covers the study area of thunderstorm hotspots in eastern India. West Bengal is susceptible to frequent thunderstorm activity during the pre-monsoon; therefore, we primarily focus on the NE and adjoining eastern India in this study.
3 Data and methodology
3.1 IMD surface data
We use the monthly mean (pre-monsoon) data for 13 Indian observatory sites in NE India to find the number of thunderstorm days (India Meteorological Department weather observation report:https://dsp.imdpune.gov.in/). The geographical locations of these measurement stations are shown in Fig. 1. Due to the transient nature of thunderstorms, which are typically short-lived mesoscale weather occurrences, it is challenging to maintain comprehensive records of observations given the limited duration of monitoring.5 Therefore, the data period is not uniform for all the measurement stations. The station names and their data periods are shown in Table S1.† The station-level reports of thunderstorms from Class 1 observatories in India during pre-monsoon are considered in this study. Weather information, including the occurrence and duration of thunderstorms, and the period and intensity of associated severe weather, is recorded at Class 1 observatories of India in 3-hourly intervals in the Monthly Meteorological Register (MMR). This format of reporting is as per the WMO standards for surface observatories. Before their archival at the National Data Centre of India, these data are quality-controlled in three stages (https://dsp.imdpune.gov.in). The digital MMR reports from the observatories for a day (starting at 0300 UTC of the previous day and ending at the same time of the next day) are manually checked for all reported weather parameters by the supervising Meteorological Centres and then rechecked at the Regional Meteorological Centres. Therefore, these data are strictly quality controlled as per the WMO criteria for surface observations. Here, thunderstorms are considered when at least one such event is reported. Therefore, thunderstorm days are defined as the days in which several thunderstorms occur once or more than once a day and are observed at ground stations.3.2 CAPE and auxiliary data
To understand the characteristics of thunderstorm activities, we analyse CAPE (taken from https://www.ecmwf.int/en/forecasts/datasets/reanalysis-datasets/era5) in east and NE India using the ERA5 data for the period 1980–2020. In addition, we examine other characteristics that are indicators of thunderstorm activity, such as KI, PBL, TTI, TCWV and CIN (obtained from https://www.ecmwf.int/en/forecasts/datasets/reanalysis-datasets/era5). CAPE is estimated in the ECMWF Integrated Forecasting System (IFS) by considering parcels of air departing at different model levels below 350 hPa.28 If a parcel of air is more buoyant (warmer and/or with more moisture) than its surroundings, it will continue to rise (cools as it rises) until it no longer has positive buoyancy. This parameter is calculated with the following assumptions: (i) the parcel of air does not mix with the surrounding air, (ii) ascent is pseudo-adiabatic (all condensed water falls out) and (iii) other simplifications related to mixed-phase condensational heating. The 5th generation ECMWF atmospheric reanalysis, ERA5, covers the period from January 1940 to date. The Copernicus Climate Change Service (C3S) on ECMWF provides ERA5 and has a wide range of air, land and oceanic variables in hourly frequency. ERA5 provides the most detailed data available for CAPE and other thunderstorm indicators. The ground-based measurements in these locations are inadequate to offer a comprehensive synoptic view of the entire area. Henceforth, we utilise ERA5 data in our analysis, which have already been employed in other studies to investigate thunderstorm occurrences.21,29,30 We take the monthly data in hourly averages because we do not address specific instances or occurrences of thunderstorms. Furthermore, this study offers a comprehensive overview of the various factors that contribute to the initiation of thunderstorms. These events are analysed on a monthly scale for NE India, in which they occur more frequently during pre-monsoon season.To understand the thunderstorm activities, we also analyse PBL, KI, TTI, TCWV and CIN together with CAPE for the period 1980–2020. The TTI threshold indicates the occurrence of a thunderstorm event as follows: 45–50 (a possible thunderstorm), 50–55 (a higher likelihood of a thunderstorm, possibly severe) and 55–60 (a high probability of a severe thunderstorm). Similarly, the KI value is <30 for thunderstorms with heavy rain, >30 for a higher likelihood of thunderstorms with heavy rain, and equal to 40 for the optimal conditions for thunderstorms with very heavy rain. The CAPE values can be categorised as follows: values <0 indicate a stable atmosphere, values between 0 and 1000 indicate a slightly unstable atmosphere, values between 1000 and 2500–3500 indicate a very unstable atmosphere and values >3500–4000 indicate an extremely unstable atmosphere (https://www.weather.gov/lmk/indices). Thermodynamic indices play a key role in the prediction of thunderstorms by combining information regarding spatial and temporal characteristics of the convective atmosphere.21,29
We use the monthly mean data of these variables to compute their climatology for the pre-monsoon period 1980–2020. In addition, we analyse the temporal evolution of all parameters in the NE and adjoining regions. To understand the changes in the spatial extent of frequent thunderstorm regions, we analyse the decadal changes in all parameters. Long-term changes in thunderstorm days at different ground-based stations are also computed. Trends in all parameters are estimated using linear regression and their statistical significance is computed at the 95% confidence interval (CI). In addition, causal discovery and correlation analysis are carried out between thunderstorm parameters and days for the stations where long-term data are available.
3.3 Trend estimation
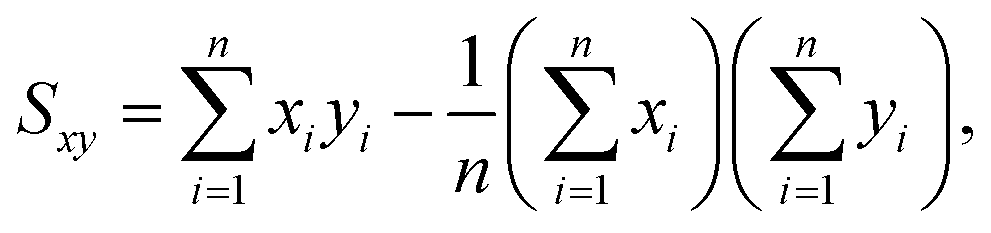
To estimate the trends, data for thunderstorm days along with a time series of thunderstorm indicators and drivers, such as CAPE, CIN, KI, TTI, TCWV and PBL, are used. The linear regression is used to estimate trends:31| y(t) = a + bx, |
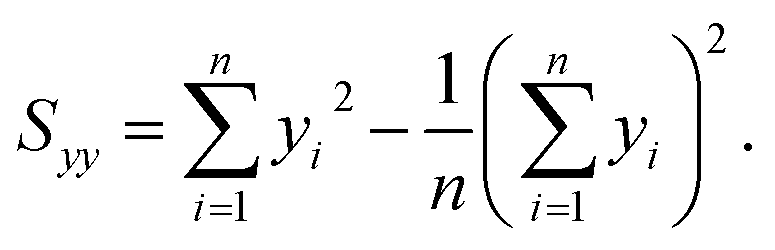
where n represents the entire duration of the study in years. The estimation error of trend b is determined by
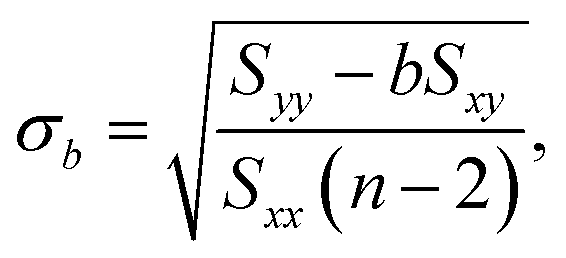
The Student's t-test is applied to ascertain the statistical significance of the trend with the 95% CI. The hypothesis test assertions are formulated as follows:
| H0b = 0, H1:b ≠ 0. |
The null hypothesis, denoted by H0, posits that the trend is significant, whereas the alternative hypothesis, denoted by H1, posits that the trend is not significant. The test statistic is calculated as follows:
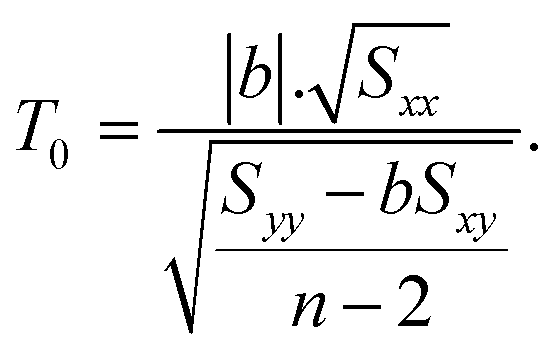
The test statistic, T0, follows a distribution with (n − 2) degrees of freedom. The acceptance zone for the null hypothesis H0 is
| −tα/2,n−2 < T0 < tα/2,n−2. |
3.4 Correlation and causal discovery
The Pearson correlation test quantifies the link between two variables measured on a continuous scale. It assigns a number ranging from −1 to 1, where 0 indicates no connection, 1 indicates a complete positive correlation and −1 indicates a complete negative correlation. The interpretation of a correlation value (e.g. 0.7) between two variables is that there is a strong and positive association between the two. A positive correlation indicates that an increase in a variable (e.g. CAPE) results in a corresponding increase in the second variable (e.g. thunderstorm days). Conversely, a negative correlation suggests that an increase in a variable (e.g. CIN) leads to a reduction in the other variable (e.g. thunderstorm days). The Pearson correlation coefficient for two parameters (e.g. x and y), each having paired qualities, is calculated by summing the product of their differences from their respective means (e.g. xmean and ymean) and then dividing this sum by the product of the squared differences from their respective means:
It is important to note that the correlation does not imply causation. Therefore, causal analysis is performed for four measurement sites, namely Guwahati, Imphal, Mohanbai and Tezpur, to examine the relationship between thunderstorm indicators and thunderstorm days. We consider these stations because they have data available for thunderstorm days over the past four decades. The same measurement stations are also considered for correlation analysis. We use the PCMCI+ algorithm, which is an extensively utilised method in the field of earth and environmental science.32 PCMCI+ utilises the PC algorithm to analyse time series data and identifies the true causal relationship among thunderstorm parameters. The PCMCI+ consists of two steps: first by employing a PC algorithm-based condition selection, it is possible to ascertain the parents of each target variable. This is achieved by determining the partial correlation between two time series while placing conditioning on others available at different delays. The PC method utilises the Markov and Faithfulness assumptions to generate a set of potential causal connections in a causally sufficient case. Second, the reliability of hypothesised correlations between two variables is evaluated using Multiple Linear Regression (MLR) and the Momentary Conditional Independence (MCI) test. For more details on the PCMCI+, please refer to Runge et al. (2019).33 The analysis is performed with a maximum lag of 2 months at a significance interval of 10%.
3.5 Delineating thunderstorm regions based on CAPE
CAPE measures the instability (or stability) of the atmosphere and can be used to predict the development of convection, which can result in heavy rainfall, thunderstorms and other severe weather events. Total surplus buoyancy indicates the potential energy represented by CAPE. Large positive CAPE values suggest that an air parcel is substantially warmer than its surroundings and is thus buoyant. CAPE is proportional to the greatest potential vertical velocity of air within an updraft; consequently, larger CAPE values suggest a higher risk of severe weather. Under thunderstorm conditions, observed values frequently surpass 1000 J kg−1, but 5000 J kg−1 in extreme circumstances. Here, we delineate the regions based on the CAPE threshold, as shown in Fig. 2. Based on the monthly and pre-monsoon mean CAPE values, we divide NE India into three regions, i.e. R1 (CAPE values between 1 and 1500, positive), R2 (CAPE values between 1500 and 2500, large) and R3 (CAPE > 2500, extreme), as shown in Fig. 2. Region R3 has higher atmospheric instability and favorable atmospheric conditions for the initiation of thunderstorms. | ||
| Fig. 2 R1, R2 and R3 represent the low, medium and high thunderstorm activity regions with respect to the convective available potential energy (CAPE) index. The bottom panel is the climatology of CAPE for pre-monsoon, March, April and May for the period 1980–2020, as derived from the ERA5 data. | ||
4 Results and discussion
4.1 Climatology of CAPE and thunderstorm days
Fig. 2 depicts the spatial distribution of CAPE in the NE and adjoining eastern India in pre-monsoon during 1980–2020. CAPE values in certain regions of Meghalaya and most areas of Tripura exceed 1000 J kg−1. The same holds for West Bengal with some parts of the region showing very high CAPE values, i.e. ≥2500 J kg−1. The values increase towards southern West Bengal and Tripura. Therefore, the hotspots with higher atmospheric instability are southern Tripura, West Bengal and some parts of Meghalaya. Note that the coastal West Bengal and Tripura have moisture feeding from the seasonal anticyclone over the north Bay of Bengal to the east of the North Indian dry line.34,35The monthly analysis of CAPE shows values between 500 and 1000 J kg−1 in March, except for some areas in West Bengal, where it is about 1000–1500 J kg−1. In April, most parts of West Bengal, Tripura and some parts of Meghalaya exhibit values greater than 1500 J kg−1, while the south and southeastern West Bengal and the southern tip of Tripura show values higher than 2000 J kg−1. CAPE values vary between 1000 and 1500 J kg−1 in some regions of Meghalaya, Assam, Mizoram and northwestern West Bengal. The rest of the regions show lower CAPE values, ≤1000 J kg−1. In May, regions with higher CAPE values are similar to those in April, except for West Bengal where the values are very high. This indicates that, as the pre-monsoon season sets in, heating of the earth surface and moisture incursion into the coastal regions result in high convective activity.
4.2 Spatial and temporal changes in CIN, KI, TTI, PBL and TCWV
Convective inhibition energy, as given by the thermodynamic index CIN, is critical for the origin of convective events. Spatial distribution of CIN during pre-monsoon for the period 1980–2020 reveals that its values vary from 50 to 500 J kg−1 in the NE and east India, as illustrated in Fig. 3. Relatively higher values of CIN are also observed in the regions where CAPE is high, at about 250–500 J kg−1. Southern West Bengal shows very high values of CIN, about 400–500 J kg−1, and these regions are more prone to thunderstorm occurrences. Our results are consistent with those of Sahu et al.,9 in which they showed that CIN in West Bengal ranges from 200 to 400 J kg−1 during thunderstorm days. In other regions, such as Assam and Tripura, where CAPE values are high, CIN is about 200–300 J kg−1. Region R1, for which the CAPE values are lower, shows small CIN values. | ||
| Fig. 3 Climatology of convective available potential energy (CAPE), K-index (KI), convective inhibition (CIN) and planetary boundary layer (PBL) during pre-monsoon derived from ERA5 for the period 1980–2020. Contours in pink colour in the top (right panel for KI) represent the total totals index (TTI) values for the same period. | ||
The K-index, also known as George's index, is a measure of the convective potential. The index is most suitable for flat to low elevation areas and does not properly work for high elevation regions, which change with seasons and locations.36 The pre-monsoon climatology for the 40 years shows that the KI index varies in the range of 25–35, as depicted in Fig. 3, with higher values in southern West Bengal, Assam and Tripura, which well match with CAPE and CIN there. The rest of the areas show a lower value of KI (<25), including Arunachal Pradesh, Nagaland and Sikkim. It is inferred that KI follows the spatial distribution of CAPE for most regions, except for some areas in Assam where KI reaches up to 35. High values of the K-index indicate a higher potential for convection and, thus, thunderstorm activity. However, KI may not identify a capping inversion that prevents thunderstorm development and cannot be used to determine the severity of thunderstorms. Therefore, we also analyse TTI for the same period to further examine these events.
TTI is a severe weather index used to analyse the strength of a storm. The index is made up of Vertical Totals (VT) and Cross Totals (CT), and is thus defined as the total of both indices.36 A higher TTI number indicates a greater likelihood of thunderstorm occurrence. The index is complete because it covers both vertical and cross total of the environment, and it works best in flat places with low to moderate elevations. However, the index does not directly assess wind shear and CAPE, which are storm-significant parameters, and it may miss the capping inversion that limits storm development. Here, we observe higher TTI values in southern West Bengal and Assam, about 45 (Fig. 3). These high values of TTI coincide with those of KI and CAPE. The average value of TTI is 40 in some areas in Meghalaya, Mizoram, Manipur, Nagaland and Arunachal Pradesh. The rest of the study areas, i.e., regions of Arunachal Pradesh and Sikkim, are exhibited in the range of 30–35. In brief, based on CAPE, CIN, TTI and KI, we can infer that the southern West Bengal and region R3 are highly subjected to thunderstorm activities.
Planetary boundary layer processes play an important role in the formation of thunderstorm events. PBL height is higher during pre-monsoon in comparison to other seasons in India.37 The spatial distribution of PBL for the past 40 years (1980–2020) indicates that the average height is in the range of 500–800 m in most parts of West Bengal and Tripura, and some areas in Meghalaya, Assam, Manipur and Mizoram (Fig. 3). Region R1 has a relatively lower PBL, which is less than 300 m. We have further examined the distribution of TCWV in the region and found that its values are very high, around 40 kg m−2, for most of West Bengal, Tripura, Assam, and some areas of Meghalaya and Mizoram (Fig. S1†). TCWV ranges between 20 and 30 kg m−2 in the rest of the regions, and the average values mostly follow the spatial distribution of CAPE and KI, except for Assam.
4.3 Temporal evolution and decadal changes in CAPE and other parameters
We also examined the interannual variability of CAPE and other parameters for the period 1980–2020, as illustrated in Fig. 4. A gradual decrease in CAPE and PBL is observed in NE India, particularly from 2015 onwards. For example, high values of CAPE are found in 1991 and 2010, but lower values in 1989 and 1999. Similar interannual variability is also observed for KI and TTI. For instance, the increase and decrease in KI and TTI values over the years match well with those of CAPE, except for 2010. Variability in CIN is opposite to those of CAPE, KI and TTI. However, variability in TCWV is similar to that of CAPE, KI and TTI. The CIN is an important measure that quantifies the negative buoyant energy exerted on an air parcel, hence impeding the vertical movement of ascending air and suppressing convective activity. As the CIN values increase (decrease), the likelihood of convective activity occurring decreases (increases). Therefore, the opposite variability is observed in CIN compared to the other parameters. | ||
| Fig. 4 Temporal evolution of convective available potential Energy (CAPE), convective inhibition (CIN), planetary boundary layer (PBL), K-index (KI), total column water vapour (TCWV) and total totals index (TTI) from ERA5 averaged over NE India and its adjoining east India for the period 1980–2020. | ||
We further examined the decadal spatial variability of all considered parameters, as presented in Fig. S2 and S3.† There is no significant change in CAPE in Arunachal Pradesh, Nagaland and Manipur. However, small changes are observed in central Assam, where CAPE is declining during the period 2011–2020 compared to its previous decades (Fig. S2†). No change is observed in CAPE during March and April. Nevertheless, there is a decrease in CAPE in May, as observed in northeast Assam in the last decade (2011–2020). Similarly, a decline in CAPE is also observed in the southern part of West Bengal in May over the past two decades (2001–2020).
Fig. 5 illustrates the temporal evolution of thunderstorm days at the measurement stations during pre-monsoon. It should be noted that there were no continuous measurements at Dhubri, Jorhat, Lengpui, Pasighat and Silchar until 2007. Similarly, there is a measurement gap between 1997 and 2007 in Barapani and Shilong. The discontinuity in thunderstorm observations is also present at Agartala and Cherrapunjee between 1990 and 2010. Thunderstorm days increase gradually at Imphal between 1980 and 1995. A similar increase is also observed at Agartala and Tezpur between 1980 and 1990. Furthermore, from 1980 to 2000, Guwahati experienced an increase in the number of thunderstorm days. Our findings are comparable to those of Singh et al.(2011),5 who demonstrated a progressive increase in thunderstorm days at Imphal and Guwahati at the same time. However, an unusual pattern is observed in thunderstorm days during the recent past (2011–2020). For example, Guwahati, Imphal, Tezpur, Agartala, Dhubri and Barapani exhibit a gradual increase in thunderstorm days. However, Mohanbari, Cherrapunjee, Shilong, Silchar, Lengpui, Pasighat and Jorhat show a decrease in thunderstorm days.
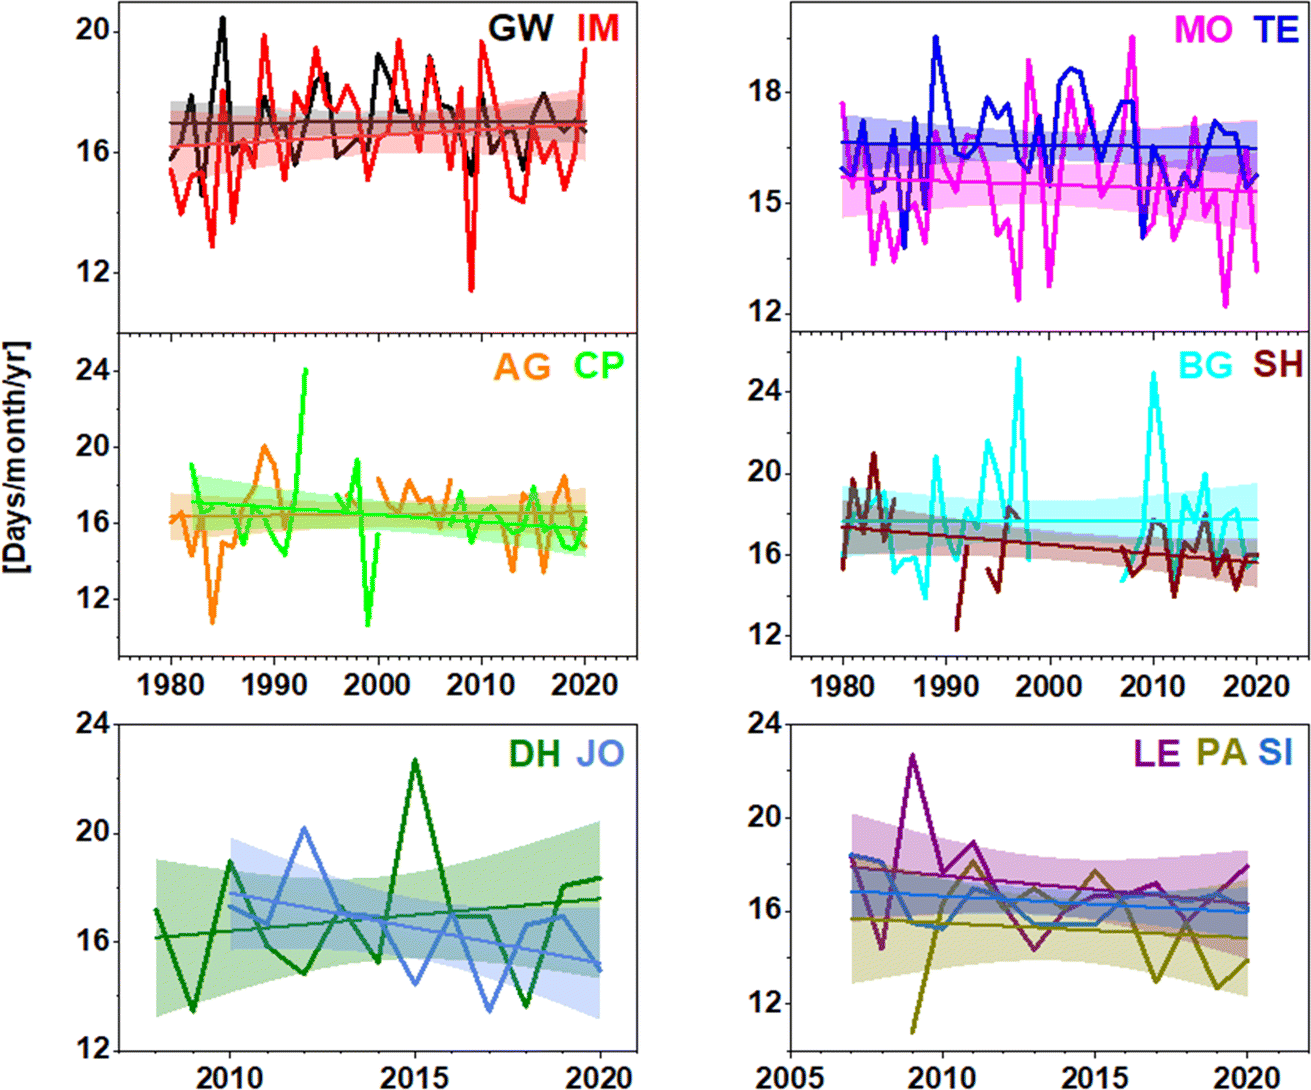 | ||
| Fig. 5 Time evolution of thunderstorm days at the measurement stations: Agartala (AG), Barapani (BG), Cherrapunjee (CP), Dhubri (DH), Guwahati (GW), Imphal (IM), Jorhat (JO), Lengpui (LE), Mohanbari (MO), Pasighat (PA), Shillong (SH), Silchar (SI) and Tezpur (TE). | ||
Decadal changes in other parameters are not clearly identifiable, but a decline in CIN and KI is observed in southern West Bengal in the last decade (2011–2020) compared to the previous decades (Fig. S3†). Because it is difficult to understand the changes in the average values of parameters in the regions, we estimate the long-term trends. In brief, the decadal variations in CAPE during pre-monsoon in the past 40 years show hardly any change. The decadal variability does not show significant differences in the pre-monsoon months although there is a decrease in CAPE (2011–2020) in NE India. Similarly, the KI and TTI indices do not show much difference across the decades. The CIN analysis shows a slight increase in its value between 2001–2010 and 2011–2020, particularly in West Bengal and Manipur. The planetary boundary layer shows a decreasing pattern in Manipur for the decades 1981–1990 and 1991–2000. The TCWV decadal analysis suggests no noticeable difference, except in 1981–1990 and 1991–2000, in which an increasing tendency is observed (Fig. S4†).
4.4 Link between thunderstorm indicators and days
The causal link between thunderstorm indicators and days is summarised in the network graph, as depicted in Fig. 6. At Guwahati, CAPE exhibits a direct positive relationship with thunderstorm days, and it is also depicted in the correlation analysis with values of about 0.51. A similar causal relation of CAPE with thunderstorm days is also found at Imphal and Tezpur, with a correlation coefficient of about 0.45 and 0.52, respectively. At Mohanbari, no direct relationship is found between CAPE and thunderstorm days, but it shows a positive causal relationship with KI, which is another indicator of thunderstorm activity. The correlation analysis indicates a relatively weak positive relation (0.3) between CAPE and thunderstorm days at Mohanbari (Fig. 6). Note that CIN is negatively correlated with thunderstorm days at all four stations although causal analysis reveals a negative link between CIN and thunderstorm days at Imphal and Mohanbari. At Tezpur, a direct causal link is not found between CIN and thunderstorm days, but it shows a negative connection with TTI, which is an index that helps to understand thunderstorm activities in low to medium-elevation regions. It is also evident in the analysis that the correlation of thunderstorm days with TTI is stronger than that with KI at all stations. The analysis also exhibits a negative relationship between CIN and thunderstorm days, and the lower CIN aids in the genesis of thunderstorms. There is a direct causal relation between TCWV and TTI/KI at Guwahati, Mohanbari and Tezpur, but an indirect link between TCWV and thunderstorm days through CIN at Mohabari. A positive relationship is found between PBL and thunderstorm days at all stations, and it is stronger at Tezpur. Similarly, TCWV also shows a positive relationship with thunderstorm days, but the link is relatively weaker than that with CAPE and CIN.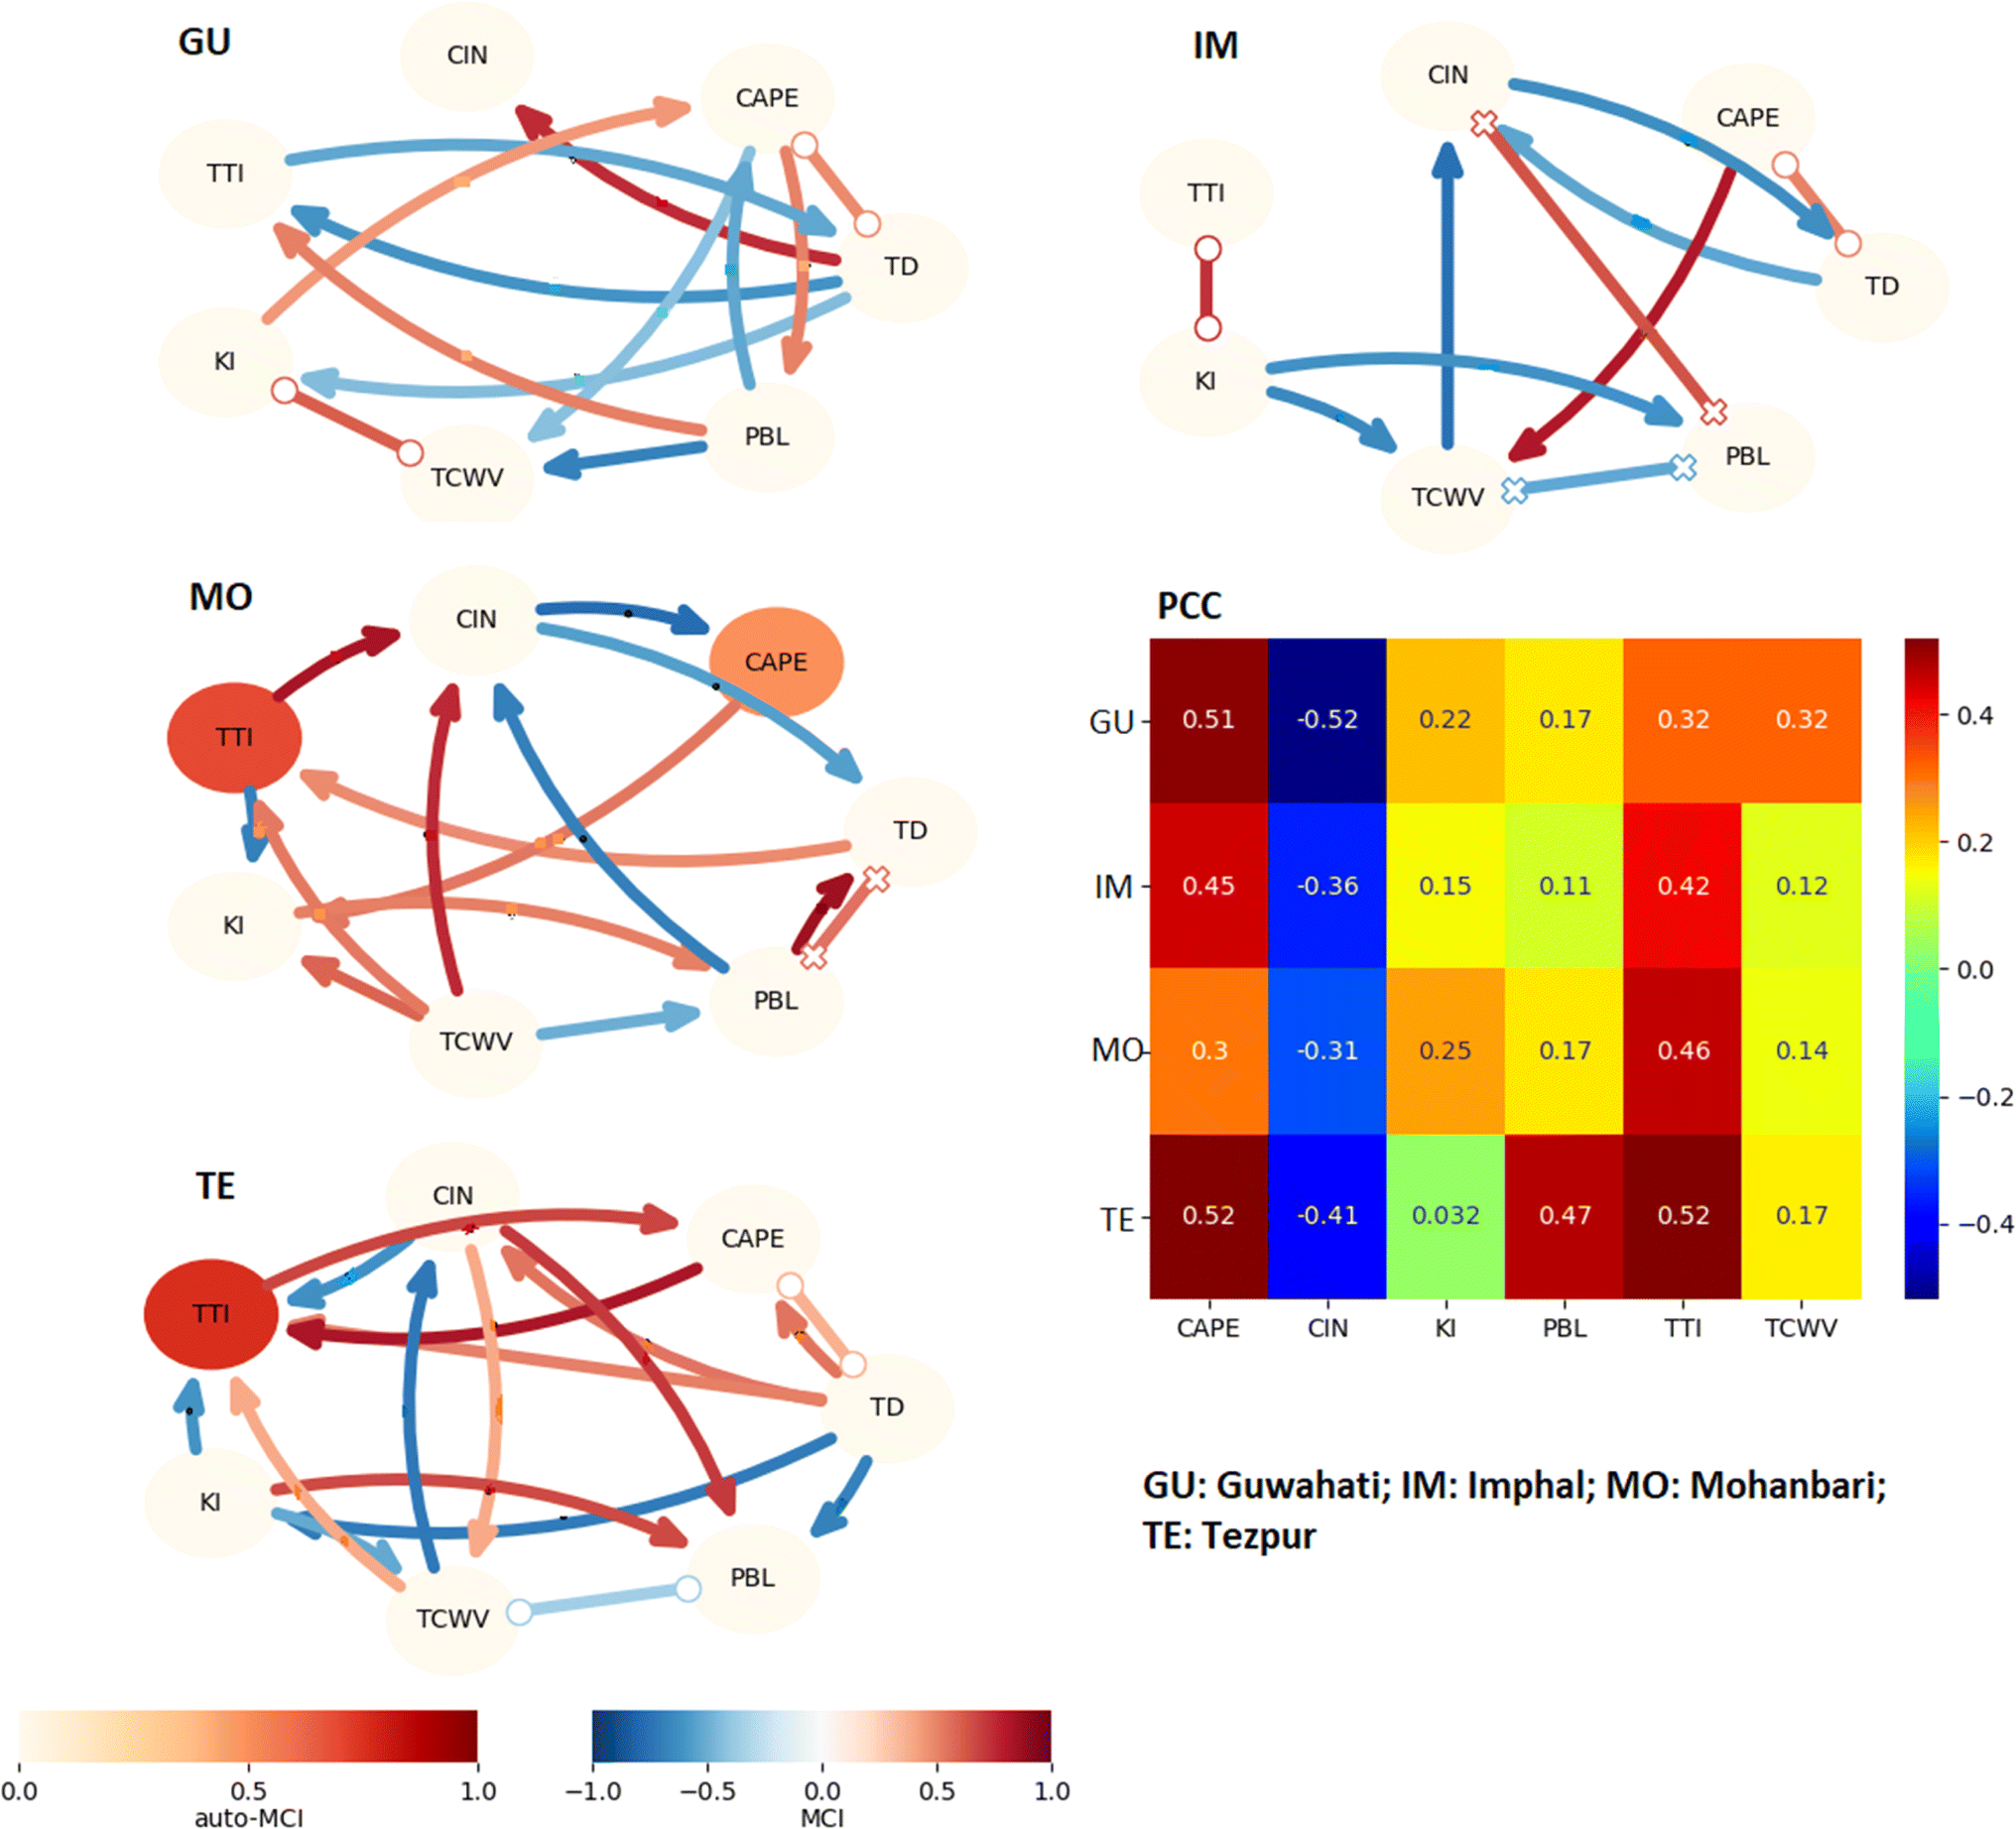 | ||
| Fig. 6 Network graphs of causal relation at the 10% significant limit between and among the thunderstorm indicators such as convective available potential energy (CAPE), convective inhibition (CIN), planetary boundary layer (PBL), K-index (KI), total column water vapour (TCWV), total totals index (TTI) and thunderstorm days (TD) at Guwahati (GW), Imphal (IM), Mohanbari (MO) and Tezpur (TE) for the period 1980–2020 at maximum allowable lag of two months. Here, the lag is not shown in the network graph, just causal association is presented to examine the correlation. Correlation analysis is shown in terms of the Pearson correlation coefficient (PCC) between TD and thunderstorm indicators at the same stations. | ||
4.5 Trends in CAPE, thunderstorm days and others
The trend estimate for the past 40 years for CAPE (Fig. 7) shows that it is significantly increasing (4 J kg−1 per year) in parts of West Bengal, Sikkim and Nagaland in March. The trend is significantly negative and very high in parts of Tripura, Mizoram and Assam, at about −8 J kg−1 per year, whereas it is smaller in the rest of NE India, at −4 J kg−1 per year. We also examine the trends in other related parameters. For instance, there is a negative trend in PBL in all regions in March, except for some parts of West Bengal, Tripura, Manipur, Assam, Arunachal Pradesh and Meghalaya, where slight positive trends (1–2 m per year) are found. In March, a positive trend in KI (0.025–0.05 KI per year) is found in West Bengal, Sikkim and parts of Arunachal Pradesh, but the rest of the areas show negative trends. Similarly, a significant positive trend in TTI (0.04–0.06 TTI per year) is found in West Bengal, whereas parts of Arunachal Pradesh show a negative trend (−0.04 TTI per year) in March. However, CAPE values show significant positive trends (12 J kg−1 per year) in some areas in West Bengal, and negative trends (−8 to −12 J kg−1 per year) in Tripura, Mizoram and southeast West Bengal in April. In the same month, the PBL trend is negative, except in the regions of southeast West Bengal, Tripura, Manipur, Mizoram and Assam, where positive trends are estimated. Similarly, positive trends are found in KI (0.075 KI per year) and TTI (0.04–0.06 TTI per year) in the NE during April, except in some parts of Assam and Arunachal Pradesh. Significant negative trends in CAPE dominate the study region in May, except for southwest West Bengal, where positive trends are estimated (at about 4 J kg−1 per year). Positive trends in PBL are also found in NE India in the same month, except for few regions of Meghalaya, West Bengal, Nagaland and Mizoram. In contrast to April, a negative trend is observed in the study region except in some areas of West Bengal in May. The TTI trend follows that of KI with a small increase or decrease in its values depending on the year. Moreover, CIN shows negative trends in West Bengal, but positive trends in many of the NE regions (Fig. S5†).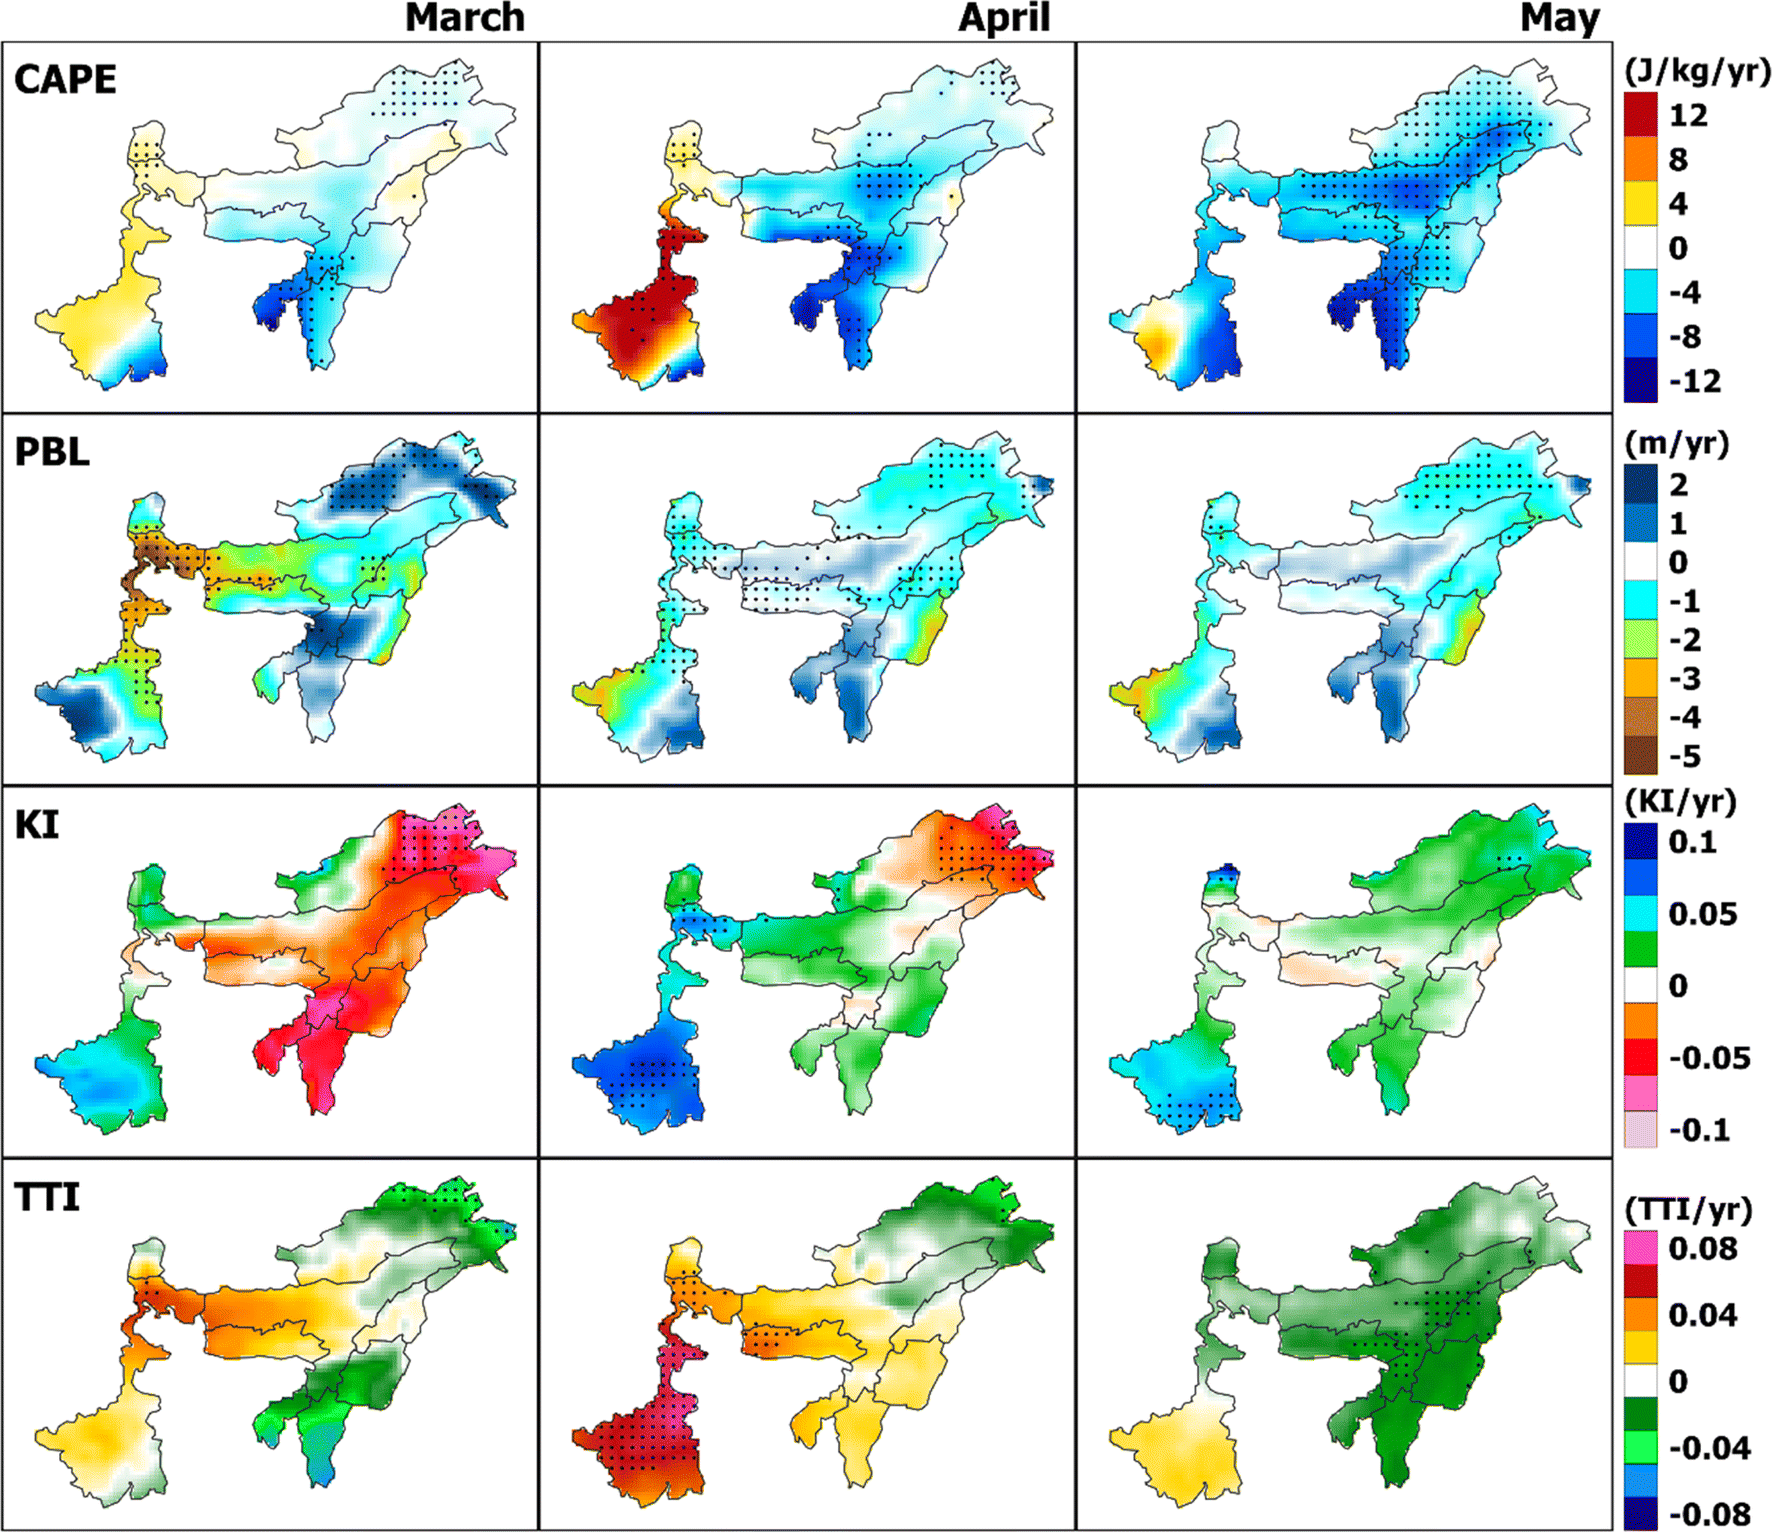 | ||
| Fig. 7 Trends in convective available potential energy (CAPE), planetary boundary layer (PBL), K-index (KI) and total totals index (TTI) during pre-monsoon months March, April and May estimated from ERA5 for the period 1980–2020. The stippled region represents statistically significant trends at the 95% CI. | ||
The positive trends in thunderstorm indices in thunderstorm-prone regions might contribute to the amplification of thunderstorm frequency, duration and severity. However, a decrease in the trends of these indices can result in a corresponding reduction in the number of thunderstorm days, as observed in this study. As previously stated, the conditions for thunderstorm occurrences are becoming unfavorable in NE India. Consequently, we also examine the patterns in the number of thunderstorm days to gain insight into the changes in the duration of their occurrences. There is a heterogeneity in the trends of thunderstorm parameters, which can be due to the complex topographical features of NE India. Notably, NE India lies in the vicinity of the Bay of Bengal, which constantly provides moisture, but it varies across the region, and this can also be one of the reasons for the heterogeneity in the thunderstorm activities there.
We also estimate the trends in thunderstorm days and other parameters at selected stations for the pre-monsoon period (Fig. 8). Positive trends are found in thunderstorm days at Imphal (0.4 days per year), Mohanbari (0.05 days per year), Tezpur (0.22 days per year) and Agartala (0.52 days per year) in 1981–1990. However, a negative trend is found at Barapani (−0.14 days per year) during the same period. Furthermore, Guwahati (0.08 days per year) exhibits a positive trend, while Imphal (−0.06 days per year), Mohanbari (−0.14 days per year) and Tezpur (−0.05 days per year) have negative trends in 1991–2000. In addition, Guwahati (−0.14 days per year), Imphal (−0.2 days per year), Mohanbari (−0.15 days per year) and Tezpur (−0.3 days per year) exhibit negative trends in thunderstorm days in 2001–2010. The negative trends in thunderstorm days at Guwahati and Imphal are also found in other studies for the period 1990–2008.5 In the recent decade (2011–2020), however, a peculiar trend is found at these stations. For example, negative trends are estimated at Mohanbari (−0.14 days per year), Cherrapunjee (−0.13 days per year), Barapani (−0.3 days per year), Shilong (−0.07 days per year), Jorhat (−0.3 days per year) and Pasighat (−0.5 days per year). The negative trend in thunderstorm activity is consistent with that of previous studies.38 Williams et al.39(2019) also found that the decreasing trend in thunderstorm days in different global regions is connected to the periods of pronounced hiatus in global warming from the 20th to 21st centuries. Increased heat uptake by the oceans is regarded as the cause of these pauses in global warming.40,41 Additionally, during these pause periods, there are greater variations in oceanic temperature than terrestrial temperature.42 However, positive trends are found at Guwahati (0.09 days per year), Imphal (0.08 days per year), Tezpur (0.08 days per year), Agartala (0.05 days per year), Lengpui (0.02 days per year), Silchar (0.02 days per year) and Dhubri (0.16 days per year) during 2011–2020.
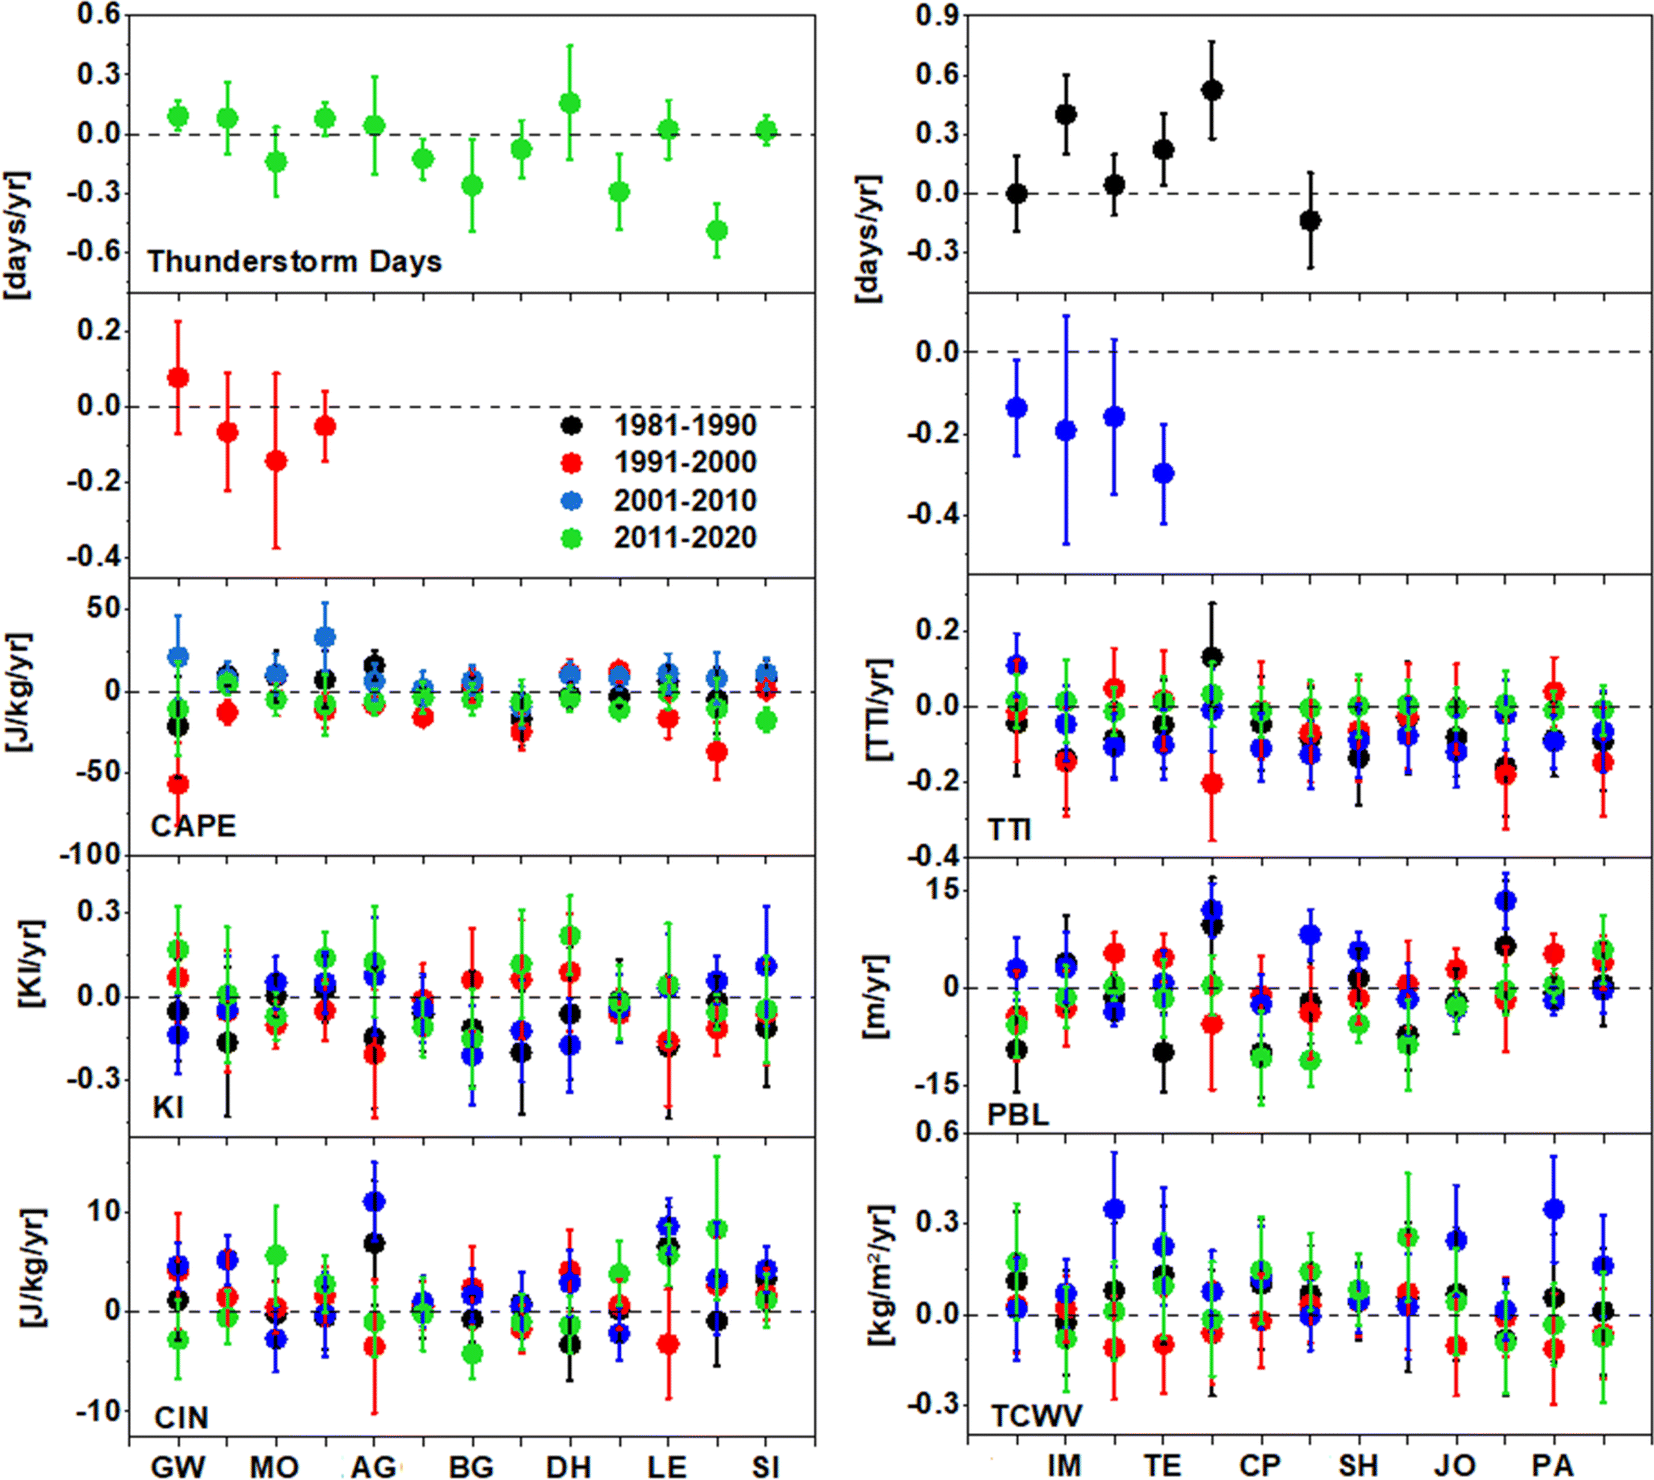 | ||
| Fig. 8 Trends in thunderstorm days during pre-monsoon months, convective available potential energy (CAPE), convective inhibition (CIN), planetary boundary layer (PBL), K-index (KI), total column water vapour (TCWV) and total totals index (TTI) at Agartala (AG), Barapani (BG), Cherrapunjee (CP), Dhubri (DH), Guwahati (GW), Imphal (IM), Jorhat (JO), Lengpui (LE), Mohanbari (MO), Pasighat (PA), Shillong (SH), Silchar (SI) and Tezpur (TE) during 1981–1990, 1991–2000, 2001–2010 and 2011–2020. The uncertainity with the vertical bars is shown at the 95% confidence interval. | ||
We further examine the long-term trends in thunderstorm indicators/indices at all measurement sites. A positive trend in CAPE (9.33 J kg−1per year) is found at Cherrapunjee in 1981–1990, which is consistent with the increase in thunderstorm days there. Similarly, negative trends in CAPE (−56 J kg−1per year), TTI (−0.01 per year) and PBL (−4.24 m per year) are in accordance with the decrease in thunderstorm days at Guwahati during 1991–2000. The negative trends in CAPE (−15 J kg−1per year), TTI (−0.14 per year), PBL (−3 m per year) and KI (−0.05 per year) agree with the decrease in thunderstorm days at Imphal during 1991–2000. The positive trends in TTI and KI at Guwahati, Imphal, Tezpur and Dhubri are consistent with the increase in thunderstorm days in 2011–2020. Similarly, negative trends in thunderstorm days at Mohanbari, Cherrapunjee and Barapani are consistent with the decrease in KI and TTI in these regions. As discussed above, both CIN and thunderstorms are negatively associated, and is evident in these trend estimates. For example, the positive trends in thunderstorm days are consistent with the negative trends in CIN at Guwahati in 2011–2020. Similar attribution can also be made for the Dhubari, Mohanbari and Agartala measurements in 2011–2020. There is a heterogeneity in the trends in thunderstorm indicators and frequency, which is also detected in the causal discovery. This suggests that a single indicator may only help to understand the overall behaviour of thunderstorm genesis or long-term changes, as it is a complex mesoscale process that depends on various parameters, ranging from atmospheric instability to surface heating.5,9
4.6 Constrains and future scope
The current synoptic network of observatories has difficulties in accurately documenting all instances of thunderstorms at the stations and surrounding regions, particularly in NE India, where its topography is very complex and plays an important role in thunderstorm genesis. To understand the relationship between thunderstorm days and indicators, long-term continuous data are necessary. Here, we consider four measurement stations for the correlation and causal analyses, for which long-term data are available. These four stations may not provide an overall picture of the link between thunderstorm indicators and frequency in the NE. Therefore, consistent and continuous measurements are required to examine the relationship between thunderstorm indices and storm frequency. Here, we use the reanalysis data for the thunderstorm indicators, which may also have uncertainities. As there are complex causal links, e.g. the opposite relation between CAPE and TCWV at Guwahati and Imphal, further studies are required to understand the relationship between CAPE and moisture on the station scale.5 Conclusions
Thunderstorms create high-impact weather phenomena on the mesoscale, such as hailstorms, heavy rain, floods and squalls, which cause causalities and crop damage. During pre-monsoon, NE India and its adjoining eastern India are susceptible to frequent thunderstorms. Therefore, we analyse the spatial and temporal changes in thunderstorm activities in terms of atmospheric instability parameters, such as CAPE and other indices, using ground-based and reanalysis data. We observe that CAPE is relatively higher in southern West Bengal and Tripura compared to the other regions in NE and adjoining eastern India during pre-monsoon. Furthermore, atmospheric instability is higher during May compared to the other pre-monsoon months, indicating more favorable conditions for the occurrence of thunderstorms. Other factors such as KI and TTI are also dominant (25–30 and 40–45, respectively) in the regions where CAPE values are high (e.g. West Bengal, Tripura and Assam). The causal discovery and correlation analysis show that there is a positive link of thunderstorm days with CAPE and TTI, but a negative association with CIN. There is a decreasing trend in most of the key indices during pre-monsoon in NE and east India. For instance, CAPE values indicate a significant negative trend, about −8 J kg−1 per year, for most of the study area in May during 1980–2020. Similarly, significant negative trends (−1 to −2 m per year) are observed in PBL in the region, except in Tripura, Mizoram and parts of West Bengal and Assam in May. For TTI, a negative trend (−0.02 TT per year) is estimated in the study region, except in West Bengal. However, for KI, in comparison to April, a significant negative trend is observed for West Bengal in May. The thunderstorm days show a decreasing trend at Mohanbari, Barpani, Jorhat, Pasighat and Silchar, whereas an increasing trend at Dhubri, Imphal, Tezpur and Lengpui between 2011 and 2020. In the current climate change context, characterised by changes in the frequency and severity of extreme events, the decreasing trends in thunderstorms at particular locations in one of the global hotspots call for close monitoring and frequent assessment of these events.Data availability
The ER5 data are available on: https://www.ecmwf.int/en/forecasts/datasets/reanalysis-datasets/era5. IMD data are available on https://dsp.imdpune.gov.in/.Author contributions
AR: methodology, data analysis, visualization, writing – original draft; JK: conceptualization, methodology, visualization, supervision, review & editing of original draft; VKP: data analysis, visualization, validation, review & editing of original draft.Conflicts of interest
The authors declare that they have no known competing interests.Acknowledgements
We thank the Director, Indian Institute of Technology Kharagpur (IIT Kgp), Head of CORAL IIT Kgp and the Ministry of Education (MoE) for facilitating the study. VKP acknowledges the support from MoE and IIT KGP. We also thank India Meteorological Department (IMD) and CDS for ground-based measurements and ERA5 data, respectively. AR is a scientist with IMD, and she expresses her gratitude to the Director General of Meteorology, IMD for the opportunity to pursue her doctoral degree as a working professional at IIT Kgp. This study received no funding.References
- U. Mondal, S. K. Panda, S. Das and D. Sharma, Spatio-temporal variability of lightning climatology and its association with thunderstorm indices over India, Theor. Appl. Climatol., 2022, 149, 273–289 CrossRef.
- O. Singh and P. Bhardwaj, Spatial and temporal variations in the frequency of thunderstorm days over India, Weather, 2019, 74, 138–144 CrossRef.
- A. Tyagi, Thunderstorm climatology over Indian region, Mausam, 2007, 58(2), 189–212 CrossRef.
- K. N. Rao and P. K. Raman, Frequency of days of thunder in India, Indian J. Met. Geophys., 1961, 12(1), 103–108 Search PubMed.
- C. Singh, M. Mohapatra, B. K. Bandopadhyay and A. Tyagi, Thunderstorm climatology over northeast and adjoining east India, Mausam, 2011, 62(2), 163–170 CrossRef.
- A. Tyagi, D. R. Sikka, S. Goyal and M. Bhowmick, A satellite-based study of pre-monsoon thunderstorms (Nor’westers) over eastern India and their organization into mesoscale convective complexes, Mausam, 2012, 63, 29–54 CrossRef.
- S. S. Roy, M. Mohapatra, A. Tyagi and S. R. Bhowmik, A review of Nowcasting of convective weather over the Indian region, Mausam, 2019, 70(3), 465–484 CrossRef.
- R. A. Peppier, A Review of Static Stability Indices and Related Thermodynamic Parameters, Illinois State Water Survey Division, SWS Miscellaneous Publication, 1988, p. 104 Search PubMed.
- R. K. Sahu, B. Tyagi, N. K. Vissa and M. Mohapatra, Pre-monsoon thunderstorm season climatology of Convective Available Potential Energy (CAPE) and Convective Inhibition (CIN) over Eastern India, Mausam, 2022, 73(3), 565–586 CrossRef.
- R. K. Sahu, J. Dadich, B. Tyagi and N. K. Vissa, Trends of thermodynamic indices thresholds over two tropical stations of north-east India during pre-monsoon thunderstorms, J. Atmos. Sol.-Terr. Phys., 2020, 211, 105472 CrossRef.
- P. Schultz, Relationships of several stability indices to convective weather events in northeast Colorado, Weather and Forecasting, 1989, 4(1), 73–80 CrossRef.
- S. D. Lohar and D. K. Pal, Pre-monsoon season rainfall variability over Gangetic West Bengal and its neighbourhood, India, Int. J. Climatol., 2001, 20(12), 1485–1493 Search PubMed.
- A. J. Haklander and A. Van Delden, Thunderstorm predictors and their forecast skill for the Netherlands, Atmos. Res., 2003, 67, 273–299 CrossRef.
- A. Madhulatha, M. Rajeevan, M. Venkat Ratnam, J. Bhate and C. V. Naidu, Nowcasting severe convective activity over south-east India using ground-based microwave radiometer observations, J. Geophys. Res. Atmos., 2013, 118(1), 1–13 CrossRef.
- C. Viceto, M. Marta-Almeida and A. Rocha, Future climate change of stability indices for the Iberian Peninsula, Int. J. Climatol., 2017, 37(12), 4390–4408 CrossRef.
- P. Murugavel, S. D. Pawar and V. Gopalakrishan, Climatology of lightning over Indian region and its relationship with convective available potential energy, Int. J. Climatol., 2014, 34(11), 3179–3187 CrossRef.
- A. Westermayer, P. Groenemeijer, G. Pistotnik, R. Sausen and E. Faust, Identification of favorable environments for thunderstorms in reanalysis data, Meteorol. Z., 2017, 26(1), 59–70 CrossRef.
- N. Liu, C. Liu, B. Chen and and E. Zipser, What Are the Favorable Large-Scale Environments for the Highest-Flash-Rate Thunderstorms on Earth?, J. Atmos. Sci., 2020, 77(5), 1583–1612 Search PubMed.
- A. K. Srivastava and K. S. Ray, Role of CAPE and CINE in modulating the convective activities during April over India, Mausam, 1999, 50(3), 257–262 CrossRef.
- K. Riemann-Campe, K. Fraedrich and F. Lunkeit, Global climatology of convective available potential energy (CAPE) and convective inhibition (CIN) in ERA-40 re-analysis, Atmos. Res., 2009, 93(1–3), 534–545 CrossRef.
- M. Taszarek, J. T. Allen, M. Marchio and H. E. Brooks, Global climatology and trends in convective environments from ERA5 and rawinsonde data, npj Clim. Atmos. Sci., 2021, 4, 1–11 CrossRef.
- J. Kuttippurath, S. Murasingh, P. A. Stott, B. B. Sarojini, M. K. Jha, P. Kumar, P. J. Nair, H. Varikoden, S. Raj, P. A. Francis and P. C. Pandey, Observed rainfall changes in the past century (1901–2019) over the wettest place on Earth, Environ. Res. Lett., 2021, 16(2), 024018 CrossRef.
- W. Köppen, Das geographische System der Klimate, Handbuch der Klimatologie, Bd. 1, Teil C 1936 Search PubMed.
- A. Guha, T. Banik, B. Kumar DE, R. Roy and A. Choudhury, Characteristics of severe thunderstorms studied with the aid of VLF atmospherics over North–East India, J. Earth Sci., 2013, 122, 1013–1021 Search PubMed.
- Y. P. Rao, and K. S. Ramamurti, Climatology of India and Neighbourhood, Forecasting Manual, India Meteorological Department, FMU Rep., No. 1-2, 1968, July, pp. 1–12 Search PubMed.
- STORM, STORM Science Plan, India Department of Science and Technology Rep., 2005, p. 118 Search PubMed.
- Y. Yamane and T. Hayashi, Evaluation of environmental conditions for the formation of severe local storms across the Indian subcontinent, Geophys. Res. Lett., 2006, 33, L17806 CrossRef.
- H. Hersbach, et al., The ERA5 global reanalysis, Q. J. R. Meteorol. Soc., 2020, 146, 1999–2049 CrossRef.
- R. K. Sahu and B. Tyagi, Spatial variation of thermodynamic indices over north-east India during pre-monsoon thunderstorm season, J. Atmos. Sol.-Terr. Phys., 2022, 232, 105868 CrossRef.
- D. Morgenstern, I. Stucke, G. J. Mayr, A. Zeileis and T. Simon, Thunderstorm environments in Europe, Weather Clim. Dynam., 2023, 4, 489–509 CrossRef.
- P. Zhai and R. E. Eskridge, Atmospheric water vapor over China, J. Clim., 1997, 10(10), 2643–2652 CrossRef.
- R. Kashyap, J. Kuttippurath and P. Kumar, Browning of vegetation in efficient carbon sink regions of India during the past two decades is driven by climate change and anthropogenic intrusions, J. Environ. Manage., 2023, 336, 117655 CrossRef PubMed.
- J. Runge, P. Nowack, M. Kretschmer, S. Flaxman and D. Sejdinovic, Detecting and quantifying causal associations in large nonlinear time series datasets, Sci. Adv., 2019, 5(11), eaau4996 CrossRef PubMed.
- K. J. Weston, The dry-line of Northern India and its role in cumulonimbus convection, Q. J. Roy Meteor. Soc., 1972, 98, 519–531 Search PubMed.
- N. Akter and K. Tsuboki, Climatology of the premonsoon Indian dryline, Int. J. Climatol., 2017, 37, 3991–3998 CrossRef.
- K. Arora, K. Ray, S. Ram and R. Mehajan, The Role of Instability Indices in Forecasting Thunderstorm and Non-Thunderstorm Days across Six Cities in India, J. Clim., 2023, 11(1), 14 CrossRef.
- M. N. Patil, S. D. Patil, R. T. Waghmare and T. Dharmaraj, Planetary boundary layer height over the Indian subcontinent during extreme monsoon years, J. Atmos. Sol.-Terr. Phys., 2013, 92, 94–99 CrossRef.
- S. Sen Roy and S. S. Roy, Spatial patterns of long-term trends in thunderstorms in India, Nat. Hazards, 2021, 107(2), 1527–1540 CrossRef.
- E. Williams, A. Guha, R. Boldi, H. Christian and D. Buechler, Global lightning activity and the hiatus in global warming, J. Atmos. Sol. Terr. Phys., 2019, 189, 27–34 CrossRef.
- J. Hansen, M. Sato, P. Kharecha and K. von Schuckmann, Earth's energy imbalance and implications, Atmos. Chem. Phys., 2011, 11, 13421–13449 CrossRef CAS.
- K. E. Trenberth, J. T. Fasullo and M. A. Balmaseda, Earth's energy imbalance, J. Clim., 2014, 27, 3129–3144 CrossRef.
- T. R. Karl, A. Arguez, B. Huang, J. H. Lawrimore, J. R. McMahon, M. J. Menne, T. C. Peterson, R. S. Vose and H. M. Zhang, Possible artifacts of data biases in the recent global surface warming hiatus, Science, 2015, 348(6242), 1469–1472 CrossRef CAS PubMed.
Footnote |
| † Electronic supplementary information (ESI) available: Figures and Table. See DOI: https://doi.org/10.1039/d3ea00133d |
| This journal is © The Royal Society of Chemistry 2024 |