
 Open Access Article
 This Open Access Article is licensed under a
 Creative Commons Attribution 3.0 Unported Licence
Chemically specific sampling bias: the ratio of PM2.5 to surface AOD on average and peak days in the U.S.†
Simon
Rosanka
 ,
Madison M.
Flesch
,
Yin Ting T.
Chiu
and
Annmarie G.
Carlton
*
,
Madison M.
Flesch
,
Yin Ting T.
Chiu
and
Annmarie G.
Carlton
*
University of California, Department of Chemistry, Irvine, California, USA. E-mail: agcarlto@uci.edu
First published on 3rd April 2024
Abstract
Accurate quantitative description of the atmospheric fine particulate matter (PM2.5) burden requires an understanding of aerosol amounts and properties that transcends measurement platforms. For example, air quality studies often seek to describe ambient PM2.5 with columnar aerosol optical depth (AOD), point measurements of mass, or some combination. PM2.5 chemical constituents affect such measurements differently. We investigate the ratio of PM2.5-to-AOD (η) from 2005 to 2016 at multiple surface locations across the contiguous U.S. using observations and models, and quantitatively account for PM2.5 sampling bias of nitrate and aerosol liquid water (ALW). We find η peaks during winter and is lowest in summer at all locations, despite contrasting seasonality in PM2.5 mass and AOD. Accounting for loss of nitrate and ALW from PM2.5 monitors improves consistency among η calculations in space and time. Co-occurrence of extreme PM2.5 mass concentrations and AOD events declined in the eastern U.S. but not in the west. On peak days, in all locations, ALW mass concentrations are higher and fractional contributions are larger relative to PM2.5 chemical composition during average conditions. This suggests an increased fraction of ambient PM2.5 is detectable via optical methods but not well described by surface mass networks on peak days. The Community Multiscale Air Quality (CMAQ) model reproduces similar spatial and temporal variability in η to surface observations in winter and summer simulations at the beginning and end of the analysis period. Accounting for sampling artifacts in surface monitors may improve agreement with model predictions and remote sensing of PM2.5 mass concentrations. The poor understanding of organic compounds and their PM2.5 sampling artifacts remains a critical open question.
Environmental significanceAtmospheric fine particulate matter (PM2.5) adversely affects human health and the environment. A variety of sampling approaches, such as filter-based measurements and optical techniques, exist to quantify the atmospheric aerosol burden. Each approach has advantages and each is prone to sampling biases that are, in part, a function of particle chemical composition. In this work, we seek to reconcile differences among aerosol optical depth (AOD) and PM2.5 mass measurements at surface sites in the contiguous U.S. We calculate the ratio of PM2.5-to-AOD with and without accounting for PM2.5 sampling biases due to two individual chemical constituents for which we can explicitly estimate filter artifacts. We investigate the ability of the EPA's community Multiscale Air Qualburnsity (CMAQ) model to reproduce observed ratios, and describe the predictive skill in the context of PM2.5 chemical constituents that are poorly described in filter-based samples. |
1 Introduction
Globally, exposure to ambient fine particulate matter (PM2.5) is a leading cause of non-communicable disease such as worsened cardiovascular health and increased mortality risks.1,2 Long term, chronic PM2.5 exposure is harmful to human health, as is acute exposure at high concentrations.3 Accurate, quantitative understanding of PM2.5 trends and peak concentrations is therefore critical to the management of air resources to safeguard human health. The U.S. Environmental Protection Agency (EPA) and other regulatory bodies in the U.S. employ surface monitoring networks to measure PM2.5 mass and characterize chemical composition. For example, the EPA's Chemical Speciation Network (CSN) measures 1-in-3 or 1-in-6 daily aggregated PM2.5 chemical composition predominantly in and near urban areas.4 The Interagency Monitoring of PROtected Visual Environments (IMPROVE) network measures fine aerosol mass and chemical composition predominantly in national parks around the U.S. on a similar 1-in-3 daily schedule.5 EPA's chief PM2.5 monitoring network measures daily-aggregated and/or hourly concentrations across the country, primarily located near populated areas.6 These networks record improved air quality and visibility at many locations over past decades, most notably in the eastern United States and in localized sites of California.7,8 Recently, to improve upon the spatial limitations of surface networks and increase global coverage, satellite observations of columnar aerosol optical depth (AOD) are frequently employed to understand near-surface PM2.5.9 AOD products advance understanding of the troposphere's PM2.5 burden and facilitate epidemiological studies that link PM2.5 mass concentrations to health endpoints related to exposure.10–14Application of once-or-twice a day satellite-derived clear sky AOD to understand surface PM2.5 and its impacts are limited. During cloudy times, quantitative understanding of tropospheric composition from satellites is most uncertain and often not possible. At any given time most of the Earth's surface is covered by clouds. Even during clear sky conditions, it is difficult to accurately assess surface PM2.5 with remotely retrieved AOD in some locations. In the arid western contiguous United States (CONUS), surface reflectivity induces large uncertainty in AOD.15,16 Further, the chemical speciation of atmospheric particles via satellite is challenging, and toxicology and epidemiology studies suggest PM2.5 chemical constituents, including water soluble species, contribute differently to adverse health impacts.17–20 Babila et al. (2020) hypothesize that including ALW in PM2.5 mass concentrations may reconcile epidemiological studies that find positive statistical associations among sulfate in ambient PM2.5 and health endpoints in the humid eastern U.S. but not in the arid western U.S.21 ALW mass is largely controlled by sulfate in the eastern U.S.,22 while nitrate, which is more hygroscopic, is more abundant in the western U.S. PM2.5 mass surface monitors exhibit negative artifacts for nitrate, organic species, and ALW from filter measurements,21,23,24 while satellites observe aerosols in situ with the condensed phase of these chemical species intact. This highlights the need to reconcile independent aerosol observations across measurement platforms.
Peak mass concentrations of PM2.5 and some constituents are frequently not captured by satellite AOD products due to satellite pass over times. The Moderate Resolution Imaging Spectroradiometer (MODIS) onboard the Aqua and Terra satellites measures AOD and has nominal overpass times on a sun-synchronous near-polar orbit of 10:30 a.m. (descending) and 1:30 p.m. (ascending) local time,25,26 which does not correspond to peak concentrations.27,28 During six weeks of direct surface measurements during the Southern Oxidant and Aerosol Study (SOAS),29 hourly ALW mass concentrations and particle hygroscopicity peak at approximately 8 a.m. Throughout the CONUS, peak values in ALW and nitrate mass are perceived to occur on cloudy days22,30 when remotely sensed AOD is least reliable. AOD and ALW mass concentrations are both greater in the eastern CONUS, though reported PM2.5 mass concentrations are often higher in the west.31–33 Over the CONUS correlations between satellite derived AOD and surface PM2.5 mass concentrations are more strongly positive in the east.16,34,35 Several factors affect the PM2.5-to-AOD (η) relationship, such as vertical distribution of particles and their intrinsic physicochemical properties that impact extinction, in addition to surface reflectivity.36,37 ALW mass and potentially other chemical constituents, such as nitrate and organic material, not well characterized by surface monitors also provide a plausible contributing explanation for the differences among PM2.5-to-AOD ratios.21,38
Recently, Jin et al. (2020) assessed η for the eastern CONUS from 2003 to 2017.39 They employed once-a-day MODIS AOD observations and daily integrated surface PM2.5 mass reported at EPA regulatory monitors. Their findings demonstrate declining correlation between filter-based surface PM2.5 mass and remotely sensed AOD, in addition to decreasing frequency of co-occurrence for peak values of AOD and PM2.5 mass. PM2.5 mass concentrations decreased dramatically in the eastern U.S. during their study period, most notably as a co-benefit of acid rain rules that also reduced sulfate concentrations.40–42 Mass concentrations of ALW and detection of its optical extinction also decreased in the eastern CONUS, contributing to improved visibility.43–46
For most locales on a clear sky day with a well-mixed boundary layer, PM2.5 and AOD are directly linked:
 | (1) |
 | (2) |
ALW is implicit in η. f(RH) is an estimate of the ALW-induced change in aerosol radius, and the amount of liquid water affects both ρ and reff directly. Qext,dry describes optical properties of dry particle mass; however, the metastable state of ambient aerosol is ubiquitous,49 and ALW is found in most ambient aerosol.33 Consideration of ALW can reconcile AOD and surface PM2.5 mass. Nguyen et al. (2016) find that in the southeastern U.S., seasonality in AOD is more consistent with seasonality in ALW33 than surface PM2.5 mass.50 Additionally, Bergin et al. (2000) find better agreement between surface-measured and inferred AOD from micropulse lidar profiles of aerosol backscatter and extinction when accounting for ambient RH and particle hygroscopicity.51 Thus, accounting for ALW and other semi-volatile PM2.5 constituents that exhibit negative mass artifacts in surface monitoring can facilitate improved understanding of the relationship between near-surface PM2.5 mass and columnar AOD and how it changes in space and time.
In this work, we evaluate hourly, daily, seasonal, and interannual trends in η from 2006 to 2015 at multiple surface monitoring locations across the CONUS, including the western U.S. where satellite retrievals are more uncertain. Hourly measurements of PM2.5 and AOD at surface locations facilitate analysis of η over a day, which is useful due to large diurnal changes in ALW and other variables that affect η. We investigate the plausibility of semi-volatile PM2.5 chemical constituents lost by regulatory surface PM2.5 monitors, to reconcile PM2.5-to-AOD relationships across the CONUS over a recent ten-year period during average conditions and at peak times. We quantitatively estimate nitrate and ALW loss. We also examine the ability of the EPA's Community Multiscale Air Quality (CMAQ) model, which is used to develop and assess policy related to PM2.5,52 to reproduce observed spatial and temporal trends in η.
2 Data and methods
We analyze η, AOD, and mass concentrations of PM2.5 and chemical constituents at surface sites across the CONUS in areas we classify as “humid” or “arid” based on average RH and simulated ALW mass concentrations (Fig. 1 and Table S1†) from 2006 to 2015.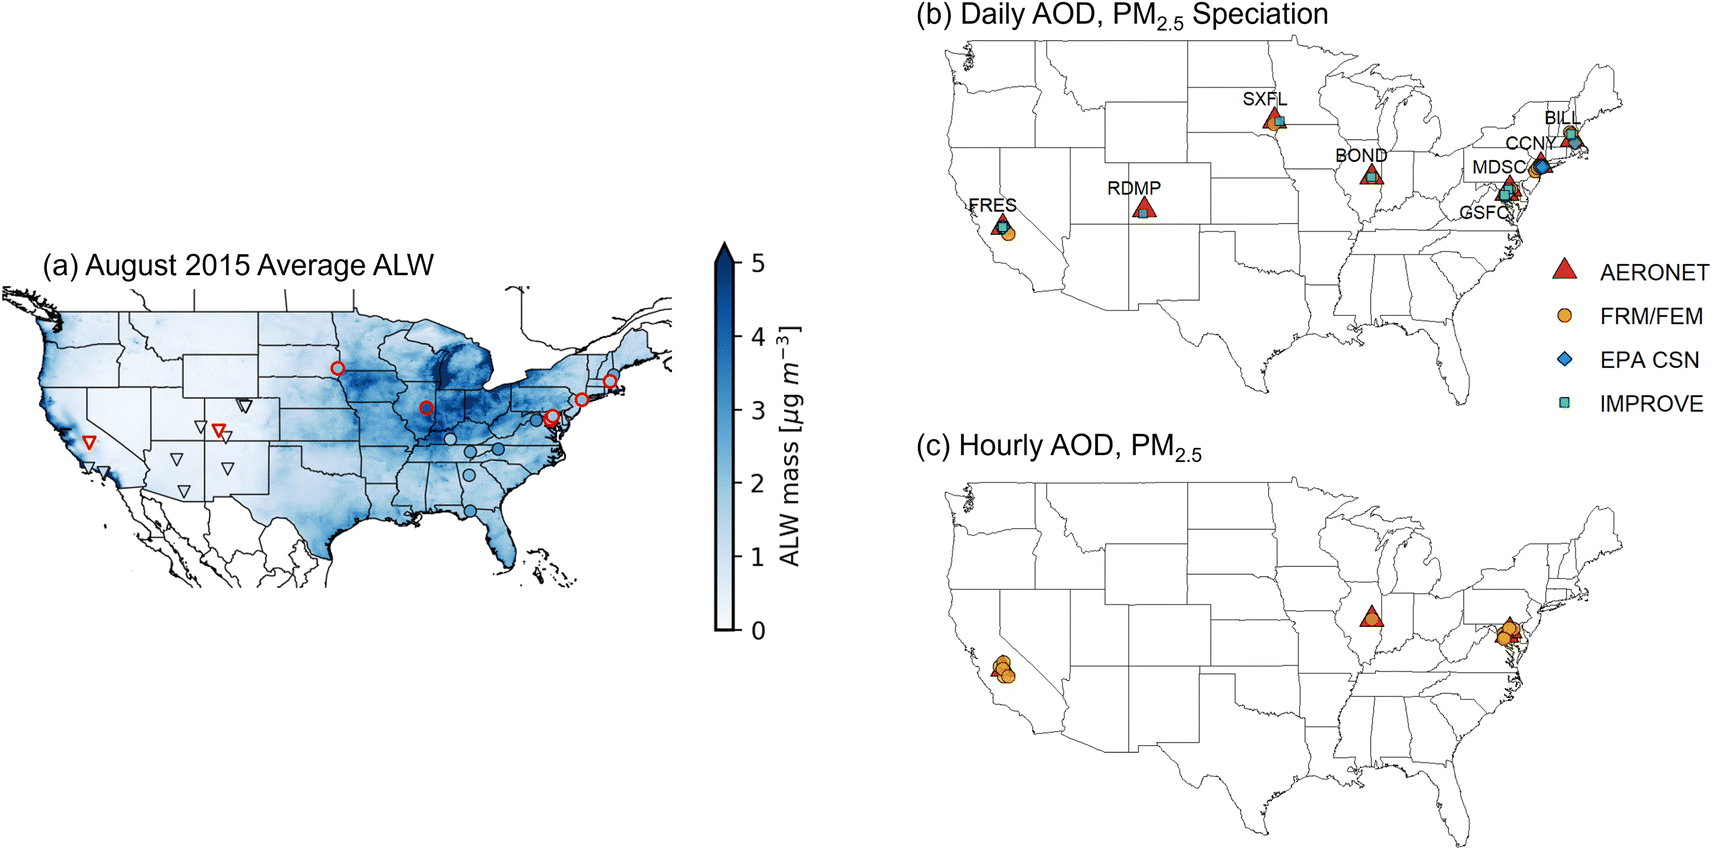 | ||
| Fig. 1 (a) Surface monitoring locations and average aerosol liquid water (ALW) mass concentrations simulated by the regional air quality model CMAQ for August 2015 paired in time with observational estimates. Triangles indicate sites in the “arid” region and circles indicate “humid” sites. Black markers indicate AERONET stations used for η comparisons with CMAQ in 2 simulations. Red triangles indicate AERONET stations matched with PM2.5 mass and chemical composition monitors analyzed from 2006 to 2015 for (b) daily ambient PM2.5 measurements from the IMPROVE Network (green squares), EPA's CSN (blue diamonds), Federal Reference Method (FRM), and Federal Equivalence Method (FEM) monitors (orange circles; Table S1†), and (c) hourly measurements. | ||
This date range encompasses declining PM2.5 mass concentrations.40,42Fig. 1a denotes 8 AERONET locations paired with long-term PM2.5 chemical speciation measurements within 50 kilometers in red outlines. All other sites outlined in black are studied in August 2015 and January 2016 only, and compared with CMAQ as discussed below. The 8 AERONET sites studied from 2006 to 2015 are depicted in Fig. 1b and c with their respective paired PM2.5 mass concentration monitoring stations. We use all available surface air quality measurements for these 8 locations from January 2006 to December 2015 from AERONET,53 IMPROVE,5 and CSN4,6 public archives. Selected sites are chosen so that all network data records have at least 85% completeness for paired measurement days during the study period and represent areas with different physical and chemical climatology. We assume consistent surface and aloft aerosol during a given measurement for the matched stations. This assumption is a limitation that adds uncertainty. We employ AERONET surface-based estimates of columnar AOD at 440 nm in the Level 2.0 quality data product with 15 minutes (or finer) time resolution as this wavelength has the greatest data completeness at all sites.54 AERONET measurements are aggregated to temporally match available hourly and daily PM2.5 mass concentrations and chemical speciation measurements. IMPROVE and CSN report surface, filter-based PM2.5 mass concentrations of sulfate, nitrate, organic carbon (OC), and other species as 24 h integrated samples measured once every 3 or 6 days. We use meteorological categories for seasonal analysis and define winter as December, January, February; spring as March, April, May; summer as June, July, August; and fall as September, October, November.
At IMPROVE and CSN locations, we estimate mass concentrations of ALW using the inorganic thermodynamic equilibrium model ISORROPIAv2.1 in the reverse, open-system direction.55 The method is described in detail elsewhere;30 briefly, we assume metastable particles and inorganic chemical species are fully water-soluble. We employ hourly average values of surface temperature, dew point temperature, and planetary boundary layer (PBL) height at monitor locations from the European Centre for Medium range Weather Forecasting (ECMWF) ERA5 reanalysis product.56 We use daily averages of both surface and dew point temperatures to calculate ambient surface RH as in Huang (2018).57 We calculate ALW for ambient conditions and remove data points when RH values exceed 95%, which excludes less than 1% of all measurement days. Nitrate is a dominant, hygroscopic, and semi-volatile PM2.5 constituent in the western U.S. well documented to exhibit negative sampling artifacts in Federal Reference Method (FRM) and Federal Equivalence Method (FEM) PM2.5 monitors.23,58 We estimate nitrate volatilization from PM2.5 filters with relevant chemical equilibrium reactions that describe partitioning between the gas and condensed phase, accounting for the deliquescence relative humidity (DRH, 62% at 25 °C).59 Application of a similar approach to filter measurements in southern California was shown to describe nitrate losses from Teflon filters well.23 We add the estimated loss to PM2.5 and the nitrate values in ALW calculations. Chemical composition data is only available for 24 h integrated samples. Six of the eight CSN locations measure the ammonium ion. We estimate ALW with and without ammonium as a sensitivity at these locations, finding the inclusion of ammonium reduces predicted ALW mass concentrations by 9%. Overall interpretation of decadal trends do not change (Fig. S1†). As the IMPROVE network does not report ammonium concentrations, ALW mass concentrations reported here are calculated excluding ammonium for consistency of analysis across networks.
We use a mass balance method to calculate organic mass (OM) from total OC mass with site- and season-specific OM![[thin space (1/6-em)]](https://www.rsc.org/images/entities/char_2009.gif) :OC ratios.60–62 OM:OC ratios are calculated for every paired measurement day with available OC data, then averaged by season per site and applied to organic matter (OM) and organic ALW calculations. Some sites did not begin measuring OC until partway through the time period studied, preventing holistic analysis of the organic contribution to ALW and total PM2.5 mass. We assess differences in peak and average mass concentrations at four individual sites where OC is available for the entire study period separately (Fig. S2†). ALW due to organic constituents is estimated at IMPROVE locations in a sensitivity analysis using a lower bound hygroscopicity parameter (κ) of 0.05 to represent urban, anthropogenic aerosol and an upper bound κ of 0.3 to represent rural, biogenic aerosol. We find organic ALW contributes, on average, 1–9% of the total PM2.5 mass (Fig. S3†). For consistency of analysis across networks, the lack of OC data at some sites, and the relatively small contribution to overall PM2.5 mass, organic ALW is not included in this analysis.
:OC ratios.60–62 OM:OC ratios are calculated for every paired measurement day with available OC data, then averaged by season per site and applied to organic matter (OM) and organic ALW calculations. Some sites did not begin measuring OC until partway through the time period studied, preventing holistic analysis of the organic contribution to ALW and total PM2.5 mass. We assess differences in peak and average mass concentrations at four individual sites where OC is available for the entire study period separately (Fig. S2†). ALW due to organic constituents is estimated at IMPROVE locations in a sensitivity analysis using a lower bound hygroscopicity parameter (κ) of 0.05 to represent urban, anthropogenic aerosol and an upper bound κ of 0.3 to represent rural, biogenic aerosol. We find organic ALW contributes, on average, 1–9% of the total PM2.5 mass (Fig. S3†). For consistency of analysis across networks, the lack of OC data at some sites, and the relatively small contribution to overall PM2.5 mass, organic ALW is not included in this analysis.
We calculate the ratio of PM2.5-to-AOD (η) at 440 nm at AERONET sites with the network reported PM2.5 mass concentrations and with PM2.5 adjusted for losses calculated individually for nitrate and ALW for each valid measurement pair (i.e., AOD and PM2.5 mass) from 2006 to 2015. We calculate Pearson correlations (ρP) among measured values of PM2.5 mass concentrations, sulfate, nitrate, AOD, and estimates of PBL height in and from 2006 to 2015 for locations in the humid and arid regions independently. We also examine the annual “hit rate” of extreme events for PM2.5 mass and AOD at each location. As described by Jin et al. (2020), a hit rate is defined as the number of hits (days with peak PM2.5 and peak AOD) divided by the sum of hits and misses (days with only peak AOD).39 We compute an annual hit rate (θ) at each location to determine the co-occurrence of extreme AOD and PM2.5 mass concentration events for paired measurements:
 | (3) |
We evaluate the Community Multiscale Air Quality (CMAQ, version 5.3.3)63 model's representation of η compared to surface measurements during a representative summer and winter month. CMAQ simulations for the CONUS employ a 12 km × 12 km horizontal grid resolution using meteorological inputs from the Weather Research and Forecasting model (WRFv4.1.1). Anthropogenic and biogenic emissions are based on the EPA's Air Quality Time Series (EQUATES).64 In our simulation, we represent gas-phase chemistry with the Carbon Bond (version 6.3) mechanism, and the particle microphysics with the aero7 submodel.65 We perform four simulations representative for summer and winter, each for two months, employing year-specific emissions and average meteorology. For summer, we simulate July to August in 2005 and 2015, and for winter, December to January in 2005 to 2006 and 2015 to 2016, where July and December are regarded as spin up periods, respectively, and are not included in the analyses presented here. August is used to describe a representative summer month and January a representative winter month. CMAQ-derived η is calculated for each day and hour of the month matched to surface sampling days in space and time. The version of CMAQ utilized does not account for nitrate losses in the PM2.5 mass concentrations, and the paired surface observations similarly only utilize the network-reported PM2.5 mass concentrations for this analysis. We use all available data from all sites and present monthly averages. We compare CMAQ-simulated AOD available at 550 nm with AERONET AOD at 440 nm. Lower AOD values are expected at 550 nm than 440 nm due to the spectral dependence of AOD.54 Four of the AERONET stations (Fresno (FRES), Bondville (BOND), Goddard Space Flight Center (GSFC), Maryland Science Center (MDSC)) have nearby stations that measure hourly PM2.5 mass concentrations in August 2015 and January 2016 (Fig. 1c), which we compare to diurnal patterns during daylight hours in CMAQ model simulations. All data processing and significance tests are conducted with R statistical software66 and relevant data are available at the related repository.67
3 Results and discussion
3.1 Temporal and spatial analysis
All estimates of η calculated with reported or adjusted PM2.5 mass concentrations exhibit the same seasonal pattern at both humid and arid locations from 2006 to 2015, despite contrasting patterns in PM2.5 and AOD (Fig. 2). η peaks in winter and is lowest in the summer. PM2.5 mass concentrations are highest at locations in the western arid region and peak in the winter, up to a factor of 4 times greater than summertime values. At sites in the humid eastern U.S., PM2.5 mass peaks in the summer and seasonal differences are considerably less. Conversely, AOD is highest at humid locations, with pronounced seasonality (factor of 3) not observed at western sites. | ||
| Fig. 2 Time series of (a) monitor-reported PM2.5 mass concentrations (lower line) with nitrate corrections applied (shaded region) (b) aerosol optical depth (AOD, 440 nm), (c) η calculated using reported PM2.5 mass, (d) nitrate mass concentrations (lower line) with nitrate corrections applied (shaded region), (e) aerosol liquid water (ALW) mass concentrations, and (f) ηadj calculated with ALW and nitrate corrections applied to reported PM2.5 mass for the 8 AERONET locations in the humid (dark blue) and arid (dark gold) regions studied from 2006 to 2015. | ||
At the arid sites, the wintertime peak in η is driven by greater PM2.5 mass concentrations and lower AOD. At the humid locations, the wintertime peak in η is driven primarily by lower AOD.
ALW and nitrate are plausible contributors to the spatial and temporal patterns in η. AOD observational techniques observe ambient aerosol unperturbed, while PM2.5 surface monitors exhibit negative sampling artifacts for nitrate, organic species, and largely remove ALW.21,24 In the eastern U.S., non-volatile sulfate mass peaks during summer and plays a predominant role in aerosol physicochemical properties, in particular water uptake. The seasonality in AOD and ALW mass concentrations at humid locations is similar. Further, PM2.5 mass concentrations and AOD decline at eastern surface sites over the time period, consistent with previously noted observations (Fig. S4†).40,43–46 Western arid sites do not exhibit a decline in sulfate, ALW, or AOD from 2006 to 2015. Nitrate contributes substantially to particle mass and hygroscopicity in the western U.S., especially during winter when thermodynamics favor the condensed phase. Consistency among η estimates for the humid and arid locations is noted with these adjustments applied, most notably in wintertime peak values (Fig. 2c and f). When adjusting η (Fig. 3), calculations for the humid sites change the most substantially to better match the η distribution at arid locations. Accounting for ALW, Nguyen et al. (2016) could better reconcile surface PM2.5 collected on filters with remotely sensed AOD,38 similar to findings here where the addition of ALW to PM2.5 mass concentrations improves correlation with surface AOD (Fig. S5†).
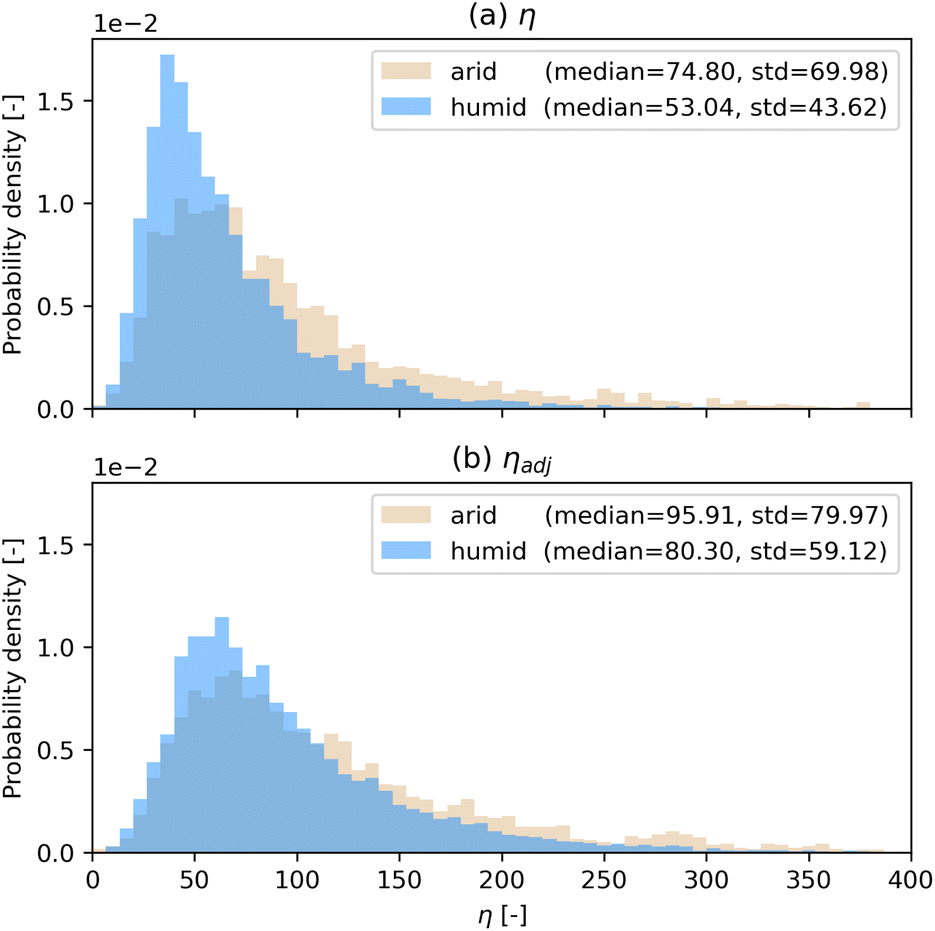 | ||
| Fig. 3 Histograms representing the distribution of (a) η calculated using reported PM2.5 mass and (b) ηadj calculated with ALW and nitrate corrections applied to reported PM2.5 mass for the 8 AERONET locations in the humid (blue) and arid (gold) regions studied from 2006 to 2015. | ||
At sites in the eastern humid U.S., average AOD values and surface mass concentrations of PM2.5, nitrate, sulfate, and ALW estimates significantly decline. Only nitrate mass significantly declines at arid western sites (Table S2†). Estimated ALW mass concentrations, and how they differ for arid versus humid locations seasonally and over the studied decade, is consistent with the observed trends in AOD. Liquid water is a plausible contributor to these trends.
Particle chemical composition varies at the humid and arid sites to affect the amount of ALW, which influences particle size and subsequently AOD. At the arid locations, AOD correlates positively with nitrate, sulfate, and PM2.5 mass concentrations in 2006. In 2015, all species exhibit weaker but positive correlation with AOD (Fig. 4). At the humid locations, positive correlations between AOD with sulfate and PM2.5 also decline from 2006 to 2015 (Movie S1†).
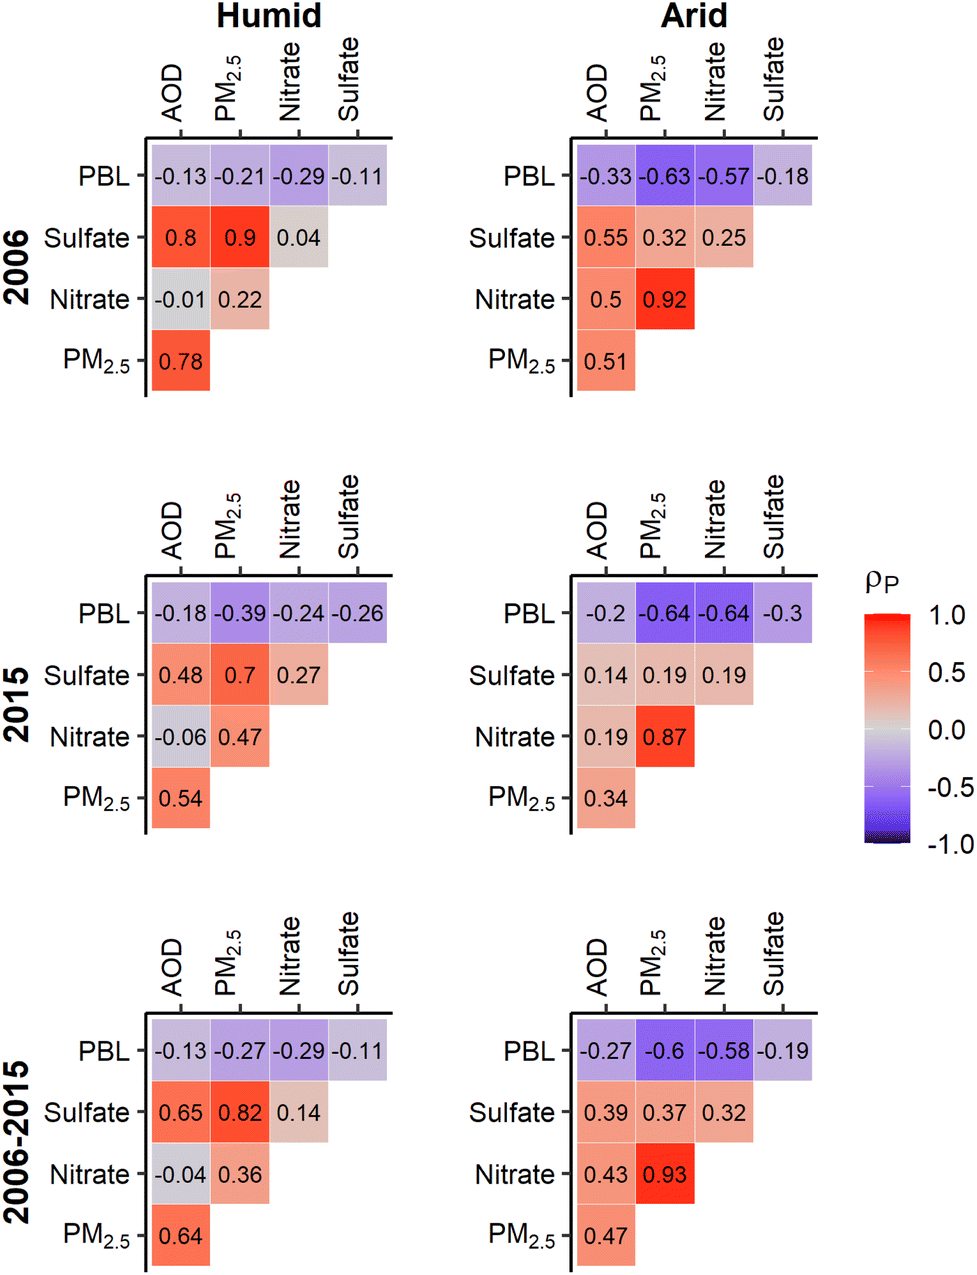 | ||
| Fig. 4 Pearson (ρP) correlations for aerosol optical depth (AOD) at 440 nm, planetary boundary layer (PBL) height, PM2.5, nitrate, and sulfate mass concentrations for sites in the (left) humid and (right) arid regions in (top) 2006, (center) 2015, and (bottom) interannually from 2006 to 2015. Red and positive numbers indicate positive correlation, blue and negative numbers anti-correlation, and gray little to no correlation between two variables. From 2006 to 2015 for the 6 humid locations N = 25211 days, and for the 2 arid sites N = 4858 days. | ||
Nitrate is slightly anti-correlated with AOD in both years and across the decade. Negative correlation for all variables with PBL height is noted across all analyzed sites. PBL height is greatest in summer and lowest in winter across the CONUS (Fig. S4†). The western sites demonstrate greater variability in and stronger anti-correlation of all variables to PBL height relative to locations in the eastern U.S. These spatial and seasonal trends over the decade in the fractional contribution of aerosol chemical constituents at eastern sites is consistent with earlier findings regarding trends in sulfate mass, haze, and visibility, optical indicators of ambient particulate matter burden similar to AOD detection, with changing optical properties detected with AOD measurements.68,69
Mean mass concentrations of ALW, nitrate, and sulfate are higher on peak (extreme PM2.5 mass and extreme AOD) days at humid and arid locations alike (Fig. 5). Comparison of average and peak day PM2.5 chemical composition for each site illustrates the impact of semi-volatile species and their detection in situ with satellites versus regulatory filters. Over the studied decade, PM2.5 mass and chemical composition are relatively similar for average days at individual sampling sites. Peak day concentrations decline by 50% or greater at sites in the humid region. On peak days when PM2.5 mass concentrations and AOD are elevated, the fractional contributions of ALW and sulfate are larger. For the two arid sites, average and peak day chemical composition mass is nearly identical in both 2006 and 2015 for the Red Mountain Pass (RDMP) and Fresno (FRES) locations. The contribution of nitrate is greater for the Fresno site compared to all other sites. At the four locations where OC is measured throughout the decade, contributions from OM are similar on average days in 2006 and 2015, but peak day fractional contribution of OM increases at all sites, with the exception of the Bondville (BOND) site (Fig. S2†). The precise sampling artifacts of filter-collected OC are difficult to quantify and may contribute to variation in PM2.5-to-AOD (η) values.
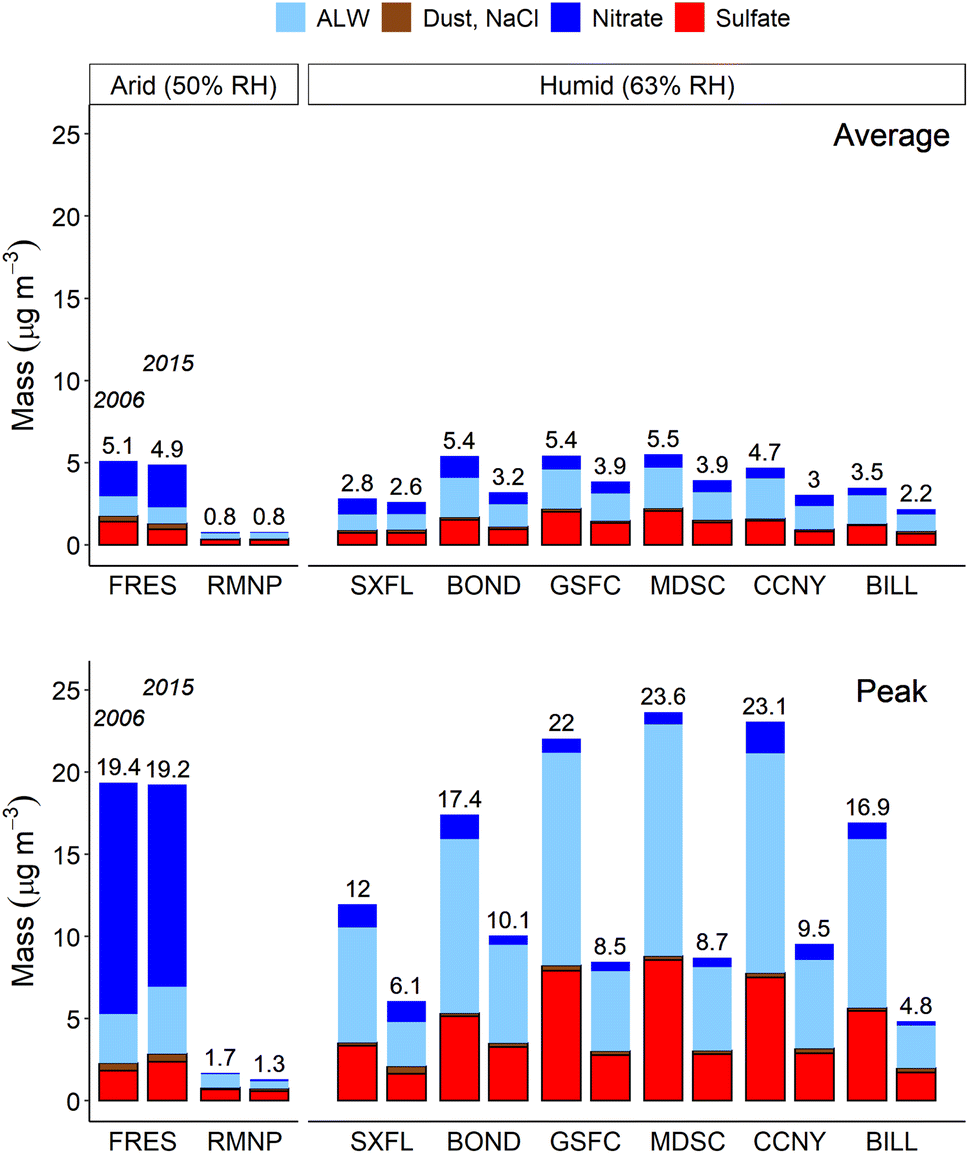 | ||
| Fig. 5 Sum of measured species that contribute to PM2.5 chemical composition consisting of non-volatile species (sulfate, dust (calcium, magnesium, potassium), NaCl) and semi-volatile species (nitrate, aerosol liquid water (ALW)) on average (top) and peak days (bottom, where AOD and PM2.5 are both above their locally determined 75th percentile) for the 8 AERONET stations analyzed in 2006 (left bars) and 2015 (right bars). | ||
Collectively and individually, all humid locations exhibit a significant decline in annual hit rate (θ) from 2006 to 2015, while the arid locations do not (Fig. 6). The decrease in co-occurrence of extreme reported and adjusted PM2.5 mass concentrations and AOD values suggests diminishing ability of satellite AOD to estimate peak values of near-surface PM2.5 at eastern locations.39 Addition of ALW and nitrate to daily PM2.5 mass concentrations at BOND renders the change statistically insignificant. For the arid west locations, peak AOD and surface PM2.5 mass concentrations co-occur at similar rates from 2006 to 2015, with no significant change in annual hit rate with or without ALW and nitrate adjustments. The sites with significantly decreasing θ had hit rates of about 70% co-occurrence of peak AOD and PM2.5 events in 2006 and declined to approximately 38% co-occurrence or less in 2015. Additionally, sites with declining hit rates had fewer days with elevated PM2.5 mass concentrations later in the decade compared to earlier in the decade. The number of peak AOD days varied less. Aloft aerosol is becoming more prevalent due to wildfires and contributes to AOD and surface PM2.5 differently,70–73 consistent with declining hit rates in the east.
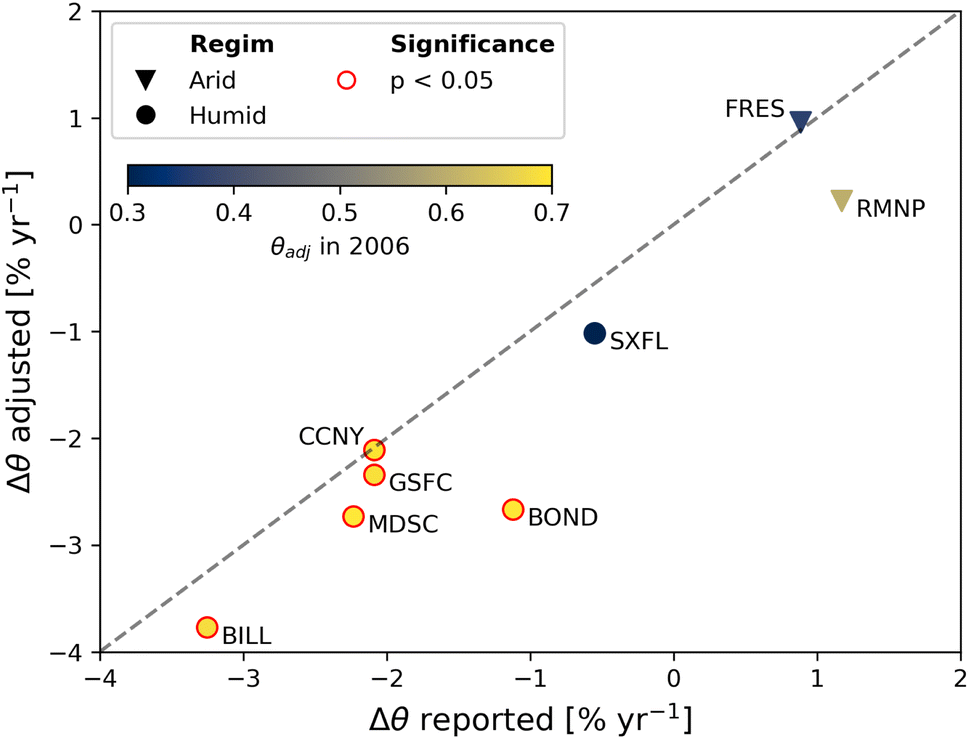 | ||
| Fig. 6 Annual rate of change in hit rates (θ) for peak values of PM2.5 mass concentrations and AOD for the 8 AERONET stations analyzed from 2006 to 2015 with reported PM2.5 mass concentrations (θ reported) and aerosol liquid water and nitrate adjustments (θ adjusted). As reference, the θadj in 2006 is indicated by color. Triangles represent “arid” regions and circles indicate “humid” regions. A red outline indicates statistical significance (p < 0.05). | ||
3.2 Comparison of observations with CMAQ
Spatial and seasonal patterns in CMAQ-simulated and AERONET-observed η are identified in the summer and winter simulations (Fig. 7). In both the observations and CMAQ predictions, η peaks in winter and is lowest in the summer across the CONUS, similar to the seasonal patterns in Fig. 2. Localized peaks in η in January at surface network sites in the California Central Valley and the Colorado Plateau near Denver are also present in the CMAQ prediction. Table S3† provides performance metrics for CMAQ indicating that particularly in winter, CMAQ predicts η well, both in 2006 and 2016. CMAQ's replication of localized and regional patterns in surface observations in summer and winter simulations and decadal changes highlight that this regulatory model is a reliable source, when either satellite AOD retrievals or PM2.5 monitors are scarce.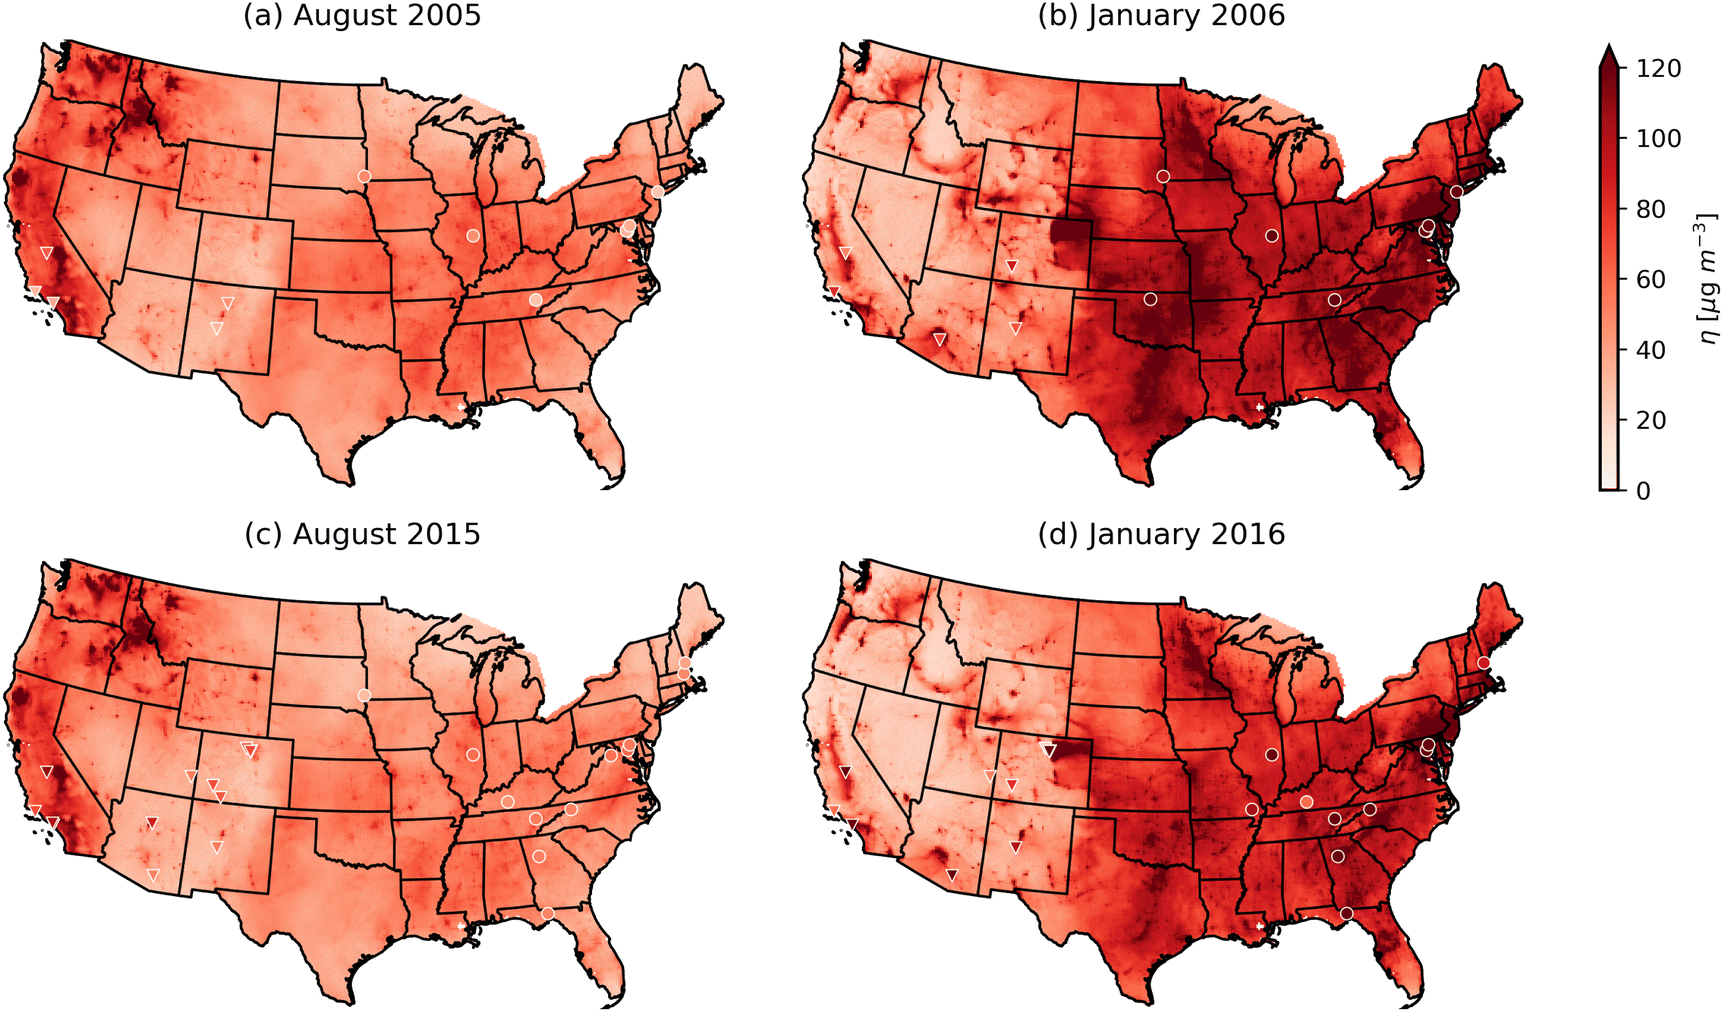 | ||
| Fig. 7 Every third day monthly averaged eta (η) simulated by CMAQ with monthly averaged surface network observations (obtained every third day) overlaid in white outlined triangles (“arid” region) and circles (“humid” region) across the CONUS for (a) August 2005, (b) January 2006, (c) August 2015, and (d) January 2016. | ||
Diurnal patterns in simulated and observed η are similar at all sites (see Fig. 8 and S7†), with the largest differences occurring at humid locations during the summer in the morning (Fig. 8). CMAQ predictions of η are offset higher relative to observations, consistent with the utilization of a smaller wavelength used for AOD in CMAQ versus AERONET due to the spectral dependence of AOD.54 Observed and modeled η peaks at or before local 9:00 a.m. in both seasons at all locations, prior to Aqua and Terra pass over times. The greatest differences between measured and modeled hourly η values occur for the sites with larger ALW mass concentrations (MDSC, GSFC, BOND; Fig. S6†). Summertime differences in η are minima near midday. ALW mass concentrations during SOAS were highest from 8:00 to 9:00 a.m. and lowest during midday,74 similar to trends in the differences between CMAQ-simulated and surface estimated η at humid locations. In the winter when ALW mass concentrations are low for all sites, differences between the model and observations throughout the day are small.
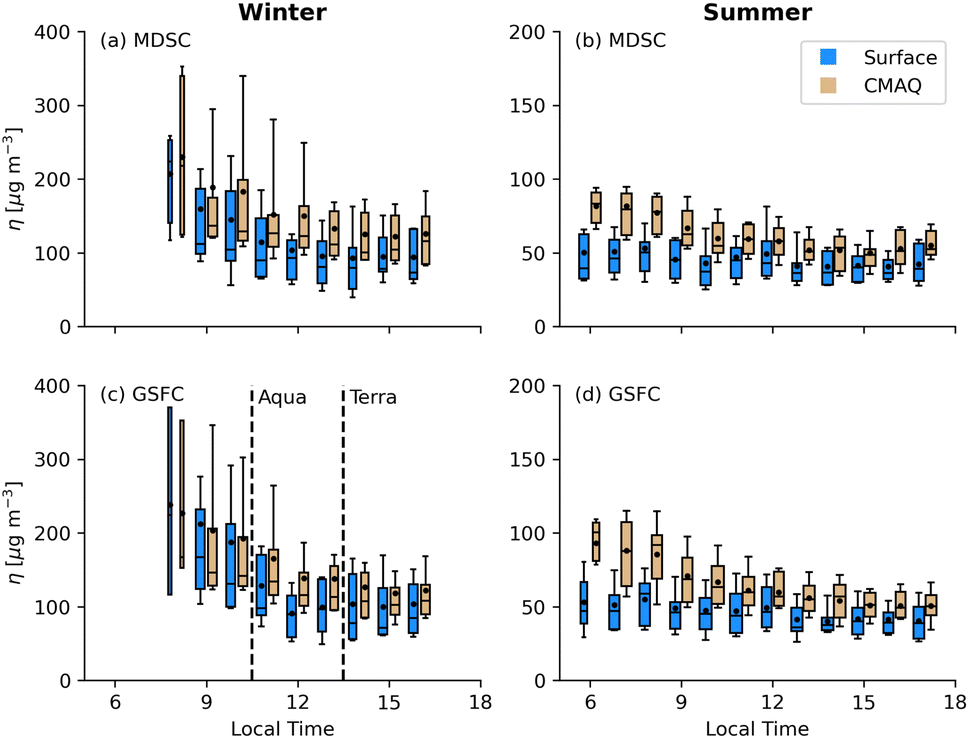 | ||
| Fig. 8 Diurnal distributions of eta (η) for January 2016 (“Winter” column) and August 2015 (“Summer” column) of surface-based hourly PM2.5 mass concentrations and AERONET AOD at 440 nm (blue boxes, points) and CMAQ model predictions using AOD at 550 nm (brown boxes, points) for MDSC (a) and (b) and GSFC (c) and (d). Points indicate the mean. Boxes represent the 25th to 75th percentile with the center horizontal line as the median and whiskers as the 10th and 90th percentile. The box width is proportional to the number of data pairs in each individual comparison set relative to the entire data set. Note the winter and summer y-axis scales differ. Vertical dashed lines in (c) indicate nominal overpass times for MODIS onboard the Aqua (10:30 a.m.) and Terra (1:30 p.m.) satellites. | ||
4 Conclusions
Chemical composition of semi-volatile species not well-characterized in reported PM2.5 mass measurements is a plausible contributing explanation for spatial, diurnal, seasonal and decadal patterns in the PM2.5-to-AOD relationship at multiple locations across the CONUS from 2006 to 2015. ALW and nitrate are semi-volatile PM2.5 constituents for which we can estimate losses. Accounting for their negative mass artifacts in PM2.5 surface mass improves agreement in median and peak η values across arid and humid surface-based sampling locations. Patterns in the associations among AOD and hygroscopic PM2.5 constituents that differ in space and time are consistent with particle hygroscopicity and water uptake exhibiting a determining impact on AOD. There are other semi-volatile species known to influence AOD, such as organic PM2.5 constituents, but their sampling biases are difficult to quantitatively describe. EPA's chief air quality modeling tool, CMAQ, replicates average summertime and wintertime surface-based geospatial patterns in observed η in the winter and summer across the CONUS. The co-occurrence of peak AOD and PM2.5 events decline at humid sampling locations, but not arid. Chemical composition during peak events, most notably for sulfate and ALW, declined substantially from 2006 to 2015 in those locations, but not at western arid sites. Specific accounting of semi-volatile species can be useful to reconcile PM2.5 measurements across sampling platforms.Author contributions
A. G. Carlton, M. M. Flesch, and S. Rosanka were responsible for the conceptualisation of this study. M. M. Flesch and S. Rosanka performed the primary analysis. S. Rosanka performed all CMAQ simulations. Y. T. Chiu completed nitrate correction calculations for monitor-reported PM2.5 mass concentrations. M. M. Flesch and A. G. Carlton drafted the first version of this manuscript with contributions by all co-authors. S. Rosanka and A. G. Carlton performed all revisions of this work.Conflicts of interest
There are no conflicts to declare.Acknowledgements
This work was funded, in part, by grants from NASA #80NSSC19K0987 and NSF-AGS 2024170.Notes and references
- C. A. Pope and D. W. Dockery, J. Air Waste Manage. Assoc., 2006, 56, 709–742 CrossRef CAS PubMed.
- Y. Wang, S. Xiao, Y. Zhang, H. Chang, R. V. Martin, A. Van Donkelaar, A. Gaskins, Y. Liu, P. Liu and L. Shi, Environ. Int., 2022, 158, 106969 CrossRef CAS PubMed.
- P. Thangavel, D. Park and Y.-C. Lee, Int. J. Environ. Res. Public Health, 2022, 19, 7511 CrossRef CAS PubMed.
- US EPA, Chemical Speciation Network Measurements, 2022, https://www.epa.gov/amtic/chemical-speciation-network-measurements, accessed 2022-11-15 Search PubMed.
- IMPROVE Network, Federal Land Manager Environmental Database, 2022, http://vista.cira.colostate.edu/Improve/, accessed 2022-11-15 Search PubMed.
- US EPA, Quality Assurance Requirements for Monitors Used in Evaluations of National Ambient Air Quality Standards. 40 CFR, Part 58, Federal Code of Regulations, 2017, https://www3.epa.gov/ttnamti1/files/ambient/pm25/qa/m212.pdf Search PubMed.
- W. C. Malm, J. F. Sisler, D. Huffman, R. A. Eldred and T. A. Cahill, J. Geophys. Res.: Atmos., 1994, 99, 1347–1370 CrossRef CAS.
- A. M. Burns, G. Chandler, K. J. Dunham and A. G. Carlton, Environ. Sci. Technol., 2023, 57, 20718–20725 CrossRef CAS PubMed.
- A. van Donkelaar, R. V. Martin, M. Brauer and B. L. Boys, Environ. Health Perspect., 2015, 123, 135–143 CrossRef PubMed.
- S. E. Alexeeff, J. Schwartz, I. Kloog, A. Chudnovsky, P. Koutrakis and B. A. Coull, J. Exposure Sci. Environ. Epidemiol., 2015, 25, 138–144 CrossRef CAS PubMed.
- P. Masselot, F. Sera, R. Schneider, H. Kan, E. Lavigne, M. Stafoggia, A. Tobias, H. Chen, R. T. Burnett, J. Schwartz, A. Zanobetti, M. L. Bell, B.-Y. Chen, Y.-L. L. Guo, M. S. Ragettli, A. M. Vicedo-Cabrera, C. Åström, B. Forsberg, C. Íñiguez, R. M. Garland, N. Scovronick, J. Madureira, B. Nunes, C. De la Cruz Valencia, M. Hurtado Diaz, Y. Honda, M. Hashizume, C. F. C. Ng, E. Samoli, K. Katsouyanni, A. Schneider, S. Breitner, N. R. I. Ryti, J. J. K. Jaakkola, M. Maasikmets, H. Orru, Y. Guo, N. Valdés Ortega, P. Matus Correa, S. Tong and A. Gasparrini, Epidemiology, 2022, 33, 167 CrossRef PubMed.
- L. A. McGuinn, C. K. Ward-Caviness, L. M. Neas, A. Schneider, D. Diaz-Sanchez, W. E. Cascio, W. E. Kraus, E. Hauser, E. Dowdy, C. Haynes, A. Chudnovsky, P. Koutrakis and R. B. Devlin, Environ. Res., 2016, 145, 9–17 CrossRef CAS PubMed.
- R. Schneider, A. M. Vicedo-Cabrera, F. Sera, P. Masselot, M. Stafoggia, K. de Hoogh, I. Kloog, S. Reis, M. Vieno and A. Gasparrini, Remote Sens., 2020, 12, 3803 CrossRef PubMed.
- M. Sorek-Hamer, A. C. Just and I. Kloog, Curr. Opin. Pediatr., 2016, 28, 228–234 CrossRef PubMed.
- I. G. Eibedingil, T. E. Gill, R. S. Van Pelt and D. Q. Tong, Remote Sens., 2021, 13, 2316 CrossRef.
- H. Zhang, R. M. Hoff and J. A. Engel-Cox, J. Air Waste Manage. Assoc., 2009, 59, 1358–1369 CrossRef PubMed.
- R. B. Schlesinger, Inhalation Toxicol., 2007, 19, 811–832 CrossRef CAS PubMed.
- J. Toro-Heredia, H. Jirau-Colón and B. D. Jiménez-Vélez, Environ. Challenges, 2021, 5, 100350 CrossRef.
- T. Fang, H. Guo, L. Zeng, V. Verma, A. Nenes and R. J. Weber, Environ. Sci. Technol., 2017, 51, 2611–2620 CrossRef CAS PubMed.
- M. L. Bell, F. Dominici, K. Ebisu, S. L. Zeger and J. M. Samet, Environ. Health Perspect., 2007, 115, 989–995 CrossRef CAS PubMed.
- J. E. Babila, A. G. Carlton, C. J. Hennigan and V. P. Ghate, Atmosphere, 2020, 11, 194 CrossRef CAS.
- A. E. Christiansen, A. G. Carlton and B. H. Henderson, Atmospheric Chemistry and Physics Discussions, 2020, 1–26 Search PubMed.
- J. C. Chow, J. G. Watson, D. H. Lowenthal and K. L. Magliano, J. Air Waste Manage. Assoc., 2005, 55, 1158–1168 CrossRef CAS PubMed.
- B. J. Turpin, P. Saxena and E. Andrews, Atmos. Environ., 2000, 34, 2983–3013 CrossRef CAS.
- L. A. Remer, S. Mattoo, R. C. Levy and L. A. Munchak, Atmos. Meas. Tech., 2013, 6, 1829–1844 CrossRef.
- R. C. Levy, S. Mattoo, L. A. Munchak, L. A. Remer, A. M. Sayer, F. Patadia and N. C. Hsu, Atmos. Meas. Tech., 2013, 6, 2989–3034 CrossRef.
- B. Gantt, R. C. Owen and N. Watkins, Environ. Sci. Technol., 2021, 55, 2831–2838 CrossRef CAS PubMed.
- Z. Eskandari, H. Maleki, A. Neisi, A. Riahi, V. Hamid and G. Goudarzi, J. Environ. Health Sci. Eng., 2020, 18, 723–731 CrossRef PubMed.
- T. K. V. Nguyen, M. D. Petters, S. R. Suda, H. Guo, R. J. Weber and A. G. Carlton, Atmos. Chem. Phys., 2014, 14, 10911–10930 CrossRef.
- M. M. Flesch, A. E. Christiansen, A. M. Burns, V. P. Ghate and A. G. Carlton, ACS Earth Space Chem., 2022, 6, 2910–2918 CrossRef CAS PubMed.
- A. G. Carlton and B. J. Turpin, Atmos. Chem. Phys., 2013, 13, 10203–10214 CrossRef.
- S. Li, M. J. Garay, L. Chen, E. Rees and Y. Liu, J. Geophys. Res.: Atmos., 2013, 118, 11228–11241 Search PubMed.
- T. K. V. Nguyen, Q. Zhang, J. L. Jimenez, M. Pike and A. G. Carlton, Environ. Sci. Technol. Lett., 2016, 3, 257–263 CrossRef CAS.
- J. A. Engel-Cox, C. H. Holloman, B. W. Coutant and R. M. Hoff, Atmos. Environ., 2004, 38, 2495–2509 CrossRef CAS.
- J. Li, B. E. Carlson and A. A. Lacis, Atmos. Environ., 2015, 102, 260–273 CrossRef CAS.
- J. D. Stowell, J. Bi, M. Z. Al-Hamdan, H. J. Lee, S.-M. Lee, F. Freedman, P. L. Kinney and Y. Liu, Environ. Res. Lett., 2020, 15, 094004 CrossRef CAS.
- A. van Donkelaar, R. V. Martin and R. J. Park, J. Geophys. Res.: Atmos., 2006, 111, 1–10 CrossRef.
- T. K. V. Nguyen, V. P. Ghate and A. G. Carlton, Geophys. Res. Lett., 2016, 43, 11903–11912 CrossRef.
- Q. Jin, P. Crippa and S. C. Pryor, Atmos. Environ., 2020, 239, 117718 CrossRef CAS.
- J. L. Hand, B. A. Schichtel, W. C. Malm and M. L. Pitchford, Atmos. Chem. Phys., 2012, 12, 10353–10365 CrossRef CAS.
- W. Aas, A. Mortier, V. Bowersox, R. Cherian, G. Faluvegi, H. Fagerli, J. Hand, Z. Klimont, C. Galy-Lacaux, C. M. B. Lehmann, C. L. Myhre, G. Myhre, D. Olivié, K. Sato, J. Quaas, P. S. P. Rao, M. Schulz, D. Shindell, R. B. Skeie, A. Stein, T. Takemura, S. Tsyro, R. Vet and X. Xu, Sci. Rep., 2019, 9, 953 CrossRef PubMed.
- G. M. Hidy and C. Blanchard, Elementa, 2016, 4, 000138 Search PubMed.
- A. R. Attwood, R. A. Washenfelder, C. A. Brock, W. Hu, K. Baumann, P. Campuzano-Jost, D. A. Day, E. S. Edgerton, D. M. Murphy, B. B. Palm, A. McComiskey, N. L. Wagner, S. S. de Sá, A. Ortega, S. T. Martin, J. L. Jimenez and S. S. Brown, Geophys. Res. Lett., 2014, 41, 7701–7709 CrossRef.
- A. E. Christiansen, V. P. Ghate and A. G. Carlton, ACS Earth Space Chem., 2019, 3, 403–412 CrossRef CAS.
- C. Li, R. V. Martin, B. L. Boys, A. van Donkelaar and S. Ruzzante, Atmos. Chem. Phys., 2016, 16, 2435–2457 CrossRef CAS.
- T. K. V. Nguyen, S. L. Capps and A. G. Carlton, Environ. Sci. Technol., 2015, 49, 7843–7850 CrossRef CAS PubMed.
- D. A. Chu, T.-C. Tsai, J.-P. Chen, S.-C. Chang, Y.-J. Jeng, W.-L. Chiang and N.-H. Lin, Atmos. Environ., 2013, 79, 172–187 CrossRef CAS.
- S. Christopher and P. Gupta, Remote Sens., 2020, 12, 1985 CrossRef.
- M. J. Rood, M. A. Shaw, T. V. Larson and D. S. Covert, Nature, 1989, 337, 537–539 CrossRef CAS.
- B. Ford and C. L. Heald, Atmos. Chem. Phys., 2013, 13, 9269–9283 CrossRef CAS.
- M. H. Bergin, S. E. Schwartz, R. N. Halthore, J. A. Ogren and D. L. Hlavka, J. Geophys. Res.: Atmos., 2000, 105, 6807–6816 CrossRef CAS.
- A. G. Carlton, H. O. T. Pye, K. R. Baker and C. J. Hennigan, Environ. Sci. Technol., 2018, 52, 9254–9265 CrossRef CAS PubMed.
- NASA, AERONET Data Download Tool, 2022, https://aeronet.gsfc.nasa.gov/cgi-bin/webtool_aod_v3, accessed 2022-11-01 Search PubMed.
- D. M. Giles, A. Sinyuk, M. G. Sorokin, J. S. Schafer, A. Smirnov, I. Slutsker, T. F. Eck, B. N. Holben, J. R. Lewis, J. R. Campbell, E. J. Welton, S. V. Korkin and A. I. Lyapustin, Atmos. Meas. Tech., 2019, 12, 169–209 CrossRef CAS.
- C. Fountoukis and A. Nenes, Atmos. Chem. Phys., 2007, 7, 4639–4659 CrossRef CAS.
- H. Hersbach, B. Bell, P. Berrisford, S. Hirahara, A. Horányi, J. Muñoz-Sabater, J. Nicolas, C. Peubey, R. Radu, D. Schepers, A. Simmons, C. Soci, S. Abdalla, X. Abellan, G. Balsamo, P. Bechtold, G. Biavati, J. Bidlot, M. Bonavita, G. De Chiara, P. Dahlgren, D. Dee, M. Diamantakis, R. Dragani, J. Flemming, R. Forbes, M. Fuentes, A. Geer, L. Haimberger, S. Healy, R. J. Hogan, E. Hólm, M. Janisková, S. Keeley, P. Laloyaux, P. Lopez, C. Lupu, G. Radnoti, P. de Rosnay, I. Rozum, F. Vamborg, S. Villaume and J.-N. Thépaut, Q. J. R. Metereol. Soc., 2020, 146, 1999–2049 CrossRef.
- J. Huang, Journal of Applied Meteorology and Climatology, 2018, 57, 1265–1272 Search PubMed.
- M. Mozurkewich, Atmos. Environ., Part A, 1993, 27, 261–270 CrossRef.
- Y. T. Chiu and A. G. Carlton, ACS ES&T Air, 2023, 1–10 Search PubMed.
- W. C. Malm, B. A. Schichtel, J. L. Hand and A. J. Prenni, J. Geophys. Res.: Atmos., 2020, 125, e2019JD031480 CrossRef CAS.
- H. Simon, P. V. Bhave, J. L. Swall, N. H. Frank and W. C. Malm, Atmos. Chem. Phys., 2011, 11, 2933–2949 CrossRef CAS.
- A. E. Christiansen, A. G. Carlton and W. C. Porter, Environ. Sci. Technol., 2020, 54, 10524–10532 CrossRef CAS PubMed.
- US EPA, CMAQ v5.3.3, 2020, DOI:10.5281/zenodo.5213949.
- US EPA, EQUATESv1.0: Emissions, WRF/MCIP, CMAQv5.3.2 Data – 2002-2019 US_12km and NHEMI_108km, 2023, DOI:10.15139/S3/F2KJSK.
- D. J. Luecken, G. Yarwood and W. T. Hutzell, Atmos. Environ., 2019, 201, 62–72 CrossRef CAS PubMed.
- R Core Team, R: A Language and Environment for Statistical Computing, 2023, https://www.R-project.org/ Search PubMed.
- M. M. Flesch, S. Rosanka, Y. T. Chiu and A. G. Carlton, Data used in “Chemically specific sampling bias: the ratio of PM2.5 to surface AOD on average and peak days in the U.S.”, 2023, DOI:10.5281/zenodo.10092407.
- J. L. Hand, S. M. Kreidenweis, J. Slusser and G. Scott, Atmos. Environ., 2004, 38, 6813–6821 CrossRef CAS.
- R. A. Washenfelder, A. R. Attwood, C. A. Brock, H. Guo, L. Xu, R. J. Weber, N. L. Ng, H. M. Allen, B. R. Ayres, K. Baumann, R. C. Cohen, D. C. Draper, K. C. Duffey, E. Edgerton, J. L. Fry, W. W. Hu, J. L. Jimenez, B. B. Palm, P. Romer, E. A. Stone, P. J. Wooldridge and S. S. Brown, Geophys. Res. Lett., 2015, 42, 653–664 CrossRef CAS.
- W. S. Hartley, P. V. Hobbs, J. L. Ross, P. B. Russell and J. M. Livingston, J. Geophys. Res.: Atmos., 2000, 105, 9859–9885 CrossRef CAS.
- S. Zhou, S. Collier, D. A. Jaffe, N. L. Briggs, J. Hee, A. J. Sedlacek III, L. Kleinman, T. B. Onasch and Q. Zhang, Atmos. Chem. Phys., 2017, 17, 2477–2493 CrossRef CAS.
- X. Yang, C. Zhao, Y. Yang, X. Yan and H. Fan, Atmos. Chem. Phys., 2021, 21, 3833–3853 CrossRef CAS.
- T. Y. Wilmot, D. V. Mallia, A. G. Hallar and J. C. Lin, Sci. Rep., 2022, 12, 12400 CrossRef CAS PubMed.
- A. G. Carlton, J. de Gouw, J. L. Jimenez, J. L. Ambrose, A. R. Attwood, S. Brown, K. R. Baker, C. Brock, R. C. Cohen, S. Edgerton, C. M. Farkas, D. Farmer, A. H. Goldstein, L. Gratz, A. Guenther, S. Hunt, L. Jaeglé, D. A. Jaffe, J. Mak, C. McClure, A. Nenes, T. K. Nguyen, J. R. Pierce, S. de Sa, N. E. Selin, V. Shah, S. Shaw, P. B. Shepson, S. Song, J. Stutz, J. D. Surratt, B. J. Turpin, C. Warneke, R. A. Washenfelder, P. O. Wennberg and X. Zhou, Bull. Am. Meteorol. Soc., 2018, 99, 547–567 CrossRef.
Footnote |
| † Electronic supplementary information (ESI) available: Monitor locations, methodology text and figures relating to PM2.5, aerosol liquid water, nitrate, and f(RH) calculations, peak and average day PM2.5 chemical composition with organic matter included, time series for the interannual analysis, and differences in hourly model predictions and observational median eta values. See DOI: https://doi.org/10.1039/d3ea00163f |
| This journal is © The Royal Society of Chemistry 2024 |