
 Open Access Article
 This Open Access Article is licensed under a
 Creative Commons Attribution 3.0 Unported Licence
Are the metal identity and stoichiometry of metal complexes important for colchicine site binding and inhibition of tubulin polymerization?†
Iuliana
Besleaga
 a,
Renáta
Raptová
bc,
Alexandru-Constantin
Stoica
d,
Miljan N. M.
Milunovic
*a,
Michal
Zalibera
b,
Ruoli
Bai
e,
Nóra
Igaz
f,
Jóhannes
Reynisson
g,
Mónika
Kiricsi
g,
Éva A.
Enyedy
*hi,
Peter
Rapta
b,
Ernest
Hamel
e and
Vladimir B.
Arion
*ad
a,
Renáta
Raptová
bc,
Alexandru-Constantin
Stoica
d,
Miljan N. M.
Milunovic
*a,
Michal
Zalibera
b,
Ruoli
Bai
e,
Nóra
Igaz
f,
Jóhannes
Reynisson
g,
Mónika
Kiricsi
g,
Éva A.
Enyedy
*hi,
Peter
Rapta
b,
Ernest
Hamel
e and
Vladimir B.
Arion
*ad
aInstitute of Inorganic Chemistry, Faculty of Chemistry, University of Vienna, Währinger Straße 42, A-1090 Vienna, Austria. E-mail: miljan.milunovic@univie.ac.at; vladimir.arion@univie.ac.at
bInstitute of Physical Chemistry and Chemical Physics, Faculty of Chemical and Food Technology, Slovak University of Technology in Bratislava, SK-81237 Bratislava, Slovakia
cInstitute of Physical and Theoretical Chemistry, Graz University of Technology, Stremayrgasse 9/II, A-8010 Graz, Austria
dInorganic Polymers Department, “Petru Poni” Institute of Macromolecular Chemistry, Aleea Gr. Ghica Voda 41 A, Iasi 700487, Romania
eMolecular Pharmacology Branch, Developmental Therapeutics Program, Division of Cancer Diagnosis and Treatment, National Cancer Institute, Frederick National Laboratory for Cancer Research, National Institutes of Health, Frederick, Maryland 21702, USA
fDepartment of Biochemistry and Molecular Biology, University of Szeged, Közép fasor 52, H-6726 Szeged, Hungary
gSchool of Pharmacy and Bioengineering, Keele University, Newcastle-under-Lyme, Staffordshire ST5 5BG, UK
hDepartment of Molecular and Analytical Chemistry, Interdisciplinary Excellence Centre, University of Szeged, Dóm tér 7-8, H-6720 Szeged, Hungary. E-mail: enyedy@chem.u-szeged.hu
iMTA-SZTE Lendület Functional Metal Complexes Research Group, University of Szeged, Dóm tér 7, H-6720 Szeged, Hungary
First published on 2nd July 2024
Abstract
Quite recently we discovered that copper(II) complexes with isomeric morpholine-thiosemicarbazone hybrid ligands show good cytotoxicity in cancer cells and that the molecular target responsible for this activity might be tubulin. In order to obtain better lead drug candidates, we opted to exploit the power of coordination chemistry to (i) assemble structures with globular shape to better fit the colchicine pocket and (ii) vary the metal ion. We report the synthesis and full characterization of bis-ligand cobalt(III) and iron(III) complexes with 6-morpholinomethyl-2-formylpyridine 4N-(4-hydroxy-3,5-dimethylphenyl)-3-thiosemicarbazone (HL1), 6-morpholinomethyl-2-acetylpyridine 4N-(4-hydroxy-3,5-dimethylphenyl)-3-thiosemicarbazone (HL2), and 6-morpholinomethyl-2-formylpyridine 4N-phenyl-3-thiosemicarbazone (HL3), and mono-ligand nickel(II), zinc(II) and palladium(II) complexes with HL1, namely [CoIII(HL1)(L1)](NO3)2 (1), [CoIII(HL2)(L2)](NO3)2 (2), [CoIII(HL3)(L3)](NO3)2 (3), [FeIII(L2)2]NO3 (4), [FeIII(HL3)(L3)](NO3)2 (5), [NiII(L1)]Cl (6), [Zn(L1)Cl] (7) and [PdII(HL1)Cl]Cl (8). We discuss the effect of the metal identity and metal complex stoichiometry on in vitro cytotoxicity and antitubulin activity. The high antiproliferative activity of complex 4 correlated well with inhibition of tubulin polymerization. Insights into the mechanism of antiproliferative activity were supported by experimental results and molecular docking calculations.
Introduction
For several decades, Werner-type transition metal complexes have led drug research as alternatives to platinum-based cancer treatments.1,2 The success of such substances can be primarily attributed to features of their ligand-exchange kinetics.3–5 Metals play a significant role in the biological processes of the body, as the vital activities of the cell and enzymes are organized by their metal cofactors.6,7 Metal ions also serve as centers for building precise, three-dimensional constructs, offering various coordination geometries with unique stereochemistry. Such constructs are crucial for targeting DNA and intracellular proteins and inaccessible through carbon-based compounds alone.8,9 Complex formation with biologically active ligands often enhances antiproliferative activity in cancer cells.10,11 Understanding the distinct mechanisms behind antiproliferative activity is crucial for overcoming low selectivity and serious side effects of chemotherapy.12–14Dynamic microtubules are validated primary targets in cancer therapy,15 and they play crucial roles in vital cellular processes, such as cell division, shape and motility, cell signaling and intracellular transport.16–18 Agents binding specifically to the colchicine site prevent tubulin from adopting a “straight” configuration that results in inhibition of microtubule assembly/disassembly, arrest of cell division and induction of cell death via apoptosis and/or necrosis. Several examples of first-row transition metal complexes acting as microtubule-destabilizing agents (MDA) or microtubule-targeting agents (MTA) have been reported.19,20 In addition, recently we described copper(II) complexes with isomeric morpholine-thiosemicarbazone hybrids as the first transition metal complexes of thiosemicarbazones (TSCs) with a 1![[thin space (1/6-em)]](https://www.rsc.org/images/entities/char_2009.gif) :1 metal-to-ligand ratio, and these complexes bind to tubulin in the colchicine site.21 Cu(II) complexes featuring hybrid TSCs, with the morpholine moiety at each of the four available positions of the pyridine ring and a potentially redox active 2,6-dimethylphenol unit at the end nitrogen atom of the thiosemicarbazide fragment, exhibited significant anticancer activity against human uterine sarcoma MES-SA cells and the multidrug resistant derivative MES-SA/Dx5 cells, with IC50 values ranging from 1.4 μM to 13.1 μM. Notably, the compound bearing the morpholine moiety at position 6 of the pyridine ring exhibited the greatest antiproliferative activity (the lowest IC50 values) in the cancer cell lines and inhibited tubulin polymerization by binding to the colchicine site.
:1 metal-to-ligand ratio, and these complexes bind to tubulin in the colchicine site.21 Cu(II) complexes featuring hybrid TSCs, with the morpholine moiety at each of the four available positions of the pyridine ring and a potentially redox active 2,6-dimethylphenol unit at the end nitrogen atom of the thiosemicarbazide fragment, exhibited significant anticancer activity against human uterine sarcoma MES-SA cells and the multidrug resistant derivative MES-SA/Dx5 cells, with IC50 values ranging from 1.4 μM to 13.1 μM. Notably, the compound bearing the morpholine moiety at position 6 of the pyridine ring exhibited the greatest antiproliferative activity (the lowest IC50 values) in the cancer cell lines and inhibited tubulin polymerization by binding to the colchicine site.
Given the 3D shape of the colchicine pocket in tubulin, we opted to exploit the power of coordination chemistry further in an attempt to build structures with well-defined globular shapes to complement the molecular diversity provided by purely organic scaffolds. This approach has not been used for the development of tubulin polymerization inhibitors so far, but it proved to be successful for creation of more efficient protein kinase inhibitors.22,23 We think attempts to assemble metal complexes with a more globular shape, when compared to 1:1 M-to-L complexes, to best fit the colchicine 3D pocket are worth exploring for the preparation of six-coordinate complexes of 1:2 M-to-L stoichiometry. Moreover, it would be worth investigating the impact of the central metal ion, the effect of coordination geometry, and the significance of the metal and ligand's potential redox activity on antiproliferative activity and on inhibition of microtubule assembly.
Thus, our goals were (i) the synthesis of new metal complexes with TSCs coupled with the morpholine moiety at position 6 of the pyridine ring and incorporating 2,6-dimethylphenol or a phenyl moiety of 1:2 and 1:1 metal-to-ligand stoichiometry (Chart 1); (ii) the investigation of the redox behavior and the stability of Co(III) and Fe(III) complexes of 1:2 metal-to-ligand stoichiometry in aqueous solution; (iii) the evaluation of the effects of the metal identity and metal-to-ligand stoichiometry (Chart 1) on in vitro antiproliferative activity and on tubulin polymerization; (iv) the elucidation of new structure–activity relationships; and (v) insights into the underlying mechanism of the antiproliferative activity consistent with the experimental data and molecular modelling.
 | ||
| Chart 1 Line drawings of TSCs and their transition metal complexes studied in this work. | ||
Results and discussion
Synthesis and characterization of HL1–HL3
The synthesis of morpholine-TSC hybrids HL1 and HL2 was accomplished via Schiff base condensation reactions between 4N-(4-hydroxy-3,5-dimethylphenyl)-3-thiosemicarbazide24 and the corresponding aldehyde or ketone, respectively,25,26 while that of HL3 by reacting the aldehyde with 4-N-phenyl-3-thiosemicarbazide. These reactions were carried out in boiling ethanol, affording HL1–HL3 in good yields (>70%). The formation of HL1–HL3 was confirmed by ESI mass spectra, which showed peaks assigned to ions [HL + H]+ and [HL + Na]+, where HL = HL1–HL3. One- and two-dimensional NMR spectra were in agreement with the expected structures for HL1–HL3 of C1 molecular symmetry (Chart 1). The spectra of HL1–HL3 in DMSO-d6 indicated the presence of E and Z-isomers, typical for thiosemicarbazones, with a significant predominance of the E-isomers. This was demonstrated by the chemical shifts of the N9H proton (11.86 ppm for E-HL1 10.43 ppm for E-HL2, 12.04 for E-HL3). For the atom labeling scheme for the NMR resonances assignment, see Chart S1 in the ESI.† The N9H proton of the Z-isomers was downfield-shifted due to the formation of a hydrogen bond with the pyridine nitrogen atom and resonated in the range δ 13.74–14.64 ppm. The Z-isomers were also identified by the hydrazinic nitrogen proton (N11H) with chemical shifts of 10.14 ppm (in Z-HL1), 9.97 ppm (in Z-HL2), and 10.51 ppm (in Z-HL3), compared to the E-isomers (9.98 ppm for HL1, 9.93 ppm for HL2, 10.24 ppm for HL3). The amount of Z-isomer was estimated as minor (less than 5%) by comparison of the integrals of the N11H protons in the spectra of both isomers (Fig. S1A and S3B in the ESI†). This type of isomerism is well-documented for similar TSCs and does not have any impact on their pharmacological profile.27–29Oxidation of TSCs
Semicarbazones and TSCs are prone to ring closure reactions in the presence of an oxidizing agent, to afford the corresponding 1,2,4-triazole and 1,3,4-oxa- or -thiadiazole derivatives.29–31 In the case of morpholine-TSC hybrids HL1 and HL3, it was found that the reaction of Fe(NO3)3·9H2O with these hybrids occurred via a 2-electron oxidative dehydrogenation, affording new species HL1′ and HL3′, containing a thiadiazole five-membered ring (for structure and atom labeling scheme see Chart S2 in the ESI†), as confirmed by 1H and 13C NMR spectra (Fig. S4A and S5B in the ESI†). This ring is formed via nucleophilic attack of the thione sulfur atom on the aldimine carbon atom with iron(III) acting as an oxidant. It is of note that the more sterically hindered ketimine carbon atom in HL2 is less vulnerable to attack by the thione sulfur atom, and thiadiazole formation in the presence of iron(III) was not observed. The crystal structure of thiadiazole derivative HL1′ in its protonated form, [H2L1′]NO3, was established by single crystal X-ray diffraction (SC-XRD) and is shown in Fig. S11 in the ESI.†Synthesis and characterization of complexes 1–8
Complexes 1–8 were obtained in good yields (57–92%) by the reactions of HL1–HL3 with the corresponding metal salts in methanol. Iron(III) and cobalt(III) complexes 1–5 were synthesized when starting materials were reacted in 1:2 molar ratio, while nickel(II), zinc(II) and palladium(II) complexes 6–8 when metal salt and the HL1 were mixed in 1:1 molar ratio. The formation and purity of 1–8 were confirmed by ESI mass spectra, elemental analysis and 1H and 13C NMR spectra for diamagnetic complexes 1–3, 7 and 8 (see Fig. S6A and S10B in the ESI†). The d8 electronic configuration of Ni(II) and Pd(II) favors square-planar coordination geometry, while Zn(II) with completely filled d-orbitals adopts a square-pyramidal geometry. In positive ion ESI mass spectra, Fe(III) and Co(III) bis-ligand complexes revealed a diagnostic peak due to [M(L1)2]+–[M(L3)2]+ ions, while complexes with 1:1 metal-to-ligand ratio showed peaks assigned to [M(L1)]+ ions (M = Ni(II), Zn(II), Pd(II)).
The 1H NMR spectra of cobalt(III) complexes 1–3 in DMSO-d6 (Fig. S6A and S8B in the ESI†) are consistent with deprotonation of the N9H upon TSC coordination to metal ions, as the peaks at 11.86 ppm for HL1, 10.43 ppm for HL2, 12.04 ppm for HL3 disappeared. The mentioned proton resonances were also missing in the 1H NMR spectra of the zinc(II) and palladium(II) complexes 7 and 8 (Fig. S9A and S10B in the ESI†). In the spectra of 1 and 7, the singlet of the azomethine proton CH![[double bond, length as m-dash]](https://www.rsc.org/images/entities/char_e001.gif) N is upfield shifted compared to the free ligand, suggesting the coordination to the metal ion.
N is upfield shifted compared to the free ligand, suggesting the coordination to the metal ion.
Despite its square-planar coordination geometry in the solid state, complex 6 is paramagnetic in DMSO-d6. The determined magnetic moment by the Evans method32 at room temperature (μeff = 2.83μB) is in agreement with the presence of 2 unpaired electrons in the d-orbitals (S = 1). Axial coordination of two DMSO molecules is likely.
X-ray diffraction quality single crystals of 1, 4, 5, 6 and 8 were obtained by re-crystallization in methanol, while 3 and 7 upon vapor diffusion of diethyl ether into their methanolic solutions.
X-ray diffraction study of the proligands and their complexes
The results of SC-XRD studies of complexes 1 and 3–8, with the atom labeling schemes, are shown in Fig. 1 and 2. The Co(III)- and Fe(III) bis-ligand complexes 1 and 3–5 crystallized in the centrosymmetric monoclinic space group(s) P21/c and P21/n, respectively, as racemic mixtures of the two enantiomers of chiral six-coordinate Co(III) and Fe(III) complexes (Fig. 1),33 as also reported for other metal bis-thiosemicarbazonates. Spontaneous resolution of these kinds of complexes, governed by the cooperative effect of H-bonding and π–π stacking interactions, was described previously for MnIIL2, with HL = acetylpyrazine thiosemicarbazone.34 | ||
| Fig. 1 ORTEP views of the metal complex cations in (a) [CoIII(HL1)(L1)](NO3)2·H2O (1), (b) [CoIII(HL3)(L3)](NO3)2 (3), (c) [FeIII(L2)2]NO3 (4) and (d) [FeIII(HL3)(L3)](NO3)2 (5) with thermal ellipsoids at the 50% probability level. | ||
 | ||
| Fig. 2 ORTEP views of (a) [NiII(L1)]Cl·CH3OH (6), (b) [ZnII(L1)Cl]·CH3OH (7) and (c) [PdII(HL1)Cl]Cl (8) with thermal ellipsoids at the 50% probability level (check). Interstitial solvent molecules were omitted for clarity. | ||
The potentially tetradentate ligands in these complexes act as tridentate. The morpholine moiety is not involved in coordination to Co(III) and/or Fe(III). In all four cases the ligands are coordinated to the metal via the pyridine nitrogen atom, hydrazinic nitrogen atom and thiolato sulfur atom. However, in complexes 1, 3 and 5, one thiolato ligand from the two coordinated to the metal is protonated at the nitrogen atom of the morpholine moiety, adopting a zwitterionic form. These ligands are considered charge neutral (HL1 or HL3). Protonation of one of the two morpholine moieties is also corroborated by the presence of hydrogen bonding interactions between the protonated morpholine moiety as proton donor and proton acceptor groups, e.g., water oxygen atom O11 in 1 (see Fig. 1).
The metrical parameters for complexes 1, 3 and 4, 5 summarized in Table 1 are comparable to those for Co(III)35–37 and iron(III) complexes,33,38–40 respectively, with related TSCs.
| Complex | 1 | 3 | 4 | 5 |
|---|---|---|---|---|
| M–N1 | 2.107(2) | 2.064(2) | 2.086(5) | 2.0797(11) |
| M–N2 | 1.876(3) | 1.8961(18) | 1.914(5) | 1.9250(11) |
| M–S1 | 2.2045(9) | 2.2084(9) | 2.2057(17) | 2.2094(4) |
| M–N6 | 2.074(2) | 2.0434(17) | 2.071(4) | 2.0755(13) |
| M–N7 | 1.890(3) | 1.8997(17) | 1.896(4) | 1.9244(11) |
| M–S2 | 2.2146(9) | 2.2194(7) | 2.1996(14) | 2.2021(5) |
| N1–M–N2 | 81.58(10) | 82.09(8) | 89.06(11) | 80.35(4) |
| N2–M–Sl | 85.00(8) | 84.95(6) | 84.90(15) | 84.40(3) |
| N6–M–N7 | 82.86(11) | 82.22(7) | 80.91(17) | 80.67(5) |
| N7–M–S2 | 84.67(8) | 84.89(6) | 85.12(12) | 84.09(4) |
The Ni(II), Zn(II) and Pd(II) complexes 6–8 with metal-to-ligand stoichiometry 1:1 (Fig. 2) crystallized in the noncentrosymmetric orthorhombic space group Pnn2 (6), in the centrosymmetric triclinic space group P![[1 with combining macron]](https://www.rsc.org/images/entities/char_0031_0304.gif) (7) and orthorhombic space group I2/c (8) Selected bond lengths and bond angles for 6–8 are collected in Table 2. The HL1 acts as monoanionic tetradentate ligand in Ni(II) and Zn(II) complexes 6 and 7, respectively. The coordination occurs via pyridine nitrogen atom N1, hydrazinic nitrogen N2, thiolato sulfur atom S and nitrogen atom N5 of the morpholine moiety. The calculated τ′4-parameter is 0.15,41 in agreement with slightly distorted square-planar coordination geometry of Ni(II) in 6. The coordination polyhedron of Zn(II) in 7 is completed by a chlorido co-ligand and is best described as slightly distorted square-pyramidal. The τ5-parameter for Zn(II) in 7 is 0.10.42 The morpholine moiety in all complexes studied by SC-XRD (1, 3–8) adopts the chair conformation.
(7) and orthorhombic space group I2/c (8) Selected bond lengths and bond angles for 6–8 are collected in Table 2. The HL1 acts as monoanionic tetradentate ligand in Ni(II) and Zn(II) complexes 6 and 7, respectively. The coordination occurs via pyridine nitrogen atom N1, hydrazinic nitrogen N2, thiolato sulfur atom S and nitrogen atom N5 of the morpholine moiety. The calculated τ′4-parameter is 0.15,41 in agreement with slightly distorted square-planar coordination geometry of Ni(II) in 6. The coordination polyhedron of Zn(II) in 7 is completed by a chlorido co-ligand and is best described as slightly distorted square-pyramidal. The τ5-parameter for Zn(II) in 7 is 0.10.42 The morpholine moiety in all complexes studied by SC-XRD (1, 3–8) adopts the chair conformation.
| Complex | 6 | 7 | 8 |
|---|---|---|---|
| M–N1 | 1.826(4) | 2.104(4) | 2.131(5) |
| M–N2 | 1.848(4) | 2.158(3) | 1.944(4) |
| M–S | 2.1470(14) | 2.3490(12) | 2.2232(14) |
| M–N5 | 1.973(4) | 2.288(3) | |
| M–Cl | 2.3196(14) | 2.3183(16) | |
| N1–M–N2 | 83.67(18) | 73.10(13) | 80.4(2) |
| N2–M–S | 87.33(13) | 79.86(10) | 84.95(14) |
| N1–M–N5 | 84.62(18) | 74.75(12) | |
| N2–M–N5 | 166.12(17) | 140.18(14) | |
| N1–M–S | 171.00(15) | 146.33(12) | 165.06(15) |
| N2–M–Cl | 172.24(14) |
In 8 the ligand adopts a zwitterionic form being deprotonated at the thiolato sulfur atom and protonated at the nitrogen atom N5 of the morpholine moiety. Moreover, in contrast to 6 and 7, the ligand in 8 acts as a tridentate one binding to Pd(II) via pyridine nitrogen atom N1, hydrazinic nitrogen N2 and thiolato sulfur atom S. The square-planar coordination geometry is completed by additional coordination of one chlorido co-ligand (Cl1) as shown in Fig. 2c, while Cl− (Cl2) acts as the counteranion. The calculated τ′4-parameter is 0.14.41 The atom N4 is a proton donor in a H-bond to chloride counteranion (Cl1 as proton acceptor), while N5 is a proton donor to the chlorido co-ligand. The bond lengths in the first coordination sphere of Pd(II) are in good agreement with those documented for Pd(II) complexes with related tridentate TSCs.43,44
Solution stability studies
The stability of the proligands HL1–HL3 in both dimethyl sulfoxide (DMSO) and aqueous solution at various pH values was monitored over time by UV–visible (UV–vis) spectrophotometry. The compounds were stable in both DMSO and water at pH 7.4, as the spectra remained unchanged over 24 h (Fig. S12 in the ESI†). However, slow spectral changes were observed under both acidic (pH 2) and basic (pH 11.7) conditions. The most remarkable changes were for HL2 at pH 2 (Fig. S12 and S13 in the ESI†). The decrease of the absorbance band at 310 nm is most likely due to the acid-catalyzed cleavage of the CN Schiff base bond, resulting in a less extended conjugation system in the molecule or desulfurization, which is likely under acidic conditions.45,46 The much more extensive hydrolysis of TSCs with a methyl group at the azomethine carbon was reported previously for 2-acetylpyridine TSCs.47 Spectral changes observed at pH 11.7 are likely due to Schiff base hydrolysis as well, although, in the case proligands containing the redox-active 2,6-dimethylphenol group (HL1 and HL2), oxidation may also occur, as was reported for triapine analogues.29 To obtain further evidence for oxidation of the phenolic moiety, time-dependent measurements were performed under strictly anaerobic conditions in a glove box (Fig. S12 in the ESI†). For proligands HL1 and HL2, the spectral changes were undoubtedly less significant when air oxygen was excluded, suggesting that these compounds can indeed be oxidized at the highly basic pH values.
Therefore, the proton dissociation constants (pKa) of the proligands HL1–HL3 were determined under anoxic conditions by pH-potentiometric titrations (Fig. S14 in the ESI†). As this method requires relatively high compound concentrations (>1 mM), the measurements were performed in 30% (v/v) DMSO to achieve the required solubility. Three pKa values were determined for the proligands HL1 and HL2, whereas only two constants, as expected, were obtained for phenyl derivative HL3 (Table 3). The constants obtained were assigned to the deprotonation NmorpholiniumH+ (NmorphH+), NhydrazineH (NhydrH) and OH moieties for HL1 and HL2, and to the NmorphH+ and NhydrH for HL3, respectively. It should be noted that we could not determine pKa values for the pyridinium group as its deprotonation in all three instances took place at fairly low pH values (pH < 2) due to the electron withdrawing effect of the protonated morpholinium moiety. The determined pKa values indicate that these compounds are in their neutral HL form at pH 7.4 and only a minor fraction (1–3%) is protonated ((HL)H+) at the morpholinium nitrogen (Table 3).
D values obtained by n-octanol/water partitioning at pH 6.0 (20 mM 2-morpholinoethanesulfonic acid (MES), t = 25.0 °C)
| HL1 | HL2 | HL3 | |
|---|---|---|---|
| pKa (NmorphH+) | 5.54 ± 0.03 | 5.85 ± 0.04 | 5.55 ± 0.02 |
| pKa (NhydrH) | 10.44 ± 0.03 | 10.41 ± 0.03 | 10.44 ± 0.03 |
| pKa (OH) | 12.12 ± 0.02 | 12.23 ± 0.02 | — |
| Molar fraction | 1% HL(H)+ | 3% HL(H)+ | 1% HL(H)+ |
| pH 7.4 | 99% HL | 97% HL | 99% HL |
| Molar fraction | 26% HL(H)+ | 43% HL(H)+ | 27% HL(H)+ |
| pH 6.0 | 74% HL | 57% HL | 73% HL |
| logD6.0 |
+1.23 ± 0.10 | +1.50 ± 0.05 | +2.06 ± 0.03 |
Attempts to determine the distribution coefficients (logD) of the proligands HL1–HL3 using the shake-flask method in an n-octanol/buffered aqueous solution at pH 7.4 showed that the compounds remained mostly in the n-octanol phase, implying their fairly lipophilic character (logD7.4 > 2). Therefore, the experiment was also conducted at pH 6, at which the fraction of the protonated species (HL)H+ is higher (Table 3). The logD6.0 values give the following trend: HL3 > HL2 > HL1. Interestingly, the 2,6-dimethylphenol moiety enhances hydrophilicity, while the methyl substituent at the Schiff base azomethine carbon atom modestly increases lipophilicity.
The stability of the Co(III) and Fe(III) complexes (1, 2, 4 and 5) in DMSO and in water at pH 2.0 (see representative spectra for complex 2 in Fig. S15a in the ESI†), 7.4 and 11.7 was also monitored over time by UV–vis spectrophotometry. Both Co(III) complexes were found to be stable in DMSO and in water at pH 2.0 and 7.4 for 24 h. However, slow spectral changes were observed at pH 11.7 in the presence of O2, most likely due to the oxidation of the 2,6-dimethylphenol moiety, because the spectra remained unchanged if the measurements were performed under anoxic conditions. In contrast, complete dissociation of iron(III) complexes 4 and 5 was found at pH 2, as the measured spectra were very similar to those of the free proligands (Fig. S15b for 5 in the ESI†). Spectral changes recorded in both DMSO and in water at pH 7.4 indicated the slow partial dissociation of the complexes (Fig. S15c and S15d for 5 in the ESI†). On the other hand, at pH 11.7 under anoxic conditions, the changes were minimal (Fig. S16 for 4 in the ESI†), except for the appearance of an absorption band with λmax ∼ 650 nm, which is typical for the Fe(II) complexes of α-N-pyridyl TSCs.48 Due to the kinetic inertness of the Co(III) complexes (d6, S = 0) and slow dissociation and reduction of the Fe(III) complexes at pH 7.4 no titrations were performed to determine their solution speciation. The lipophilicity of the Co(III) complexes characterized at pH 6.0 (logD6.0 = +0.94 ± 0.03 for 1, and +1.37 ± 0.05 for 2) shows that the complexes are slightly more hydrophilic than the corresponding ligands.
The reduction of complexes 1, 2, 4 and 5 by glutathione (GSH), one of the major cellular reductants, was investigated at pH 7.4 by recording UV–vis spectra in a glove box. The spectra of the Co(III) complexes remained unchanged upon the addition of GSH, indicating that no redox reaction occurred. In contrast, for Fe(III) complexes, the appearance of the typical charge transfer bands of Fe(II) species at λ > 560 nm suggests their reduction by GSH (Fig. 3).
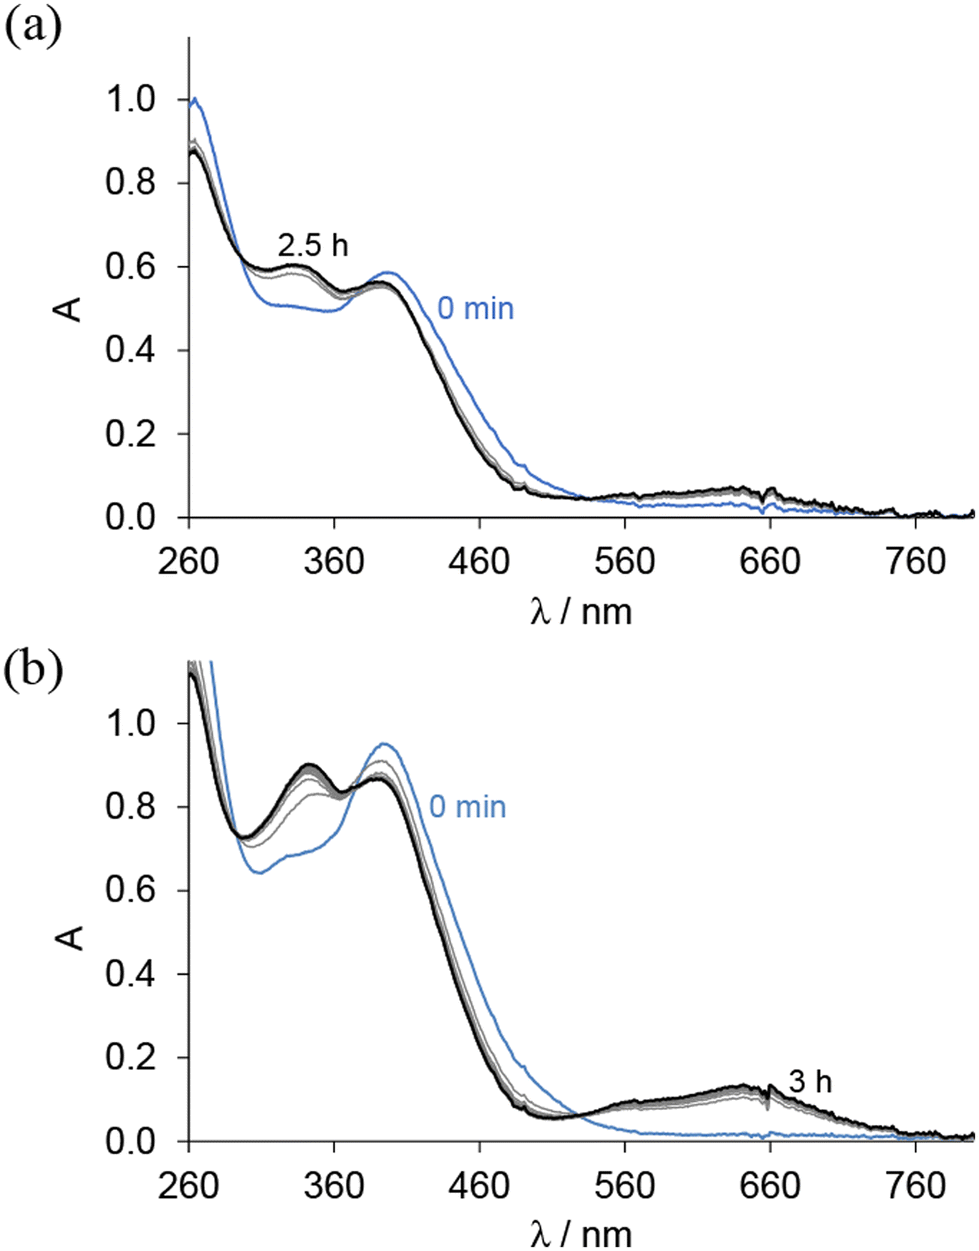 | ||
Fig. 3 UV–vis absorption spectra for (a) complex 4 and (b) complex 5 in the presence of 100 equiv. GSH at pH 7.4 measured over time in 30% (v/v) DMSO/H2O; {ccomplex = 25 μM; ![[small script l]](https://www.rsc.org/images/entities/i_char_e146.gif) = 1 cm; T = 25.0 °C}. = 1 cm; T = 25.0 °C}. | ||
The redox properties of the Co(III) and Fe(III) complexes were further investigated by cyclic voltammetry and UV–vis–NIR spectroelectrochemical measurements.
Cyclic voltammetry and spectroelectrochemistry
Cyclic voltammograms (CV) of Co(III) and Fe(III) complexes 1–5 with metal-to-ligand ratio 1:2 showed the reversible first reduction peak in the cathodic part in DMSO/nBu4NPF6 when using platinum or glassy-carbon working electrodes at a scan rate of 100 mV s−1 (Table 4 and Fig. 4).
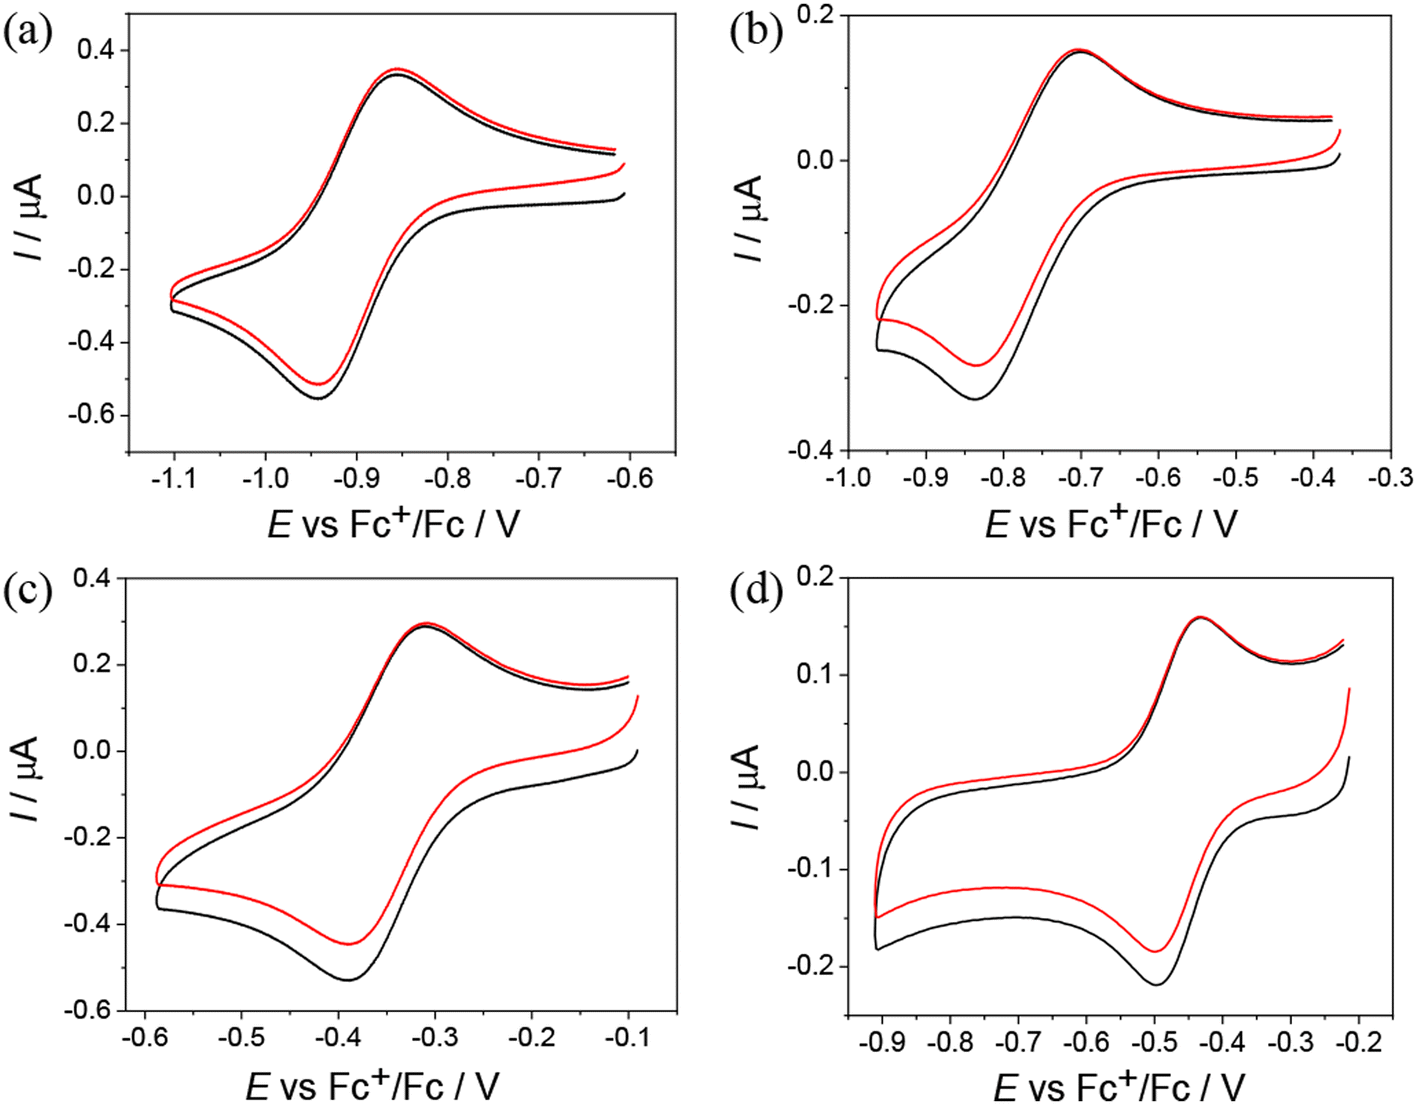 | ||
| Fig. 4 CVs of (a) Co(III) complex 2, (b) Co(III) complex 3, (c) Fe(III) complex 4, and (d) Fe(III) complex 5 in DMSO/nBu4NPF6 (Pt working electrode, scan rate: 100 mV s−1). | ||
| Complex | 1st reduction | 2nd reduction | 1st oxidation |
|---|---|---|---|
| a Half-wave potentials E1/2 or peak potentials (*) Ep, in volts vs. Fc+/Fc, scan rate 100 mV s−1; r – reversible, q – quasireversible, i – irreversible. | |||
| 1 | −0.78q | −1.05q | 0.43i* |
| 2 | −0.90r | −1.32q | 0.48i* |
| 3 | −0.77r | −1.08q | |
| 4 | −0.35r | −1.85q | 0.40i* |
| 5 | −0.47r | −0.98q | |
| 6 | −1.29q | −1.87q | 0.12i* |
| 7 | −1.86i | 0.24i* | |
| 8 | −0.91q | −1.28q | 0.28i* |
The Co(III) complexes 1–3 exhibit the most negative reduction potentials from −0.77 to −0.90 V (Table 4). The least negative reduction potential was observed for the Fe(III) complex 4, indicating easy and reversible reduction, while the reduction of Fe(III) complex 5 occurs at a more negative potential (see Table 4). The cyclic voltammetry of metal complexes of 1:1 stoichiometry showed less reversible reduction events in the region of the first electron transfer, and these were much more negative. For the Ni(II) complex 6, two quasireversible reduction waves were observed at −1.29 and −1.87 V vs. Fc+/Fc (Fig. S17a in the ESI†). Given the redox inactivity of the corresponding proligand in the cathodic part, a strong influence of the central atom on the ligand and a substantially noninnocent character of the ligand are conceivable. In the anodic part, one fully irreversible peak appeared upon oxidation at Epa = 0.12 V vs. Fc+/Fc with about double intensity compared to the reduction peaks (Fig. S17b in the ESI†). This wave could be attributed to the 2-electron oxidation of the potentially redox active 2,6-dimethylphenol unit.29 The Zn(II) complex 7 is irreversibly reduced at −1.86 V vs. Fc+/Fc. This reduction is presumably ligand-based (Fig. S17c in the ESI†). An irreversible peak was observed at Epa = 0.24 V vs. Fc+/Fc in the anodic part, which could be assigned to the oxidation of the 2,6-dimethylphenol unit (Fig. S17d in the ESI†). For Pd(II) complex 8, a quasireversible reduction peak was detected at −1.28 V vs. Fc+/Fc, followed by several consecutive reduction peaks at higher potentials, indicating irreversible changes after reduction. Irreversible oxidation occurred at Epa = 0.28 V vs. Fc+/Fc, which is presumably localized on the ligand (Fig. S18 in the ESI†).
No EPR signal was detected at room temperature nor at 100 K for Co(III) complexes 1–3, indicating the low spin EPR inactive configuration of the central atom (d6, S = 0). Applying in situ UV–vis–NIR spectroelectrochemistry, the nearly reversible behavior in the cathodic part for 2 and 3 in nBu4NPF6/DMSO was observed. As very small changes have been detected during in situ voltammetric scan, both standard absorption and difference (ΔA) optical spectra are shown in Fig. 5 for 2. For complex 3 a similar reversible redox behavior was observed in the region of the first reduction peak (Fig. S19 in the ESI†). The lowest reversibility of the electrochemical reduction was found for 1 (Fig. S20 in the ESI†). The metal-centered character of the reduction event was confirmed by EPR spectroscopy with complex 3. Chemical reduction with a stoichiometric equivalent of a single electron reducing agent, cobaltocene, produced an EPR signal characteristic for a low spin Co(II) (d7, S = 1/2) in the complex labeled as 3′, shown in Fig. 6.49–52 The rhombic g-tensor with principal values (g1, g2, g3) of (2.2376, 2.1924, 2.0275) and resolved hyperfine coupling with the 59Co (I = 7/2), characterized by a rhombic A-tensor (A1, A2, A3) of (98, 153, 169 MHz), are in line with the distorted octahedral coordination polyhedron around Co(II), presumably identical to that of the parent complex cation in 3.
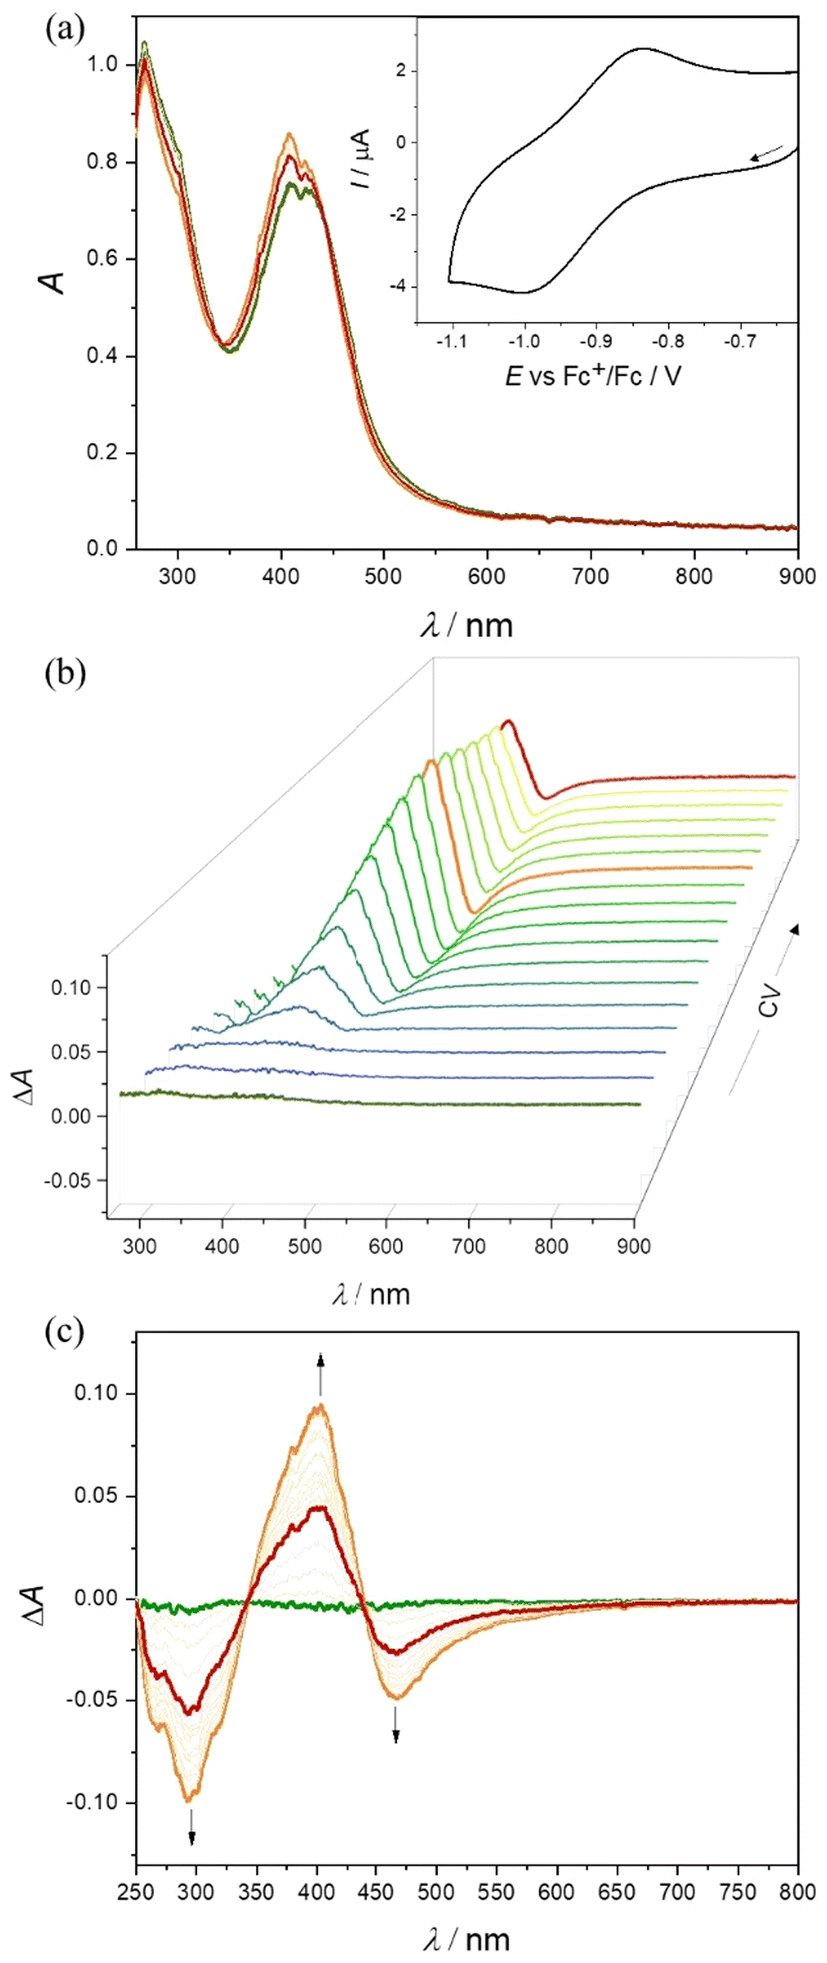 | ||
| Fig. 5 Spectroelectrochemistry of 2 in nBu4NPF6/DMSO in the region of the first cathodic peak: (a) UV–vis–NIR spectra measured simultaneously with in situ reduction; inset: CV of 2 with Pt-microstructured honeycomb working electrode and scan rate 10 mV s−1; (b) 3D-difference UV–vis–NIR spectra measured simultaneously with CV and (c) 2D-difference ΔA optical spectra. | ||
 | ||
| Fig. 6 X-band EPR spectra of 4, 5 and 3 reduced by cobaltocene (3′) in acetonitrile/dimethylformamide (MeCN/DMF) glass at 100 K. The black traces show experimental records, and the red traces show the simulations using Spin-Hamiltonian parameters quoted in the text. Spectrometer settings: microwave frequency, 9.45 GHz; microwave power, 1 mW; modulation frequency, 100 kHz; modulation amplitude, 0.2 mT. | ||
The low-spin configuration of Fe(III) in 4 and 5 was also confirmed by low-temperature EPR spectra (Fig. 6).
The principal values of the g-tensors (g1, g2, g3) for 4 (2.2157, 2.1241, 2.0026) and 5 (2.2213, 2.1229, 2.0027) in frozen MeCN/DMF glass are very similar and characteristic of the low-spin Fe(III) state (d5, S = ½).53 As expected, the EPR spectra of 4 and 5 in DMSO at room temperature were broad and noisy but unambiguously confirmed their low-spin Fe(III) ground state at 298 K as well.
To provide further evidence that the reduction of complexes 4 and 5 is iron-centered, their reversible one-electron reduction was studied by in situ EPR spectroelectrochemistry. A clear decrease of the EPR signal was observed at the corresponding first cathodic peak for 4 and 5 in the in situ EPR spectroelectrochemical experiment directly in the EPR cavity using a large platinum working electrode and a flat spectroelectrochemical cell (Fig. 7), thus confirming the reduction of low spin Fe(III) to the low spin EPR-inactive Fe(II) species 4′ and 5′ (d6, S = 0).
 | ||
| Fig. 7 Time evolution of X-band EPR spectra of (a) 4 and (b) 5 in nBu4NPF6/DMSO at room temperature in the region of the first cathodic peak when using the Pt mesh working electrode. Spectrometer settings: microwave frequency, 9.775 GHz; microwave power, 10 mW; modulation frequency, 100 kHz, modulation amplitude, 0.5 mT. | ||
The formation of Fe(II) analogues 4′ and 5′ upon cathodic reduction of 4 and 5 in DMSO, as well as the reversibility of the corresponding Fe(III)/Fe(II) redox couple, was also studied by in situ UV–vis–NIR spectroelectrochemistry. A new absorption band at 663 nm emerged after cathodic reduction of 4 in DMSO/nBu4NPF6via an isosbestic point at 540 nm (Fig. 8). This result is reminiscent of those reported for other Fe(III)–TSC complexes.54–56 Additionally, upon voltammetric reverse scan, reoxidation and nearly full recovery of the initial optical bands were observed, confirming the chemical reversibility of the cathodic reduction even at low scan rates. The reversible changes are even more evident in the difference optical spectra presented in a 3D projection (Fig. 8). A decrease of low intensity d–d transitions in the region 600–900 nm observed after the cathodic reduction of 4 provides further evidence for the metal centered electron transfer (Fig. S21 in the ESI†). A similar redox behavior was observed at a scan rate of 10 mV s−1 for 5 in the corresponding spectroelectrochemical experiment (Fig. S22 in the ESI†).
 | ||
| Fig. 8 Spectroelectrochemistry of 4 in nBu4NPF6/DMSO in the region of the first cathodic peak: (a) UV–vis–NIR spectra detected simultaneously upon in situ reduction; inset: CV of 4 with Pt-microstructured honeycomb working electrode and a scan rate of 10 mV s−1; (b) difference UV–vis–NIR spectra (the spectrum of the initial solution of 4 was taken as a reference) measured simultaneously with cyclic voltammetric scan (see the corresponding CV in (a)). | ||
Given the stability of the Co(III) and Fe(III) complexes, the latter showing only slow and partial dissociation at pH 7.4, and the ability of the Fe(III) species to be reduced both electrochemically and by GSH, which potentially makes them capable of producing reactive oxygen species (ROS), the antiproliferative activity of the complexes was further investigated.
Cytotoxicity
The proligands HL1–HL3 and their corresponding metal complexes 1–8 prepared in this study were subjected to evaluation of their anticancer potential, including selectivity towards specific types of cancer: leukemia, non-small cell lung (NSCLC), colon, central nervous system (CNS), melanoma, ovarian, renal, prostate and breast cancers, by the National Cancer Institute's Developmental Therapeutics Program. This evaluation involved the utilization of the NCI 60 human tumor cell line panel.57 One-dose (10 μM) assays showed that HL1 and HL2, as well as complexes 3, 6–8 were devoid of antiproliferative activity in the low micromolar range (see Fig. S23–S28 in the ESI†). Five-dose (0.01 μM–100 μM) concentrations were applied for complexes 1, 2 and 4, 5 and the data were used to calculate 50% growth inhibition of tested cells (GI50), total growth inhibition (TGI), and lethal dose concentration inducing 50% cell death (LC50). The GI50 data in μM are collected in Table 5. 5-Dose screen curves for 1, 2, 4 and 5 are presented in Fig. S29–S32 in the ESI.†| The results indicate that Fe(III) and Co(III) complexes 1, 2 and 4, 5, respectively, exhibit potent inhibitory effects on cancer cell growth. |
|---|

|
Notably, the iron(III) complexes 4 and 5 displayed pronounced cytotoxic effect against the majority of cell lines within the panel. For the most active Fe(III) complex 4, the average GI50, TGI, and LC50 concentrations across all cell lines in the panel were 2.92 μM, 18.4 μM, and 51.2 μM, respectively. For comparison, the Co(III) complex 2 (with the same ligand as Fe(III) complex 4) was somewhat less active with respective values of 5.63 μM, 39.9 μM and 68.3 μM, indicating that the two types of complexes may have distinct mechanisms of action.
Comparison of the GI50 values for different types of cancer cells indicates that the renal cancer cell lines are less sensitive to 1, 2 and 4, 5. In addition, the renal cancer cell lines show relative resistance to Co(III) complexes 1 and 2, when compared to Fe(III) complexes 4 and 5. Similarly, ovarian cancer cell lines (OVCAR-8, NCI/ADR-RES), colon cancer cells (HCT-15) and lung carcinoma cells (A549) showed relative resistance to 1 and 2, when compared to 4 and 5.
The robust growth inhibition and lethal concentration screening based on the NCI 60 human cancer cell line panel provided a basis to (i) evaluate the overall anticancer potential of the proligands and the most cytotoxic metal complexes, (ii) determine the selectivity of metal complexes towards specific types of cancers, (iii) select rationally the most potent compounds. The cellular and molecular effects of the selected complexes and the proligands were examined more extensively, and their effects on non-cancerous MRC-5 fibroblast cells were also determined.
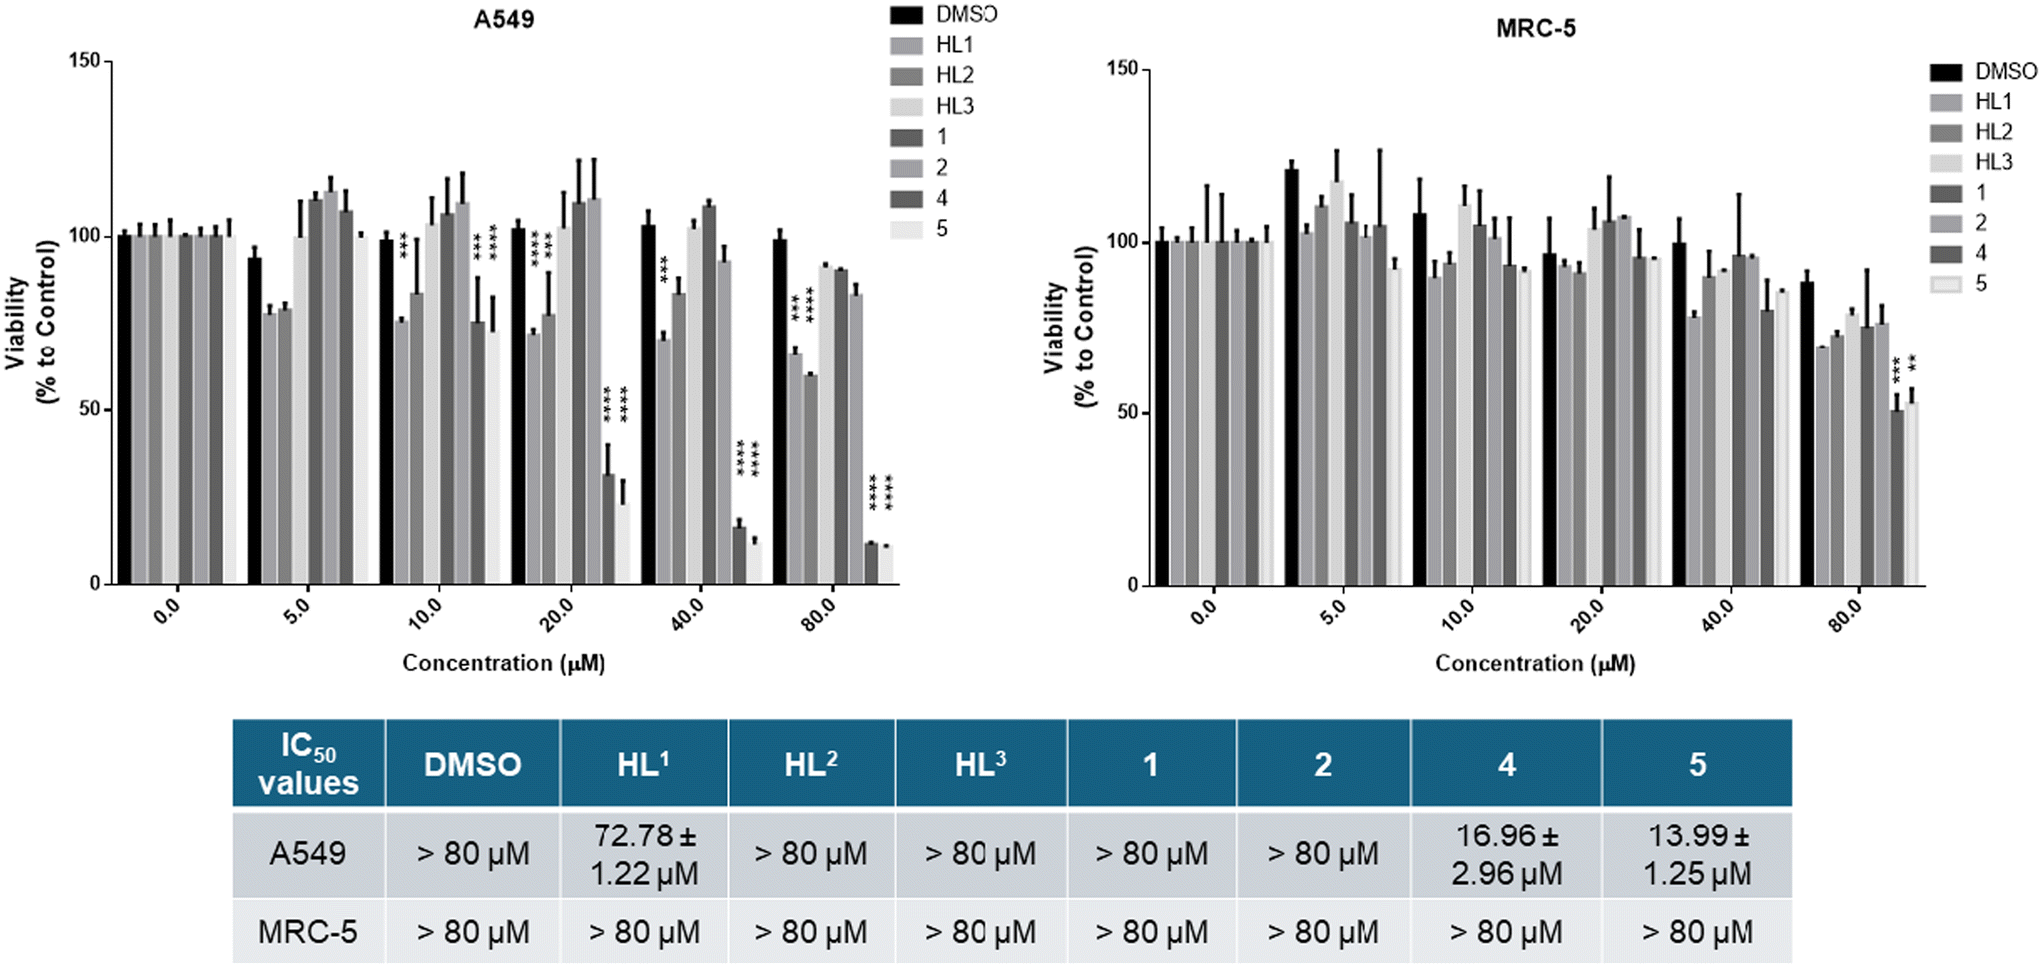
We wanted to compare the cytotoxicity of proligands HL1–HL3 and of their Co(III) and Fe(III) complexes 1, 2 and 4, 5 on cell lines originating from the same tissue, so human lung carcinoma A549 cells and lung fibroblast MRC-5 cells were subjected to 24 h treatments. Cell viability results and IC50 values (the μM drug concentration that reduces cell population to half the control value58) are shown in Fig. 9. The data indicate that HL1 and HL2 decrease somewhat the viability of the A549 lung adenocarcinoma cells at higher concentrations, but HL3 and the Co(III) complexes lack significant anticancer activity with the A549 cells. These proligands HL1–HL3 and the Co(III) complexes 1 and 2 did not affect the viability of MRC-5 fibroblasts. Importantly, Fe(III) complexes 4 and 5 show significant toxicity towards A549 cancer cells, and the Fe(III) complexes revealed good selectivity for the A549 cancer cell line (IC50 = 14–17 μM), as they were essentially non-toxic to non-cancerous MRC-5 cells (IC50 > 80 μM) except at the highest applied concentration. The vehicle DMSO exerted no toxic effect on either cell line.
 | ||
| Fig. 9 Viability of A549 tumor cells and MRC-5 fibroblast cells in the presence of HL1–HL3 and Co(III) and Fe(III) complexes 1, 2 and 4, 5, respectively, after a 24 h incubation determined by the MTT assay. P value: ** <0.005, *** <0.0005; **** <0.0001. | ||
To test directly the antiproliferative activity of the proligands and of their Co(III) and Fe(III) complexes on A549 cancer cells, non-toxic concentrations of the compounds were applied to the cells, then the 5-bromo-2′-deoxy-uridine (BrdU) incorporation assay was performed (Fig. 10). BrdU is a thymidine analog used in in vitro cell cultures to identify actively proliferating cells, since BrdU is incorporated into replicating DNA and can be detected using anti-BrdU antibodies. A reduction in the number of BrdU positive cells indicates that the applied treatment diminished cell proliferation. According to our results, DMSO vehicle control and the proligands HL2 and HL3 did not affect the proliferation of A549 cells compared to the untreated samples. On the other hand, significantly less BrdU incorporation was observed when cells were exposed to either HL1 ligand or to complexes 1, 2, 4 and 5. These results indicate a significant antiproliferative activity of the Co(III) and Fe(III) complexes, including the most active compounds 4 and 5.
 | ||
| Fig. 10 A549 cell proliferation in the presence of the proligands or their metal complexes assessed by the BrdU assay. The green fluorescent cells are BrdU positive, the non-fluorescent cells are BrdU negative. | ||
Interference with tubulin polymerization
Intrigued by the ability of recently reported Cu(II) complex with HL1 to inhibit the polymerization of purified tubulin,21 we performed similar assays with complexes 1, 2, 4 and 6–8. As a reference for comparison, combretastatin A-4 (CA-4) and Cu(HL1)Cl2 were used. As shown in Table 6, among the 1:1 complexes only the square-planar Pd(II) complex 8 showed appreciable inhibitory activity. The square-pyramidal Zn(II) complex 7, structurally closely related to the recently reported Cu(II) counterpart endowed with appreciable tubulin polymerization inhibitory activity (IC50 = 7.0 μM),21 did not show significant inhibitory activity even at 20 μM. Within the bis-ligand complexes, compound 4 showed the highest inhibitory activity so far, indicating that the metal complex stoichiometry and metal identity play an important role.
| Compound | IC50 ± SD (μM) | % inhibition ± SD | |
|---|---|---|---|
| 5 μM inhibitor | 25 μM inhibitor | ||
| a Each experiment was performed 2–3 times, and SD's are presented. b Combretastatin A-4. c Taken from ref. 21. | |||
| C-A4 | 0.91 ± 0.1 | 97 ± 0.5 | |
| 4 | 3.4 ± 0.06 | 3.4 ± 5 | 17 ± 4 |
| 8 | 6.5 ± 1 | 13 ± 5 | 97 ± 1 |
| Cu(HL 1 )Cl 2 | 7.0 ± 0.3 | 22 ± 2 | 40 ± 3 |
| 1, 2, 6, 7 | >20 | ||
Comparison of the GI50 values for cytotoxicity of 4 in cancer cells (Table 5) and inhibition of the polymerization of purified tubulin (3.4 μM) shows that these are mainly in the low micromolar range. This might indicate that the mode of action of 4 involves inhibition of tubulin assembly. In contrast, the one dose (10 μM) mean graph for 8 in cancer cells (Fig. S22 in the ESI†) indicated lower cytotoxicity of the compound, a reason why this compound was not examined in 5-dose assays to determine GI50 values. The IC50 value of inhibition of pure tubulin is 6.5 μM. The disjunction between antitubulin activity and cytotoxicity of 8 might be caused by multiple reasons.59,60 First, the drug concentrations quoted are almost always the concentrations in the culture medium. Neither the volume of the cells nor the proportion of drug that enters the cells or the rate of entry are generally known. Second, the drug can be altered in cells to become more active or less active. As for the Cu(II) complex with HL121 complex formation with Fe(III) and Pd(II) resulted in significant enhancement of the ability of the proligands to inhibit tubulin assembly. The active metal complexes 4 and 8 were further investigated for their abilities to inhibit the binding of [3H]colchicine to tubulin at two different concentrations (5 and 25 μM), with tubulin and colchicine at 0.5 and 5 μM concentrations, respectively (Table 6).61,62 The data obtained show that Pd(II) complex 8 is by a factor of 5 superior to Fe(III) complex 4 in its ability to inhibit the binding of [3H]colchicine to tubulin at 25 μM, but is still 7-fold less potent than CA-4 at the 5 μM concentration.
Since we found remarkable antiproliferative activity exerted by some of the tested compounds by the BrdU assay, and it was also shown that some of the compounds might interfere with tubulin polymerization in cell-free tests, we examined whether the metal complexes or the proligands influence the structure of the microtubule system in A549 cancer cells. For this purpose, the cells were treated with either DMSO, HL1–HL3, or with complexes 1, 2, 4 and 5, or were left untreated, followed by α-tubulin immunostaining (Fig. 11). In the untreated samples normal cell morphology and filamentous microtubule structure was observed. The vehicle control DMSO, the ligands HL2 and HL3, and the metal complexes 1 and 2 did not affect either cell morphology or the filamentous structure of the microtubule system in the A549 cells. The microscopic images did show that microtubule structure was disrupted by the HL1 ligand treatment, and there was even greater disruption when the cells were exposed to 4 or 5 (Fig. 11). These microtubules do not span the entire cell in arrays but rather seem to be unstable and fuzzy.
 | ||
| Fig. 11 Fluorescent microscopic images of the microtubule system within A549 cancer cells after exposure to proligands HL1–HL3 or complexes 1, 2, 4 and 5 after tubulin immunostaining. Cell nuclei are visualized using DAPI. | ||
Molecular docking was performed to predict the fit and orientation of 4 and 8 within the colchicine site of tubulin and thus validate the established antitubulin activity of these compounds.
Molecular modelling
The Fe(III) complex 4 and Pd(II) complex 8 (Chart 1) were docked to the colchicine site of tubulin (PDB ID: 4O2B, resolution 2.30 Å);63 the docking scaffold was previously verified.64 The scoring functions GoldScore(GS),65 ChemScore(CS),66,67 Piecewise Linear Potential (ChemPLP)68 and Astex Statistical Potential (ASP)69 were used with the GOLD (v2024.1) docking algorithm. The GOLD docking algorithm is an excellent molecular modelling tool.70,71 Only GS runs were performed for the two metal complexes. The binding scores for the complexes are shown in Table 7. The complexes show good scores, indicating reasonable binding similar that of the N-[(7S)-1,2,3,10-tetramethoxy-9-oxo-6,7-dihydro-5H-benzo[d]heptalen-7-yl]ethanamide (LOC) co-crystalized ligand. The higher binding score for complex 8 (Table 7) is in line with its superior ability to inhibit the binding of [3H]colchicine to tubulin at 25 μM as compared with complex 4 (see Table 6).| Complexes | GS | ASP | PLP | CS | IC50 (μM) |
|---|---|---|---|---|---|
| 4 | 62.9 | — | — | — | 3.4 ± 0.06 |
| 8 | 78.0 | — | — | — | 6.5 ± 1 |
| LOC | 72.6 | 29.1 | 73.3 | 29.0 | — |
| RMSD (Å) | 0.3251 | 0.3659 | 0.2410 | 0.4822 | — |
The modelling into the tubulin-colchicine pocket revealed that both complexes overlap extensively with the LOC co-crystalized ligand (see Fig. 12 and Fig. S33 in the ESI†). Fig. 12 shows the predicted binding mode of complex 4. It fits into the pocket with both morpholine rings pointing into the water environment. One H-bonding interaction is predicted between the amino group in the side chain of Asn258 and the thiolato sulfur atom of one of the TSC ligands. In addition, the oxygen atom in the amide side chain came close to the iron(III) center.
 | ||
| Fig. 12 (a) The docked pose of 4 (ball-and-stick) in the colchicine site of tubulin. The co-crystalized ligand (LOC) is shown in line format (green), and its hydrogen atoms are not shown for clarity. The protein surface is rendered with blue color depicting regions with a partial positive charge on the surface, red color depicting regions with a partial negative charge and grey showing neutral areas. (b) The predicted binding of complex 4, with amino acids within 5 Å shown in line format. H-bonding is predicted between the βAsn258 (stick format) side chain and one of the sulfur atoms in the complex (green solid line, 2.1 Å), and there is a potential interaction of the amide side chain oxygen atom with the central iron (black solid line, 4.5 Å). | ||
Conclusions
This work led to a series of cobalt(III) and iron(III) complexes with three closely related TSCs HL1–HL3 (except that of Fe(III) with HL1) of 1:2 stoichiometry and nickel(II), zinc(II) and palladium(II) complexes with HL1 of 1:1 stoichiometry. The three proligands resulted from condensation reactions of 6-morpholinomethyl-2-formylpyridine and 6-morpholinomethyl-2-acetylpyridine with 4-(4-hydroxy-3,5-dimethylphenyl)thiosemicarbazide (HL1 and HL2, respectively) or 6-morpholinomethyl-2-formylpyridine and 4-N-phenylthiosemicarbazide (HL3). X-ray diffraction studies have shown that TSC-morpholine hybrids act as tridentate monoanionic or zwitterionic ligands in cobalt(III) and iron(III) complexes of 1:2 stoichiometry, namely [Co(HL1)(L1)](NO3)2 (1), [Co(HL2)(L2)](NO3)2 (2), [Co(HL3)(L3)](NO3)2 (3), [Fe(L2)2]NO3 (4) and [Fe(HL3)(L3)](NO3)2 (5). In contrast, in 1:1 metal-to-ligand complexes the coordination mode and protonation state of HL1 differ. In square-planar nickel(II) and square-pyramidal zinc(II) complexes [Ni(L1)]Cl and [Zn(L1)Cl] the TSC-morpholine hybrid acts as monoanionic tetradentate ligand, while in square-planar palladium(II) complex [Pd(HL1)Cl]Cl HL1 adopts a zwitterionic form being protonated at morpholine nitrogen atom and deprotonated at the thiosemicarbazide fragment, with the negative charge formally localized on the thiolato sulfur atom and acting as a tridentate ligand. The bis-ligand metal complexes (1, 2 and 4, 5) showed good cytotoxicity in a panel of 60 cancer cell lines. In contrast, the mono-ligand complexes 6–8 were devoid of cytotoxicity in the low μM range. Antiproliferative activity assays showed good selectivity (selectivity index ca. 5) of Fe(III) complexes 4 and 5 for human lung carcinoma A549 cells when compared to lung fibroblast MRC-5 cells. In addition, the complexes 4 and 8 were found to show good antitubulin activity with IC50 value of 3.4 and 6.5 μM, respectively. Comparison of the average GI50 concentration of Fe(III) complex 4 against the NCI 60 tumor cell panel (2.92 μM) with the IC50 value for inhibition of tubulin assembly (3.4 μM) leads to the conclusion that tubulin might be a target for this compound. This is also consistent with the tubulin immunostaining experiment in A549 cells and with molecular docking calculations. The complexes 4 and 8 are the first reported Fe(III) and Pd(II) complexes acting as inhibitors of tubulin assembly. The change of metal-to-ligand stoichiometry and metal identity seem to be important for further structural optimization of metal complexes in order to obtain compounds with improved antitubulin activity.
Experimental section
Chemicals
2-Formylpyridine, 2-acetylpyridine, 4-N-phenyl-3-thiosemicarbazide, Co(NO3)2·6H2O, Fe(NO3)3·9H2O, NiCl2·6H2O, ZnCl2, PdCl2(MeCN)2 were purchased from commercial suppliers and used without further purification. The syntheses of 6-(morpholinomethyl)-2-formylpyridine, 6-(morpholinomethyl)-2-acetylpyridine and 4-N-(4-hydroxy-3,5-dimethylphenyl)-3-thiosemicarbazide were performed by following literature protocols.24–26The synthesis of the proligands
:1 molar ratio.
:1 molar ratio. IR (ATR, selected bands, ![[small upsilon, Greek, tilde]](https://www.rsc.org/images/entities/i_char_e131.gif) max): 3316, 3182, 1612, 1576, 1451, 1189, 1114, 867, 593, 337 cm−1. UV–vis (MeOH), λmax, nm (ε, M−1 cm−1): 317 (38853). Other details can be found in a recently published article.21
:1 molar ratio. IR (ATR, selected bands, max): 3211, 2440, 1730, 1591, 1517, 1250, 1189, 694 cm−1. UV–vis (MeOH), λmax, nm (ε, M−1 cm−1): 277 sh, 327 (18220).
max): 3316, 3182, 1612, 1576, 1451, 1189, 1114, 867, 593, 337 cm−1. UV–vis (MeOH), λmax, nm (ε, M−1 cm−1): 317 (38853). Other details can be found in a recently published article.21
:1 molar ratio. IR (ATR, selected bands, max): 3211, 2440, 1730, 1591, 1517, 1250, 1189, 694 cm−1. UV–vis (MeOH), λmax, nm (ε, M−1 cm−1): 277 sh, 327 (18220).
Oxidized ligands
:1 ligand-to-metal ratio, a small amount of oxidized proligand was formed. This was confirmed by positive ion ESI-MS (MeCN/MeOH + 1% H2O) (m/z 354.17 [HL3′ + H]+) and negative ion ESI-MS (m/z 351.99 [HL3′ − H]−). Anal. Calcd for C18H19N5SO (Mr = 353.44): C, 61.17; H, 5.42; N, 19.82; S, 9.07%. Found, %: C, 61.26; H, 5.56; N, 19.69; S, 8.89. 1H NMR (600 MHz, DMSO-d6): δ 10.65 (s, 1H, H11), 8.02 (d, J = 7.7 Hz, 1H, H3), 7.95 (d, J = 7.7 Hz, 1H, H4), 7.67 (d, J = 7.8 Hz, 2H, H13+17), 7.53 (d, J = 7.6 Hz, 1H, H5), 7.38 (t, J = 7.9 Hz, 2H, H14+16), 7.04 (s, 1H, H15), 3.66 (s, 2H, H18), 3.61 (m, 4H, H21+22), 2.47 (s, 4H, H20+23) ppm. 13C NMR (151 MHz, DMSO-d6): δ 165.57 (C10), 159.67 (C7), 158.70 (C6), 148.41 (C2), 140.43 (C12), 137.94 (C4), 129.13 (C14+16), 123.64 (C5), 122.18 (C15), 117.75 (C3), 117.65 (C13+17), 66.22 (C21+22), 63.53 (C18), 53.24 (C20+23) ppm.
Synthesis of complexes with metal-to-ligand stoichiometry of 1![[thin space (1/6-em)]](https://www.rsc.org/images/entities/h3_char_2009.gif) :2
:2
max): 3416, 1627, 1297, 1110, 1016, 865, 785 cm−1. UV–vis (MeOH), λmax, nm (ε, M−1 cm−1): 266 (70965), 303 sh, 418 (41503), 482sh, 535sh, 580sh.
max): 3260, 3080, 1488, 1455, 1409, 1299, 1207, 1146, 1009, 860, 493 cm−1. UV–vis (MeOH), λmax, nm (ε, M−1 cm−1): 261 (62438), 301sh, 417 (35270), 482sh, 535sh, 580sh.
max): 3308, 1601, 1551, 1481, 1252, 1108, 746, 686, 557, 488 cm−1. UV–vis (MeOH), λmax, nm (ε, M−1 cm−1): 257 (62509), 307 sh, 396 (34215), 482sh, 535sh, 580sh.
max): 3239, 1601, 1574, 1480, 1407, 1252, 1021, 825, 688, 490 cm−1. UV–vis (MeOH), λmax, nm (ε, M−1 cm−1): 260 (30000), 403 (18229), 449sh, 580 (800), 710 (570), 800 (560).
max): 3253, 1600, 1547, 1479, 1442, 1318, 1109, 1021, 743, 641, 496 cm−1. UV–vis (MeOH), λmax, nm (ε, M−1 cm−1): 257 (35179), 399 (23980), 444 sh, 575sh, 685 (400), 805 (300).
Synthesis of complexes with metal-to-ligand stoichiometry of 1:1
max): 3199, 1604, 1459, 1414, 1208, 1125, 857, 521, 492 cm−1. UV–vis (MeOH), λmax, nm (ε, M−1 cm−1): 261 (14702), 314 sh, 430 (82375), 489sh, 620sh. X-ray diffraction quality single crystals were selected from the prepared sample.
max): 3465, 3276, 1607, 1560, 1490, 1466, 1440, 1224, 1191, 1052, 842, 501 cm−1. UV–vis (MeOH), λmax, nm (ε, M−1 cm−1): 272 (10527), 409 (13822).
max): 3196, 1605, 1481, 1416, 1215, 1112, 964, 906, 773, 738, 490 cm−1. UV–vis (MeOH), λmax, nm (ε, M−1 cm−1): 265sh, 288 (11619), 459 (6925), 580sh.
Physical measurements
Elemental analysis was carried out with a Carlo-Erba microanalyzer at the Microanalytical Laboratory at the Faculty of Chemistry, University of Vienna. The samples for electrospray ionization mass spectrometry (ESI-MS) were measured on an Amazon speed ETD Bruker instrument. Expected and experimental isotope distributions were compared. IR spectra were recorded on a Bruker Vertex 70 Fourier transform IR spectrometer (300–4000 cm−1) using attenuated total reflection (ATR) technique. 1D (1H, 13C) and 2D (1H–1H COSY, 1H–13C HSQC, 1H–13C HMBC) NMR spectra were acquired on a Bruker AV NEO 500 or AV III 600 spectrometers in DMSO-d6 at 25 °C.614 frames were measured, each for 20, 20, 60, 5, 50, 30, 4 and 5 s over 0.36, 0.36, 0.36, 0.36, 2.0, 0.36, 0.5 and 1.0° scan width, respectively. Crystal data, data collection parameters, and structure refinement details are given in Tables S1 and S2.† The structures were solved by direct methods and refined by full-matrix least-squares techniques. Non-H atoms were refined with anisotropic displacement parameters. H atoms were inserted in calculated positions and refined with a riding model. The disorder of interstitial solvent in voids of 1, 4 and 5 could not be resolved, and, therefore, SQUEEZE routine implemented in PLATON72 was applied to analyze the data, revealing a void volume of 279 Å3 (for 1), 75 Å3 (for 4), 290 Å3 (for 5) and (899 Å3) (for 6). The ascertained void content was removed from the model and was not included in the final refinement. The following computer programs and hardware were used: structure solution, SHELXS-2014 and refinement, SHELXL-2014;73 molecular diagrams, ORTEP;74 computer, Intel CoreDuo. CCDC 2354137 (1), 2354138 (3), 2354139 (4), 2354140 (5), 2354141 (6), 2354142 (7), 2354143 (8) and 2354144[H2L1′]NO3.†
:1 v/v. Complexes 4 and 5 were dissolved under ambient conditions, and complex 3 was reduced with a stoichiometric equivalent of cobaltocene in a N2 glovebox (N2 < 2 ppm, H2O < 1 ppm). The MeCN/DMF solutions were flash frozen in liquid N2 prior to transfer to the N2 flow cryostat precooled at 100 K inside the cavity of the EPR resonator. EPR spectra were analyzed with the Easyspin toolbox,75 running on Matlab.
NCI-60 screening
The NCI-60 SRB assay was performed as described previously.76 GI50 values (the concentration of the metal complex causing 50% growth inhibition), TGI value (the concentration of the complex causing 0% cell growth), and LC50 (the concentration of the complex causing 50% cell death) were interpolated from dose–response curves that were plots of percentage cell growth versus concentration of test compounds.000 cells per well were seeded into 96-well plates and left to grow. On the next day the cells were exposed to 0, 5, 10, 20, 40 or 80 μM of each compound or to an equivalent volume of DMSO for 24 h. After the treatments, cells were washed with PBS and then were incubated with 0.5 mg mL−1 MTT reagent (Sigma-Aldrich, St Louis, Missouri, USA) for 1 h at 37 °C. Finally, 100 μL of DMSO (Molar Chemicals, Halásztelek, Hungary) was added to each well, and the absorbance of samples was measured at 570 nm using a Synergy HTX plate reader (BioTek, Winooski, Vermont, USA). The viability measurements were repeated three times using 3 independent biological replicates.
:1000 dilution, and the incubation continued for 30 min. Then the cells were fixed using 70% ethanol in 50 mM glycine (pH 2.0), and immunofluorescence of adherent cells was measured following the manufacturer's instructions. BrdU incorporation was visualized using an Olympus FV10i confocal microscope.
:300 dilution in 1% BSA followed by Alexa 488 fluorophore-conjugated goat anti-mouse secondary antibody (Abcam, Cambridge, UK) in a 1:600 dilution in 1% BSA. The stained samples were examined in an Olympus FV10i confocal microscope.
Author contributions
Iuliana Besleaga – data curation; formal analysis; investigation; methodology; writing – original draft. Renáta Raptová – data curation; investigation; methodology; Alexandru-Constantin Stoica – data curation; software; visualization; investigation; Miljan N. M. Milunovic – writing – original draft; formal analysis; methodology; Michal Zalibera – investigation; methodology; software; validation; Ruoli Bai – data curation; investigation; Nóra Igaz – data curation; investigation; methodology; Jóhannes Reynisson – data curation; formal analysis; investigation; methodology; writing – original draft; Mónika Kiricsi – investigation; methodology; software; validation; Éva A. Enyedy – data curation; formal analysis; investigation; methodology; writing – original draft; writing – review and editing; Peter Rapta – investigation; methodology; writing – original draft; Ernest Hamel – investigation; writing – review; and Vladimir B. Arion – conceptualization; funding acquisition; investigation; project administration; writing – review and editing.Disclaimer
This research was supported in part by the Developmental Therapeutics Program in the Division of Cancer Treatment and Diagnosis of the National Cancer Institute, which includes federal funds under Contract No. HHSN261200800001E. The content of this publication does not necessarily reflect the views or policies of the Department of Health and Human Services, nor does mention of trade names, commercial products, or organizations imply endorsement by the U.S. Government.Data availability
The data supporting this article have been included as part of the ESI.† Crystallographic data for compounds 1, 3, 4, 5, 6, 7, 8 and [H2L1′]NO3 has been deposited at the CCDC under accession numbers 2354137, 2354138, 2354139, 2354140, 2354141, 2354142, 2354143 and 2354144[H2L1′]NO3 and can be obtained from CCDC e-mail: deposit@ccdc.cam.ac.uk.†Conflicts of interest
There are no conflicts to declare.Acknowledgements
This work was funded by the FWF grant no. I4729, by a grant of the Ministry of Research, Innovation and Digitalization, project no. PNRR-III-C9-2023-I8-99/31.07.2023 within the National Recovery and Resilience Plan (Romania), as well as by the Slovak Research and Development Agency under the contract no. APVV-19-0024 (P. R.) and the grant agency VEGA (contract no. 1/0392/24). P. R., E. A. E. and V. B. A. acknowledge the support by COST Action CA18202 (European Cooperation in Science and Technology). V. B. A. was also supported by the Distinguished Guest Scientist Fellowship Program of the Hungarian Academy of Sciences. The authors also thank the Developmental Therapeutics Program of the National Cancer Institute for performing cytotoxicity studies with selected compounds in the 60 cancer cell line screen. We thank Dr Tim Gruene and the team of the Centre for X-ray Structural Analysis (Faculty of Chemistry, University of Vienna) for X-ray diffraction measurements.References
- K. B. Garbutcheon-Singh, M. P. Grant, B. W. Harper, A. M. Krause-Heuer, M. Manohar, N. Orkey and J. R. Aldrich-Wright, Curr. Top. Med. Chem., 2011, 11, 521–542 CrossRef CAS PubMed.
- U. Ndagi, N. Mhlongo and M. Soliman, Drug Des., Dev. Ther., 2017, 11, 599–616 CrossRef CAS PubMed.
- M. I. Murillo, C. Gaiddon and R. Le Lagadec, Front. Chem., 2022, 10, 967337 CrossRef CAS PubMed.
- D. Narayanan, S. Ma and D. Özcelik, Cancers, 2020, 12, 1706 CrossRef CAS PubMed.
- U. Jungwirth, C. R. Kowol, B. K. Keppler, C. G. Hartinger, W. Berger and P. Heffeter, Antioxid. Redox Signal., 2011, 15, 1085–1127 CrossRef CAS PubMed.
- J. Iqbal, C. Jacob and J. Sévigny, Front. Pharmacol., 2021, 12, 746925 CrossRef PubMed.
- N. P. E. Barry and P. J. Sadler, Pure Appl. Chem., 2014, 86, 1897–1910 CAS.
- E. Boros, P. J. Dyson and G. Gasser, Chem., 2020, 6, 41–60 CAS.
- P. C. Bruijnincx and P. J. Sadler, Curr. Opin. Chem. Biol., 2008, 12, 197–206 CrossRef CAS PubMed.
- R. Paprocka, M. Wiese-Szadkowska, S. Janciauskiene, T. Kosmalski, M. Kulik and A. Helmin-Basa, Coord. Chem. Rev., 2022, 452, 214307 CrossRef CAS.
- C. Santini, M. Pellei, V. Gandin, M. Porchia, F. Tisato and C. Marzano, Chem. Rev., 2014, 114, 815–862 CrossRef CAS PubMed.
- A. P. King and J. J. Wilson, Chem. Soc. Rev., 2020, 49, 8113–8136 RSC.
- K. D. Mjos and C. Orvig, Chem. Rev., 2014, 114, 4540–4563 CrossRef CAS PubMed.
- C. Huang, T. Li, J. Liang, H. Huang, P. Zhang and S. Banerjee, Coord. Chem. Rev., 2020, 408, 213178 CrossRef CAS.
- M. A. Jordan and L. Wilson, Nat. Rev. Cancer, 2004, 4, 253–265 CrossRef CAS PubMed.
- K. E. Arnst, Y. Wang, D.-J. Hwang, Y. Xue, T. Costello, D. Hamilton, Q. Chen, J. Yang, F. Park, J. T. Dalton, D. D. Miller and W. Li, Cancer Res., 2018, 78, 265–277 CrossRef CAS PubMed.
- A. Roll-Mecak, Dev. Cell, 2020, 54, 7–20 CrossRef CAS PubMed.
- G. La Regina, A. Coluccia, V. Naccarato and R. Silvestri, Eur. J. Pharm. Sci., 2019, 131, 58–68 CrossRef CAS PubMed.
- C. Wittmann, O. Dömötör, I. Kuznetcova, G. Spengler, J. Reynisson, L. Holder, G. J. Miller, E. A. Enyedy, R. Bai, E. Hamel and V. B. Arion, Dalton Trans., 2023, 52, 9964–9982 RSC.
- S. Mukherjee, A. V. Sawant, S. S. Prassanawar and D. Panda, ACS Omega, 2023, 8, 3221–3235 CrossRef CAS PubMed.
- M. N. M. Milunovic, K. Ohui, I. Besleaga, T. V. Petrasheuskaya, O. Dömötör, E. A. Enyedy, D. Darvasiova, P. Rapta, Z. Barbieriková, D. Vegh, S. Tóth, J. Tóth, N. Kucsma, G. Szakács, A. Popović-Bijelić, A. Zafar, J. Reynisson, A. D. Shutalev, R. Bai, E. Hamel and V. B. Arion, J. Med. Chem., 2024, 67, 9069–9090 CrossRef CAS PubMed.
- E. Meggers, Curr. Opin. Chem. Biol., 2007, 11, 287–292 CrossRef CAS PubMed.
- R. Anand, J. Maksimoska, N. Pagano, E. Y. Wong, P. A. Gimotty, S. L. Diamond, E. Meggers and R. Marmorstein, J. Med. Chem., 2009, 52, 1602–1611 CrossRef CAS PubMed.
- L. Lungu, A. Ciocarlan, A. Barba, S. Shova, S. Pogrebnoi, I. Mangalagiu, C. Moldoveanu, N. Vornicu, M. D'Ambrosio, M. V. Babak, V. B. Arion and A. Aricu, Chem. Heterocycl. Compd., 2019, 55, 716–724 CrossRef CAS.
- F. Bacher, O. Dömötör, A. Chugunova, N. V. Nagy, L. Filipović, S. Radulović, É. A. Enyedy and V. B. Arion, Dalton Trans., 2015, 44, 9071–9090 RSC.
- C. Wittmann, F. Bacher, E. A. Enyedy, O. Dömötör, G. Spengler, C. Madejski, J. Reynisson and V. B. Arion, J. Med. Chem., 2022, 65, 2238–2261 CrossRef CAS PubMed.
- C. R. Kowol, W. Miklos, S. Pfaff, S. Hager, S. Kallus, K. Pelivan, M. Kubanik, É. A. Enyedy, W. Berger, P. Heffeter and B. K. Keppler, J. Med. Chem., 2016, 59, 6739–6752 CrossRef CAS PubMed.
- C. R. Kowol, R. Eichinger, M. A. Jakupec, M. S. Galanski, V. B. Arion and B. K. Keppler, J. Inorg. Biochem., 2007, 101, 1946–1957 CrossRef CAS PubMed.
- I. Besleaga, I. Stepanenko, T. V. Petrasheuskaya, D. Darvasiova, M. Breza, M. Hammerstad, M. A. Marć, A. Prado-Roller, G. Spengler, A. Popović-Bijelić, E. A. Enyedy, P. Rapta, A. D. Shutalev and V. B. Arion, Inorg. Chem., 2021, 60, 11297–11319 CrossRef CAS PubMed.
- R. Noto, P. L. Meo, M. Gruttadauria and G. Werber, J. Heterocycl. Chem., 1996, 33, 863–872 CrossRef CAS.
- R. Noto, P. L. Meo, M. Gruttadauria and G. Werber, J. Heterocycl. Chem., 1999, 36, 667–674 CrossRef CAS.
- D. F. Evans, J. Chem. Soc., 1959, 2003–2005 RSC.
- C. R. Kowol, R. Berger, R. Eichinger, A. Roller, M. A. Jakupec, P. P. Schmidt, V. B. Arion and B. K. Keppler, J. Med. Chem., 2007, 50, 1254–1265 CrossRef CAS PubMed.
- M. Li, Q. Sun, Y. Bai, C. Duan, B. Zhang and Q. Meng, Dalton Trans., 2006, 2572–2578 RSC.
- R. Manikandan, P. Viswanathamurthi, K. Velmurugan, R. Nandhakumar, T. Hashimoto and A. Endo, J. Photochem. Photobiol., B, 2014, 130, 205–216 CrossRef CAS PubMed.
- G. Mahmoudi, A. Castiñeiras, P. Garczarek, A. Bauzá, A. L. Rheingold, V. Kinzhybalo and A. Frontera, CrystEngComm, 2016, 18, 1009–1023 RSC.
- J. García-Tojal, A. García-Orad, A. A. Díaz, J. L. Serra, M. K. Urtiaga, M. I. Arriortua and T. Rojo, J. Inorg. Biochem., 2001, 84, 271–278 CrossRef PubMed.
- W. R. P. Costa, R. A. C. Souza, V. M. Deflon and C. G. Oliveira, Transition Met. Chem., 2020, 45, 511–521 CrossRef CAS.
- J. García-Tojal, J. L. Pizarro, L. Lezama, M. I. Arriortua and T. Rojo, Inorg. Chim. Acta, 1998, 278, 150–158 CrossRef.
- T. Sarkar, S. Banerjee and A. Hussain, RSC Adv., 2015, 5, 29276–29284 RSC.
- A. Okuniewski, D. Rosiak, J. Chojnacki and B. Becker, Polyhedron, 2015, 90, 47–57 CrossRef CAS.
- A. W. Addison, T. N. Rao, J. Reedijk, J. Van Rijn and G. C. Verschoor, J. Chem. Soc., Dalton Trans., 1984, 1349–1356 RSC.
- D. Kovala-Demertzi, J. R. Miller, N. Kourkoumelis, S. K. Hadjikakou and M. A. Demertzis, Polyhedron, 1999, 18, 1005–1013 CrossRef CAS.
- C. M. Almeida, J. G. M. De Carvalho, M. Fujimori, E. L. França, A. C. Honorio-França, R. L. T. Parreira, R. P. Orenha and C. C. Gatto, Struct. Chem., 2020, 31, 2093–2103 CrossRef CAS.
- R. Gil-García, R. Fraile, B. Donnadieu, G. Madariaga, V. Januskaitis, J. Rovira, L. González, J. Borrás, F. J. Arnáiz and J. García-Tojal, New J. Chem., 2013, 37, 3568–3580 RSC.
- A. Jiménez-Pérez, S. Fernández-Fariña, R. Pedrido and J. García-Tojal, J. Biol. Inorg. Chem., 2024, 29, 3–31 CrossRef PubMed.
- O. Dömötör, N. V. May, K. Pelivan, T. Kiss, B. K. Keppler, C. R. Kowol and É. A. Enyedy, Inorg. Chim. Acta, 2018, 472, 264–275 CrossRef.
- É. A. Enyedy, M. F. Primik, C. R. Kowol, V. B. Arion, T. Kiss and B. K. Keppler, Dalton Trans., 2011, 40, 5895–5905 RSC.
- C. Basu, S. Chowdhuri and S. Mukherjee, Indian J. Chem., Sect. A: Inorg., Bio-inorg., Phys., Theor. Anal. Chem., 2006, 45, 1126–1130 Search PubMed.
- S. Chandra, N. Gupta and L. K. Gupta, Synth. React. Inorg. Met.-Org. Chem., 2004, 34, 919–927 CrossRef CAS.
- S. A. Cockle, Biochem. J., 1974, 137, 587–596 CrossRef CAS PubMed.
- B. K. Santra and G. K. Lahiri, J. Chem. Soc., Dalton Trans., 1998, 139–146 RSC.
- J. C. Noveron, R. Herradora, M. M. Olmstead and P. K. Mascharak, Inorg. Chim. Acta, 1999, 285, 269–276 CrossRef CAS.
- D. R. Richardson, P. C. Sharpe, D. B. Lovejoy, D. Senaratne, D. S. Kalinowski, M. Islam and P. V. Bernhardt, J. Med. Chem., 2006, 49, 6510–6521 CrossRef CAS PubMed.
- M. N. M. Milunović, A. Dobrova, G. Novitchi, N. Gligorijević, S. Radulović, J. Kožišek, P. Rapta, E. A. Enyedy and V. B. Arion, Eur. J. Inorg. Chem., 2017, 4773–4783 CrossRef.
- K. Ohui, I. Stepanenko, I. Besleaga, M. V. Babak, R. Stafi, D. Darvasiova, G. Giester, V. Pósa, E. A. Enyedy, D. Vegh, P. Rapta, W. H. Ang, A. Popović-Bijelić and V. B. Arion, Biomolecules, 2020, 10, 1336 CrossRef CAS PubMed.
- R. H. Shoemaker, Nat. Rev. Cancer, 2006, 6, 813–823 CrossRef CAS PubMed.
- E. A. Brooks, S. Galarza, M. F. Gencoglu, R. C. Cornelison, J. M. Munson and S. R. Peyton, Philos. Trans. R. Soc., B, 2019, 374, 20180226 CrossRef CAS PubMed.
- P. Verdier-Pinard, J. A. Kepler, G. R. Pettit and E. Hamel, Mol. Pharmacol., 2000, 57, 180–187 CrossRef CAS PubMed.
- R. Bai, M. C. Edler, P. L. Bonate, T. D. Copeland, G. R. Pettit, R. F. Ludueña and E. Hamel, Mol. Pharmacol., 2009, 75, 218–226 CrossRef CAS PubMed.
- E. Hamel, Cell Biochem. Biophys., 2003, 38, 1–22 CrossRef CAS PubMed.
- P. Verdier-Pinard, J.-Y. Lai, H.-D. Yoo, J. Yu, B. Marquez, D. G. Nagle, M. Nambu, J. D. White, J. R. Falck, W. H. Gerwick, B. W. Day and E. Hamel, Mol. Pharmacol., 1998, 53, 62–76 CrossRef CAS PubMed.
- A. E. Prota, F. Danel, F. Bachmann, K. Bargsten, R. M. Buey, J. Pohlmann, S. Reinelt, H. Lane and M. O. Steinmetz, J. Mol. Biol., 2014, 426, 1848–1860 CrossRef CAS PubMed.
- C. Eurtivong, V. Semenov, M. Semenova, L. Konyushkin, O. Atamanenko, J. Reynisson and A. Kiselyov, Bioorg. Med. Chem., 2017, 25, 658–664 CrossRef CAS PubMed.
- G. Jones, P. Willett, R. C. Glen, A. R. Leach and R. Taylor, J. Mol. Biol., 1997, 267, 727–748 CrossRef CAS PubMed.
- M. D. Eldridge, C. W. Murray, T. R. Auton, G. V. Paolini and R. P. Mee, J. Comput.-Aided Mol. Des., 1997, 11, 425–445 CrossRef CAS PubMed.
- M. L. Verdonk, J. C. Cole, M. J. Hartshorn, C. W. Murray and R. D. Taylor, Proteins, 2003, 52, 609–623 CrossRef CAS PubMed.
- O. Korb, T. Stützle and T. E. Exner, J. Chem. Inf. Model., 2009, 49, 84–96 CrossRef CAS PubMed.
- W. T. M. Mooij and M. L. Verdonk, Proteins, 2005, 61, 272–287 CrossRef CAS PubMed.
- Z. Wang, H. Sun, X. Yao, D. Li, L. Xu, Y. Li, S. Tian and T. Hou, Phys. Chem. Chem. Phys., 2016, 18, 12964–12975 CAS.
- C. Bissantz, G. Folkers and D. Rognan, J. Med. Chem., 2000, 43, 4759–4767 CrossRef CAS PubMed.
- A. L. Spek, J. Appl. Crystallogr., 2003, 36, 7–13 CrossRef CAS.
- G. M. Sheldrick, Acta Crystallogr., Sect. A: Found. Crystallogr., 2008, 64, 112–122 CrossRef CAS PubMed.
- M. N. Burnett and C. K. Johnson, ORTEP-III: Oak Ridge Thermal Ellipsoid Plot Program for crystal structure illustrations, 1996 Search PubMed.
- S. Stoll and A. Schweiger, J. Magn. Reson., 2006, 178, 42–55 CrossRef CAS PubMed.
- S.-T. Von, H.-L. Seng, H.-B. Lee, S.-W. Ng, Y. Kitamura, M. Chikira and C.-H. Ng, J. Biol. Inorg. Chem., 2012, 17, 57–69 CAS.
- Y. Saito, Y. Taniguchi, S. Hirazawa, Y. Miura, H. Tsurimoto, T. Nakayoshi, A. Oda, E. Hamel, K. Yamashita, M. Goto and K. Nakagawa-Goto, Eur. J. Med. Chem., 2021, 222, 113578 CrossRef CAS PubMed.
- H. M. Berman, Nucleic Acids Res., 2000, 28, 235–242 CrossRef CAS PubMed.
- H. Berman, K. Henrick and H. Nakamura, Nat. Struct. Mol. Biol., 2003, 10, 980–980 CrossRef CAS PubMed.
Footnote |
| † Electronic supplementary information (ESI) available: Experimental detail, tables and figures with structural, analytical, spectroscopic (NMR and UV–vis), mass-spectrometric and biological data, as well as molecular docking calculation details. CCDC 2354137–2354144. For ESI and crystallographic data in CIF or other electronic format see DOI: https://doi.org/10.1039/d4dt01469c |
| This journal is © The Royal Society of Chemistry 2024 |