DOI:
10.1039/D4DT01187B
(Paper)
Dalton Trans., 2024,
53, 11736-11749
High-contrast multi-surface imaging of latent fingerprints using color-tunable YOF:Tb3+,Eu3+ ultrafine nanophosphors with high quantum yield†
Received
22nd April 2024
, Accepted 6th June 2024
First published on 21st June 2024
Abstract
Visualization of latent fingerprints (LFPs) using conventional powders has faced challenges on multicolor surfaces. However, these challenges are addressed by the advent of fluorescent powders in LFP detection, and they have redefined the effectiveness of the powder dusting method. In this study, color-tunable YOF:Tb3+,Eu3+ nanophosphors were examined for LFP recognition and were evaluated for their practicality on different types of surfaces. Under 254 nm UV irradiation, the LFPs developed using these nanophosphors showed clear and distinct ridge patterns with level 1, 2, and 3 details. The ultrafine particles of these nanophosphors adhered to the ridge patterns and replicated the minutiae of the LFPs. Meanwhile, the variation of the Tb3+/Eu3+ ratio demonstrated multicolor fluorescence emission from the nanophosphors, which provided better contrast between the ridge patterns on complex surfaces. Furthermore, the high luminescence quantum yield of the nanophosphors ensured high-resolution fluorescence images of the LFPs with a well-defined pattern that was recognizable even without any microscope or sophisticated instrumentation.
1. Introduction
Latent fingerprints (LFPs) are crucial in forensic investigations for identifying suspects and providing strong physical evidence connecting the suspects to a crime scene. The majority of perpetrators unknowingly leave their fingerprints at crime scenes, which are collected by forensic experts to help the detectives solve the mystery. However, these fingerprints are mostly latent, which makes them difficult to recognize with the naked eye and requires additional processing to make them visible.1–3
LFPs are the impressions left by the friction ridges over the fingertip upon its contact with a surface when handled with bare hands. Human hands and feet release secretions like sweat, oil, sebum, etc. from their eccrine glands.4 These secretions are released through pores present on the friction ridges and leave traces on the surface when a finger touches them, thus forming a pattern. These are very fine and invisible patterns and hence, called “latent”. Every individual has a unique pattern of ridges on the fingers, which are invariable throughout their life. Therefore, accurate identification of fingerprints is crucial for proving the innocence or guilt of a suspect.5,6 Unlike patent and plastic fingerprints, LFPs cannot be observed by the naked eye and hence they are difficult to investigate. There are several methods for visualizing LFPs such as chemical staining, equipment analysis, and powder dusting.7–11 Chemical staining and equipment analysis methods are less preferred as they suffer from certain limitations. The equipment analysis method requires bulky and expensive instruments such as Raman spectrometers, Fourier-transform infrared (FTIR) spectrometers, etc., which are impractical for most applications.12 On the other hand, the chemical staining method includes ninhydrin spraying, cyanoacrylate fuming, silver nitrate soaking, etc. Herein, the chemicals used are toxic and can be hazardous to the users. Among all the LFP visualization methods, the powder dusting method is strongly preferred. In this method, two types of powders are used namely regular and metallic powders. Regular powder consists of resinous polymers, whereas metallic powders consist of silver, lead, and gold compounds.11 Nevertheless, the fingerprints developed using these powders showed low contrast with coloured substrates and were accompanied by high background interference. Commercially used powders are non-fluorescent, due to which they show low contrast and less sensitivity on colorful and complex surfaces.12 On the contrary, fluorescent powders of uniform particle size distribution offer high contrast, lower background interference, and high resolution owing to their intense fluorescence emission. Fluorescent powders with brighter intensity are more effective while acquiring the minutiae of details from the LFPs. Organic fluorescent compounds are also used for detecting LFPs, but they are least applicable for porous and reflective substrates.6 On the other hand, inorganic nanophosphors doped with lanthanide ions (Eu3+, Tb3+, Ce3+, Dy3+, etc.) can resolve this issue and hence these are extensively explored for the detection of LFPs. In majority of the published reports, phosphors with a single-color glow were employed for LFP detection.13–17 However, in our study, the emission colours can be tuned by adjusting the ratio of Eu3+/Tb3+ concentrations. Colour-tunable phosphors ensure ultra-sensitive recognition of LFPs with reduced background interference and improved accuracy.18 This enables the selection of the optimal emission color for enhanced visualisation of LFP ridge patterns on various background surfaces. This also enhances the imaging contrast remarkably and provides great versatility in forensic analysis by adapting to different types of surfaces and lighting conditions. On some dark substrates, green-emitting phosphors can show high contrast and the LFP images will clearly show the flow of colored ridges and colorless furrows. On the other hand, on a light background red-emitting phosphors will be better suited for exhibiting the detailed features of an LFP.
Lanthanide (Ln3+) ions are bio-compatible and relatively non-toxic.19 Inorganic nanophosphors, doped with Ln3+ ions and having uniformly sized particles, can act as potential candidates for LFP detection by employing the powder dusting method. CaGdAlO4:Eu3+,12 La2ZnTiO6:Eu3+,20 Ln3+:Y2Zr2O7/SiO2 (Ln3+ = Eu3+,Tb3+),21 Y4Zr3O12:Eu3+,22 CaLa2ZnO5:Eu3+,23 CaZrO3:Tb3+,24 La10W22O81:Eu3+,25 Sr2NaMg2V3O12:Sm3+/Eu3+,26 SrAl2O4:Eu2+,Dy3+,27 GdOF:Eu3+/Tb3+,28etc. are some of the phosphors that have been reported for fingerprint detection. Among all the existing host matrices, rare-earth oxyfluorides (REOF) are specifically preferred owing to their simple synthesis protocols, low toxicity, and low production cost. Oxyfluorides have low phonon energies and therefore, their radiative energy transfers are more prominent leading to intense fluorescence emission.29 YOF is a well-known rare-earth oxyfluoride host lattice suitable for accommodating the rare earth ions, with the least structural distortion. YOF has a wide energy band gap (4.92 eV) (Data retrieved from the Materials Project for YOF (mp-3637) from database version v2023.11.1.),30 high chemical and thermal durability,31 and can be synthesized in various morphologies by adopting different synthesis routes such as the hydrothermal method,32 sol–gel method,33 precipitation synthesis,34 pyrolysis,35 vacuum hot-press sintering method,36etc. However, most of the synthesis methods previously reported followed a long reaction time, non-uniform heating of the precursor solution, or a complicated synthesis process, which in turn, provided difficulty in controlling the particle size, a low yield of the phosphor, and non-uniformity in its morphology. Microwave-assisted hydrothermal synthesis (MWHS) is a rapid approach employed for the formation of uniform nano-sized particles. In this study, YOF:Eu3+, YOF:Tb3+, and YOF:Tb3+,Eu3+ nanophosphors were synthesized by the MWHS method. An energy transfer scheme from Tb3+ to Eu3+ was introduced in the YOF lattice for generating color-tuning from green to red. The variation of Tb3+/Eu3+ ions provided better contrast and color selectivity, which facilitated high-resolution latent fingerprint recognition with negligible background interference. Further, the use of these nanophosphors provided enhanced LFP visualization due to their high photoluminescence quantum yield (PLQY) close to unity.
2. Experimental
2.1 Chemicals
Y(NO3)3·6H2O (99.98%, Sigma-Aldrich), Tb(NO3)3·5H2O (99.9%, Sigma-Aldrich), Eu(NO3)3·5H2O (99.9%, Sigma-Aldrich), and NH4F (ACS reagent, ≥98.0%, Sigma-Aldrich) and Polyethylene Glycol (PEG) – 6000 (Merck) were used as the starting materials without further purification.
2.2 Synthesis
Y1−(0.01+x)OF:0.01Tb3+,xEu3+ (x = 0, 0.001, 0.002, 0.005, 0.01, and 0.02) and Y1−(y+0.01)OF:yTb3+,0.01Eu3+ (y = 0, 0.001, 0.002, 0.005, 0.01, and 0.02) nanophosphors were synthesized by a microwave-assisted hydrothermal method. Stoichiometric quantities of Y(NO3)3·6H2O, Tb(NO3)3·5H2O, and Eu(NO3)3·5H2O were weighed and transferred to a beaker and dissolved in double-distilled water. This solution was kept for stirring on a magnetic stirrer. PEG was added to this solution with continued stirring. NH4F solution (separately prepared in double-distilled water) was injected into this solution. After homogeneous mixing of all the precursors, an ammonia hydroxide (NH4OH) solution (25% in water) was added to maintain the pH value at 4. This addition led to the formation of a white slurry-like solution, which was then transferred to the polytetrafluoroethylene (PTFE) vessels of an Anton Paar multiwave pro microwave reactor with a microwave frequency of 2.4 GHz. The reactor system was programmed to attain 90 °C and the temperature was maintained for 30 minutes. After cooling back to 55 °C, the precipitates were collected from the reactor, and washed with distilled water and ethanol in a centrifuge for 15 minutes at 6000 RPM. The precipitates were dried overnight in a freeze-dryer (Operon, South Korea) at −94 °C, and the dried samples were calcined at 700 °C for 4 h in a Carbolite muffle furnace in air atmosphere, which was operating at a heating rate of 3 °C min−1. Finally, the furnace was allowed to cool to room temperature and the final products were collected for further characterization.
2.3 Instrumentation and characterisation
A D8 Advance diffractometer (Bruker, Germany) producing Cu-Kα radiation (λ = 1.5406 Å) from a Cu-anode, operating at 40 kV voltage and 40 mA current, was used to record the X-ray powder diffraction (XRPD) patterns. The patterns were recorded from 10° to 80° with a step size of 0.02. The morphological images were recorded with a JEOL, JSM 7800 F field emission scanning electron microscope (FE-SEM). Energy-dispersive X-ray spectroscopy (EDS) and elemental mapping were also recorded on the same system. Diffuse reflectance spectra (DRS) were recorded using a PerkinElmer Lambda 950 UV-VIS-NIR spectrophotometer. Fourier transform infrared (FTIR) spectra were recorded on a Bruker Tensor 27 IR. X-ray photoelectron spectra (XPS) were recorded on PHI 5000 scanning ESCA microprobe. The details of the XPS measurements are described elsewhere.37 The photoluminescence (PL) emission and excitation spectra were recorded on an Edinburgh FS5 spectrophotometer with a 150 W xenon arc lamp as a source. PL decay was recorded on the same system using a pulsed microsecond flash lamp. The PL quantum yield (PLQY) was measured using the FLS980 spectrometer incorporated with an integrating sphere. The details of the setup are discussed elsewhere.38 The photographs of the phosphor-dusted latent fingerprint images were captured on a Canon DSLR camera with an EF-S 18–55 mm f/3.5–5.6 III lens configuration.
3. Results and discussion
3.1 Structural and morphological analysis
The XRPD patterns of YOF:0.01Tb3+,xEu3+ (0 ≤ x ≤ 0.02) and YOF:yTb3+,0.01Eu3+ (0 ≤ y ≤ 0.02) nanophosphors are shown in Fig. 1(a) and (c), respectively. These diffraction patterns matched well with the trigonal phase of YOF with space group R![[3 with combining macron]](https://www.rsc.org/images/entities/char_0033_0304.gif) m, which is specified in the standard JCPDS file No. 071-2100. There were no impurity reflections observed in the patterns and hence all the nanophosphors were confirmed to be single phase. The absence of impurity phases provided strong evidence for the successful incorporation of the Tb3+ and Eu3+ ions in the host lattice. Fig. 1(b) and (d) show the magnified XRPD patterns in the range from 27.6° to 29.2°. The position of the reflections slightly shifted towards the 2θ angle due to doping. This shift was found to increase with the doping concentrations in both cases, which gave reliable evidence about the expansion of the unit cell due to the introduction of the Tb3+ and Eu3+ ions in the host lattice. The YOF lattice is composed of Y3+, F−, and O2− ions, which occupy the 6c Wyckoff positions with C3v site symmetry in the trigonal unit cell. Y3+ is coordinated to four F− and four O2− ions in a bicapped antiprism arrangement.39 The Y3+-sites (coordination number, CN = 8) are the only available sites that can accommodate the Tb3+ and Eu3+ ions owing to their similar valency and ionic radii (r). The eight coordinated Tb3+ (r = 1.04 Å) and Eu3+ (r = 1.066 Å) ions are slightly larger than the Y3+ (r = 1.019 Å) ion. The substitution of such larger rare earth ions at a smaller ionic site led to the expansion of the unit cell, which resulted in the shifting of the reflection positions towards a lower angle.40 The FE-SEM images of YOF:0.01Tb3+, YOF:0.01Eu3+, YOF:0.01Tb3+,0.005 Eu3+ and YOF:0.005Tb3+,0.01Eu3+ nanophosphors are shown in Fig. S1.† All the samples exhibited particles with a mixture of polygonal and ellipsoidal morphology. The nanophosphors showed aggregation of particles caused by the high calcination temperature (700 °C). The average particle sizes of the nanophosphors were determined by plotting the histograms using the log–normal distribution of the particle sizes as shown in Fig. S2.† The average size of the particles ranged between 45 and 85 nm, which renders these nanophosphors suitable for latent fingerprint detection. It should be noted that the size of the sweat pores varies from 66 to 287 μm in females and 69 to 284 μm in males.41 Therefore, these materials should provide sufficient resolution for this specific application. The EDS data for the nanophosphors is shown in Fig. S3.† EDS showed the presence of Y, O, F, Eu, Tb, Ir, and C elements. The presence of C can be attributed to the sample grid and the residues formed from the decomposition of PEG, whereas Ir can be attributed to the electrically conducting thin layer coating sputtered over the samples for SEM imaging. Although PEG completely decomposes at 700 °C, the residual carbon and oxygen may not be completely removed from the surface and may lead to the formation of stable carbonaceous residues on the material surface. The presence of carbon was confirmed from the FTIR spectra (shown in Fig. S5†), wherein the absorption at 1013, 1054, and 2359 cm−1 can be indexed to the surface carbonate species.42 No other impurity elements were detected in the EDS. Fig. S4† shows the elemental mapping of the nanophosphors, wherein the constituent elements were found to be uniformly distributed over the sample surface.
m, which is specified in the standard JCPDS file No. 071-2100. There were no impurity reflections observed in the patterns and hence all the nanophosphors were confirmed to be single phase. The absence of impurity phases provided strong evidence for the successful incorporation of the Tb3+ and Eu3+ ions in the host lattice. Fig. 1(b) and (d) show the magnified XRPD patterns in the range from 27.6° to 29.2°. The position of the reflections slightly shifted towards the 2θ angle due to doping. This shift was found to increase with the doping concentrations in both cases, which gave reliable evidence about the expansion of the unit cell due to the introduction of the Tb3+ and Eu3+ ions in the host lattice. The YOF lattice is composed of Y3+, F−, and O2− ions, which occupy the 6c Wyckoff positions with C3v site symmetry in the trigonal unit cell. Y3+ is coordinated to four F− and four O2− ions in a bicapped antiprism arrangement.39 The Y3+-sites (coordination number, CN = 8) are the only available sites that can accommodate the Tb3+ and Eu3+ ions owing to their similar valency and ionic radii (r). The eight coordinated Tb3+ (r = 1.04 Å) and Eu3+ (r = 1.066 Å) ions are slightly larger than the Y3+ (r = 1.019 Å) ion. The substitution of such larger rare earth ions at a smaller ionic site led to the expansion of the unit cell, which resulted in the shifting of the reflection positions towards a lower angle.40 The FE-SEM images of YOF:0.01Tb3+, YOF:0.01Eu3+, YOF:0.01Tb3+,0.005 Eu3+ and YOF:0.005Tb3+,0.01Eu3+ nanophosphors are shown in Fig. S1.† All the samples exhibited particles with a mixture of polygonal and ellipsoidal morphology. The nanophosphors showed aggregation of particles caused by the high calcination temperature (700 °C). The average particle sizes of the nanophosphors were determined by plotting the histograms using the log–normal distribution of the particle sizes as shown in Fig. S2.† The average size of the particles ranged between 45 and 85 nm, which renders these nanophosphors suitable for latent fingerprint detection. It should be noted that the size of the sweat pores varies from 66 to 287 μm in females and 69 to 284 μm in males.41 Therefore, these materials should provide sufficient resolution for this specific application. The EDS data for the nanophosphors is shown in Fig. S3.† EDS showed the presence of Y, O, F, Eu, Tb, Ir, and C elements. The presence of C can be attributed to the sample grid and the residues formed from the decomposition of PEG, whereas Ir can be attributed to the electrically conducting thin layer coating sputtered over the samples for SEM imaging. Although PEG completely decomposes at 700 °C, the residual carbon and oxygen may not be completely removed from the surface and may lead to the formation of stable carbonaceous residues on the material surface. The presence of carbon was confirmed from the FTIR spectra (shown in Fig. S5†), wherein the absorption at 1013, 1054, and 2359 cm−1 can be indexed to the surface carbonate species.42 No other impurity elements were detected in the EDS. Fig. S4† shows the elemental mapping of the nanophosphors, wherein the constituent elements were found to be uniformly distributed over the sample surface.
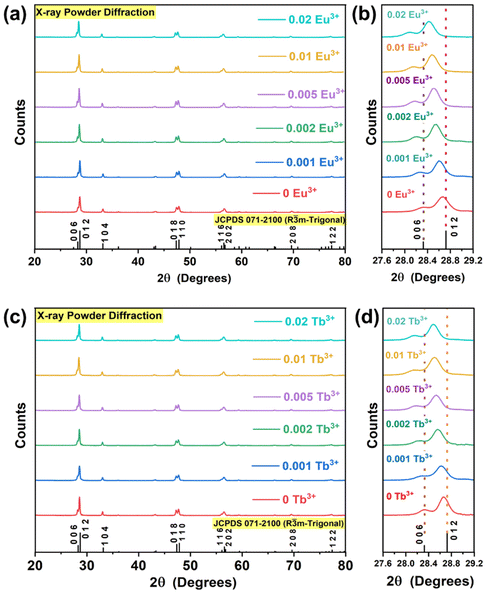 |
| | Fig. 1 XRPD patterns for YOF:0.01Tb3+,xEu3+ (0 ≤ x ≤ 0.02) nanophosphors in the: (a) full range, and (b) Magnified in the range from 27.6° to 29.2°. XRPD patterns for YOF:yTb3+,0.01Eu3+ (0 ≤ y ≤ 0.02) nanophosphors in the: (c) full range, and (d) magnified in the range from 25° to 33°. | |
3.2 Optical properties
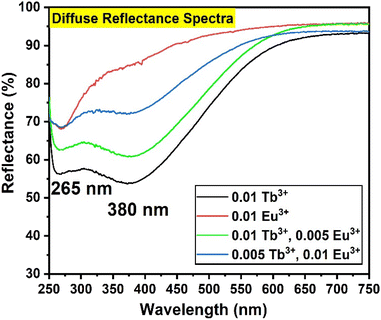
The DRS of the prepared nanophosphors is shown in Fig. 2. YOF:0.01Eu3+ nanophosphor showed a strong absorption band in the UV region peaking at 265 nm, which can be attributed to the absorption by the host lattice. In addition, certain narrow absorption bands were observed due to the 4f–4f transitions of Eu3+ at 393 and 467 nm. The samples with only Eu3+-doping appeared bright white and they did not show any major broadband absorption in the visible region. However, the samples doped with Tb3+ ions were ivory-white due to their absorption in the visible region. In addition to the host absorption at 265 nm, the samples of YOF:0.01Tb3+, YOF:0.01Tb3+,0.005 Eu3+, and YOF:0.005Tb3+,0.01 Eu3+ nanophosphors showed absorption at 380 nm that extended from UV to the visible region. This additional absorption in the visible region cannot be attributed to Tb3+ ions, but it is due to Tb4+ ions. This absorption occurred due to the low-energy 4fn−1 → 4fn−25d absorption of Tb4+ ions. This indicates the co-existence of Tb4+ and Tb3+ ions in the nanophosphor.43 The occurrence of Tb4+ ions can be attributed to the calcination of YOF at 700 °C in an air atmosphere. Although the existence of optically inactive Tb4+ ions is undesirable for luminescence applications, it is not feasible to avoid their occurrence in the case of YOF-based nanophosphors due to the mandatory calcination step adopted during the synthesis. One way to restrict the conversion of Tb3+ to Tb4+ is by annealing them in a reducing atmosphere. Nevertheless, this can lead to oxygen-deficient/fluorine-rich YO1−δF1+δ phases. Further, reducing the samples containing Eu3+ ions would have resulted in the reduction of Eu3+ to Eu2+ and completely changed the luminescence profile of the nanophosphors. Therefore, the samples were not subjected to any further heat treatment to reduce the Tb4+ ions. The optical band gap (Eopt) of the nanophosphors was calculated using the eqn (1).44where, α is the absorption coefficient, hν is the energy of the incident photon (in eV), B is the proportionality constant and n = ½ for direct transition. Since the Kubelka–Münk function| |  | (2) |
 |
| | Fig. 2 DRS spectra for (a) YOF:0.01Tb3+, (b) YOF:0.01Eu3+, (c) YOF:0.01Tb3+,0.005Eu3+, and (d) YOF:0.005Tb3+,0.01Eu3+ nanophosphors. | |
derived from the reflectance (R∞) of an infinitely thick sample is proportional to the absorption coefficient, the optical band gap was obtained by plotting (F(R∞)·hν)2 against hν as shown in Fig. S6.†![[thin space (1/6-em)]](https://www.rsc.org/images/entities/char_2009.gif) 45–47 At the point of inflection of the curve, a tangent was drawn and extrapolated to the x-axis at y = 0. The optical band gap for YOF:0.01Eu3+ nanophosphor was found to be 4.1 eV which is approximately near the energy band gap of pristine YOF.48 However, the introduction of Tb3+ ions produced a sudden drop in the optical band gap values for the other three samples and they returned a value of 2.67 eV, which can be solely attributed to the absorption edge in the visible region due to Tb4+ ions.43
45–47 At the point of inflection of the curve, a tangent was drawn and extrapolated to the x-axis at y = 0. The optical band gap for YOF:0.01Eu3+ nanophosphor was found to be 4.1 eV which is approximately near the energy band gap of pristine YOF.48 However, the introduction of Tb3+ ions produced a sudden drop in the optical band gap values for the other three samples and they returned a value of 2.67 eV, which can be solely attributed to the absorption edge in the visible region due to Tb4+ ions.43
3.3 XPS analysis
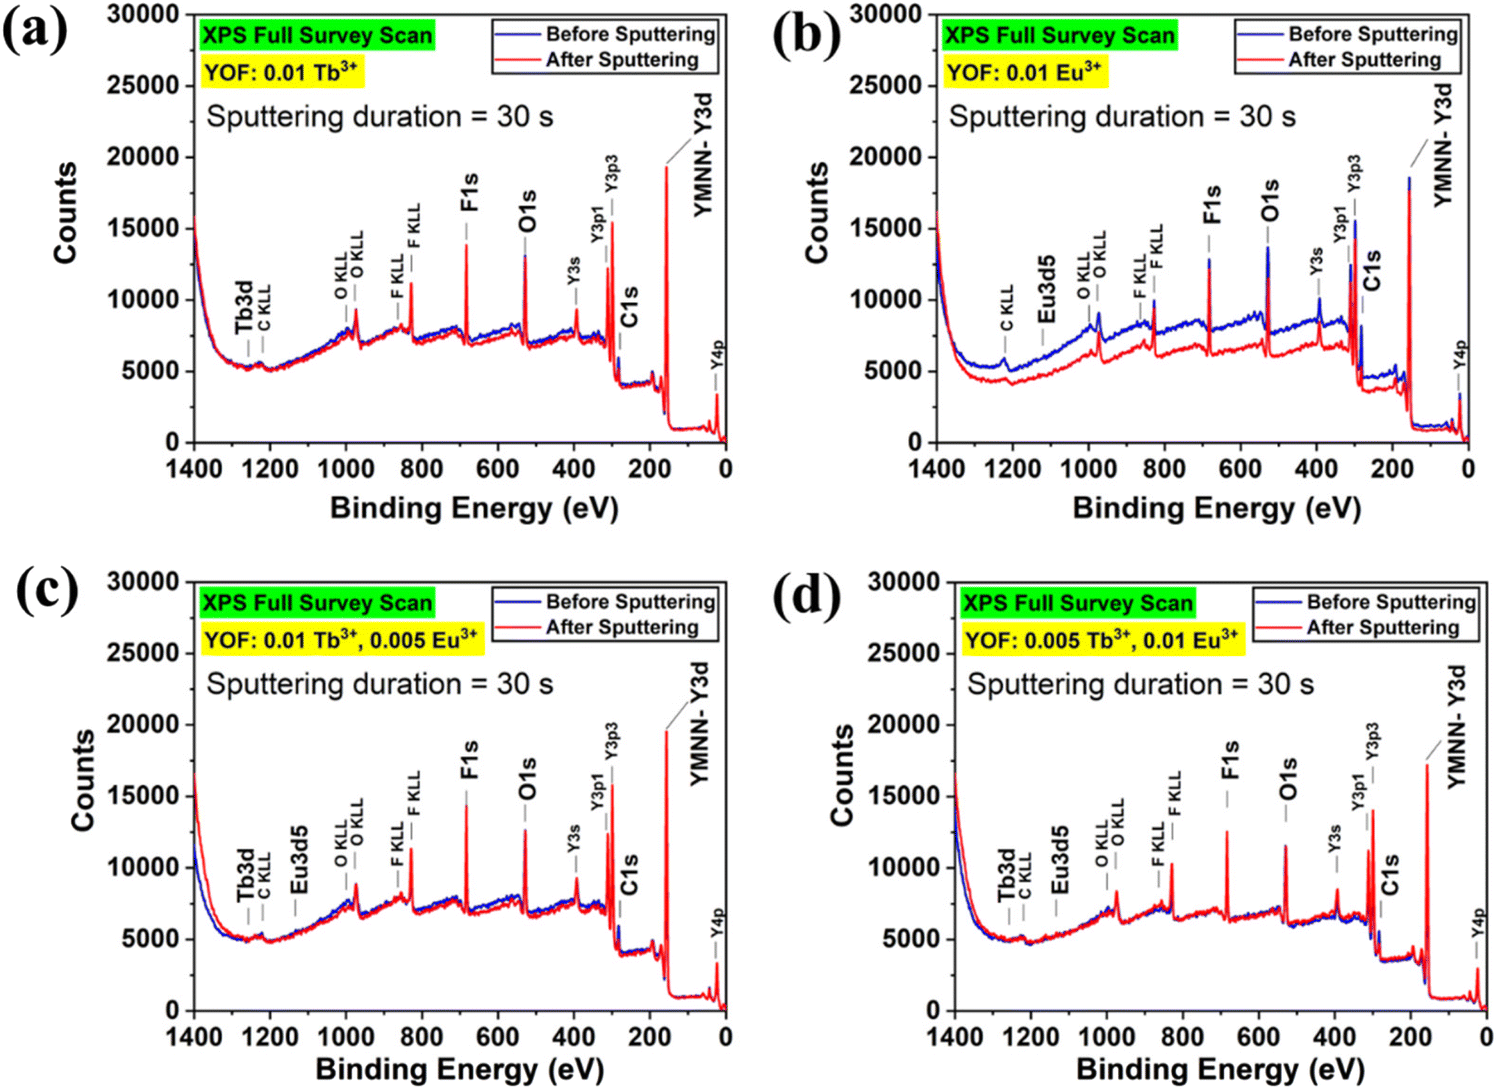
XPS analyses were performed to confirm the presence of Tb4+ ions in the as-prepared nanophosphors. The full-survey scans of YOF:0.01Tb3+, YOF:0.01Eu3+, YOF:0.01Tb3+,0.005Eu3+, and YOF:0.005Tb3+,0.01Eu3+ nanophosphors were recorded for their pristine form and after a sputter removal of 30s, as shown in Fig. 3. The samples were sputtered using an Ar+ ion gun (2 kV, 2 μA) at a rate of 12 nm per min to obtain the depth profile of the samples. The spectra were corrected for the binding energy (BE) charge by adjusting the charge correction for adventitious carbon to the reference value (284.8 eV). Although the full-survey scans showed the peaks corresponding to the major constituent elements (Y, O, and F), it was difficult to detect the peaks corresponding to Tb and Eu. It is assumed that the low concentrations of the dopants (Tb and Eu) were not enough to be traceable by XPS. The high-resolution scans were conducted for the C 1s, Y 3d, O 1s, F 1s, Tb 3d, Eu 3d, and Tb 4d core levels of the nanophosphors, as shown in Fig. S7–S10.† However, only Y 3d, O 1s, F 1s and C 1s core levels were detected with enough counts. Tb 3d and Eu 3d core levels showed very weak signals due to their lower concentrations in the samples. Further, Tb 4d signals were untraceable in the high-resolution scans due to their signals being overshadowed by the Y 3d signals.
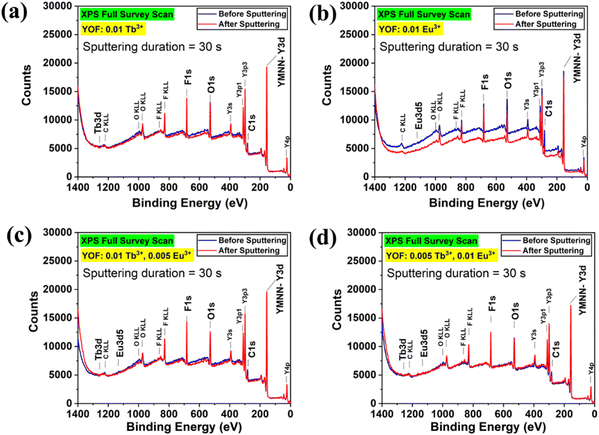 |
| | Fig. 3 XPS full survey scan spectra for (a) YOF:0.01Tb3+, (b) YOF:0.01Eu3+, (c) YOF:0.01Tb3+,0.005Eu3+, and (d) YOF:0.005Tb3+,0.01Eu3+ nanophosphors. | |
The signals obtained for the core levels of Y 3d, F 1s, and O 1s were fitted using XPSPeak 41 software, as shown in Fig. S11, S12, and S13.† However, the data obtained for Tb 3d, Tb 4d, and Eu 3d were not suitable for the mathematical fitting of component peaks due to their poor energy resolution and insufficient signal-to-noise ratios. The Y 3d signal curves were fitted with two sets of doublet peaks corresponding to the 3d3/2 and 3d5/2 spin–orbit coupling. These peaks showed an intensity ratio of 3:2 and were separated by an energy difference of approximately 2 eV. The two sets of doublet peaks can be attributed to the two different environments experienced by Y3+ ions due to the Y–F and Y–O bonding, respectively.49 The F 1s signals were fitted by a single peak at 685.2 eV corresponding to the lattice fluorine. The signals obtained for the O 1s core levels were fitted with three peaks. The peak at 529.5 can be attributed to the oxygen present in the crystal lattice. This is evident from the consistent intensity of this peak before and after the sputter etching of the surface. On the other hand, the other two peaks (∼531.5 eV and 532.5 eV) showed a decrease in their intensity after sputtering, indicating that they correspond to the oxygen on the surface. The peak at 531.5 eV corresponds to the surface oxygen, which may have been adsorbed by the surface of the nanophosphors. The peak at 532.5 eV corresponds to the residual oxygen left behind by the decomposition of the PEG during calcination.
3.4 Steady-state and time-resolved photoluminescence analysis
Fig. 4 shows the PL excitation and emission spectra of YOF:0.01Tb3+, YOF:0.01Eu3+, YOF:0.01Tb3+,0.005Eu3+, and YOF:0.005Tb3+,0.01Eu3+ nanophosphors. The PL excitation spectra of YOF:0.01Tb3+ showed an intense band situated at 241 nm that corresponds to the spin-allowed 4f8 → 4f75d transition. In comparison to this excitation band, the line strengths for the intraconfigurational 4f–4f excitation bands of Tb3+ were very weak. Hence, they were ignored during this study. YOF:0.01Eu3+ also showed an intense broad excitation band peaking at 241 nm corresponding to the charge transfer (CT) from O2− to Eu3+. In this case, too, the excitation peaks due to the intraconfigurational 4f–4f transitions were very weak and negligible compared to the CT band. Due to the spectral overlap of the 4f–5d transition of Tb3+ and the CT band of Eu3+ at 241 nm, it became convenient to obtain the emission spectra for both cases by maintaining a common excitation wavelength. In the case of codoped nanophosphors, the samples with dominant Tb3+ concentration exhibited an excitation band resembling the 4f–5d band of Tb3+, whereas the samples with dominant Eu3+ concentration demonstrated a prominent CT band in their excitation spectra. Consequently, the excitation band peaking at 241 nm for YOF:0.01Tb3+,0.005Eu3+ and YOF:0.005Tb3+,0.01Eu3+ nanophosphors showed a prominent 4f–5d band and CT band, respectively.
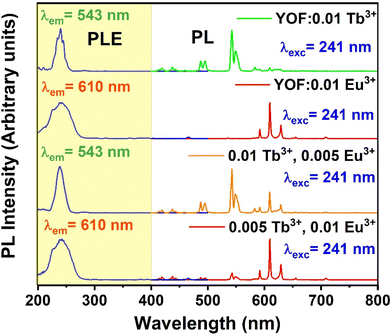 |
| | Fig. 4 PL excitation and emission spectra of: (a) YOF:0.01Tb3+, (b) YOF:0.01Eu3+, (c) YOF:0.01Tb3+,0.005Eu3+, (d) YOF:0.005Tb3+,0.01Eu3+ nanophosphors. | |
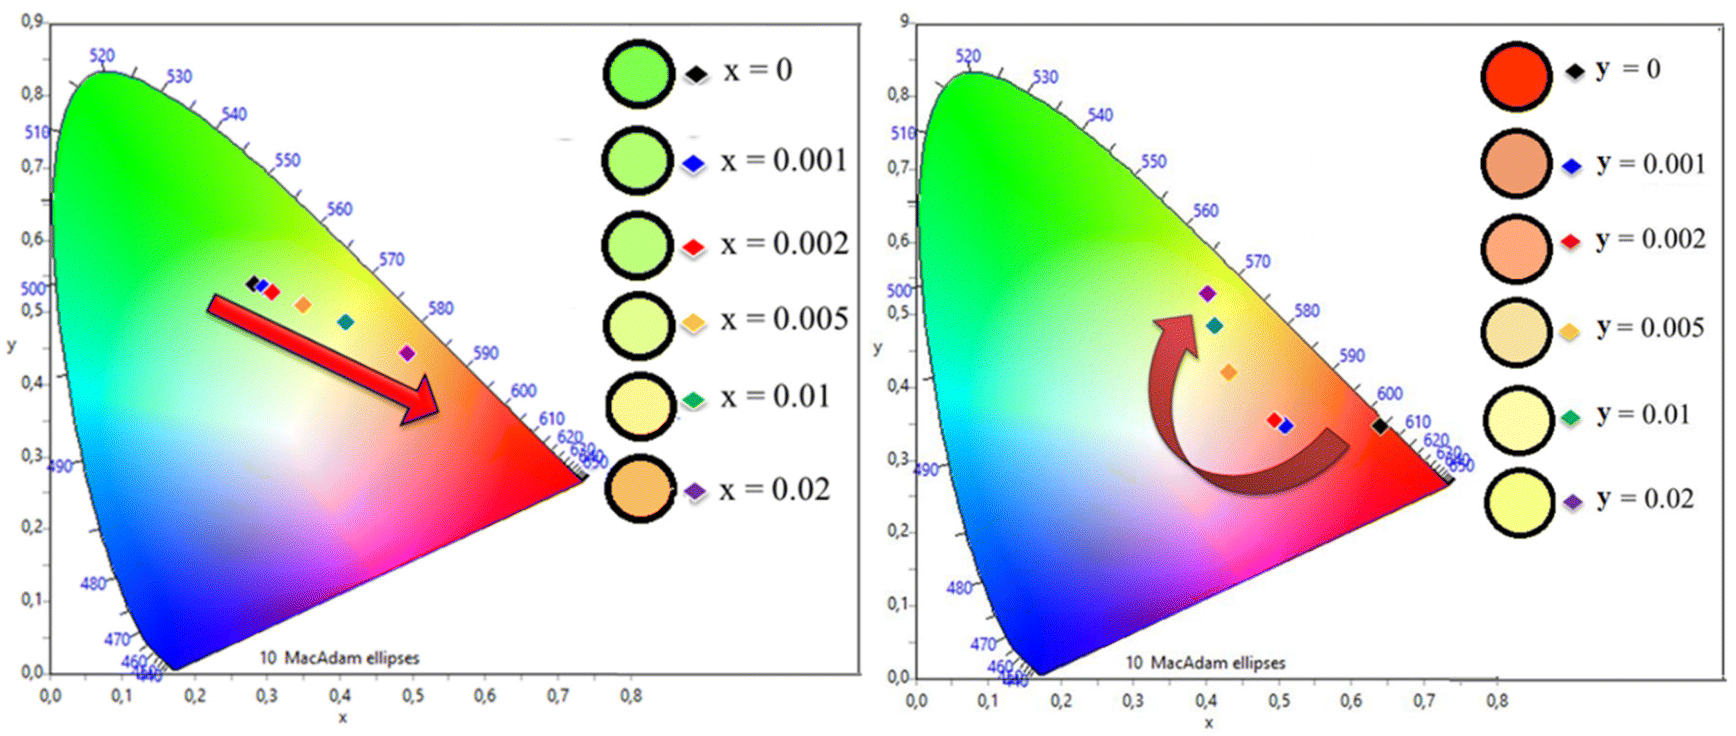
The PL emission spectra were recorded using excitation at 241 nm. The PL emission spectra of YOF:0.01Tb3+ showed several sharp peaks in the blue and green regions located at 419, 438, 488 (peak splitting at 495 nm), 543 (peak splitting at 550 nm), 583, and 611 nm. corresponding to 5D3 → 7F1, 5D3 → 7F2, 5D4 → 7F6, 5D4 → 7F5, 5D4 → 7F4 and 5D4 → 7F3 (intra-configurational 4f–4f) transitions of Tb3+ ions, respectively.50 The emission centered at 543 nm was the strongest and hence, YOF:0.01Tb3+ showed green colour emission. The PL emission spectra of YOF:0.01Eu3+ showed intense emission peaks corresponding to the 5D0 → 7F1 (592 nm), 5D0 → 7F2 (610 and 629 nm), 5D0 → 7F3 (655 nm), and 5D0 → 7F4 (709 nm), transitions of Eu3+ ions, respectively. The characteristics observed in the registered spectra resembled those that are typically observed for oxyfluorides with the Rm space group, where Eu3+ is situated at a low symmetry C3v site.51 Due to the occupancy of Eu3+ ions at low inversion symmetry sites, the induced electric dipole transition (5D0 → 7F2) became dominant in the spectra.52 The emission spectra of YOF:0.01Tb3+,0.005Eu3+ and YOF:0.005Tb3+,0.01Eu3+ nanophosphors showed the peaks corresponding to both Tb3+ and Eu3+ ions in the green and red regions, respectively. The intensity of the green and red emission lines varied with the concentration variation of Tb3+ and Eu3+ ions, as clearly observed in Fig. 5 which shows the PL emission spectra of YOF:0.01Tb3+,xEu3+ (0 ≤ x ≤ 0.02) and YOF:yTb3+,0.01Eu3+ (0 ≤ y ≤ 0.02) nanophosphors. The Commission Internationale de l'Eclairage (CIE)-1931 chromaticity diagram plotted for the YOF:0.01Tb3+,xEu3+ (0 ≤ x ≤ 0.02) and YOF:yTb3+,0.01Eu3+ (0 ≤ y ≤ 0.02) nanophosphors, shown in Fig. 6, reveals the color shift of the emission as the Tb3+ and Eu3+-concentrations were varied. The corresponding chromaticity coordinates are listed in Tables S1 and S2.† The color coordinates traversed across the green, yellow, orange and red regions, thereby, making them suitable for multicolor imaging of latent fingerprints on different backgrounds. The color-tuning of the emissions was primarily controlled by altering the Tb3+/Eu3+ ratio.
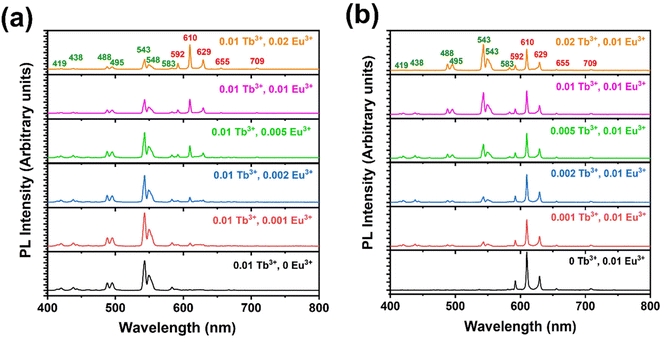 |
| | Fig. 5 PL emission spectra of (a) YOF:0.01 Tb3+,x Eu3+ (0 ≤ x ≤ 0.02), and (b) YOF:y Tb3+,0.01 Eu3+ (0 ≤ y ≤ 0.02) nanophosphors excited at 241 nm. | |
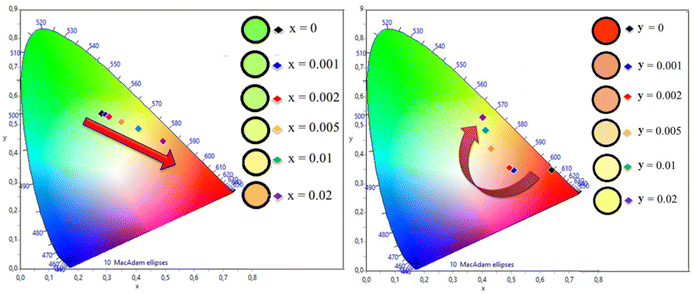 |
| | Fig. 6 CIE 1931 chromaticity diagram for: (a) YOF:0.01Tb3+,xEu3+ (0 ≤ x ≤ 0.02) nanophosphors, and (b) YOF:yTb3+,0.01Eu3+ (0 ≤ y ≤ 0.02) nanophosphors, excited at 241 nm. | |
An intuitive evaluation of the performance of the phosphor material is necessary to judge its suitability for latent fingerprint detection. Photoluminescence quantum yield (PLQY), which is the ratio of the number of emitted photons to that of the absorbed ones, acts as a reference standard to assess the quality of the luminescent materials. High PLQY materials are always preferred for luminescence applications, but due to the presence of defects and high phonon energy in phosphor materials, it is often a daunting task to achieve high numbers of PLQY from them. However, YOF: Tb3+,Eu3+ nanophosphors showed exceptionally high PLQY upon excitation at 241 nm, as shown in Fig. S14.† The absolute PLQY for the nanophosphors was recorded on Edinburgh FLS 980 installed with an integrating sphere using the direct excitation method. The internal quantum efficiency (IQE) values were recorded to be 100%, 75%, 100%, and 83%, respectively, for YOF:0.01Tb3+, YOF:0.01Eu3+, YOF:0.01Tb3+,0.005Eu3+, and YOF:0.005Tb3+,0.01Eu3+ nanophosphors. Their respective external quantum efficiency (EQE) values were found to be 56%, 44%, 59%, and 43%, respectively. Such exceptionally high PLQY assures effortless collection and visualization of latent fingerprints from surfaces with different contrasts. A comparison has been made between the internal and external quantum efficiencies of these nanophosphors with previously reported values of similar types of phosphors in Table 1.
Table 1 Comparison of the IQE and EQE of different phosphors with that of YOF:Tb3+,Eu3+ nanophosphors
| Sr. No. |
Phosphor |
IQE (%) |
EQE (%) |
Ref. |
| 1. |
YOF:0.01Tb3+ |
100 |
56 |
This study |
| 2. |
YOF:0.01Eu3+ |
75 |
44 |
This study |
| 3. |
YOF:0.01Tb3+,0.005Eu3+ |
100 |
59 |
This study |
| 4. |
YOF:0.005Tb3+,0.01Eu3+ |
83 |
43 |
This study |
| 5. |
Ca2ZrSi4O12:Ce3+,Tb3+ |
59.2 |
32.7 |
53
|
| 6. |
Sr2MgB2O6:0.05Ce3+,0.05Tb3+ |
66.39 |
48.92 |
54
|
| 7. |
NaBaBO3:0.01Ce3+,0.03Tb3+ |
57 |
36 |
55
|
| 8. |
Sr3La(PO4)3:Bi3+,Eu3+ |
— |
25.4 |
56
|
| 9. |
Ca3LiSbO6:0.04Eu3+,0.008Mn4+ |
78.96 |
68.49 |
57
|
| 10. |
Ca2LaHf2Al3O12:Ce3+,Tb3+ |
80 |
59.2 |
58
|
| 11. |
NaBaScSi2O7:Eu2+ |
65 |
— |
59
|
| 12. |
Na3Sc2(PO4)3:0.03Ce3+,0.1Tb3+ |
65 |
— |
60
|
| 13. |
Sr2LiScB4O10:0.03Ce3+,0.20Tb3+ |
45.87 |
— |
61
|
| 14. |
Sr4Ce0.1Tb0.4Na0.5B3O9F |
57 |
— |
62
|
| 15. |
LiCa(Y0.79Ce0.01Tb0.2)5(BO3)6 |
89 |
— |
63
|
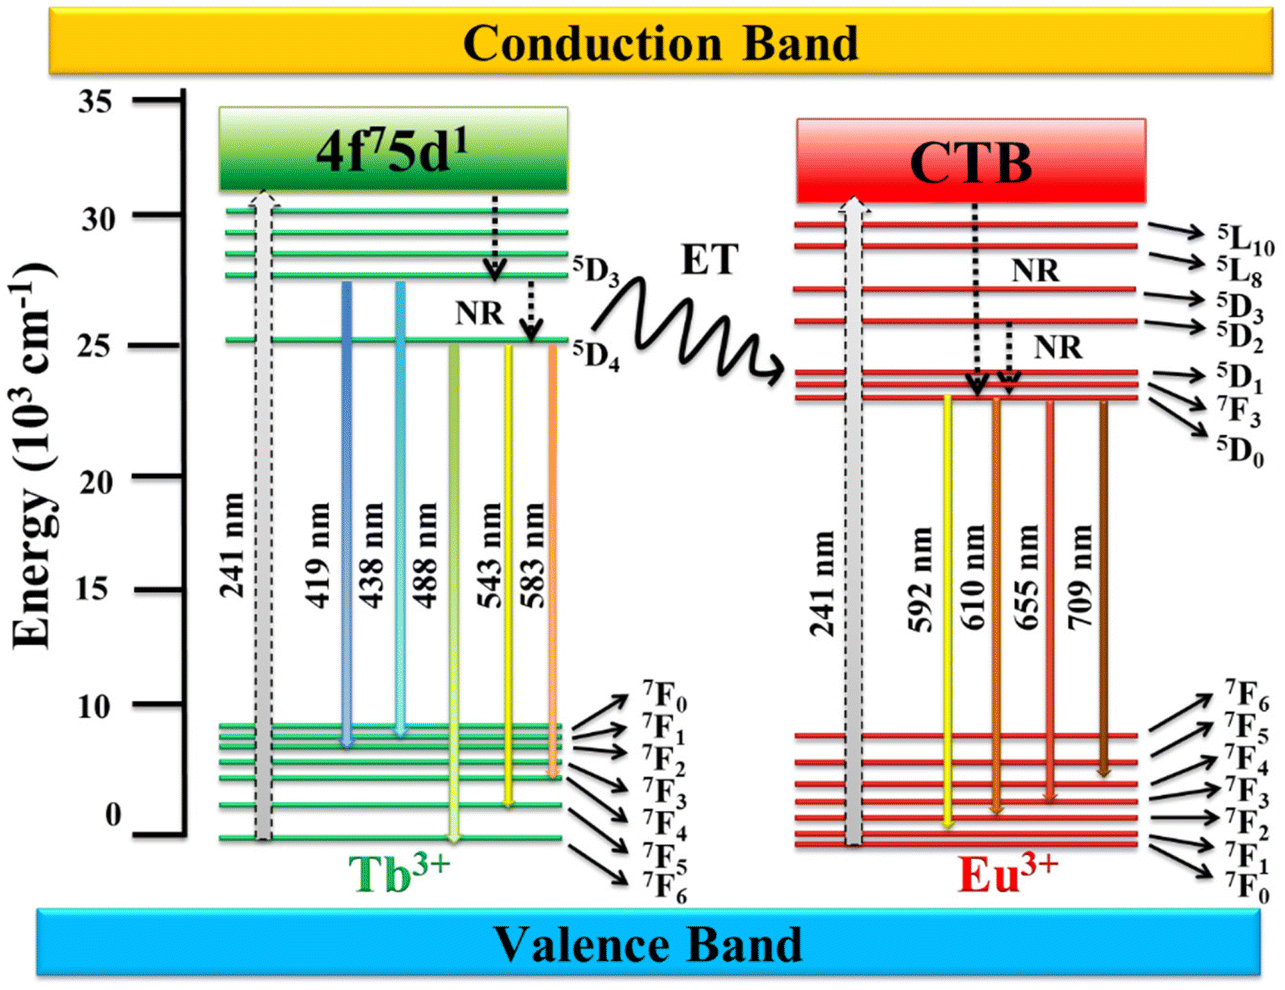
Fig. 7 represents the proposed mechanism for the energy transfer process and electronic transitions in YOF:Tb3+,Eu3+ nanophosphor. When the nanophosphor is exposed to UV radiations (241 nm), Tb3+ ions absorb this energy through their spin-allowed 4f8 → 4f75d transition. Simultaneously, Eu3+ absorb this energy through their Eu3+−O2− charge transfer (CT) transition. The excited electrons in the 5d energy levels of Tb3+ relaxes to the 5D3 and 5D4 states of Tb3+, whereas the excited electrons in the CT band of Eu3+ ions relax to their 5D0 state by non-radiative multistep relaxation. Some of the excited electrons in the 5Dj=3,4 levels of Tb3+ radiatively relax to the 7Fj=1,2,4,5,6 states to produce their characteristic emissions in the blue and green regions. However, the radiative emissions in the green region are more intense than the blue emissions indicating that the transitions from 5D4 to 7Fj=4,5,6 are more prominent in the YOF lattice. While some of the excited electrons from the 5Dj=3,4 levels of Tb3+ return to their ground state, some others are transferred to the 5D1 level of Eu3+ by cross-relaxation. At the same time, the excitation energy gained by the CT band of Eu3+ is also transferred to the 5D1 level by non-radiative relaxation. The energy accumulated at the 5D1 level relaxes to the 5D0 level, which acts as the emitting state for Eu3+ ions. The radiative transitions from the 5D0 to 7Fj=1,2,3,4 levels give rise to the orange and red emissions of Eu3+. The energy transfer from Tb3+ to Eu3+ is the key factor responsible for the enhancement of the Eu3+ emissions in the red region. By altering the concentration of Tb3+/Eu3+ color tuning can be achieved from green to red.64,65
 |
| | Fig. 7 Schematic representation of the energy level diagram showing the possible energy transfer pathways from Tb3+ to Eu3+ in YOF nanophosphor (ET = Energy transfer, CTB = Charge transfer band, NR = Non-radiative). | |
The room temperature PL decay curves for the 543 and 610 nm emissions of YOF:0.01Tb3+,xEu3+ (0 ≤ x ≤ 0.02) nanophosphors under 241 nm excitation are shown in Fig. 8. These decay curves demonstrated the energy transfer process between Tb3+ and Eu3+ ions. The decay curves showed a mono-exponential behaviour and were fitted well by a single-exponential function as shown in eqn (3):
| |  | (3) |
where,
I is the radiative decay intensity at time
t after the pulsed excitation,
I0 is the initial intensity,
τ is the decay lifetime. The estimated decay lifetime values for all the samples are given in Tables S3 and S4.
† From
Fig. 8(a), the
5D
4 state of Tb
3+ (543 nm emission) rapidly decayed with the increase in Eu
3+ concentration. On the contrary, the
5D
0 state of Eu
3+ (610 nm emission) slowly decayed with the increase in Eu
3+ concentration as shown in
Fig. 8(b). This clearly indicates an obvious energy transfer from Tb
3+ to Eu
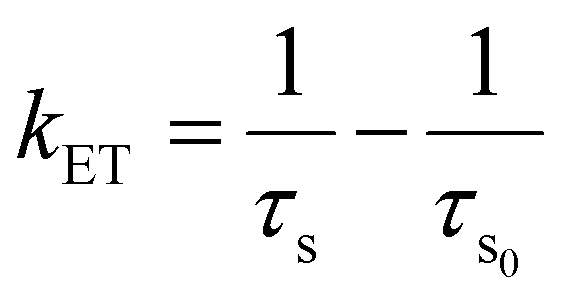
3+ ions. The energy transfer efficiency (
η) was calculated from
eqn (4):
| |  | (4) |
where,
τs0 and
τs are the corresponding lifetimes of the donor Tb
3+ in the absence and the presence of the acceptor Eu
3+ ions, respectively. Furthermore, the energy-transfer rate (
kET) was estimated using
eqn (5).
64| |  | (5) |
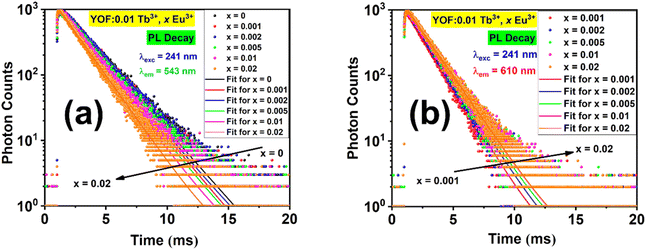 |
| | Fig. 8 PL decay curves and their exponential fits obtained by exciting YOF:0.01Tb3+,xEu3+ (0 ≤ x ≤ 0.02) nanophosphors at 241 nm and monitoring the emissions at: (a) 543 and (b) 610 nm. | |
The variation in energy transfer efficiency and rate with the activator-ion concentration is shown in Fig. S15,† and their values are calculated and listed in Table 2.66–68 It was observed that the probability and efficiency of energy transfer increased with the increasing activator ion (Eu3+) concentration and attained a maximum efficiency value of (20 ± 0.03)% at 0.02 mol fraction of Eu3+.
Table 2 Decay time (τ), energy transfer efficiency (η) and rate (kET) values obtained from the PL decay curves of YOF:0.01Tb3+,xEu3+ (0 ≤ x ≤ 0.02) nanophosphors excited at 241 nm and monitored at 543 nm
| Eu3+ concentration |
Decay time, τ (ms) |
η (%) |
Energy transfer rate, kET (ms−1) |
|
x = 0 |
2.05 ± 0.003 |
0 |
0 |
|
x = 0.001 |
1.97 ± 0.003 |
4.0 ± 0.006 |
0.020 ± 5 × 10⁻⁵ |
|
x = 0.002 |
1.92 ± 0.003 |
6.5 ± 0.009 |
0.034 ± 10−4 |
|
x = 0.005 |
1.88 ± 0.003 |
8.3 ± 0.01 |
0.044 ± 10−4 |
|
x = 0.01 |
1.77 ± 0.003 |
14 ± 0.02 |
0.078 ± 2 × 10⁻⁴ |
|
x = 0.02 |
1.65 ± 0.003 |
20 ± 0.03 |
0.120 ± 3 × 10⁻⁴ |
3.5 Latent fingerprint (LFP) detection
For the fingerprint detection evaluation, the latent fingerprints were developed on different kinds of surfaces. The right-hand thumb of a female volunteer (aged 32) was gently rubbed on her forehead and then pressed on substrates such as glass slides, plastic, stainless steel, silicon wafer, glossy paper, and aluminium foil. Thereafter, the nanophosphors were gently dusted on the thumb impressions using a round-tip paintbrush (size 6). The excessive nanophosphor powders were blown away using an air blower that is used for cleaning a camera lens. The photographs of the LFPs were captured under a 254 nm emitting mercury-vapour UV lamp. A 550 nm long-pass filter was adjusted near the lens of the camera to prevent the NUV and blue emissions of the UV lamp from interfering with the image quality and contrast.
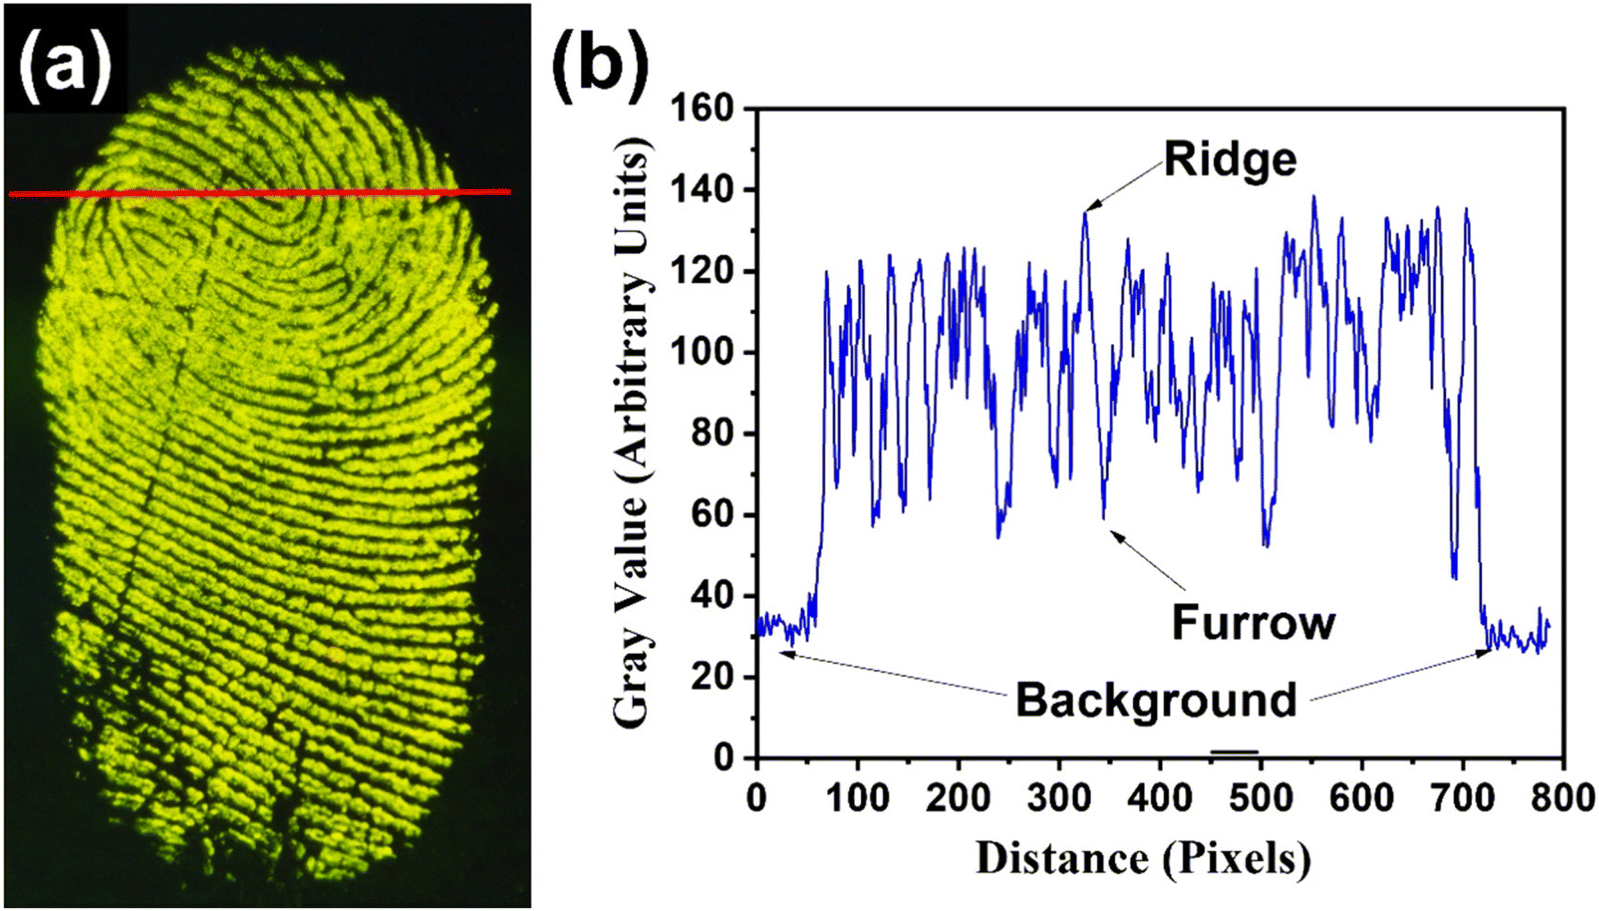
The color-tunable YOF:0.01Tb3+,xEu3+ (0 ≤ x ≤ 0.02), and YOF:0.01Eu3+ nanophosphors were selected for developing the LFPs on non-porous glass substrates, as shown in Fig. 9. Irrespective of the background color, these nanophosphors provided high contrast and resolution of the fingerprint ridge particulars without compromising on any other features of the LFPs. In fact, these nanophosphors have an advantage over conventionally used metallic powders as the latter was found to produce poor visibility over dark background surfaces. On the contrary, the color-tunable nanophosphors produced high fluorescence brightness that enabled superior fingerprint recognition and its analysis with ultrafine details. As shown in Fig. 9, the ultrafine nanophosphor particles are homogeneously distributed along the ridges of the fingerprints producing clear ridge flow with high contrast and resolution in the fluorescence images obtained under 254 nm illumination. Even in the bright-field images, the nanophosphors produced reasonable contrast for visualizing the patterns in the LFPs (Fig. S16†). Due to the intense color-tunable fluorescence emanating from the nanophosphors, there was a remarkable enhancement in the contrast which aided in distinguishing between the bright ridges and the dark furrows. This confirmed that the dusted nanophosphors readily stained the papillary ridges of the LFPs and avoided staining the background or the furrows. To identify the sensitivity of the LFPs, a pixel profile of the fingerprint core was recorded across a segment drawn over a section of one of the LFPs, as shown in Fig. 10. The ridges and furrows present in the LFPs can be clearly differentiated from the gray values obtained across this section. The interference from the background was at its minimum which added to the accuracy of the LFP recognition.
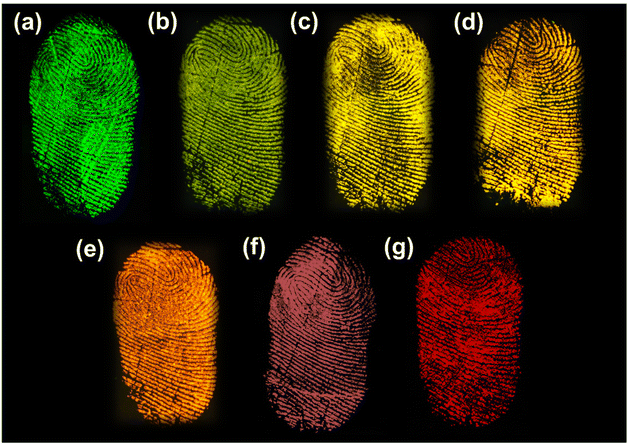 |
| | Fig. 9 Digital photographs of fluorescence images of LFPs developed on glass substrates using color-tunable YOF:0.01Tb3+,xEu3+ nanophosphors observed under a 254 nm mercury vapour lamp, where (a) x = 0, (b) x = 0.001, (c) x = 0.002, (d) x = 0.005, (e) x = 0.01, (f) x = 0.02 and (g) YOF:0.01Eu3+. | |
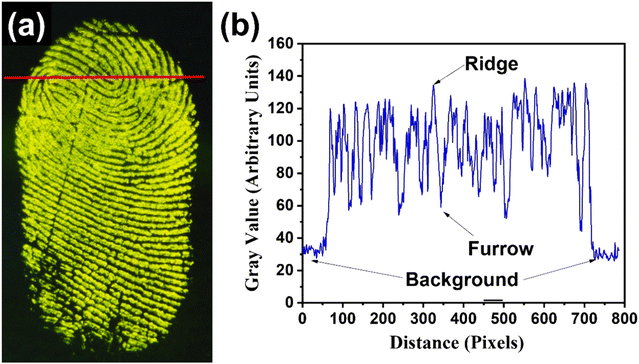 |
| | Fig. 10 (a) Digital photograph of the latent fingerprint developed on a glass substrate using YOF:0.01Tb3+,0.002Eu3+ nanophosphor observed under a 254 nm mercury vapour lamp. (b) Variation of the gray value for the ridges and furrows observed in the fingerprints across the red line indicated in (a). | |
The sensitivity of the nanophosphors was determined by enlarging the LFPs and closely examining the minutiae details as shown in Fig. 11. Three levels of identification describe the uniqueness of an LFP. The pattern and the ridge flow of the LFPs are grouped under level 1 features, whereas the level 2 features are inclusive of the ridge bifurcations, ridge endings, core, lake, island, cross-over, scar and crease. All these features were clearly identified in Fig. 11 without the need for a microscope. Level 3 features are the most difficult to recognize by normal identification techniques, and they comprise the sweat pores on the finger. These are rarely visible in LFPs, but they carry vital information desirable for the recognition of individuals responsible for this finger impression. By dusting the YOF:Tb3+,Eu3+ nanophosphors on the LFPs, all the major identification levels were successfully identified. The sweat pores are also clearly visible in the enlarged image as shown in Fig. 11, which is vital for the isolation of an individual bearing this unique fingerprint. Furthermore, the practicality of employing these nanophosphors for LFP detection was confirmed by developing the fingerprints on various types of surfaces as shown in Fig. 12. The fingerprints were developed on several non-porous and semi-porous surfaces such as glossy paper, scratched stainless steel spatula, aluminium foil, a plastic optical mouse, glass slides, a silicon wafer with (1 1 1) plane orientation, and plastic blocks. These surfaces were dusted with YOF:0.01Tb3+,0.02Eu3+ nanophosphors as a representative specimen and observed under a 254 nm UV lamp. The details of the LFPs can be easily recognized from these surfaces even by the unaided eyes, thus, guaranteeing the practicality of these nanophosphors for LFP detection. Moreover, the sensitivity, color-tunable fluorescence signals, and ultrafine particle size of these nanophosphors add to the accuracy of LFP identification for forensic studies.
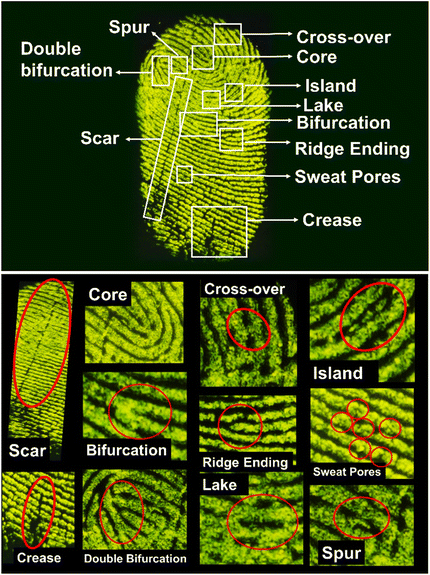 |
| | Fig. 11 Levels 1, 2, and 3 details of the LFPs developed on a glass substrate using YOF:0.01Tb3+,0.002Eu3+ nanophosphor observed under a 254 nm mercury vapour lamp. These images show minutiae details such as (1) scar, (2) crease, (3) core, (4) bifurcation, (5) double bifurcation, (6) cross-over, (7) ridge ending, (8) lake, (9) island, (10). sweat pores, and (11) spur. | |
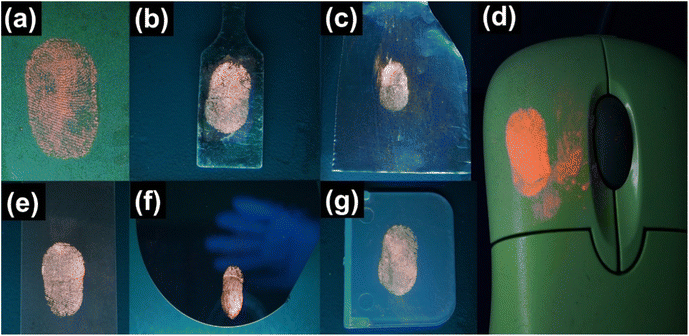 |
| | Fig. 12 Digital photographs of fluorescence images of LFPs developed using YOF:0.01Tb3+,0.02Eu3+ nanophosphors on: (a) glossy paper, (b) stainless steel with scratches, (c) aluminium foil, (d) plastic optical mouse, (e) glass slide (f) silicon wafer, and (g) plastic surfaces. The LFPs were observed under the 254 nm mercury vapor lamp and the images were captured without using any filters. | |
4. Conclusion
Ultrafine YOF:Tb3+,Eu3+ nanophosphors were successfully synthesized by a microwave-assisted hydrothermal method. X-ray powder diffraction patterns confirmed the crystallization of the as-prepared samples into a trigonal crystal system (Rm space group). The incorporation of the Tb3+ and Eu3+ ions caused shifting of the reflection angles to lower diffraction values, thereby confirming their substitution at the smaller Y3+ site. The nanophosphors showed rich color-tuning fluorescence signals ranging from green to red under 241 nm UV excitation, owing to the variable composition of Tb3+ and Eu3+ ions. The ultrafine particles of the nanophosphors proved to be a perfect agent for detecting latent fingerprints under a 254 nm mercury-vapour lamp. Strong fluorescence signals were observed from the LFPs developed on different surfaces, which further benefitted from the high quantum yield values (close to unity) of the nanophosphors. The observed LFPs demonstrated a clear distinction between the ridges and the furrows, as well as the sweat pores that add to the level 3 features required for identifying the individuals responsible for the fingerprints. While dealing with complicated backgrounds with multicolor surfaces, it was possible to obtain higher contrast LFPs in the fluorescence images by employing a suitable nanophosphor with a rich fluorescence signal from the as-prepared series.
The main advantage of using these color-tunable luminescent materials instead of conventional powders for LFP detection is the increase in contrast between the ridges and the background. Conventional powders work because the incoming light (usually in the form of chromatic visible light) is scattered from the rough surface of the powder. However, this is accompanied by the reflection of the same incoming light from both the surrounding surfaces and the background of the fingerprint itself. This becomes a significant issue when the background surface is very reflective. In the case of the luminescent material, it could be tailored to be excited by light outside of the visible range. This has the advantage that the camera system does not detect the excitation light reflected from the background, while the visible luminescence from the luminescent material can be detected. Luminescent materials can be either excited using ultraviolet or infrared radiation. In the case of ultraviolet radiation, a down-shifting or down-converting luminescent material could be used, and in the case of infrared excitation, an upconverting material. However, in the latter case, there are certain disadvantages since upconverting materials have a nonlinear response to excitation flux. Also, the silicon-based CCD sensors in cameras are sensitive to infrared radiation (<1100 nm), which leads to the detection of excitation light. This could be accounted for by adding a filter in front of the detection system; however, this adds complexity and cost, and to some extent, makes using a luminescent material dubious. Therefore, the optimum situation is to use a material with a broad excitation in the ultraviolet region, which could be excited by the most economically available UV lamps. Camera sensors have limited sensitivity in this region. The luminescent material should then re-emit in the visible region for detection by the human eye or a camera system. The human eye and camera sensors have good spectral sensitivity in the green region (500 to 600 nm). Therefore, tailoring the material to emit in this region is a good idea. These conditions are satisfied by the YOF:Tb3+,Eu3+ nanophosphors, which are color-tunable and excitable by UV radiation. This suggests the suitability and practicality of the prepared nanophosphors for facile and rapid detection of latent fingerprints in forensic laboratories.
Author contributions
S. T. conceived and designed the work, conducted the experiments and wrote the original draft; G. B. N. conducted the experiments and characterizations, wrote the original draft; R. E. K. conducted the PLQY measurements, reviewed and edited the draft; L. J. B. E. captured and processed the fingerprint images, reviewed and edited the draft; H. C. S. supervised the work, acquired funding, resources for the experiments, and reviewed and edited the draft. All authors have given approval to the final version of the manuscript.
Data availability
The data supporting this article have been included as part of the ESI.† The fingerprint data was obtained with the volunteer's consent and is intended exclusively for publication. Sharing this data is prohibited as it could infringe on the individual's privacy rights.
Conflicts of interest
The authors declare no competing financial interest. Some rights are reserved for the graphical abstract and figures containing images of fingerprints. Permission must be sought by the consenting author/owner before being reproduced.
Acknowledgements
This research is supported by the South African Research Chairs Initiative of the Department of Science and Technology and National Research Foundation of South Africa (Grant 84415). The PL system used is supported by the rental pool programme of the National Laser Centre (NLC) and funded by the National Research Foundation of South Africa (Grant No. EQP14080486021 and 93214). The financial assistance from the University of the Free State is highly recognized.
References
- Z. Qiu, B. Hao, X. Gu, Z. Wang, N. Xie, J. W. Y. Lam, H. Hao and B. Z. Tang, Sci. China: Chem., 2018, 61, 966–970 CrossRef CAS.
- C. Yuan, M. Li, M. Wang and L. Zhang, Dyes Pigm., 2018, 153, 18–25 CrossRef CAS.
- N. Harshita, R. Shweta, R. Kapil, K. Chanchal and M. Rakesh, J. Forensic Sci. Res., 2022, 6, 045–048 CrossRef.
- G. Rajkumar, V. Ponnusamy, G. Kanmani and A. Anitha, Ceram. Int., 2023, 49, 7223–7235 CrossRef CAS.
- O. P. Jasuja, G. S. Bumbrah and R. M. Sharma, Res. Rep. Forensic Med. Sci., 2016, 6, 39–50 Search PubMed.
- D. Chávez, C. R. Garcia, J. Oliva and L. A. Diaz-Torres, Ceram. Int., 2021, 47(1), 10–41 CrossRef.
- S. Saharan, A. K. Yadav and B. Yadav, Egypt. J. Forensic Sci., 2020, 10, 16 CrossRef.
- K. Cao and A. K. Jain, IEEE Trans. Pattern Anal. Mach. Intell., 2019, 41, 788–800 Search PubMed.
- M. Chhabra, K. K. Ravulakollu, M. Kumar, A. Sharma and A. Nayyar, Neural Comput. Appl., 2023, 35, 6471–6497 CrossRef.
-
A. Makrushin, M. Hildebrandt, R. Fischer, T. Kiertscher, J. Dittmann and C. Vielhauer, “Advanced techniques for latent fingerprint detection and validation using a CWL device”, Proc. SPIE 8436, Optics, Photonics, and Digital Technologies for Muktinedia Applications II, 2012, p. 84360V, DOI:10.1117/12.922235.
- G. S. Sodhi and J. Kaur, Forensic Sci. Int., 2001, 120, 172–176 CrossRef CAS PubMed.
- J. Y. Park, J. W. Chung, S. J. Park and H. K. Yang, J. Alloys Compd., 2020, 824, 153994 CrossRef CAS.
- D. Peng, S. He, Y. Zhang, L. Yao, W. Nie, Z. Liao, W. Cai and X. Ye, J. Mater., 2022, 8, 229–238 Search PubMed.
- N. Chamchoi, N. Sangwaranatee, R. Rajaramakrishna, H. J. Kim, O. Chaemlek, P. Limsuwan and J. Kaewkhao, Integr. Ferroelectr., 2022, 225, 160–172 CrossRef CAS.
- D. R. Lavanya, G. P. Darshan, J. Malleshappa, H. B. Premkumar, S. C. Sharma, S. A. Hariprasad and H. Nagabhushana, Sci. Rep., 2022, 12, 8898 CrossRef CAS PubMed.
- K. Tiwari, B. G. Sharma, N. Brahme, D. P. Bisen, T. Richhariya, A. Verma, S. Sahu, R. Tripathi and A. Sinha, ACS Appl. Opt. Mater., 2024, 2, 433–444 CrossRef CAS.
- J. Y. Park, J. Y. Jung and H. K. Yang, Mater. Res. Bull., 2024, 175, 112756 CrossRef CAS.
- J. Xu, B. Zhang, L. Jia, Y. Fan, R. Chen, T. Zhu and B. Liu, ACS Appl. Mater. Interfaces, 2019, 11, 35294–35304 CrossRef CAS PubMed.
- M. Gouiaa, I. Bennour, L. Rzouga Haddada, A. Toncelli, J. Xu, A. Mbarek, A. Moscardini, N. Essoukri Ben Amara and R. Maalej, Physica B: Condens. Matter, 2020, 582, 412009 CrossRef CAS.
- J. Y. Park and H. K. Yang, Mater. Today Commun., 2022, 31, 103391 CrossRef CAS.
- M. Saif, J. Lumin., 2013, 135, 187–195 CrossRef CAS.
- J. Y. Park and H. K. Yang, Dyes Pigm., 2017, 141, 348–355 CrossRef CAS.
- B. N. Swathi, B. R. R. Krushna, K. Manjunatha, S. Y. Wu, B. Subramanian, B. D. Prasad and H. Nagabhushana, Mater. Res. Bull., 2023, 165, 112279 CrossRef CAS.
- D. Navami, G. P. Darshan, D. R. Lavanya, H. B. Premkumar, S. C. Sharma, H. Adarsha, H. C. Prameela and H. Nagabhushana, Opt. Mater., 2021, 122, 111474 CrossRef CAS.
- K. N. Kumar, L. Vijayalakshmi, P. Hwang, A. D. Wadhwani and J. Choi, J. Alloys Compd., 2020, 840, 155589 CrossRef CAS.
- A. Bindhu, J. I. Naseemabeevi and S. Ganesanpotti, Mater. Adv., 2023, 4, 3796–3812 RSC.
- V. Sharma, A. Das and V. Kumar, Mater. Res. Express, 2016, 3, 015004 CrossRef.
- J. S. Revathy, M. Abraham, G. Jagannath, D. N. Rajendran and S. Das, J. Colloid Interface Sci., 2023, 641, 1014–1032 CrossRef CAS PubMed.
- R. Li, L. Li, W. Zi, J. Zhang, L. Liu, L. Zou and S. Gan, New J. Chem., 2015, 39, 115–121 RSC.
- J. M. Munro, K. Latimer, M. K. Horton, S. Dwaraknath and K. A. Persson, npj Comput. Mater., 2020, 6, 112 CrossRef.
- N. A. M. Saeed, E. Coetsee and H. C. Swart, Opt. Mater., 2022, 131, 112655 CrossRef CAS.
- Q. Han, Y. Zou, H. Wu, Y. Song, Y. Wang and X. Zhang, J. Lumin., 2020, 225, 117348 CrossRef CAS.
- S. K. Jakka, M. J. Soares, M. P. F. Graça, A. J. Neves, P. C. Nagajyothi and K. Pavani, Opt. Mater., 2022, 129, 112442 CrossRef CAS.
- R. Li, N. Zhang, L. Li, Y. Liang, Y. Liu and S. Gan, New J. Chem., 2015, 39, 7019–7025 RSC.
- E. Martinez-Castro, J. García-Sevillano, F. Cussó and M. Ocaña, J. Alloys Compd., 2015, 619, 44–51 CrossRef CAS.
- Y. Guo, D. Wang and Y. He, J. Lumin., 2018, 201, 18–23 CrossRef CAS.
- G. B. Nair, S. Tamboli, R. E. Kroon and H. C. Swart, Mater. Today Chem., 2023, 29, 101463 CrossRef CAS.
- S. N. Ogugua, S. K. K. Shaat, H. C. Swart, R. E. Kroon and O. M. Ntwaeaborwa, J. Alloys Compd., 2019, 775, 950–968 CrossRef CAS.
- J. Periša, J. Papan, S. D. Dolić, D. J. Jovanović and M. D. Dramićanin, Dyes Pigm., 2018, 155, 233–240 CrossRef.
- B. P. Kore, S. Tamboli, N. S. Dhoble, A. K. Sinha, M. N. Singh, S. J. Dhoble and H. C. Swart, Mater. Chem. Phys., 2017, 187, 233–244 CrossRef CAS.
- K. R. Nagesh, S. Bathwal and B. Ashoka, J. Forensic Leg. Med., 2011, 18, 302–305 CrossRef CAS PubMed.
- S. Som, S. Das, S. Dutta, M. K. Pandey, R. K. Dubey, H. G. Visser, S. K. Sharma and S. P. Lochab, J. Mater. Sci., 2016, 51, 1278–1291 CrossRef CAS.
- R. K. Verma, K. Kumar and S. B. Rai, Solid State Sci., 2010, 12, 1146–1151 CrossRef CAS.
- M. Luo, X. Sha, B. Chen, X. Zhang, H. Yu, X. Li, J. Zhang, S. Xu, Y. Cao, Y. Wang, X. Wang, Y. Zhang, D. Gao and L. Wang, J. Am. Ceram. Soc., 2022, 105, 3353–3363 CrossRef CAS.
- A. K. Bedyal, V. Kumar, R. Prakash, O. M. Ntwaeaborwa and H. C. Swart, Appl. Surf. Sci., 2015, 329, 40–46 CrossRef CAS.
- S. Tamboli, G. B. Nair, A. K. Sharma, S. J. Dhoble and H. C. Swart, Mater. Res. Bull., 2024, 169, 112503 CrossRef CAS.
- J. Divya, N. J. Shivaramu and H. C. Swart, Heliyon, 2024, 10, e23200 CrossRef CAS PubMed.
- G. Shwetha, V. Kanchana and M. C. Valsakumar, J. Appl. Phys., 2014, 116, 133510 CrossRef.
- W.-K. Wang, S.-Y. Wang, K.-F. Liu, P.-C. Tsai, Y.-H. Zhang and S.-Y. Huang, Coatings, 2020, 10, 637 CrossRef CAS.
- S. Li, N. Guo, Q. Liang, Y. Ding, H. Zhou, R. Ouyang and W. Lü, Spectrochim Acta, Part A, 2018, 190, 246–252 CrossRef CAS PubMed.
- J. Hölsä, Acta Chem. Scand., 1991, 45, 583–587 CrossRef.
- G. B. Nair, A. Kumar, H. C. Swart and S. J. Dhoble, Ceram. Int., 2019, 45, 21709–21715 CrossRef CAS.
- X. Zhang, B. Liu, S. Cao, L. Dong, J. Wang and L. Liu, Opt. Mater., 2022, 124, 111986 CrossRef CAS.
- Q. Dong, J. Yang, J. Cui, F. Xu, F. Yang, J. Peng, F. Du, X. Ye and S. Yang, Dalton Trans., 2020, 49, 1935–1946 RSC.
- M. Xia, W. Zhao, J. Zhong, P. Shi, Z. Liao, X. Liu, J. Song, L. Luo, L. Ma and Z. Nie, J. Lumin., 2020, 220, 116957 CrossRef CAS.
- S.-H. Yang, W.-J. Wang, Y.-C. Lee and P.-J. Chiang, J. Alloys Compd., 2019, 783, 785–792 CrossRef CAS.
- C. Su, C. Zhou, J. Liu, J. Zhan, S. Xiong, P. Yin, X. Sun, X. Feng and Y. Zhang, J. Lumin., 2024, 269, 120471 CrossRef CAS.
- N. Ma, W. Li, B. Devakumar, X. Huang and A. F. Lee, Mater. Today Chem., 2022, 24, 100773 CrossRef CAS.
- C. Liu, Z. Xia, Z. Lian, J. Zhou and Q. Yan, J. Mater. Chem. C, 2013, 1, 7139–7147 RSC.
- H. Guo, B. Devakumar, B. Li and X. Huang, Dyes Pigm., 2018, 151, 81–88 CrossRef CAS.
- H. Chen and Y. Wang, Inorg. Chem., 2019, 58, 7440–7452 CrossRef CAS PubMed.
- S. Yang and S. Park, J. Alloys Compd., 2020, 834, 155094 CrossRef CAS.
- Y. Gao, Y. Zhao, P. Jiang, T. Wen, Y. Wang, R. Cong and T. Yang, J. Mater. Chem. C, 2022, 10, 17714–17722 RSC.
- C. Liu, D. Hou, J. Yan, L. Zhou, X. Kuang, H. Liang, Y. Huang, B. Zhang and Y. Tao, J. Phys. Chem. C, 2014, 118, 3220–3229 CrossRef CAS.
- A. K. Bedyal, D. D. Ramteke, V. Kumar and H. C. Swart, J. Mater. Sci.: Mater. Electron., 2019, 30, 11714–11726 CrossRef CAS.
- E. Álvarez, M. E. Zayas, J. Alvarado-Rivera, F. Félix-Domínguez, R. P. Duarte-Zamorano and U. Caldiño, J. Lumin., 2014, 153, 198–202 CrossRef.
- R. C. Carrillo-Torres, G. Saavedra-Rodríguez, J. Alvarado-Rivera, U. Caldiño, R. Sánchez-Zeferino and M. E. Alvarez-Ramos, J. Lumin., 2019, 212, 116–125 CrossRef CAS.
- E. Álvarez, M. E. Zayas, D. Rodríguez-Carvajal, F. Félix-Domínguez, R. P. Duarte-Zamorano, C. Falcony and U. Caldiño, Opt. Mater., 2014, 37, 451–456 CrossRef.
|
| This journal is © The Royal Society of Chemistry 2024 |
Click here to see how this site uses Cookies. View our privacy policy here. 
 Open Access Article
 This Open Access Article is licensed under a Creative Commons Attribution-Non Commercial 3.0 Unported Licence
 ,
Govind B.
Nair
,
Govind B.
Nair