
 Open Access Article
 This Open Access Article is licensed under a Creative Commons Attribution-Non Commercial 3.0 Unported Licence
Adsorption properties of M-UiO-66 (M = Zr(IV); Hf(IV) or Ce(IV)) with BDC or PDC linker†
Diego
González
a,
Cesar
Pazo-Carballo
 *abd,
Esteban
Camú
cd,
Yoan
Hidalgo-Rosa
df,
Ximena
Zarate
e,
Néstor
Escalona
bcd and
Eduardo
Schott
*ad
*abd,
Esteban
Camú
cd,
Yoan
Hidalgo-Rosa
df,
Ximena
Zarate
e,
Néstor
Escalona
bcd and
Eduardo
Schott
*ad
aDepartamento de Química Inorgánica, Facultad de Química y Farmacia, Centro de Energía UC, Centro de Investigación en Nanotecnología y Materiales Avanzados CIEN-UC, Pontificia Universidad Católica de Chile, Avenida Vicuña Mackenna, 4860, Santiago, Chile. E-mail: edschott@uc.cl
bDepartamento de Química Física, Facultad de Química y Farmacia, Pontificia Universidad Católica de Chile, Avenida Vicuña Mackenna 4860, Santiago, Chile
cDepartamento de Ingeniería Química y Bioprocesos, Escuela de Ingeniería, Pontificia Universidad Católica de Chile, Avenida Vicuña Mackenna 4860, Macul, Santiago, Chile
dMillennium Nuclei on Catalytic Processes towards Sustainable Chemistry (CSC), Chile
eInstituto de Ciencias Aplicadas, Theoretical and Computational Chemistry Center, Facultad de Ingeniería, Universidad Autónoma de Chile, Av. Pedro de Valdivia 425, Santiago, Chile
fCentro de Nanotecnología Aplicada, Facultad de Ciencias, Ingeniería y Tecnología, Universidad Mayor, Camino La Pirámide 5750, Huechuraba, Santiago, Chile
First published on 28th May 2024
Abstract
The increasing CO2 emissions and their direct impact on climate change due to the greenhouse effect are environmental issues that must be solved as soon as possible. Metal–organic frameworks (MOFs) are one class of crystalline adsorbent materials that are thought to have enormous potential in CO2 capture applications. In this research, the effect of changing the metal center between Zr(IV), Ce(IV), and Hf(IV), and the linker between BDC and PDC has been fully studied. Thus, the six UiO-66 isoreticular derivatives have been synthesized and characterized by FTIR, PXRD, TGA, and N2 adsorption. We also report the BET surface area, CO2 adsorption capacities, kinetics, and the adsorption isosteric heat (Qst) of the UiO-66 derivatives mentioned family. The CO2 adsorption kinetics were evaluated using pseudo-first order, pseudo-second order, Avrami's kinetic models, and the rate-limiting step with Boyd's film diffusion, interparticle diffusion, and intraparticle diffusion models. The isosteric heats of CO2 adsorption using various MOFs are in the range 20–65 kJ mol−1 observing differences in adsorption capacities between 1.15 and 4.72 mmol g−1 at different temperatures due to the electrostatic interactions between CO2 and extra-framework metal ions. The isosteric heat of adsorption calculation in this report, which accounts for the unexpectedly high heat released from Zr-UiO-66-PDC, is finally represented as an increase in the interaction of CO2 with the PDC linker and an increase in Qst with defects.
1. Introduction
The increasing CO2 concentration in the atmosphere and its direct impact on climate change due to the greenhouse effect is an environmental issue that needs to be solved as soon as possible. The CO2 storage technologies (which would decrease the atmospheric CO2 concentration) have the risk of causing other challenges like energy waste and cost.1–3 To store CO2 physisorption on high surface area compounds could be a more efficient option, being less energetic than other processes and the smaller amount of adsorbent needed, due to the increased surface area of those materials.Various CO2 adsorbents4 with large surface areas like activated carbon,5,6 zeolites,7,8 mesoporous silica,3,9 and molecular sieves,10 have been investigated. Metal–organic frameworks (MOFs) have recently been presented as a new viable CO2 adsorbent option.4 These materials have porous crystalline structures composed by a metal cluster (or node) linked with a polydentate organic compound (linker). MOFs have many favorable functional characteristics for adsorption, including a tunable structure with adaptable pore size, high surface areas, and crystallinity, the possibility of adding functional groups by post-synthetic modifications, and high adsorption capacities, among others.11–13 These characteristics are used for applications like catalysis, drug delivery, sensing, and gas storage/separation.12
CO2 adsorption has been explored for several different MOFs, including CU-BTC, ZIF-8, BIO-MOF-1, MIL-101, UiO-66, among others.4,11,14,15 Of our interest is UiO-66, which is a MOF with an octahedral metal cluster with a molecular formula M6O4(OH)4, originally prepared with M = Zr(IV).16 However, UiO-66 can also be synthesized using other metals, such as Ce(IV), Hf(IV), and Th(IV), generating an isoreticular metal cluster.17 These metallic clusters are interconnected by terephthalic acid linkers (BDC), creating a fcu topology. Furthermore, the linker can be modified by adding functional groups (FG)18 such as –NH2, –OH, –NO2, –Br, –OMe, –CH3, –CO2H, –SO3H, –CF3 to the aromatic ring by means of post-synthetic modifications19,20 or using the functionalized BDC linker in the synthetical procedure of UiO-66-(FG).13,20–23 Also, the linker can be substituted with 2,5-pirydinedicarborxilic acid (PDC) on the direct synthesis.24 Isoreticular MOFs with UiO-66 typology have three different pore sizes in the micropore region, one octahedral pore (∼11 Å), a tetrahedral pore (∼8 Å), and a window pore that connect both cavities (∼6 Å). Those micropores allow the material to reach a surface area of over 1200 m2 g−1.25,26 Thus, UiO-66 and its isoreticular derivatives exhibit a critical set of characteristics that allow for ambient CO2 adsorption. UiO-66 is the material with the most appealing physicochemical features for CO2 capture due to its remarkable water resistance and great thermal, chemical, mechanical, and pH stability.16,22,24 Thus, industrial treatments and atmospheric environment are not a challenge for UiO-66.
It has been observed that the UiO-66 functionalization enhances the adsorption capacities of the material,13 particularly, UiO-66-NH2 has shown theoretically18 and experimentally19,22,27,28 one of the best results for CO2 adsorption and selectivity. Also, the change of the metal center produces differences in the CO2 adsorption capacities.29–31 To use PDC linker is of particular interest due to the nitrogen free electron pair presence, which would show a behavior than the amino group in UiO-66-NH2. Therefore, the CO2 adsorption capabilities for UiO-66 with linkers (BDC and PDC) combined with metal centers M = Zr(IV), Ce(IV), and Hf(IV) were investigated in this report.
Although the adsorption of a maximum amount of CO2 is important, knowing the kinetics of the process and the study of the CO2 adsorption heat (isosteric heat) is also of great importance to search applications such as CO2 concentration. Thus, the final goal would be to generate a mitigation methodology to obtain a sustainable process that improves the current methods of CO2 concentration.
In the herein report, it is fully studied and discusses the effect of changing the metal center between Zr(IV), Ce(IV), and Hf(IV), and the linker between BDC and PDC. Thus, the six UiO-66 isoreticular derivatives have been synthesized and characterized by FTIR, PXRD, TGA, and N2 adsorption. We also report the BET surface area, CO2 adsorption capacities, kinetics, and the adsorption isosteric heat (Qst) of the UiO-66 derivatives mentioned family. The CO2 adsorption kinetics were evaluated using pseudo-first order, pseudo-second order, Avrami's kinetic models, and the rate-limiting step with Boyd's film diffusion, interparticle diffusion, and intraparticle diffusion models. The isosteric heat of CO2 adsorption was calculated using the Clausius–Clapeyron equation. Furthermore, DFT calculations over the whole family of derivatives were performed to explain the observed experimental results.
2. Experimental
2.1. Materials
Ammonium cerium(IV) nitrate (98%, (NH4)2Ce(NO3)6), 1,4-benzene dicarboxylic acid (98%, H2BDC), 2,5-pyridine dicarboxylic acid (98%, H2PDC), Zirconium(IV) chloride (99%, ZrCl4), zirconyl(VI) chloride octahydrate (98%, ZrOCl2·8H2O), hafnium(IV) chloride (99%, HfCl4), n-butylamine (CH3(CH2)3NH2, ≥99%), formic acid (96%, CH2O2), and Sodium nitrate (NaNO3, ACS reagent, ≥99.0%) were purchased from Sigma-Aldrich. Acetic acid (CH3COOH, 98.5–100.5%), acetone (C3H6O, 99%), hydrochloric acid (HCl, 98%), sodium hydroxide (NaOH, 99%), N,N′-dimethylformamide (DMF, 99 wt%), ethanol (C2H60, 99.9%), methanol (CH3OH, 99.9%) was supplied by Fine Chemical Co. Ltd and reagent alcohols were purchased from Macron Chemicals. Carbon dioxide (CO2, 99.999%) was purchased from Indura.2.2. Synthesis
All synthetic procedures were performed according to previous literature reports. Zr and Hf-UiO-66 were synthesized following the procedure reported by Farha et al.21 Ce-UiO-66 was synthetized according to the procedure by Lammert et al.32 and Zr-, Hf-, and Ce-UiO-66-PDC were prepared performing the Stock et al. procedure.24 See the ESI† for further information. All products were separated and washed by centrifugation at 8000 rpm for 10 min with the same reaction solvent (2 × 10 mL) and then with ethanol (2 × 10 mL). Finally, they were dried under vacuum at room temperature for three days, except for Hf-UiO-66-PDC, which required over five days to dry.2.3. Characterizations
The textural properties were obtained in a Micromeritics Gemini VII instrument for volumetric nitrogen adsorption–desorption isotherm of nitrogen at −196 °C, using 0.03 g of each sample, which were degassed for 4 hours at 180 °C, under vacuum using a micromeritics VacPrep instrument. The surface area was determined using the Brunauer–Emmett–Teller (BET) theory in the relative pressure range of 0.05 ≤ P/P0 ≤ 0.25.33 Total pore volume was defined as the single-point pore volume at P/P0 = 0.99. Micropore volume was calculated from the t-plot equation, and pore size distribution was obtained by applying the nonlinear density functional theory (NLDFT) equation.34 ATR-FTIR spectroscopy was achieved on a Shimadzu spectrum two equipment with an ATR accessory. Each spectrum was obtained with 20 accumulations in a wavenumber range of 4000 to 500 cm−1 with a 2 cm−1 resolution. The powder X-ray diffraction (PXRD) patterns were registered in a Bruker D2 Phaser diffractometer using a Cu Kα radiation (β = 1.541840 Å) from a Cu X-ray tube, operated at 30 kV and 10 mA. TGA analysis was performed on a Mettler-Toledo TGA/SDTA851 instrument. In a typical analysis, 3 to 12 mg were weighed and transferred to an Al2O3 sample holder. Then, by flowing a mixture of 20 mL min−1 of N2, the samples were heated at a rate of 20 °C min−1, and data were collected within a temperature range of 25 °C to 900 °C. Potentiometric titrations for M-UiO-66 were performed according to the method reported by Klet et al.35 In this method, 50 mg of each sample was dispersed in approximately 60 mL of NaNO3 0.1 M and allowed to equilibrate for 18 h. The solution's pH was adjusted to 3 using HCl 0.1 M, and then titrated with standardized NaOH 0.1 M until a pH of 11.2.4. CO2 adsorption capacity and isosteric heat
All CO2 adsorption isotherms were measured in a Micromeritics Gemini VII instrument at 263, 273, and 283 K until 100 kPa in a batch system. The points collected on the adsorption measurement were fitted with the Freundlich–Langmuir equation (eqn (1)),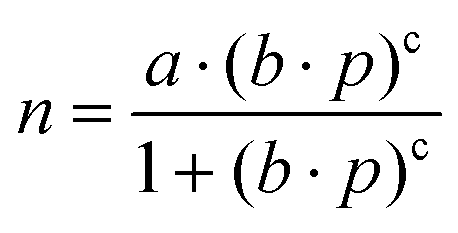 | (1) |
 | (2.1) |
 | (2.2) |
2.5. Computational details
Due to the large size of extended network structures such as MOFs, the simulations involve high computational cost. One way to address the significant size issue of MOFs is by truncating a periodic structure to a smaller representative fragment that accurately represents the structure of interest.39 The representative fragment is named “cluster models”.40 This approach has been widely discussed in the literature, with many previous studies. Those studies highlight that even though MOFs are extended network structures, these structures often exhibit highly localized electronic states. In the herein study, the cluster model proposed is based on previous works,41–43 which consist of a node and ligands acting as linkers. Specifically, the cluster model structure consists of the fragments [M6O4(OH)4(linker)3(HCOO)8] (M = Zr(IV), Ce(IV), and Hf(IV); linker = BDC or PDC), see Fig. S1.† This model contains one node [M6O4(OH)4]12−, three complete linkers, seven truncated linkers, and considers only a single defect or vacancy. The simulations were conducted using the DFT method, which was implemented in the ADF2023 software package.44 In these systems, relativistic effects are necessary due to the presence of heavy metals, which can significantly impact the materials’ chemical and physical properties. Accounting for relativistic effects is essential for an accurate description of the electronic structure and properties of the chemistry of these systems.45 Therefore, in the herein simulations, the relativistic effects were incorporated using the zeroth-order regular approximation approach (ZORA).46 Geometry optimizations were performed at the meta-generalized gradient approximation (meta-GGA) level of theory using the M06-L exchange–correlation energy functional.47 The standard Slater-type orbital basis set plus two polarization functions (STO-TZ2P) was selected for all calculations.48 The interactions between M-UiO-66 with different linkers and CO2 were examined using energy decomposition analysis (EDA) based on the Morokuma–Ziegler scheme.49,50 Furthermore, to accurately consider the use of dispersion forces in EDA computations, Grimme's D3 dispersion correction incorporated weak interactions between the fragments.51 To conduct the EDA analysis, the ADF program was employed, using the meta-hybrid TPSSH functional52,53 at the TZ2P/ZORA level of theory, which is a better functional to describe electronic structure and energies of systems. This analysis breaks down the interaction energy (ΔEInt), as shown in eqn (3).| ΔEInt = ΔEPauli + ΔEElec + ΔEOrb + ΔEDisp | (3) |
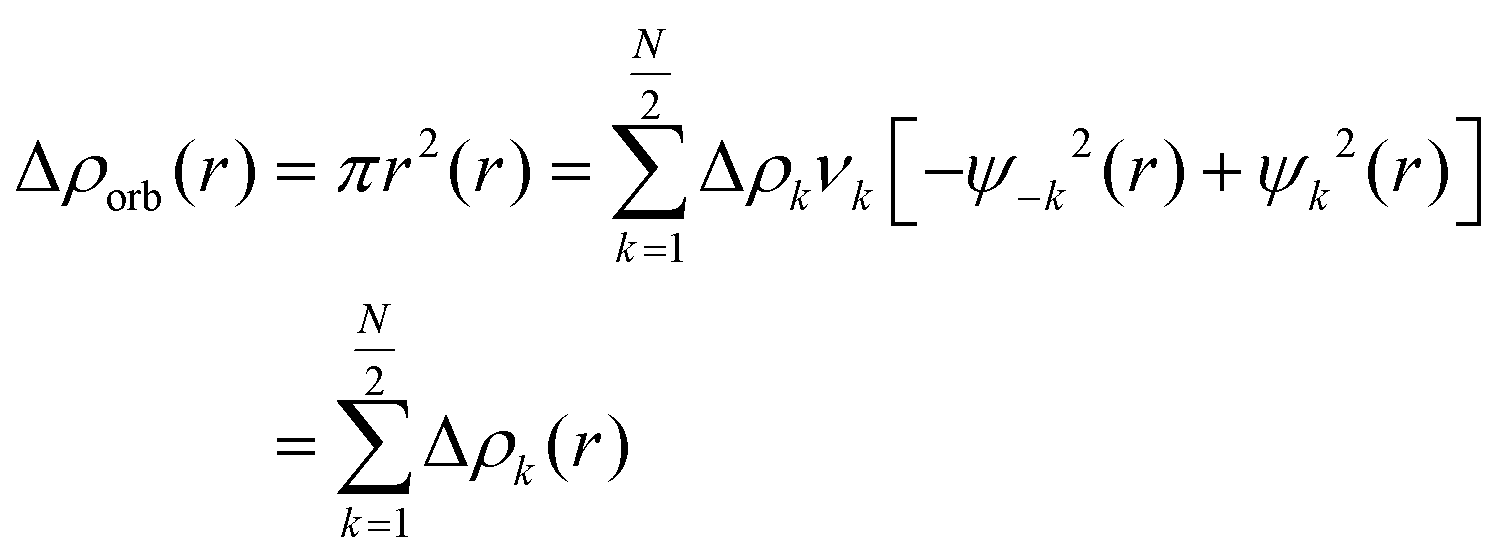
The repulsive interaction between the occupied orbitals of both fragments is called ΔEPauli term.54 Thsecond term, ΔEElec, accounts for the classic electrostatic interaction between the two segments.43 Interactions involving molecular orbitals associated with charge transfer, polarization, and other factors are included in the third term, ΔEOrb.55 The dispersion contribution are represented by the term ΔEDisp.56 Additionally, the natural orbital of chemical valence (NOCV) approach proposed by Mitoraj was employed to analyze the orbital contribution.57 This scheme considers the formation of an interacting system AB (with the wave function ψAB) from its respective fragments. In this scheme, the NOCV defines the charge-flow channels decomposing the overall deformation density Δρ. The NOCV are expressed in this equation as adding the pairs of complementary eigenfunctions (ψ−k, ψk) that correspond to the eigenvalues vk and −vk. These eigenvalues have the same absolute value but differ in sign:58
 | (4) |
The complementary pairs of NOCV define the charge-flow channels between the molecular fragments. When considering pairs of NOCVs (ψ−k, ψk) with identical absolute eigenvalues |vk|, an outflow Δρorb [outflow(i)] and inflow Δρorb [inflow(i)] of electron density can be determined within each Δρorb(i). By means of eqn (5), it is possible to examine these terms individually, explicitly focusing on the processes of electron density outflow and inflow from a specific fragment.54,59
 | (5) |
The interaction energies were adjusted using the counterpoise approach due to the presence of the basis set superposition error (BSSE).60
2.6. Adsorption kinetics
 | (6) |
| qt = qe (1 − e−k1t) | (7) |
 | (8) |
 | (9) |
 | (10) |
 | (11) |
(a) Boyd's film diffusion model. This model assumes that the gas film surrounding the adsorbent is the main resistance to the adsorption of the adsorbate. The model is expressed as follows:62
 | (12) |
| F > 0.85, Bt = −0.4977 − ln(1 − F) | (13) |
 | (14) |
Eqn (12)–(14) can be used to determine whether the rate of CO2 adsorption occurs by film diffusion or an intraparticle diffusion mechanism and to predict the mechanical steps involved in the adsorption process. While the plot of Btversus t indicates that intraparticle diffusion is the rate-limiting step if the curve crosses the linear origin. However, film diffusion or a chemical reaction also significantly impacts the adsorption rate if the plot is nonlinear or does not pass through the origin.62,64,65
(b) Interparticle model. The model assumes that the interparticle diffusion model is the rate-limiting step; it assumes that the shape of the adsorbent is equivalent to spheres and the diffusivity is constant in spherical coordinate. The expression gives the integrated formula:
 | (15) |
Eqn (15) can be used to obtain the diffusion time constant tD = Dc/rp2 (s−1) and qt/qe have already been explained. When qt/qe > 70% eqn (15) can be simplified as:
 | (16) |
Then, if interparticle diffusion is the rate-limiting step, a plot of ln(1 − qt/qe) against t should be linear with a slope −Dc/rp2 and the intercept ln(6/π2). Otherwise, the adsorption is controlled by other steps.62,65,66
(c) Intraparticle model. Weber–Morris proposed the intraparticle model based on the Fick's second law.67 This model can be used to identify consecutive stages of mass transfer during the adsorption model. The adsorption capacity is linear with the square root of time according to the expression:
| qt = kidt1/2 + C | (17) |
According to this model, the plot qtversus t1/2 should give a straight line if diffusion plays a role in the rate of adsorption, and this line should pass through the origin if intraparticle diffusion is the sole rate-controlling step. Multi-linearity can be observed when different steps are involved in the adsorption mechanism, where the linear portion having the lowest slope corresponds to the rate-controlling step.62,64,65
3. Results and discussion
3.1. Structural and textural properties of MOFs
The FT-IR analysis presented in Fig. S2† indicates that the main differences between the structures are related to the bands located at 555, 660, and 740 cm−1 for the M-UiO-66. These bands correspond to the vibrations of the μ3-OH, μ3-O, and M–OH bonds present in the SBU of each MOFs, except for Ce-UiO-66 and Ce-UiO-66-PDC, where the μ3-O bond is not present.32,68 On the other hand, the Ce–O, Hf–O, and Zr–O bonds in UiO-66 are assigned to the band observed in the 550–743 cm−1 range. The C![[double bond, length as m-dash]](https://www.rsc.org/images/entities/char_e001.gif) C vibration mode of terephthalic acid ligands was attributed to the vibrations at 1506–1589 cm−1. The C–O stretching mode was assigned to the strong bands at 1393 cm−1, whereas the characteristic band at 1664 cm−1 was attributable to the vibration mode of CO. On the other hand, MOFs synthesized with PDC (M-UiO-66-PDC) exhibit the CC vibrational mode of the disubstituted pyridine group with vibrations in the region between 1400–1594 cm−1. Meanwhile, three weak signals were observed between 1025 and 1200 cm−1 associated with the C–N bond, which is characteristic of pyridine.
C vibration mode of terephthalic acid ligands was attributed to the vibrations at 1506–1589 cm−1. The C–O stretching mode was assigned to the strong bands at 1393 cm−1, whereas the characteristic band at 1664 cm−1 was attributable to the vibration mode of CO. On the other hand, MOFs synthesized with PDC (M-UiO-66-PDC) exhibit the CC vibrational mode of the disubstituted pyridine group with vibrations in the region between 1400–1594 cm−1. Meanwhile, three weak signals were observed between 1025 and 1200 cm−1 associated with the C–N bond, which is characteristic of pyridine.
The crystallinity of the synthesized MOFs was evaluated using PXRD for all materials. It can be observed in Fig. S3a and Table S1† that all MOFs are isoreticular and with a fcc structure. The two characteristic peaks at 5 degrees are observed in all samples,16 where the first peak is more intense than the second one. The only exception is Ce-UiO-PDC which shows the same intensity for both peaks, which could be due to the sample treatment issue as it was challenging to work with this powder with large static (which tends to stick over every surface). Those two initial peaks are used as reference for all the forthcoming peaks. Thus, Zr and Ce MOFs have the same peaks and intensity proportion with no displacement. In case of the Hf MOFs there are some extra peaks at 10 and 26 degrees when the linker is changed to PDC. Table S1† shows that Hf-UiO-66-PDC has an 80.3% of crystallinity, while the other MOFs have >95% of crystallinity, probably the water content on the synthesis process affects the crystals growth and morphology of this MOF. Those extra peaks get displaced and decrease in intensity maintaining similar percentage of crystallinity when the material is activated at 180 °C for 4 hours (see Fig. S3b†), suggesting the re-accommodation of some collapsed unit cells in a minor proportion.
Generally, changing the linker does not affect the crystallinity or the structure, whereas changing the metal center produces small displacements on the crystal structure attributed to the change of the metal radius.
The surface area was determined using the BET equation to measure the available surface area of the synthesized materials. All synthesized materials showed type I isotherms according to BDDT classification (Fig. S4†),37 except for Ce-UiO-66-PDC and Hf-UiO-66-PDC, which showed hysteresis, a type IV isotherm which is related to a contribution of mesoporous behavior. It is possibly that the activation process generated some wide pores by collapsing some of the unit cells. In case of Hf-UiO-66-PDC the entire structure collapse has been reported.24 Nonetheless, according to what has been observed in Fig. S3b,† it is postulated that the loss of crystallinity causes the formation of some mesopores without a collapse of the structure (see Fig. S5†).
On both Zr(IV) MOFs large surface areas with no significant difference can be seen, with respect to similar reports found in the literature (Table S2†).24,32,69,70 A trend of surface area decrease occurs with Ce(IV) and Hf(IV) MOFs. There is an increase in the surface area when the MOF is more defective.25,71 This described behavior correlates with Ce and Hf synthesized with PDC linker having fewer defects than their BDC analogs (see Table 1). While the decrease in the surface area for these MOFs could be due to the formation of some mesopores on Ce-UiO-66-PDC and Hf-UiO-66-PDC.
| Material | Missing linker | Molecular formula | MW (g mol−1) | S BET (m2 g−1) | V 0 (cm3 g−1) |
|---|---|---|---|---|---|
| a Missing linker determined by potentiometric titration. b Missing linker determined by thermogravimetric analysis. See ESI† for further information. | |||||
| Zr-UiO-66 | 0.9a | Zr6O4(OH)4(C8H4O4)5.15[(H2O)(OH)]1.7 | 1584 | 1188 | 0.46 |
| Zr-UiO-66-PDC | 1.9b | Zr6O4(OH)4(PDC)4.1 | 1356 | 1083 | 0.42 |
| Ce-UiO-66 | 1.9a | Ce6O4(OH)4(C8H4O4)4.15[(H2O)(OH)]3.7 | 1783 | 925 | 0.42 |
| Ce-UiO-66-PDC | 1.3b | Ce6O4(OH)4(PDC)4.7 | 1748 | 626 | 0.30 |
| Hf-UiO-66 | 1.1a | Hf6O4(OH)4(C8H4O4)4.95[(H2O)(OH)]2.1 | 2085 | 1196 | 0.42 |
| Hf-UiO-66-PDC | 0.5b | Hf6O4(OH)4(PDC)5.5 | 2111 | 509 | 0.16 |
For the BDC MOFs, Zr and Hf have similar surface areas, whereas Ce shows a decrease to 925 m2 g−1. In general, these MOFs have identical surface areas near the previously reported. The observed differences could be due to the defects of our materials and the difference in atomic radius (Hf4+ = 71 pm < Zr4+ = 72 pm < Ce4+ = 87 nm). The radii trend Hf < Zr < Ce can explain the generation of bulkier clusters for Ce(IV), reducing the pore volume and the surface area. Thus, the surface areas measured correlate well with this trend. Thus, there is a competition on the influence over the surface area between the atomic radius and the defect sites in the structure. Previous reports associate an increase ∼200 m2 g−1 in the surface area (Zr-UiO-66) with the loss of one missing linker.71 In case of PDC-MOFs, the surface areas show dependence on defects in the structures, where Zr-UiO-66-PDC is the most defective of the PDC-MOFs, then Ce-UiO-66-PDC and finally Hf-UiO-66-PDC (Table 1).
3.2. CO2 adsorption capacity
CO2 adsorption isotherms at 263, 273, and 283 K were measured to estimate the adsorption capacities of the synthesized MOFs, calculate the isosteric heat of adsorption, and evaluate the influence of the metal center and the linker. All measurements (Fig. 1) show, as predicted, that the amount adsorbed decreases as the temperature increases due to the diminution of interactions with a kinetic energy rise of the gas. On Zr and Hf MOFs an increase in CO2 uptake is observed when the linker is changed to PDC, even though the surface area of both compounds decreases from BDC to PDC. This observation supports the importance of replacing one carbon with a nitrogen atom in the aromatic linker, producing an increase of the material with CO2 attractive interactions. The affinity of polar nitrogen with the quadrupolar moment of CO2 is probably the dominant interaction on the adsorption. Another evidence of the interaction increase can be seen in the isotherm shapes (Fig. 1). As observed in Fig. 1, all the herein studied MOFs have better uptakes at low pressures (from 10 to 40 kPa) with PDC linker, while the isotherms behavior is nearly linear with BDC linker for the CO2 adsorptions at those pressures. High uptakes at low pressures can be directly related to an increase in intermolecular interactions.36 | ||
| Fig. 1 CO2 adsorption isotherms at 263 K (black), 273 K (red) and 283 K (blue) of Zr-UiO-66 (a), Zr-UiO-66-PDC (b), Ce-UiO-66 (c), Ce-UiO-66-PDC (d), Hf-UiO-66 (e) and Hf-UiO-66-PDC (f). | ||
The results show that the most suitable materials for CO2 adsorption are Ce MOFs and Zr-UiO-66-PDC with adsorptions greater than 4 mmol g−1. Those three MOFs have a more significant number of defects, Zr-UiO-66-PDC being the material with the larger number of defects. As discussed, if the number of defects turns larger the surface area gets also larger, creating more sites to interact. Those interaction sites correspond for example to μ3-OH. Also, the diversity in the structure (due to the large defect number) favors the interaction with CO2 as the metallic center is more available to interact. On the other hand, in the case of Hf MOFs another interesting situation is observed, where there is better CO2 adsorption on Hf-UiO-66-PDC, which is less defective than Hf-UiO-66. Thus, the nitrogen of the aromatic cycle on PDC MOFs also increases CO2 adsorption. Finally, the effect of the metal center must also be considered (not only absence of linker), which can be tricky to analyze due to the large defect variety. In general, the CO2 adsorption performance trend by metal centers is Ce > Zr > Hf. As shown in the FTIR characterizations, Ce MOFs do not possess the μ3-O group, whereas the μ3-OH is more intense. This intensity difference might be due to the water affinity of Cerium causing a fully hydroxylated cluster. Thus, the positively μ3-OH charged hydrogen site can interact with the negatively charged CO2 oxygen, behavior that has been reported before.25 This behavior has shown to increase the adsorption capacities of Ce MOFs.
Both Ce MOFs (BDC and PDC) adsorbed a high and similar amount of CO2, but there was an unexpected decrease in the maximum uptake when the linker is changed to PDC. Despite this exception to the detected trend, it is observed that there is an increase in intermolecular interactions when the linker is changed, supported by isothermal shapes. Thus, the decrease observed for Ce derivatives could be due to surface area and pore size limitations as Ce MOFs have minor surface areas if compared with their analogs, with an even larger diminution when PDC is the linker. Fig. 2 shows the intrinsic adsorption of CO2 which is obtained from the quotient between the CO2 adsorption at 263 K and 95 kPa with the respective surface area and the number of defects of the material. As observed the intrinsic adsorption of Ce-UiO-66-PDC is greater than Ce-UiO-66, showing that when surface area and defects are normalized the effect of the PDC linker increase de adsorption capacities of Ce MOFs.
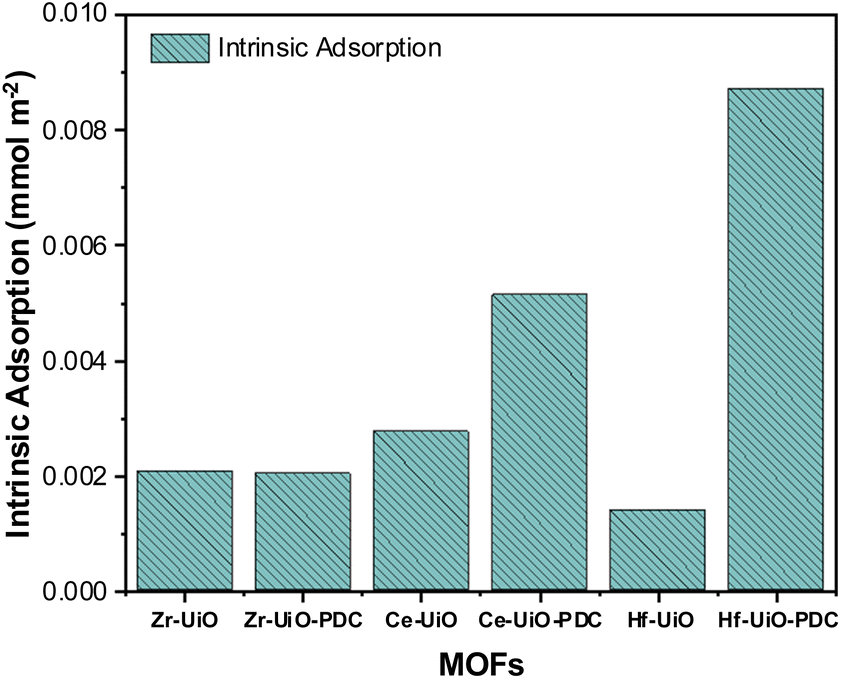 | ||
| Fig. 2 Intrinsic adsorption of M-UiO-66 (M = Zr(IV), Ce(IV), Hf(IV)) with BDC linker or PDC linker. | ||
According to the intrinsic adsorption on Fig. 2, the CO2 adsorption capacities of Zr MOFs are the same, showing that apparently the linker does not affect the adsorption capacities of Zr MOFs. However, on PDC MOFs the intrinsic adsorption trend is Hf > Ce > Zr, which suggest that raising the oxophilicity character (which follows the same trend72) of the metal center in presence of the pyridine group there are also raising of the electronic interaction of CO2 over the metallic cluster of the material and a shortening of the bond length between CO2 and μ3-O according to the theoretical analysis discussed below.
3.3. Computational analysis
The optimized geometries of the ground state (S0) using the cluster model matched the values predicted by previous theoretical calculations for extended UiO-66 and UiO-66-PDC structures and the experimentally reported data,73,74 indicating a good description of the system. A list with selected interatomic distances (see ESI†) can be found in Table S6.† These data show that the average [M–O (μ3-OH)], [M–O (μ3-O)], and [M–O (COO−)] bond lengths show a good correlation with previous reports at the M06-L/TZ2P/ZORA theoretical level for M-UiO-66 and M-UiO-66-PDC. Based on these results, we proceeded with simulations of the interacting systems M-UiO-66 and M-UiO-66-PDC and CO2, using a cluster model. In these simulations, differences in weak and medium strength acid sites were observed in M-UiO-66 with different linkers, corresponding to Mn+ and μ3-OH, created from the missing linkers. Thus, in our cluster model, we considered a single defect as well as a starting structure of the M-UiO-66 and M-UiO-66-PDC/CO2 where the CO2 interacts with the defect site, see Fig. S11.† The optimized structures of the M-UiO-66 and M-UiO-66-PDC with CO2 S0 electronic states are displayed in Table S7.† In all systems, it is possible to observe that the geometry of M-UiO-66 and M-UiO-66-PDC/CO2 systems converged to the CO2 interacting mainly with the defect sites. For M-UiO-66 and M-UiO-66-PDC/CO2, the CO2 is in a position closer to the metal center and M–μ3-O–H of the defect site. The calculated length between CO2 and the metal center (M⋯CO2) is in average 3.08 Å for all systems. While the average distance for –μ3-OH⋯CO2 for the M-UiO-66 and M-UiO-66-PDC/CO2 systems is 3.17 Å and 3.20 Å for the distance –μ3-O⋯CO2, see Table S8.† The EDA Analysis scheme and the NOCV approach were used to gain a deeper understanding of the M-UiO-66 and M-UiO-66-PDC/CO2 interactions. These analyses provide insights into the nature and strength of the different interaction types, such as electrostatic, polarization, and dispersion forces. As shown in Table S9,† the interaction energies suggest that the interaction between M-UiO-66 and M-UiO-66-PDC with CO2 does not exceed −8.46 kcal mol−1, which indicates a predominance of long-range interactions.These results show that the electrostatic component has the most crucial role in stabilizing energy, with more than 40% contribution in all systems. For M-UiO-66/CO2 the orbital term shows a slightly larger percentual contribution than the dispersive component of the total attractive energies. In contrast, for M-UiO-66-PDC/CO2 systems, the orbital term has a slightly smaller percentual contribution than the dispersive term. The role of the interaction between the oxygen lone pairs (of the CO2) with the metal center or μ3-O–H groups in these systems could be significant if the electrostatic and orbital contribution to the total stabilization energy are considered. This assumption is confirmed with the NOCV deformation density channels analysis, as discussed below. Thus, NOCV analysis indicated that the main deformation density channel (Δρ1) is originated from the lone electron pair of CO2 electron donation (red color (outflow)) to the metal center (blue color (charge accumulation)) in the defect sites of M-UiO-66 and M-UiO-66-PDC. While other contributions to the deformation density channels Δρ2 display a donor–acceptor interaction that involves the (O⋯H) interaction from the oxygen atom CO2 molecule lone electron pair and the MOF -μ3-OH hydrogen atom, see Fig. S12 and S13.†
By means of DFT calculations it can be supported that the Hf-UiO-66 has the larges CO2 adsorption, due to the small observed interaction energy, which supports the easy release of the adsorbed gas.
3.4. Kinetics of gas phase CO2 adsorption on MOFs
The effect of temperature on the CO2 adsorption curves for Zr-UiO-66 is illustrated in Fig. 3, which shows similar behavior as all the herein studied MOFs (see Fig. S17†). As shown in this figure, the CO2 adsorption times and dynamic adsorption capacities significantly decreased with increasing adsorption temperature due to the exothermic nature of the adsorption process.75–78 The adsorption curves have been fitted with pseudo-first order, pseudo-second order and Avrami's kinetic models to see if the model varies between the materials or by temperature effect. The fitting results are shown in Fig. S15–S17,† while the kinetic model parameters are shown in Tables S10 and S11.† The Avrami's fractional-order model fitted to all experimental curves with values of R2 > 0.99, being independent of the analyzed MOF or analyzed temperatures, while pseudo-first order and pseudo-second order overestimated or underestimated the CO2 uptake at different adsorption steps (reaching R2 value of not greater than 0.98). Thus, Avrami's equation is considered the most accurate approach to describe the CO2 adsorption. This model has been previously used to explain complex kinetic processes that involve more than one adsorption mechanism,62,79 as shown by the herein studied materials. | ||
| Fig. 3 Effect of temperature on curves of CO2 adsorption onto Zr-UiO-66 against time. | ||
In the Avrami's equation (see Table S10†), the KAV can be associated with the rate of adsorption, the nAV is associated with changes on the mechanism of adsorption that may occur and the dimensionality of the growth of adsorption sites, and the qe is related with the amount of CO2 adsorbed by the material at the pressure of 95 kPa. The qe values for each material show a similar value as the last point obtained in the CO2 adsorption isotherms, which indicates the good of fitness of the equation, but does not give much information about the maximum capacities of the materials because it has been seen that CO2 adsorption of MOFs can still increase at pressures more than 40 bar.80,81 As the Avrami's exponent (nAv) accounts for possible mechanism changes that may occur during the adsorption process, which is the case of our materials with values in the range of 2.8–4.5. Depending on the material, the values vary with temperature up to a maximum adsorption value at 273 or 283 K. For Zr-UiO-66-PDC, Ce-UiO-66 and Hf-UiO-66-PDC the maximum value is reached at 273 K. In contrast, the rest of the MOFs show its maximum at 283 K. This observation is consistent with the theoretical analysis, as the CO2 interacts were characterized to be located overactive sites generated by the defects (missing linker). All MOFs have identical characteristics of crystal structure, mechanism, and rate of adsorption, as shown by the adsorption rate constant's (KAv). This constant has no significant variation between the material and temperatures and the Avrami's exponents. At 273 K for Zr-UiO-66-PDC, the adsorption rate constant generates that the curve (Fig. S17†) is slightly displaced towards the 263 K curve.
In order to elucidate the actual rate-controlling and the mechanism of diffusion associated with the CO2 adsorption on the synthesized materials, film diffusion, interparticle diffusion and intraparticle diffusion model have been analyzed. Thus, Fig. S18† shows the film diffusion plot of Boyds parameter (Bt) against time for each material under different temperatures. The Boyd plot produces usually for diffusion systems a straight line, whereas if the systems show as limiting step the diffusion or chemical reaction, it shows a nonlinear behavior or a linear behavior that does not pass through the axis origin. In this case, all curves exhibited a nonlinear behavior at the three analyzed temperatures. Therefore, we can support the fact that film diffusion as one of the factors that influence the CO2 adsorption rate.
Interparticle diffusion is the rate-limiting step if the plot of ln(1 − qt/qe) against time is linear with a slope −Dc/rp2 and the intercept ln(6/π2). In Fig. S19† is shown the interparticle diffusion plot for each material at different temperatures (the corresponding calculated parameters are listed in Table S12†). At the analyzed temperatures, a nonlinear behavior plots are observed for all materials. Besides, the intercepts are displaced from the value ln(6/π2). These two previously shown results disregard the interparticle diffusion as the rate-limiting step.
Fig. S20† shows the intraparticle diffusion plot of qtversus t1/2 for each material at different temperatures. As can be observed all curves exhibit multi-linearity, indicating that there are different steps involved in the adsorption mechanism. It is expected that intraparticle diffusion will be a limiting step due to the abundant number micropores present in the materials. Finally, the third linear segment, zone C, is attributed to the final equilibrium step, where the materials are near saturation.
The above results show how the materials adjust to the Avrami's model, used to explain complex kinetic processes like the recently analyzed, where the CO2 adsorption rate is mainly controlled by pore filling in the first stage of adsorption, and then intraparticle diffusion resistance is the CO2 adsorption rate controlling until the adsorption reaches an equilibrium close to saturation. These results are very close to the Yang et al.65 ones, showing that probably most MOFs have complex and similar adsorption mechanisms.
3.5. Isosteric heat of adsorption
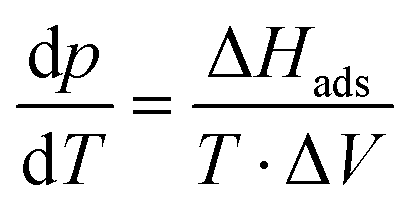
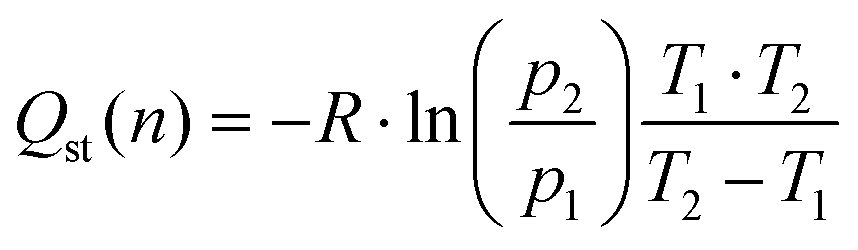
The isosteric heat of adsorption is a measure of the energy required for the adsorption of a gas over a surface. This value was first calculated for MOFs using the Clausius–Clapeyron equation in 2005 for [M3(bpdc)3bpy]4DMF·H2O (M = Zn or Co),82 since then, the isosteric heat have been calculated for a wide variety of materials.For CO2 adsorption, MOFs (such as Hf-UiO-66-F4,30 Zr-UiO-67-BBS31 and Mg-MOF-7483) are capable of adsorbing this gas in the range of 1.2 to 8.0 mmol g−1 at pressures and temperature near to 273 K and 1 bar (see Table S13† for further information), while isosteric heats of adsorption are in the range of 20 to 50 kJ mol−1. The herein studied MOFs are also in this range of CO2 adsorption and isosteric heat, except for Zr-UiO-66-PDC, which has unexpectedly high released heat. It is essential to calculate the isosteric heat to apply the materials for its right applications, such as separation of gas mixtures,19,62,84 gas storage,85 adsorption cooling, heat pump, and desalination.86,87 As all the mentioned applications require favorable isosteric heat for their process.
Thus, the isosteric heat of CO2 adsorption was calculated (Fig. 4) to evaluate the different possibilities of applications of the herein studied MOFs. It is important to mention that the fit from eqn (1) fails at low pressures (see Fig. S9†), so the modeled isosteric heat at lower gas uptakes show the largest error. We thus attributed the low Qst for Hf-UiO-66-PDC to this error.
 | ||
| Fig. 4 The isosteric heat of adsorption (Qst) in a function of the CO2 amount adsorbed of M-UiO-66 (M = Zr(IV), Hf(IV), Ce(IV)) with (a) BDC linker or (b) PDC linker. Filled symbols represent the amount adsorbed of each material at 283 K and open symbols represent the modeled Qst. | ||
Zr-UiO-66-PDC has an unusual large isosteric heat curve compared to the other studied MOFs, indicating a stronger surface affinity for the CO2 molecule. Furthermore, a chemisorption process has been discarded due to a negligible adsorption difference after five adsorption/desorption cycles, showing more than 97% of physisorption of CO2 (see Fig. S10†).
There is an increment in the released heat when the linker is changed to PDC (Fig. 4 and S22†). In this sense, the change on the nature in the linker induces an increase interaction with the CO2 molecule, as the pyridine linker possess an electron lone pair. Furthermore, an increment in the isosteric heat has been reported when defects are more frequent.88 This correlates with the fact that Zr-UiO-66-PDC has the largest released heat and the most significant number of defects. A similar situation is observed in the case of BDC MOFs, where Ce-UiO-66 is the most defective MOF and has the largest measured isosteric heat.
It can be observed that, at low uptakes, the isosteric heat increases or decreases with the pore filling, depending on the material. Zr and Hf-UiO-66 have decreasing isosteric heat with increasing material loading. On the other hand, the remaining MOFs increase their isosteric heat with increasing material loading. The usual discussion focuses on the heterogeneity or homogeneity of the studied materials, where heterogeneous materials have few high-energy sites that become saturated at the initial of the adsorption. Then, at high coverage, the energy is mainly dispersed. While in homogeneous material, the energy just increases with the adsorption due to the adsorbate–adsorbate repulsions.89–91 However, the herein reported materials are isoreticular, thus the possess the same topology and adsorption sites. Thus, there is no cause for Zr and Hf-UiO-66 to have high energy sites, whereas the other studied materials show another trend, thus the explanation for the trends seems to follow another behavior. Pendleton et al.92 introduced the assumption of the linear summation of three distinct heats to give the isosteric heat of adsorption: condensation heat due to fluid–fluid (qf–f) interactions, non-specific interaction heat due to fluid–solid (qf–s) as dispersion forces, and specific interaction heat due to fluid–high energy sites (qf–HES).92 Base on that proposed separation scheme for the isosteric heat, the high energy sites are not present for the herein studied MOFs. The remaining two interactions left (condensation heat (qf–f) and non-specific interaction heat (qf–s)) are the ones contributing to the difference in the isosteric heats. On the qf–f heat it is expected that, at near to zero pore filling, the gas molecules would be isolated on the adsorber, and there would be no fluid–fluid interactions contributing to the overall isosteric heat. Thus, with increasing pore filling, these interactions also increase its contribution to the heat to a value equivalent to the adsorptive latent heat of condensation. Otherwise, the qf–s heat is the interaction of the material with the gas, which gradually decreases with pore-filling due to the occupation of the surface with the adsorptive molecules. Applying those approximations to a slit-shaped micropore, the gas molecules would be adsorbed on pores of width like the fluid molecule's kinetic diameter and subsequently on slightly larger pores with decreased interaction energy. As a result, qf–f contributes an ascendent heat with increasing pore filling, while qf–s contributes a descendent curve to the overall isosteric heat.92
As previously mentioned, the calculated isosteric heat of the herein studied materials for Zr and Hf-UiO-66 have the qf–s heat as the predominant contribution, while the remaining studied materials have the qf–f heat predominating. In case of the BDC MOFs, Ce-UiO-66 has a different trend than Zr and Hf-UiO-66, which can be attributed to the number of defects of Ce-UiO-66 which is almost twice of the Zr and Hf-UiO-66 defects. The large number of present defects in case of Ce-UiO-66 generates a difference on the adsorption sites causing proximity between the adsorbed CO2 molecules which can be related to a larger qf–f heat contribution. In the case of the PDC MOFs, they all have the same trend of qf–f heat predominance (same as Ce-UiO-66), and the CO2 adsorption for these materials is better than their BDC analogs, except for Ce-MOFs which shows significant CO2 adsorption for both materials. The high saturation levels of Ce-UiO-66 and Ce-UiO-66-PDC with CO2 could be the reason for the dominance of qf–f heat in the overall isosteric heat for these materials. Likewise, Zr and Hf-UiO-66 have a distinguished distinctive contribution of qf–s heat because there is a higher interaction between the surface of these materials and the adsorbed gas molecules.
Finally, the three main parameters that influence the CO2 adsorption could be correlated, as shown in Fig. 5. As observed, there is a clear dependency between the defects and/or available surface area with the CO2 adsorbed amount.
 | ||
| Fig. 5 Correlation between the BET surface area, CO2 adsorbed amount, and defect sites. | ||
3. Conclusions
In this study, six UiO-MOFs synthesized varying the metal center between Zr(IV), Ce(IV), or Hf(IV) and the linker between BDC or PDC showed some differences in the structural and textural properties. It is essential to highlight the absence of the μ3-O bond on Ce-UiO-66 and Ce-UiO-66-PDC the high crystallinity of all synthesized MOFs, and the different surface areas of the material, which generated significant changes in the adsorption capacities, where the number of defects also played a substantial role, together with the surface areas of the materials, the intrinsic properties of the metal centers and the linkers. The lone pair of the PDC nitrogen linker improved the CO2 adsorption capacities of the materials (not depending on the metal center) due to the interaction with the quadrupolar moment of the CO2. Ce-UiO-66-PDC showed a reduced CO2 adsorption compared with Ce-UiO-66, but this was attributed to a surface area limitation and not a reduction adsorbent–adsorbate interaction. Ce and Zr-UiO-66-PDC MOFs showed the best CO2 adsorption capacities with amounts greater than 4 mmol g−1. The high capacities of adsorption were attributed to the high number of defects and the surface area contributing together, and the Ce MOFs case attributed that the absence of the μ3-O bond and the increased amount of μ3-OH bonds created more favorable interactions with CO2.By means of DFT calculations using the EDA-NOCV scheme it was possible to study the nature of the MOF–CO2 interactions, showing that the CO2 preferently interacts with the defect sites, supporting the experimentally observed results.
The kinetics of adsorption studies showed an adjustment to the Avrami's fractional-order kinetic model independent of the studied material or temperature. The Avrami's model is used to explain complex kinetic processes like the analyzed applying the rate-limiting kinetic models of Boyd's film diffusion, interparticle and intraparticle, concluding that the CO2 adsorption rate on the synthesized MOFs is mainly controlled by diffusion on the first stage. Then, intraparticle diffusion resistance controls the CO2 adsorption rate until the adsorption reaches an equilibrium close to saturation.
Finally, the calculation of the isosteric heat of adsorption confirmed an increment in the CO2 interaction with the PDC linker and it was observed an increment of the Qst with defects, where both PDC linker and number of defects explained the unexpectedly high released heat of Zr-UiO-66-PDC.
Conflicts of interest
There are no conflicts to declare.Acknowledgements
FONDECYT 1241917, 1231194, ANID/FONDAP/ 1523A0006, ACT210057, Programa de Iniciativa científica Milenio ANID-NCN2021_090 and beca Doctorado ANID 21211190. ANID Postdoctoral 3230141.References
- A. Arenillas, K. M. Smith, T. C. Drage and C. E. Snape, in Fuel, 2005, vol. 84, pp. 2204–2210 Search PubMed.
- C. H. Yu, C. H. Huang and C. S. Tan, Aerosol Air Qual. Res., 2012, 12, 745–769 CrossRef CAS.
- L. Wang, M. Yao, X. Hu, G. Hu, J. Lu, M. Luo and M. Fan, Appl. Surf. Sci., 2015, 324, 286–292 CrossRef CAS.
- N. Gargiulo, F. Pepe and D. Caputo, J. Nanosci. Nanotechnol., 2014, 14, 1811–1822 CrossRef CAS PubMed.
- M. G. Plaza, C. Pevida, A. Arenillas, F. Rubiera and J. J. Pis, Fuel, 2007, 86, 2204–2212 CrossRef CAS.
- M. S. Shafeeyan, W. M. A. W. Daud, A. Houshmand and A. Shamiri, J. Anal. Appl. Pyrolysis, 2010, 89, 143–151 CrossRef CAS.
- S. Cavenati, C. A. Grande and A. E. Rodrigues, J. Chem. Eng. Data, 2004, 49, 1095–1101 CrossRef CAS.
- C. Chen, D. W. Park and W. S. Ahn, Appl. Surf. Sci., 2014, 292, 63–67 CrossRef CAS.
- A. Sayari and Y. Belmabkhout, J. Am. Chem. Soc., 2010, 132, 6312–6314 CrossRef CAS PubMed.
- S. Cho, H. R. Yu, K. D. Kim, K. B. Yi and Y. S. Lee, Chem. Eng. J., 2012, 211–212, 89–96 CrossRef CAS.
- J. An and N. L. Rosi, J. Am. Chem. Soc., 2010, 132, 5578–5579 CrossRef CAS PubMed.
- K. O. Kirlikovali, S. L. Hanna, F. A. Son and O. K. Farha, ACS Nanosci. Au, 2023, 3(1), 37–45 CrossRef CAS PubMed.
- G. E. Cmarik, M. Kim, S. M. Cohen and K. S. Walton, Langmuir, 2012, 28, 15606–15613 CrossRef CAS PubMed.
- P. Serra-Crespo, E. V. Ramos-Fernandez, J. Gascon and F. Kapteijn, Chem. Mater., 2011, 23, 2565–2572 CrossRef CAS.
- A. R. Millward and O. M. Yaghi, J. Am. Chem. Soc., 2005, 127, 17998–17999 CrossRef CAS PubMed.
- J. H. Cavka, S. Jakobsen, U. Olsbye, N. Guillou, C. Lamberti, S. Bordiga and K. P. Lillerud, J. Am. Chem. Soc., 2008, 130, 13850–13851 CrossRef PubMed.
- T. Islamoglu, D. Ray, P. Li, M. B. Majewski, I. Akpinar, X. Zhang, C. J. Cramer, L. Gagliardi and O. K. Farha, Inorg. Chem., 2018, 57, 13246–13251 CrossRef CAS PubMed.
- Q. Yang, A. D. Wiersum, P. L. Llewellyn, V. Guillerm, C. Serre and G. Maurin, Chem. Commun., 2011, 47, 9603–9605 RSC.
- Y. Jiang, C. Liu, J. Caro and A. Huang, Microporous Mesoporous Mater., 2019, 274, 203–211 CrossRef CAS.
- S. J. Garibay and S. M. Cohen, Chem. Commun., 2010, 46, 7700–7702 RSC.
- M. J. Katz, Z. J. Brown, Y. J. Colón, P. W. Siu, K. A. Scheidt, R. Q. Snurr, J. T. Hupp and O. K. Farha, Chem. Commun., 2013, 49, 9449–9451 RSC.
- A. Huang, L. Wan and J. Caro, Mater. Res. Bull., 2018, 98, 308–313 CrossRef CAS.
- Y. Goji, R. Abdullahi, Y. Garba, J. Japhet, D. Kitgak and K. Dangkat, Nigerian Journal of Materials Science and Engineering, 2021, 1–13 Search PubMed.
- S. Waitschat, D. Fröhlich, H. Reinsch, H. Terraschke, K. A. Lomachenko, C. Lamberti, H. Kummer, T. Helling, M. Baumgartner, S. Henninger and N. Stock, Dalton Trans., 2018, 47, 1062–1070 RSC.
- H. Wu, Y. S. Chua, V. Krungleviciute, M. Tyagi, P. Chen, T. Yildirim and W. Zhou, J. Am. Chem. Soc., 2013, 135, 10525–10532 CrossRef CAS PubMed.
- J. W. M. Osterrieth, J. Rampersad, D. Madden, N. Rampal, L. Skoric, B. Connolly, M. D. Allendorf, V. Stavila, J. L. Snider, R. Ameloot, J. Marreiros, C. Ania, D. Azevedo, E. Vilarrasa-Garcia, B. F. Santos, X. H. Bu, Z. Chang, H. Bunzen, N. R. Champness, S. L. Griffin, B. Chen, R. B. Lin, B. Coasne, S. Cohen, J. C. Moreton, Y. J. Colón, L. Chen, R. Clowes, F. X. Coudert, Y. Cui, B. Hou, D. M. D’Alessandro, P. W. Doheny, M. Dincă, C. Sun, C. Doonan, M. T. Huxley, J. D. Evans, P. Falcaro, R. Ricco, O. Farha, K. B. Idrees, T. Islamoglu, P. Feng, H. Yang, R. S. Forgan, D. Bara, S. Furukawa, E. Sanchez, J. Gascon, S. Telalović, S. K. Ghosh, S. Mukherjee, M. R. Hill, M. M. Sadiq, P. Horcajada, P. Salcedo-Abraira, K. Kaneko, R. Kukobat, J. Kenvin, S. Keskin, S. Kitagawa, K. ichi Otake, R. P. Lively, S. J. A. DeWitt, P. Llewellyn, B. V. Lotsch, S. T. Emmerling, A. M. Pütz, C. Martí-Gastaldo, N. M. Padial, J. García-Martínez, N. Linares, D. Maspoch, J. A. Suárez del Pino, P. Moghadam, R. Oktavian, R. E. Morris, P. S. Wheatley, J. Navarro, C. Petit, D. Danaci, M. J. Rosseinsky, A. P. Katsoulidis, M. Schröder, X. Han, S. Yang, C. Serre, G. Mouchaham, D. S. Sholl, R. Thyagarajan, D. Siderius, R. Q. Snurr, R. B. Goncalves, S. Telfer, S. J. Lee, V. P. Ting, J. L. Rowlandson, T. Uemura, T. Iiyuka, M. A. van der Veen, D. Rega, V. Van Speybroeck, S. M. J. Rogge, A. Lamaire, K. S. Walton, L. W. Bingel, S. Wuttke, J. Andreo, O. Yaghi, B. Zhang, C. T. Yavuz, T. S. Nguyen, F. Zamora, C. Montoro, H. Zhou, A. Kirchon and D. Fairen-Jimenez, Adv. Mater., 2022, 34(27), 2201502 CrossRef CAS PubMed.
- S. Biswas and P. Van Der Voort, Eur. J. Inorg. Chem., 2013, 2154–2160 CrossRef CAS.
- Y. Huang, W. Qin, Z. Li and Y. Li, Dalton Trans., 2012, 41, 9283–9285 RSC.
- R. Dalapati, B. Sakthivel, A. Dhakshinamoorthy, A. Buragohain, A. Bhunia, C. Janiak and S. Biswas, CrystEngComm, 2016, 18, 7855–7864 RSC.
- Z. Hu, A. Nalaparaju, Y. Peng, J. Jiang and D. Zhao, Inorg. Chem., 2016, 55, 1134–1141 CrossRef CAS PubMed.
- P. Xydias, I. Spanopoulos, E. Klontzas, G. E. Froudakis and P. N. Trikalitis, Inorg. Chem., 2014, 53, 679–681 CrossRef CAS PubMed.
- M. Lammert, M. T. Wharmby, S. Smolders, B. Bueken, A. Lieb, K. A. Lomachenko, D. De Vos and N. Stock, Chem. Commun., 2015, 51, 12578–12581 RSC.
- S. Brunauer, P. H. Emmett and E. Teller, Adsorption of Gases in Multimolecular Layers, 1938 Search PubMed.
- G. Kupgan, T. P. Liyana-Arachchi and C. M. Colina, Langmuir, 2017, 33, 11138–11145 CrossRef CAS PubMed.
- R. C. Klet, Y. Liu, T. C. Wang, J. T. Hupp and O. K. Farha, J. Mater. Chem. A, 2016, 4, 1479–1485 RSC.
- A. Nuhnen and C. Janiak, Dalton Trans., 2020, 49, 10295–10307 RSC.
- S. Brunauer, L. S. Deming, W. Edwards Deming and E. Teller, J. Am. Chem. Soc., 2002, 62, 1723–1732 CrossRef.
- H. Pan, J. A. Ritter and P. B. Balbuena, in Thermodynamic Functions of Gases, ed. F. Din, Prentice Hall, 1985, vol. 81 Search PubMed.
- Y. Hidalgo-Rosa, M. A. Treto-Suárez, E. Schott, X. Zarate and D. Páez-Hernández, J. Comput. Chem., 2020, 41, 1956–1964 CrossRef CAS PubMed.
- J. L. Mancuso, A. M. Mroz, K. N. Le and C. H. Hendon, Chem. Rev., 2020, 120, 8641–8715 CrossRef CAS PubMed.
- X. P. Wu, L. Gagliardi and D. G. Truhlar, J. Am. Chem. Soc., 2018, 140, 7904–7912 CrossRef CAS PubMed.
- E. Camu, C. Pazo, D. Becerra, Y. Hidalgo-Rosa, D. Paez-Hernandez, X. Zarate, E. Schott and N. Escalona, New J. Chem., 2020, 44, 14865–14871 RSC.
- C. Pazo-Carballo, E. Blanco, E. Camu, A. Leiva, Y. Hidalgo-Rosa, X. Zarate, A. B. Dongil, E. Schott and N. Escalona, ACS Appl. Nano Mater., 2023, 6(7), 5422–5433 CrossRef CAS.
- G. te Velde, F. M. Bickelhaupt, E. J. Baerends, C. Fonseca Guerra, S. J. A. van Gisbergen, J. G. Snijders and T. Ziegler, J. Comput. Chem., 2001, 22, 931–967 CrossRef CAS.
- M. Atanasov, D. Aravena, E. Suturina, E. Bill, D. Maganas and F. Neese, Coord. Chem. Rev., 2015, 289–290, 177–214 CrossRef CAS.
- E. Van Lenthe, E. J. Baerends, J. G. Snijders, E. Van Lenthe, E. J. Baerends and J. G. Snijders, J. Chem. Phys., 1993, 99.6, 4597–4610 CrossRef.
- Y. Zhao and D. G. Truhlar, J. Chem. Phys., 2006, 125(19), 194101 CrossRef PubMed.
- E. Van Lenthe and E. J. Baerends, J. Comput. Chem., 2003, 24, 1142–1156 CrossRef CAS PubMed.
- K. Kitaura and K. Morokuma, Int. J. Quantum Chem., 1976, 10, 325–340 CrossRef CAS.
- T. Study and H. T. Method, Society, 1979, 18, 1755–1759 Search PubMed.
- S. Grimme, Wiley Interdiscip. Rev.: Comput. Mol. Sci., 2011, 1, 211–228 CAS.
- J. Tao, J. P. Perdew, V. N. Staroverov and G. E. Scuseria, Phys. Rev. Lett., 2003, 91, 3–6 CrossRef PubMed.
- V. N. Staroverov, G. E. Scuseria, J. Tao and J. P. Perdew, J. Chem. Phys., 2003, 119, 12129–12137 CrossRef CAS.
- F. Sagan and M. P. Mitoraj, J. Phys. Chem. A, 2019, 123, 4616–4622 CrossRef CAS PubMed.
- M. P. Mitoraj, A. Michalak and T. Ziegler, J. Chem. Theory Comput., 2009, 5, 962–975 CrossRef CAS PubMed.
- S. Grimme, J. Antony, S. Ehrlich and H. Krieg, J. Chem. Phys., 2010, 132, 5585 CrossRef PubMed.
- M. P. Mitoraj, J. Phys. Chem. A, 2011, 115, 14708–14716 CrossRef CAS PubMed.
- M. P. Mitoraj, A. Michalak and T. Ziegler, Organometallics, 2009, 28, 3727–3733 CrossRef CAS.
- K. Devi, S. M. N. V. T. Gorantla and K. C. Mondal, J. Comput. Chem., 2022, 43, 757–777 CrossRef CAS PubMed.
- S. F. Boys and F. Bernardi, Mol. Phys., 1970, 19, 553–566 CrossRef CAS.
- M. Songolzadeh, M. Soleimani and M. Takht Ravanchi, J. Nat. Gas Sci. Eng., 2015, 27, 831–841 CrossRef CAS.
- N. Álvarez-Gutiérrez, M. V. Gil, F. Rubiera and C. Pevida, Chem. Eng. J., 2017, 307, 249–257 CrossRef.
- J. B. Benedict and P. Coppens, J. Phys. Chem. A, 2009, 113, 3116–3120 CrossRef CAS PubMed.
- S. Loganathan, M. Tikmani, S. Edubilli, A. Mishra and A. K. Ghoshal, Chem. Eng. J., 2014, 256, 1–8 CrossRef CAS.
- F. Yang, X. Zhu, J. Wu, R. Wang and T. Ge, Powder Technol., 2022, 399, 117090 CrossRef CAS.
- G. Song, X. Zhu, R. Chen, Q. Liao, Y. D. Ding and L. Chen, Chem. Eng. J., 2016, 283, 175–183 CrossRef CAS.
- J. C. Morris and W. J. Weber, Adv. Water Pollut. Res., 1964, 231–266 Search PubMed.
- L. Valenzano, B. Civalleri, S. Chavan, S. Bordiga, M. H. Nilsen, S. Jakobsen, K. P. Lillerud and C. Lamberti, Chem. Mater., 2011, 23, 1700–1718 CrossRef CAS.
- G. C. Shearer, S. Chavan, J. Ethiraj, J. G. Vitillo, S. Svelle, U. Olsbye, C. Lamberti, S. Bordiga and K. P. Lillerud, Chem. Mater., 2014, 26, 4068–4071 CrossRef CAS.
- M. J. Cliffe, W. Wan, X. Zou, P. A. Chater, A. K. Kleppe, M. G. Tucker, H. Wilhelm, N. P. Funnell, F. X. Coudert and A. L. Goodwin, Nat. Commun., 2014, 5, 4176 CrossRef CAS PubMed.
- M. R. DeStefano, T. Islamoglu, S. J. Garibay, J. T. Hupp and O. K. Farha, Chem. Mater., 2017, 29, 1357–1361 CrossRef CAS.
- V. R. Bakuru, S. R. Churipard, S. P. Maradur and S. B. Kalidindi, Dalton Trans., 2019, 48, 843–847 RSC.
- S. Huang, D. G. Truhlar, A. Tang, X. He, H. Yin, Y. Li and Y. Zhang, J. Phys. Chem. C, 2021, 125, 9679–9687 CrossRef.
- S. Øien, D. Wragg, H. Reinsch, S. Svelle, S. Bordiga, C. Lamberti and K. P. Lillerud, Cryst. Growth Des., 2014, 14, 5370–5372 CrossRef.
- Y. Zhao, Y. Shen, L. Bai and S. Ni, Appl. Surf. Sci., 2012, 261, 708–716 CrossRef CAS.
- R. Zafari, F. G. Mendonça, R. Tom Baker and C. Fauteux-Lefebvre, Sep. Purif. Technol., 2023, 308, 1383–5866 CrossRef.
- A. C. Lua and T. Yang, Chem. Eng. J., 2009, 155, 175–183 CrossRef CAS.
- M. Auta and B. H. Hameed, Chem. Eng. J., 2014, 253, 350–355 CrossRef CAS.
- E. C. N. Lopes, F. S. C. Dos Anjos, E. F. S. Vieira and A. R. Cestari, J. Colloid Interface Sci., 2003, 263, 542–547 CrossRef CAS PubMed.
- W. Kukulka, K. Cendrowski, B. Michalkiewicz and E. Mijowska, RSC Adv., 2019, 9, 18527–18537 RSC.
- W. Liang, C. J. Coghlan, F. Ragon, M. Rubio-Martinez, D. M. D'Alessandro and R. Babarao, Dalton Trans., 2016, 45, 4496–4500 RSC.
- J. Y. Lee, L. Pan, S. P. Kelly, J. Jagiello, T. J. Emge and J. Li, Adv. Mater., 2005, 17, 2703–2706 CrossRef CAS.
- S. R. Caskey, A. G. Wong-Foy and A. J. Matzger, J. Am. Chem. Soc., 2008, 130, 10870–10871 CrossRef CAS PubMed.
- S. Sircar, R. Mohr, C. Ristic and M. B. Rao, J. Phys. Chem. B, 1999, 103, 6539–6546 CrossRef CAS PubMed.
- L. Lei, Y. Cheng, C. Chen, M. Kosari, Z. Jiang and C. He, J. Colloid Interface Sci., 2022, 612, 132–145 CrossRef CAS PubMed.
- B. Han and A. Chakraborty, Int. J. Heat Mass Transfer, 2022, 186, 122473 CrossRef CAS.
- B. Han and A. Chakraborty, Energy Convers. Manage., 2020, 213, 112825 CrossRef CAS.
- P. Ghosh, Y. J. Colón and R. Q. Snurr, Chem. Commun., 2014, 50, 11329–11331 RSC.
- S. G. Musa, Z. M. Aljunid Merican and A. Haruna, J. Solid State Chem., 2022, 314, 123363 CrossRef CAS.
- A. Chakraborty, B. B. Saha, S. Koyama and K. C. Ng, Appl. Phys. Lett., 2006, 89(17), 171901 CrossRef.
- J. A. Dunne, M. Rao, S. Sircar, R. J. Gorte and A. L. Myers, Langmuir, 1996, 12, 5896–5904 CrossRef CAS.
- S. H. Madani, S. Sedghi, M. J. Biggs and P. Pendleton, ChemPhysChem, 2015, 16, 3797–3805 CrossRef CAS PubMed.
Footnote |
| † Electronic supplementary information (ESI) available. See DOI: https://doi.org/10.1039/d4dt00941j |
| This journal is © The Royal Society of Chemistry 2024 |