Lanthanide complexes with an azo-dye chromophore ligand: syntheses, crystal structures, and near-infrared luminescence by long-wavelength excitation†
Yun-Long
Chen
ab,
Min
Feng
*bc,
Xiaofei
Zhu
*a and
Zhiping
Zheng
 *bc
*bc
aSchool of Chemistry and Life Science, Changchun University of Technology, Changchun, 130012, China. E-mail: zhuxiaofei@ccut.edu.cn
bDepartment of Chemistry, Southern University of Science and Technology, Shenzhen, 518055, China. E-mail: fengm@sustech.edu.cn; zhengzp@sustech.edu.cn
cKey University Laboratory of Rare Earth Chemistry of Guangdong, Southern University of Science and Technology, Shenzhen, Guangdong 518055, China
First published on 9th April 2024
Abstract
Near-infrared (NIR) emissive probes are becoming increasingly popular in biological sensing and imaging due to the advantages of non-invasiveness and deep tissue-penetrating ability. Herein, a series of complexes of trivalent lanthanide ions (Ln = Yb, Er, and Gd) with the commercially available azo dye chromophore 2R (Na2H2C2R) as ligand and featuring respectively H2O and dimethylsulfoxide (DMSO) as ancillary ligands have been prepared. Formulated as [Ln2(HC2R)2(H2O)10]·8H2O (1–3, Ln = Yb, Er, Gd) and [Ln2(HC2R)2(DMSO)10]·2DMSO (4–6, Ln = Yb, Er, Gd), their structures have been determined by single-crystal X-ray diffraction studies. Photophysical property studies revealed NIR emissions of the DMSO complexes characteristic of Yb(III) and Er(III), effectively sensitized by the dye ligand arising mainly from the π–π* transition of the chromophore. The long-wavelength excitation of the complexes, covering the whole visible-light range and extending into the NIR region, portends the potential applications of such complexes for flexible bioimaging and sensing.
1. Introduction
Probes emitting in the near infrared (NIR) spectral window are important for bioimaging applications due largely to the advantages of the deep tissue-penetrating ability and non-invasiveness of this imaging modality.1–3 In this context, lanthanide complexes, those of trivalent yitterbium (Yb) and erbium (Er) in particular, are of interest because of the unique luminescence characteristics of these unique metal ions. Specifically, the metal ions can be effectively sensitized by judiciously selected ligands that act as excitation-energy harvesting antennae to produce sharp emission with large Stokes shift. This characteristic sharply contrasts with the broader emission spectra typical of organic–inorganic hybrids,4 enabling more precise targeting in bioimaging applications. And the pronounced Stokes shift observed in Ln complexes significantly enhances the signal-to-noise ratio compared to most small organic dyes,5 facilitating clearer imaging outcomes. The up-to-millisecond luminescence lifetimes allow for time-gated imaging for background-free in vivo tracking of biological events and processes, and stability of the probe is benefited from the photobleaching resistance of the lanthanide ions.6 When compared with quantum-dot-based probes, the safety concern due to the toxicity of certain metal ions is significantly reduced.7The research of molecular NIR probes has been concentrated on the use of complexes with porphyrin-type of ligands, thanks largely to their intense visible light absorption ability and the high stability of the complexes resulting from the chelation of the metal ion by the rigid macrocyclic structure.8,9 Complexes of Yb(III) with excellent NIR emission characteristics are known10–12 Propitious traits for NIR imaging notwithstanding, the costs associated with the challenging ligand synthesis, generally laborious ligand purification, and the low solubility of the ligand or complexes together present significant challenges for the further development of such NIR probes. On the other hand, the lights for the excitation of such complexes fall mostly in the blue range (400–430 nm) (Table 1),10,13–15 and the low-efficiency of such lights for deep-tissue excitation of the probe significantly limits the practical applications of such probes. The efforts to enlarge the spectral window for probe-excitation,16–19 have only been met with limited success with a sole encouraging case of Yb(III) emission being co-sensitized by porphyrin and arguably the most extensively used fluorescence dye of boron-dipyrromethene (BODIPY) in the 450-to-560 nm range.18 Other dyes with strong visible light absorption have been explored for a similar capacity. For example, phthalexone S (λex = 532 nm),20 xylenol blue (λex = 532 nm),21 1-phenylazo-2-naphtol (λex = 532 nm),21 terpyridine–boradiazaindacene dyes (λex = 536 nm),22 BODIPY-functionalized 1,10-phenanthroline (λex = 574 nm),23 and azo dye (λex = 450 nm)24 have been shown to reasonably effectively sensitize the NIR emissions of Yb(III), Er(III), and Nd(III) (Table 1). However, these Ln-dye complexes still suffer from low tissue penetration efficiency due to the excitation wavelengths that are generally shorter than 600 nm (Table 1).
| Compounds | Quantum yield (%) | Excitation wavelength (nm) | Ref. |
|---|---|---|---|
| Yb-[D18]-F28TPP | 63 | 425 | 10 |
| [Yb(por)(acac)] | 4.1 | 420 | 13 |
| Yb-down-CD3 | 9.2 | 406 | 14 |
| Yb-DD | 3.5 | 425 | 15 |
| [Yb(TPP)(OAc) (BDP-Phen)] | — | 450–560 | 18 |
| Yb-PS | 1.451 | 532 | 20 |
| Yb-PAN | 0.12 | 532 | 21 |
| Yb-XB | 0.11 | 532 | 21 |
| [Yb(Boditerpy)(NO3)3] | 0.31 | 514 | 22 |
| Yb-4I-(BODIPY-Phen) | 0.94 | 547 | 23 |
| Yb-Azo | 8.4(1) × 10−5 | 450 | 24 |
| 4 | 0.36 (λex = 659 nm) | 300–750 | This work |
Chromotropic acid dyes present a potential class of alternatives due to their strong visible light absorption characteristics.25,26 Furthermore, the versatility of such dyes made possible with various substituents or functional groups on the skeleton of the dye allows for fine tuning of the electronic structures and absorption properties, and therefore, the ability to sensitize the lanthanide ions for optimal NIR luminescence. In this work, an inexpensive and readily available commercial azo dye Na2H2C2R as ligand for the aforementioned purpose was explored (Scheme 1); its unit price is only one-hundredth of that of porphyrin. We succeeded in the syntheses and structure determination by single-crystal X-ray diffraction studies of two sets of complexes of Yb(III), Er(III), and Gd(III), one containing H2O as ancillary ligand and the other with the aqua ligands being replaced by dimethylsulfoxide. Photophysical property studies revealed significant enhancement of the luminescence intensity of the Yb(III) and Er(III)-based emission, credited to the effective energy transfer from the triple excited states of the dye ligand to the emissive metal ion center. Time-dependent density functional theory (TD-DFT) calculations indicated that the excitation mainly arises from the π–π* transition of the dye ligand, and more importantly, the excitation wavelength range of these complexes is relatively wide, covering the entire visible region and extending even into the NIR zone (300–750 nm).
2. Experiment section
2.1 Materials and characterization
All reagents including solvents were obtained commercially and used as received. Ln(NO3)3 (Ln = Yb, Er, Gd) was prepared and used as aqueous stock solutions (1.25 M). Fourier transform infrared (FT-IR) spectra were obtained on a Bruker Vertex 80 FT-IR spectrometer in the attenuated total reflection mode in the 800-to-4000 cm−1 range. The solid-state UV-vis spectra were recorded at room temperature on a UV-3600i Plus spectrophotometer with BaSO4 as reference. Elemental analyses were carried out on an Elementar Vario EL cube elemental analyzer. Powder X-ray diffraction (PXRD) studies were done on a Rigaku SmartLab 9 kW X-ray diffractometer with Cu Kα radiation (scanning rate 10° min−1 and 2q ranging from 5–50°).For the luminescent experiments at room temperature, complexes 4–6 were measured in solid state kept in a closed Ar-filled cuvette to avoid deliquescence. Emission spectra, lifetime, and quantum yield measurements were recorded in the solid state on an Edinburgh Analytical Instruments FLS1000 and FLS980 steady-state spectrometer (450 W Xe lamp/60 W microsecond flash lamp, Hamamatsu R5509-73 PMT with C9940-02 cooler for NIR emission spectrum). The quantum yield of ([Yb2(HC2R)2(DMSO)10]·2DMSO, 4) was determined using an integrating sphere (150 mm, PTFE inner surface) with a PMT C9940-02 NIR emission detector. Quantum yield (Q) was calculated using the equation
2.2 X-ray crystallography
Single-crystal X-ray diffraction data were collected on a Bruker D8 Venture diffractometer using graphite monochromatized Mo Kα radiation (l = 0.71073 Å) and graphite monochromatized Ga Kα radiation (l = 1.34139 Å) at 100 K. The structures were solved by direct methods, and all non-hydrogen atoms were refined for anisotropy by full matrix least squares on F2 using the SHELXS crystallographic package.27 The crystal data and structure refinement details are summarized in Tables S1 and S2.†2.3 Computation studies
DFT geometry optimizations and TD-DFT excitation energy calculations of H2C2R2− and [Lu2(HC2R)2(DMSO)10] were carried out by using the Gaussian 16 (revision A.03) package28 at the level of PBE0-D3BJ.29,30 The optimization of [Lu2(HC2R)2(DMSO)10] is based on the crystal structure of 4 with its solvent molecules of crystallization removed. The Yb atoms are replaced by Lu to avoid convergence problems, and only the positions of the hydrogen atoms are optimized. Ahlrichs’ def2-TZVPP31 and SVP32 basis sets were used for the atoms of H2C2R2− and [Lu2(HC2R)2(DMSO)10], respectively. The core electrons of Ln(III) are treated with an effective core potential (ECP60MWB).33 The first 50 monoelectronic excitations were calculated. The polarizable continuum model (PCM) of water was applied as solvent in both DFT geometry optimizations and TD-DFT excitation energy calculations for H2C2R2−.34 The hole–electron analysis was carried out with Multiwfn 3.8(dev).352.4 Synthesis
1: yield: 29 mg (39%). Elemental analyses (%, based on 6 water molecules of crystallization) calcd for C32H50N4O32S4Yb2 (1477.09): C, 26.02; H, 3.41; N, 3.79. Found: C, 26.02 H, 3.23; N, 3.76; IR (cm−1): 802(w), 841(w), 895(w), 930(w), 980(w), 1041(s), 1119(m), 1161(s), 1207(m), 1304(w), 1404(m), 1454(w), 1493(m), 1558(w), 1612(w), 1643(w), 2904(w), 2985(w), 3228(b), 3336(b).
2: 56 mg (77%). Elemental analysis (%, based on 6 water molecules of crystallization) calcd for C32H50N4O32S4Er2 (1465.53): C, 26.63; H, 3.82; N, 3.44. Found: C, 26.69; H, 3.33; N, 3.83; IR (cm−1): 802(w), 841(w), 895(w), 930(w), 984(w), 1041(s), 1122(m), 1169(s), 1207(m), 1308(w), 1404(m), 1454(w), 1493(m), 1558(w), 1612(w), 1647(w), 2904(w), 2985(w), 3356(b).
3: yield: 60 mg (84%). Elemental analysis (%, based on 6 water molecules of crystallization) calcd for C32H50N4O32S4Gd2 (1445.51): C, 26.59; H, 3.49; N, 3.88. Found: C, 26.80; H, 3.29; N, 3.86; IR (cm−1): 806(w), 841(w), 895(w), 930(w), 984(w), 1045(s), 1122(m), 1176(s), 1219(m), 1308(w), 1404(m), 1454(w), 1493(m), 1558(w), 1612(w), 1647(w), 2904(w), 2985(w), 3363(b).
4: yield: 31 mg (40%). Elemental analysis (%) calcd for C56H90N4O28S16Yb2 (2126.35): C, 31.63; H, 4.27; N, 2.63. Found: C, 32.02; H, 4.17; N, 2.93; IR (cm−1): 825(w), 903(w), 960(m), 999(s), 1038(s), 1099(w), 1157(s), 1184(s), 1219(w), 1315(w), 1404(m), 1439(w), 1454(w), 1485(m), 1566(w), 1608(w), 2912(w), 2997(w), 3518(b), 3602(w), 3671(b), 3730(w).
5: (reaction at 60 °C) yield: 62 mg (80%). Elemental analysis (%) calcd for C56H90N4O28S16Er2 (2114.79): C, 31.80; H, 4.29; N, 2.65. Found: C, 32.26; H, 4.31; N, 2.97; IR (cm−1): 825(w), 899(w), 964(m), 999(s), 1038(s), 1126(w), 1157(s), 1184(s), 1223(w), 1315(w), 1404(m), 1439(w), 1454(w), 1485(m), 1566(w), 1608(w), 2904(w), 2985(w), 3518(b), 3599(w), 3664(b), 3726(w).
6: (reaction at 70 °C) yield: 74 mg (95%). Elemental analysis (%) calcd for C56H90N4O28S16Gd2 (2094.77): C, 32.11; H, 4.33; N, 2.67. Found: C, 32.53; H, 4.05; N, 2.87; IR (cm−1): 825(w), 899(w), 960(m), 999(s), 1038(s), 1126(w), 1157(s), 1180(s), 1219(w), 1315(w), 1400(m), 1435(w), 1454(w), 1485(m), 1562(w), 1608(w), 2908(w), 2989(w), 3521(b), 3602(w), 3668(b), 3730(w).
3. Results and discussion
3.1 Syntheses and characterization
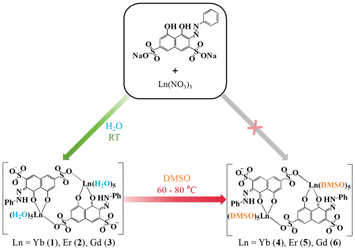
The aqua complexes (1–3) were prepared by mixing Ln(NO3)3 (Ln = Yb, Er, Gd), H2C2RNa2, and NEt3 in water at room temperature, and the product in each case was obtained as a crystalline solid. The DMSO complexes (4–6) were obtained by treating the corresponding aqua complexes with anhydrous DMSO under solvothermal conditions (at 80 °C, 60 °C, and 70 °C for 4, 5, 6, respectively) (Scheme 2).All complexes have been structurally characterized by single-crystal X-ray diffraction studies. The phase purity of the products were verified with satisfactory elemental analyses (CHN) calculated based on six water molecules of crystallization in the dried and constant-weight samples, with the note that the formulae derived from the crystallographic analyses are with eight water molecules of crystallization. The infrared spectra of the complexes show the peaks characteristic of the functional groups in the organic and aqua ligands.
3.2 Crystallographic analyses
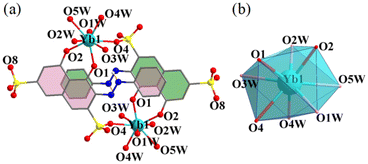
Single crystal X-ray diffraction analyses were carried out for all the six complexes. The aqua complexes 1–3, crystallize in the monoclinic space group P21/n, are isostructural. As a representative, the salient features of 1 are discussed below. The centrosymmetric dinuclear complex consists of two asymmetric units, with each containing one Yb3+ ion, one monodeprotonated HC2R3− ligand, five aqua ligands, and four water molecules of crystallization (Fig. 1a). The Yb3+ ions within the unit, separated by 8.724(4) Å, are linked by two HC2R3− ligands into a ring-like arrangement. The Yb3+ ion is octa-coordinate and situated in a coordination sphere of approximately square antiprismatic geometry formed by two oxygen atoms from one of the HC2R3− ligands (hydroxyl O2 and carbonyl O1), one oxygen atom (O4) from the –SO3− group of the other HC2R3− ligand, and five oxygen atoms (O1W–O5W) from the aqua ligands (Fig. 1b and Table S3†).34 The Yb–O bond lengths, from 2.207(4) to 2.427(4) Å, fall into the range expected for Yb–O coordination.Complexes 4–6 are also isostructral, and thus, only the salient structural features of 4 are discussed below. Overall, the structure of 4 is similar to that of 1, but with the coordination of each of the two Yb atoms by five DMSO ligands in place of the aqua ligands in 1 (Fig. 2). The second piece of distinct difference is the two HC2R3− ligands are nearly coplanar in 4 (Fig. S1b†), as opposed to being disposed in a parallel arrangement in the structure of 1 (Fig. 1a and S1a†). The intramolecular Yb⋯Yb distance is 8.463 Å, and the Yb–O bond lengths are in the range of 2.269(3)–2.423(3) Å (Table S4†).
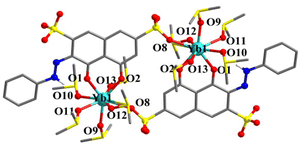 | ||
| Fig. 2 The crystal structure 4 with the DMSO molecules of crystallization and all non-N-bound H atoms being omitted for clarity (color code: Yb, cyan; O, red; N, blue; S, yellow; C, gray; H, white). | ||
3.3 Absorption properties
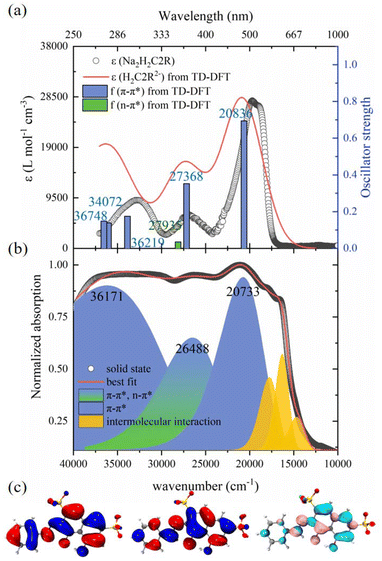
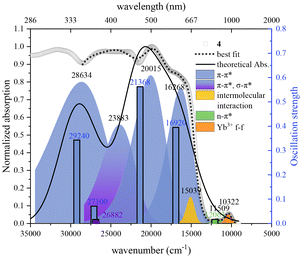
The photophysical properties of 1–6 were studied with respect to the organic ligand by using UV-vis absorption and photoluminescence spectroscopy.The UV-Vis absorption spectrum of an aqueous solution of Na2H2C2R is shown in Fig. 3a, together with the one produced by TD-DFT calculations. The calculated spectrum is in close alignment with the experimental one. According to the molecular orbital diagram for H2C2R2− (Fig. 3c and S3, Table S6†) and, the absorption centered at 508 nm is attributed to the π–π* excitation of the aromatic rings, while the bands at 373 nm and 307 nm mainly arise from the π–π* excitation of the conjugated rings, with some minor contributions from the SO3−-to-rings n–π* charge transfer. The absorption of solid Na2H2C2R features additional bands above ca. 563 nm up to 800 nm (Fig. 3b), possibly due to intensified intermolecular interactions in the solid state.
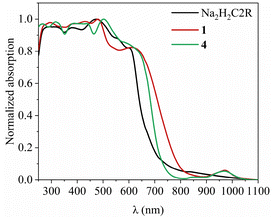
The complexes are barely soluble in water despite the presence of the –SO3− groups, which may be understood in terms of their non-ionic nature. Consequently, their UV-Vis-NIR absorption spectra shown in Fig. 4 and S7† were measured using solid samples. All six complexes exhibit similar features despite the presence of different neutral ancillary ligands. As a representative, complex 4 also displays absorption in the range of 250–1050 nm. At the point where the absorption strength is 50%, the complex 4 shows a red shift of ca. 50 nm compared to that of the ligand Na2H2C2R. The lowest calculated energy band at 829 nm for [Lu2(HC2R)2(DMSO)10] – an analogue of 4 – agrees reasonably well with the band at 869 nm in the experimentally obtained spectrum that corresponds to the sulfo-to-conjugated-rings n–π* charge transfer (Fig. 5 and S5, S6†). The lowest-energy band at 969 nm can be ascribed to the 2F5/2–2F7/2 transition of the Yb(III) ion. This absorption is also present in the spectrum of 1 (Fig. 4 and S7†). The other absorptions in the UV-Vis region are attributable to the π–π* transition of HC2R3−, accompanied by a minor σ–π* excitation at 372 nm of the ligand (Fig. S5, S6 and Table S7†). An intermolecular interaction is credited with producing the absorption centered around 665 nm.
3.4 Emission properties
Upon excitation at 465 nm, solid 1 displays a weak yet recognizable emission in the 900–1100 nm range (Fig. 6a and S9†), attributable to the 2F5/2 → 2F7/2 transition of the Yb(III) ion.36 The subdued intensity of the emission is likely due to the presence of the aqua ligands. The O–H bonds, exhibiting high-frequency vibrations, can effectively quench the emission by deactivating the Yb* state (Fig. S8†).37,38 Aqua lanthanide complexes are thus generally not easily sensitized. Therefore, the observed emission from 1, albeit weak, suggests the ability of HC2R3− in sensitizing Yb(III) in 1.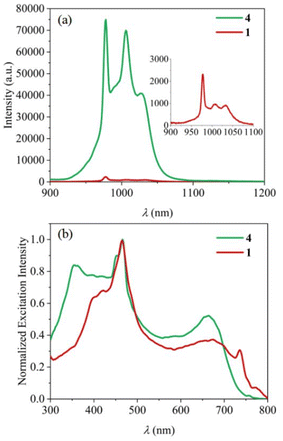 | ||
| Fig. 6 (a) NIR emission spectra (λex = 465 nm) and (b) excitation spectra (λem = 978 nm) of 1 and 4 in solid state with the same experimental conditions. | ||
The aqua ligands were subsequently replaced with DMSO in order to enhance the luminescence. As anticipated, the luminescence of 4 is significantly intensified, registering an enhancement 31 times as large as that of 1 (Fig. 6a). This emission is characterized by a monoexponential decay lifetime of 6.1 μs (Fig. S10†). There is an additional weak emission in the range of 650–900 nm (Fig. S9†). This can be attributed to the emission of the HC2R3− ligand, suggesting that the T1 → Yb* energy transfer may not be fully efficient. This might be caused by the hydrogen bond on the N-NH group in the close proximity of the emissive Yb(III) ion (Fig. 2); this hydrogen atom comes from the resonance of a naphthol group near the azo group. Deprotonating this N-NH group proves to be challenging, as the hydrogen persists even in the presence of ten equivalents of a base. Further enhancement in the emission could be achieved with azo dye ligands without having any of such luminescence-quenching functional groups near the metal center.
The excitation spectra for complexes 1 and 4 are depicted in Fig. 6b. The shared pronounced peak at 465 nm is attributed to the π–π* excitation of the HC2R3−. The excitation bands, ranging from 300 to 800 nm, cover the entirety of the visible spectrum with extension into the NIR region (Fig. S12 and S13†). Remarkably, with a relatively long excitation wavelength (λex = 659 nm), complex 4 still achieves ca. 50% of its maximum emission achieved with λex = 465 nm. The absolute quantum yield of 4 upon the excitation at λex = 659 nm is 0.36% (Fig. S15†). Such a broad range of excitation is rarely observed for NIR Yb complexes. As an example for comparison, the extensively researched Yb-porphyrin complexes, having the highest recorded Yb NIR quantum yield,10 possess excitations characterized by two narrow peaks centered around 425 nm. The advantage of a broad excitation spectrum is its adaptability, allowing for diverse application scenarios that may require varying excitation wavelengths or even the full spectrum of white light.39–41 This adaptability enhances photon capture and boosts emission quantum yield, with long-wavelength excitation being inherently advantageous for in situ Ln sensitization within tissues. Therefore, the expansive excitation range of these complexes underscores their potential versatility across a variety of applications.
To further elucidate the T1 → Yb* energy transfer process in 1 and 4, the phosphorescence of their Gd analogues 3 and 6 were measured to determined the energetic level of the T1 state of the ligand (Fig. S8†).42,43 The spectra recorded at 78 K show broad emissions ranging from 650 to 1200 nm (8333–15![[thin space (1/6-em)]](https://www.rsc.org/images/entities/char_2009.gif) 385 cm−1) and the multiple sublevels of their triplet states (Fig. 7). However, details of these sublevels are lost at room temperature, leaving only a single phosphorescent peak (Fig. S14†). Their phosphorescence maxima at 78 K were at 837 nm (11
385 cm−1) and the multiple sublevels of their triplet states (Fig. 7). However, details of these sublevels are lost at room temperature, leaving only a single phosphorescent peak (Fig. S14†). Their phosphorescence maxima at 78 K were at 837 nm (11![[thin space (1/6-em)]](https://www.rsc.org/images/entities/char_2009.gif) 947 cm−1) and 687 nm (14
947 cm−1) and 687 nm (14![[thin space (1/6-em)]](https://www.rsc.org/images/entities/char_2009.gif) 556 cm−1), respectively. Thus, the energy differences (ΔE) between T1 and Yb* (which is 969 nm or 10
556 cm−1), respectively. Thus, the energy differences (ΔE) between T1 and Yb* (which is 969 nm or 10![[thin space (1/6-em)]](https://www.rsc.org/images/entities/char_2009.gif) 320 cm−1, as derived from the absorption of 4) for 1 and 4 are calculated to be 1627 and 4236 cm−1, respectively.
320 cm−1, as derived from the absorption of 4) for 1 and 4 are calculated to be 1627 and 4236 cm−1, respectively.
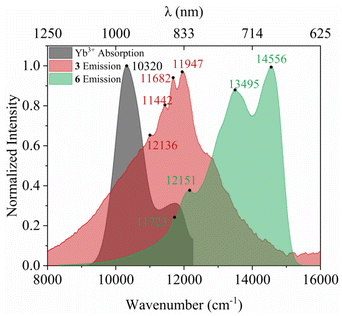 | ||
| Fig. 7 Phosphorescent spectra of complexes 3 and 6 at 78 K, and the absorption spectrum of 4 at room temperature. | ||
Prior research suggests that when ΔE is smaller than 1850 cm−1, sizable back energy transfer from Yb* to T1 can occur, leading to reduced Yb* luminescence.44,45 In this work, the ΔE for 1 falls below the 1850 cm−1 threshold, indicating that back energy transfer may be occurring. On the other hand, the ΔE values for 4 is well above this threshold, suggesting the absence of back energy transfer.
Under excitation at 464 nm, the Er complexes 2 and 5 each display broad emissions in the 1300–1600 nm range, originated from the 4I13/2 → 4I15/2 transition of Er(III) (Fig. S11a†). The emission by 5 is also significantly enhanced over the corresponding aqua complex 2. Alongside the Er emission, a prominent emission band between 650–1000 nm is discernible. Similar to the case of 4, this emission can be assigned to that of HC2R3− indicating that the T1 → Er* energy transfer is not fully efficient. Complexes 2 and 5 both exhibit broad excitation spectra from 300 to 600 nm (Fig. S11b†) as observed for the Yb(III) complexes, confirming this broad excitation is an intrinsic property of these Ln-HC2R complexes.
4. Conclusion
This work explored the use of the azo dye chromophore 2R as a cost-effective and readily available ligand for the sensitization of Er(III) and Yb(III) for NIR luminescence. Two sets of complexes, formulated respectively as [Ln2(HC2R)2(H2O)10]·8H2O and [Ln(HC2R)(DMSO)10]·2DMSO (Ln = Yb, Er, and Gd) were prepared and structurally characterized by single-cystal X-ray diffraction studies. Significantly enhanced NIR emission characteristic of Yb(III) and Er(III) were observed when the aqua ligands are replaced with DMSO. Photophysical studies point to the effective but imperfect energy transfer from the dye ligand's triplet excited states to the emissive lanthanide center. The broad excitation spectrum of these complexes, covering the whole UV-visible spectral window and extending into the NIR region makes the present complexes and more exactly the azo dye ligand potentially valuable for the making NIR-emitting complexes for biosensing applications. Further improvement in molecular design is to be achieved with analogous dye ligands but without the presence of any high-energy vibrating functional groups in the proximity of the emissive metal center.Conflicts of interest
There are no conflicts to declare.Acknowledgements
This work was financially supported by the National Natural Science Foundation of China (92261203, 21971106), the Science Research Foundation of Jilin Province (YDZJ202301ZYTS478), the Stable Support Plan Program of Shenzhen Natural Science Fund (20200925161141006), Shenzhen Science and Technology Program (no. JCYJ20220818100417037), Shenzhen Postdoctoral Research Fund (K21217521), and Guangdong Basic and Applied Basic Research Foundation (2021A1515110855). The theoretical calculations were supported by Center for Computational Science and Engineering at Southern University of Science and Technology.References
- G.-Q. Jin, D.-E. Sun, X. Xia, Z.-F. Jiang, B. Cheng, Y. Ning, F. Wang, Y. Zhao, X. Chen and J.-L. Zhang, Angew. Chem., Int. Ed., 2022, 61, e202208707 CrossRef CAS PubMed.
- R. Feng, G. Li, C.-N. Ko, Z. Zhang, J.-B. Wan and Q.-W. Zhang, Small Struct., 2023, 4, 2200131 CrossRef CAS.
- J. Zhou, P. Jangili, S. Son, M. S. Ji, M. Won and J. S. Kim, Adv. Mater., 2020, 32, 2001945 CrossRef CAS PubMed.
- B. Su, S. Geng, Z. Xiao and Z. Xia, Angew. Chem., Int. Ed., 2022, 61, e202208881 CrossRef CAS PubMed.
- H. Chen, L. Liu, K. Qian, H. Liu, Z. Wang, F. Gao, C. Qu, W. Dai, D. Lin, K. Chen, H. Liu and Z. Cheng, Sci. Adv., 2022, 8, eabo3289 CrossRef CAS PubMed.
- H. Chen, Z. Jiang, H. Hu, B. Kang, B. Zhang, X. Mi, L. Guo, C. Zhang, J. Li, J. Lu, L. Yan, Z. Fu, Z. Zhang, H. Zheng and H. Xu, Nat. Photonics, 2022, 16, 651–657 CrossRef CAS.
- C. Wei, L. Ma, H. Wei, Z. Liu, Z. Bian and C. Huang, Sci. China: Technol. Sci., 2018, 61, 1265–1285 CrossRef CAS.
- W.-L. Chan, C. Xie, W.-S. Lo, J.-C. G. Bünzli, W.-K. Wong and K.-L. Wong, Chem. Soc. Rev., 2021, 50, 12189–12257 RSC.
- Y. Ning, M. Zhu and J.-L. Zhang, Coord. Chem. Rev., 2019, 399, 213028 CrossRef CAS.
- J. Y. Hu, Y. Ning, Y. S. Meng, J. Zhang, Z. Y. Wu, S. Gao and J. L. Zhang, Chem. Sci., 2017, 8, 2702–2709 RSC.
- Y. Y. Ning, G. Q. Jin and J. L. Zhang, Acc. Chem. Res., 2019, 52, 2620–2633 CrossRef CAS PubMed.
- G.-Q. Jin, Y. Ning, J.-X. Geng, Z.-F. Jiang, Y. Wang and J.-L. Zhang, Inorg. Chem. Front., 2020, 7, 289–299 RSC.
- X.-S. Ke, B.-Y. Yang, X. Cheng, S. L.-F. Chan and J.-L. Zhang, Chem. – Eur. J., 2014, 20, 4324–4333 CrossRef CAS PubMed.
- Y. Ning, Y.-W. Liu, Y.-S. Meng and J.-L. Zhang, Inorg. Chem., 2018, 57, 1332–1341 CrossRef CAS PubMed.
- J.-X. Zhang, W.-L. Chan, C. Xie, Y. Zhou, H.-F. Chau, P. Maity, G. T. Harrison, A. Amassian, O. F. Mohammed, P. A. Tanner, W.-K. Wong and K.-L. Wong, Light: Sci. Appl., 2019, 8, 46 CrossRef PubMed.
- Z. Tian, H. Li, Z. Liu, L. Yang, C. Zhang, J. He, W. Ai and Y. Liu, Curr. Treat. Options Oncol., 2023, 24, 1274–1292 CrossRef PubMed.
- M. Cheng, Y.-X. Cui, J. Wang, J. Zhang, L.-N. Zhu and D.-M. Kong, ACS Appl. Mater. Interfaces, 2019, 11, 13158–13167 CrossRef CAS PubMed.
- H. S. He, J. D. Bosonetta, K. A. Wheeler and S. P. May, Chem. Commun., 2017, 53, 10120–10123 RSC.
- D. Balasooriya, B. Liu, H. He, A. Sykes and P. S. May, New J. Chem., 2020, 44, 18756–18762 RSC.
- Y. Korovin and N. Rusakova, J. Fluoresc., 2002, 12, 159–161 CrossRef CAS.
- Y. Korovin and N. Rusakova, J. Alloys Compd., 2004, 374, 311–314 CrossRef CAS.
- R. F. Ziessel, G. Ulrich, L. Charbonnière, D. Imbert, R. Scopelliti and J.-C. G. Bünzli, Chem. – Eur. J., 2006, 12, 5060–5067 CrossRef CAS PubMed.
- A. Kukoyi, E. A. Micheli, B. Liu, H. He and P. S. May, Dalton Trans., 2019, 48, 13880–13887 RSC.
- M. Cieslikiewicz-Bouet, S. V. Eliseeva, V. Aucagne, A. F. Delmas, I. Gillaizeau and S. Petoud, RSC Adv., 2019, 9, 1747–1751 RSC.
- G. D. Sharma, S. K. Gupta and M. S. Roy, J. Mater. Sci.: Mater. Electron., 1998, 9, 91–97 CrossRef CAS.
- V. L. Shah and S. P. Sangal, Microchem. J., 1970, 15, 548–556 CrossRef CAS.
- G. Sheldrick, Acta Crystallogr., Sect. C, 2015, 71, 3–8 CrossRef PubMed.
- M. J. Frisch, G. W. Trucks, H. B. Schlegel, G. E. Scuseria, M. A. Robb, J. R. Cheeseman, G. Scalmani, V. Barone, G. A. Petersson, H. Nakatsuji, X. Li, M. Caricato, A. V. Marenich, J. Bloino, B. G. Janesko, R. Gomperts, B. Mennucci, H. P. Hratchian, J. V. Ortiz, A. F. Lzmaylov, J. L. Sonnenberg, D. Williams-Young, F. Ding, F. Lipparini, F. Egidi, J. Goings, B. Peng, A. Petrone, T. Henderson, D. Ranasinghe, V. G. Zakrzewski, J. Gao, N. Rega, G. Zheng, W. Liang, M. Hada, M. Ehara, K. Toyota, R. Fukuda, J. Hasegawa, M. Lshida, T. Nakajima, Y. Honda, O. Kitao, H. Nakai, T. Vreven, K. Throssell, J. A. Montgomery Jr., J. E. Peralta, F. Ogliaro, M. J. Bearpark, J. J. Heyd, E. N. Brothers, K. N. Kudin, V. N. Staroverov, T. A. Keith, R. Kobayashi, J. Normand, K. Raghavachari, A. P. Rendell, J. C. Burant, S. S. Lyengar, J. Tomasi, M. Cossi, J. M. Millam, M. Klene, C. Adamo, R. Cammi, J. W. Ochterski, R. L. Martin, K. Morokuma, O. Farkas, J. B. Foresman and D. J. Fox, Gaussian, Inc., W. CT, 2016.
- C. Adamo and V. Barone, J. Chem. Phys., 1999, 110, 6158–6170 CrossRef CAS.
- S. Grimme, S. Ehrlich and L. Goerigk, J. Comput. Chem., 2011, 32, 1456–1465 CrossRef CAS PubMed.
- B. P. Pritchard, D. Altarawy, B. Didier, T. D. Gibson and T. L. Windus, J. Chem. Inf. Model., 2019, 59, 4814–4820 CrossRef CAS PubMed.
- A. Schäfer, H. Horn and R. Ahlrichs, J. Chem. Phys., 1992, 97, 2571–2577 CrossRef.
- M. Dolg, H. Stoll, A. Savin and H. Preuss, Theor. Chim. Acta, 1989, 75, 173–194 CrossRef CAS.
- J. Tomasi, B. Mennucci and R. Cammi, Chem. Rev., 2005, 105, 2999–3094 CrossRef CAS PubMed.
- T. Lu and F. Chen, J. Comput. Chem., 2012, 33, 580–592 CrossRef CAS PubMed.
- Y. Hou, J. Shi, W. Chu and Z. Sun, Eur. J. Inorg. Chem., 2013, 2013, 3063–3069 CrossRef CAS.
- A. Heller, J. Am. Chem. Soc., 1966, 88, 2058–2059 CrossRef CAS.
- C. Kruck, P. Nazari, C. Dee, B. S. Richards, A. Turshatov and M. Seitz, Inorg. Chem., 2019, 58, 6959–6965 CrossRef CAS PubMed.
- R. Leben, R. L. Lindquist, A. E. Hauser, R. Niesner and A. Rakhymzhan, Int. J. Mol. Sci., 2022, 23, 13407 CrossRef CAS PubMed.
- J. Li, M. Kang, Z. Zhang, X. Li, W. Xu, D. Wang, X. Gao and B. Z. Tang, Angew. Chem., Int. Ed., 2023, 62, e202301617 CrossRef CAS PubMed.
- C. Ming, M. Pei, F. Song, X. Ren, Y. Cai, G. Wang, F. Yuan, Y. Qin and L. An, Optik, 2018, 156, 754–757 CrossRef CAS.
- Y. Y. Ning, X. S. Ke, J. Y. Hu, Y. W. Liu, F. Ma, H. L. Sun and J. L. Zhang, Inorg. Chem., 2017, 56, 1897–1905 CrossRef CAS PubMed.
- S. Tobita, M. Arakawa and I. Tanaka, J. Phys. Chem., 1985, 89, 5649–5654 CrossRef CAS.
- M. Latva, H. Takalo, V.-M. Mukkala, C. Matachescu, J. C. Rodríguez-Ubis and J. Kankare, J. Lumin., 1997, 75, 149–169 CrossRef CAS.
- J.-A. Yu, J. Lumin., 1998, 78, 265–270 CrossRef CAS.
Footnote |
| † Electronic supplementary information (ESI) available. CCDC 2303845, 2303847, 2303852 and 2303867–2303869. For ESI and crystallographic data in CIF or other electronic format see DOI: https://doi.org/10.1039/d4dt00577e |
| This journal is © The Royal Society of Chemistry 2024 |


