 Open Access Article
Creative Commons Attribution 3.0 Unported Licence
Thermodynamics of the Eu(III)–Mg–SO4–H2O and Eu(III)–Na–SO4–H2O systems. Part I: solubility experiments and the full dissociation Pitzer model†
P. F.
dos Santos
 *a,
A.
Lassin
*b,
X.
Gaona
 a,
K.
Garbev
 c,
M.
Altmaier
a and
B.
Madé
d
aInstitute for Nuclear Waste Disposal, Karlsruhe Institute of Technology, Karlsruhe, Germany. E-mail: pedro.santos@kit.edu
bWater, Environment, Process Development and Analysis Division, BRGM, Orléans, France. E-mail: a.lassin@brgm.fr
cInstitute for Technical Chemistry, Karlsruhe Institute of Technology, Karlsruhe, Germany
dResearch and Development Division, ANDRA, Châtenay-Malabry, France
First published on 14th March 2024
Abstract
The solubility of Eu(III) was investigated under undersaturated conditions in acidic, dilute to concentrated MgSO4 and Na2SO4 solutions at T = (22 ± 2) °C. After attaining equilibrium conditions, solid phases were characterized by a multi-method approach, including X-ray diffraction (XRD), Raman and infrared (IR) spectroscopy, quantitative chemical analysis (ICP-OES) and thermogravimetric analysis (TG-DTA). A total of 45 solubility samples were investigated for the systems Eu2(SO4)3–MgSO4–H2O (19 samples) and Eu2(SO4)3–Na2SO4–H2O (26 samples). Eu2(SO4)3·8H2O(cr) was found to control the solubility of Eu(III) in all investigated MgSO4 solutions, as well as in dilute Na2SO4 systems. The transformation of Eu2(SO4)3·8H2O(cr) into the double salt Na2Eu2(SO4)4·2H2O(cr) was observed at mNa2SO4 > 0.01 mol kg−1. The latter phase is characterized by significantly lower solubility. Based on these experimental solubility measurements, thermodynamic and activity models were proposed based on the Pitzer equations considering the full dissociation of the Eu(III) species in MgSO4 and Na2SO4 aqueous solutions, i.e. deliberately excluding Eu(III)-sulfate complex formation. A combination of the geochemical calculation code PhreeSCALE and the parameter estimation code PEST was used to determine the values of solubility products  and binary and ternary specific interaction parameters (β(0)ij, β(1)ij, Cϕij, θik, Ψijk).
1. Introduction
Europium belongs to the rare-earth elements (REEs), a group of metals comprising the lanthanide series (Ln), which plays an important role in human technology mainly in the field of energy. In addition to its technology-oriented properties, including the well-known Eu luminescence,1,2 europium is often considered as an analogue of trivalent actinides relevant in the context of nuclear waste disposal, e.g. Am(III) and Pu(III).2–4 Besides sharing the same valency, these trivalent lanthanides and actinides have similar structural properties (ionic radii and f-orbital electrons) leading to comparable chemical behavior, including the formation of aqueous complexes of similar stability.5–8The emplacement of nuclear waste in underground repositories is one of the options favored by the international community for the disposal of nuclear waste. In the event of water intrusion, aqueous systems involving radionuclides may form. In this context, accurate knowledge of the aqueous properties and solubility upper limit provides important inputs for the prediction of radionuclide behavior under repository conditions. The composition of these aqueous systems will be largely defined by the waste components, technical barriers and geological formation. For instance, the characteristic pore water of the Callovian–Oxfordian clay rock, selected in the French concept, has an average salinity of 4.3 g L−1, mostly due to its Na, Ca, Mg, Cl and SO4 content.9–11 In the Opalinus clay of the Mont–Terri underground laboratory in Switzerland, the salinity is slightly higher, with an average value of 20.7 g L−1.12 Sulfate is an abundant component in natural groundwater and one of the most relevant anions (besides chloride) in brines, possibly inherited from ancient seawater or forms during salt rock formation, where sulfate concentrations of up to 0.2 M can be expected.13–15 Thermodynamic models can help understand the chemical behavior of dilute to concentrated sulfate-bearing aqueous solutions, including the interactions and/or aqueous complexation reactions that involve such species, as well as the solubility of the corresponding salts.6,16–22Only a few studies considering the solubility of Eu2(SO4)3·8H2O(cr) in the Eu2(SO4)3–H2O binary system are reported in the literature.3,23,24 Amongst these studies, the work published by Rard3 stands out, involving isopiestic and solubility experiments in the absence of any background electrolyte. However, data on the solubility of Eu(III) in dilute to concentrated Eu2(SO4)3–Na2SO4–H2O and Eu2(SO4)3–MgSO4–H2O systems are not available so far. The study by Keyes and James25 focused on the solubility of Sm(III) in the ternary system Sm2(SO4)3–Na2SO4–H2O. The authors observed the formation of a hydrated salt in the form of Na2Sm2(SO4)4·2H2O(cr) at Na2SO4 concentrations above ∼0.01 M. Some studies with different lanthanides reporting the formation of double salts with Na+ are also available in the literature,25–28 but they were performed at low Na2SO4 concentrations and did not conclude any solubility information for a supposed Na2Ln2(SO4)4·2H2O(cr) phase. The lack of relevant experimental solubility data makes it difficult to understand the behavior of Eu(III) and feed the thermodynamic models used to reproduce and estimate such properties. This fact is emphasized by the work of Das et al.,26 showing that in contrast to La, Ce, Pr, Nd and Sm, the experimental data for Eu(III)–SO42− are very scarce.
In the context of a collaborative project between BRGM, KIT and Andra, the present work aimed to acquire experimental data in order to assess the chemical behavior of the two ternary systems Eu2(SO4)3–Na2SO4–H2O and Eu2(SO4)3–MgSO4–H2O, including the solubility of europium in dilute to concentrated aqueous solutions of sodium and magnesium sulfate (0–2.85 mol kg−1 of water) at room temperature. In addition, assuming full dissociation of the dissolved electrolytes, a set of Pitzer-specific interaction parameters and solubility products are proposed for describing the solubility of the Eu2(SO4)3·8H2O(cr) and Na2Eu2(SO4)4·2H2O(cr) salts in Na2SO4 aqueous solutions and Eu2(SO4)3·8H2O(cr) in MgSO4 aqueous solutions. Part II of this work is presented in a separate contribution, involving spectroscopic characterization of Eu(III) in the aqueous phase and including thermodynamic and (SIT, Pitzer) activity models specifically accounting for Eu(III)–SO4 aqueous complexes.
2. Experimental
2.1. Chemicals
All solutions were prepared with ultra-pure water and purified with a Milli-Q academic apparatus (Merck Millipore, 18.2 MΩ cm, 22 ± 2 °C, pore size 0.22 μm). Magnesium sulfate heptahydrate (MgSO4·7H2O, p.a., 99.5 wt%) and europium(III) sulfate octahydrate (Eu2(SO4)3·8H2O(cr), p.a., 99.9 wt%) were purchased from ThermoFisher Scientific. Anhydrous sodium sulfate (Na2SO4, p.a., >99 wt%) was obtained from Merck.2.2. pH measurements
Proton concentration, pHm (pHm = −log[H+] in molal units, mol kg−1), was measured using a combination of pH electrodes (ROSS Orion, with 3 M KCl as the filler solution) calibrated against pH standards (pH 2–7, Merck). The pHm values were obtained from the measured pHexp values considering pHm = pHexp + Am, where Am is a correction factor entailing the activity coefficient of H+ and the liquid junction potential of the electrode at a given background electrolyte concentration. Am values for Na2SO4 systems were taken as reported by Duckworth et al.29 (work performed between 0.1 and 1.75 mol kg−1 of Na2SO4). Am values for the MgSO4 aqueous systems are not available in the literature, and experimental values, pHexp, are reported instead.2.3. Solubility experiments
Solubility experiments were performed using well-characterized Eu2(SO4)3·8H2O(cr) as the starting material. Batch samples were equilibrated at T = (22 ± 2) °C in an independent series of binary aqueous solutions with different concentrations of Na2SO4 in the range 0.000–1.784 mol kg−1 (20 samples) or of MgSO4 in the range 0.006–2.854 mol kg−1 (19 samples). Above the Na2SO4 concentration of 0.015 mol kg−1, the Na2Eu2(SO4)4·2H2O(cr) double salt formed and was recovered for a subsequent series of experiments. The subsequent series of batch solubility experiments used the Na2Eu2(SO4)4·2H2O(cr) double salt and was prepared with a concentration of Na2SO4 ranging between 0.015 and 0.122 mol kg−1 (6 samples). All samples were subjected to constant agitation until thermodynamic equilibrium was achieved, which was assumed after repeated measurements with a constant total Eu(III) concentration. Eu(III) concentration was measured by ICP-OES (inductively coupled plasma optical emission spectroscopy, PerkinElmer Optima 8300 DV) after phase separation by ultrafiltration (10 kDa ≈ 2 nm, Pall Life Science). Aliquots of the original samples were diluted with 2% HNO3 before ICP-OES measurements. The accuracy of ICP-OES measurements was ±2–5%.2.4. Solid-phase characterization
Part of the solid phase of the samples was collected and subjected to several washing and centrifugation steps, with the aim of washing out the background electrolyte. The solid samples of the system containing Na2SO4 were subjected to 5 successive washing steps with absolute ethanol followed by centrifugation at 10.000 g (5 minutes). The samples of solutions containing MgSO4 were subjected to 8 washing and centrifugation steps using a solution of absolute ethanol at four dilution ratios, namely: two steps the absolute temperatur with a ratio of 1![[thin space (1/6-em)]](https://www.rsc.org/images/entities/char_2009.gif) :
:![[thin space (1/6-em)]](https://www.rsc.org/images/entities/char_2009.gif) 5, two steps at 1
5, two steps at 1![[thin space (1/6-em)]](https://www.rsc.org/images/entities/char_2009.gif) :
:![[thin space (1/6-em)]](https://www.rsc.org/images/entities/char_2009.gif) 3, two steps at 1
3, two steps at 1![[thin space (1/6-em)]](https://www.rsc.org/images/entities/char_2009.gif) :
:![[thin space (1/6-em)]](https://www.rsc.org/images/entities/char_2009.gif) 2 and two steps with absolute ethanol only. Once the recovered solid was completely dry, it was subjected to all analyses for solid characterization, namely X-ray diffraction (XRD), Raman and infrared (IR) spectrometry, quantitative chemical analysis and thermogravimetric analysis (TG-DTA) before and after solubility experiments.
2 and two steps with absolute ethanol only. Once the recovered solid was completely dry, it was subjected to all analyses for solid characterization, namely X-ray diffraction (XRD), Raman and infrared (IR) spectrometry, quantitative chemical analysis and thermogravimetric analysis (TG-DTA) before and after solubility experiments.
XRD measurements were performed on an Empyrean diffractometer (Malvern-Panalytical) equipped with a Cu tube in the range 5–90° 2theta with 0.0131° 2theta steps. The CuKβ radiation was filtered with a Bragg–Brentano HD device mounted on the primary beam path. Divergent slits of 1/8°, anti-scattering slits of 1/2° and soller slits of 0.04 Rad were used. The detection was performed with a multi-strip PIXcel 3D detector covering a 2theta of 3.348° simultaneously with 255 single channels. The samples mixed with ethanol were placed on Si sample holders. The data were evaluated with HighscorePlus v.5 with integrated ICDD2004 and COD2021 databases.
Thermogravimetry (TG) and differential thermal analysis (DTA) were performed simultaneously under a N2 atmosphere using a Netzsch instrument (model STA409C Jupiter) with a DSC (differential scanning calorimetry) measuring head. Measurements were performed with 10–50 mg of the solid phase, and the heating rate was 10 K min−1 up to 1200 °C.
Raman spectrometry was performed on an Alpha 300R instrument (WITec, Ulm, Germany) equipped with a Zeiss microscope. A 532 nm laser with tunable power in 0.1 mW steps (TruePower) was used as an excitation source focused on 50× (NA = 0.75) or 100× (NA = 0.9) objectives. Typical laser power was 20 mW (measured on the sample). The measurements as single spots were performed with 1800 L mm−1 and 600 L mm−1 gratings, providing spectral resolution better than 1 cm−1 and 3 cm−1, respectively. Due to strong Eu3+ luminescence, the spectra were recorded with very short acquisition times varying between 0.01 and 1 s, and 10 scans. Raman signals were recorded using a back illuminated CCD with 96% quantum efficiency (QE). The spectra were evaluated with Project 5.3+ software (WITec).
IR spectrometry was performed in ATR mode on a Tensor II spectrometer (Bruker Optics, Ettlingen, Germany) equipped with a deuterated triglycine sulfate (DTGS) detector and a Golden Gate ATR cell with a diamond crystal (Specac Ltd, Orpington, UK). Spectra were acquired in the range 400–4000 cm−1 with 64 scans and a spectral resolution of 2 cm−1. OPUS 8 software was used for the acquisition and evaluation of the IR spectra.
Quantitative chemical analysis was performed by ICP-OES with a PerkinElmer Optima 8300 DV equipment to determine the Eu, S and Na content in the solid. The solid phase was dissolved in 7–10 mL of 2% HNO3 and the solution was used for quantitative chemical analysis.
3. Thermodynamic modelling
The free energy change of a reaction, ΔG, is related to the standard free energy change, ΔG°, and the ion activity product, Q, according to the following classical equation:ΔG = ΔG° + RT![[thin space (1/6-em)]](https://www.rsc.org/images/entities/char_2009.gif) ln ln![[thin space (1/6-em)]](https://www.rsc.org/images/entities/char_2009.gif) Q Q | (1) |
 | (2) |
 , where mi and γi are the molality (mol kg−1) and the activity coefficient (unitless) of i, respectively. m0 is a reference molality, set to 1 mol kg−1, and is thus generally disregarded, like in the following.
By defining the equilibrium constant K of the reaction according to ΔG° = −RT![[thin space (1/6-em)]](https://www.rsc.org/images/entities/char_2009.gif) ln
ln![[thin space (1/6-em)]](https://www.rsc.org/images/entities/char_2009.gif) K, eqn (1) becomes:
K, eqn (1) becomes:
 | (3) |
For a dissolution/precipitation reaction, K represents the solubility product at infinite dilution and can be denoted as  . Generally, when considering a dissolution/precipitation reaction, equilibrium is not reached instantaneously because of kinetic limitations. Out of equilibrium, ΔG ≠ 0 J and the saturation ratio, SR, can be defined by eqn (4):
 | (4) |
SR is commonly used to measure the deviation from equilibrium for a given mineral–solution system. SR > 1 represents supersaturation and thus the tendency towards precipitation. In contrast, SR < 1 represents undersaturation, indicating that, if not present, the solid cannot form or, if in contact with the solution, the solid has a tendency to dissolve. SR = 1 means that ΔG = 0 and, hence, that equilibrium is reached. In this case, eqn (4) reduces to the mass action law:
 | (5) |
The saturation ratio is thus of great importance in determining the equilibrium constant of minerals when the solubility is actually characterized. At the thermodynamic equilibrium, the expression of the solubility product of Eu2(SO4)3·8H2O(cr) at infinite dilution,  , is defined as follows:
| Eu2(SO4)3·8H2O(cr) ↔ 2Eu(aq)3+ + 3SO4(aq)2− + 8H2O(l) | (6) |
 | (7) |
 | (8) |
 | (9) |
 , can be defined as follows:
| Na2Eu2(SO4)4·2H2O(cr) ↔ 2Na(aq)+ + 2Eu(aq)3+ + 4SO4(aq)2− + 2H2O(l) | (10) |
 | (11) |
 | (12) |
 | (13) |
The activity coefficient γi of an aqueous species i is given by the derivative of the excess Gibbs free energy Gex of the solution with respect to the number of moles of species i. In the present work, the excess Gibbs free energy is calculated according to the Pitzer equations,30,31 which involve semi-empirical parameters that represent the specific interactions between solutes (see the ESI†).
The total dissociation of the dissolved electrolytes is assumed analogously to several previous studies under high saline conditions involving Pitzer equations.19,32,33 Hence, full dissociation has been previously considered for other 3![[thin space (1/6-em)]](https://www.rsc.org/images/entities/char_2009.gif) :
:![[thin space (1/6-em)]](https://www.rsc.org/images/entities/char_2009.gif) 2 type electrolytes like Al2(SO4)3,34,35 Cr2(SO4)3, Fe2(SO4)3 and La2(SO4)3.36–38 In the present work, this assumption indicates that only Eu3+, Na+, Mg2+ and SO42− aqueous species are considered in the chemical systems studied (in addition to H2O, H+ and OH− water species). Neither aqueous complexes nor ion pairs are explicitly accounted for in the following: they are represented by specific interactions, instead.
2 type electrolytes like Al2(SO4)3,34,35 Cr2(SO4)3, Fe2(SO4)3 and La2(SO4)3.36–38 In the present work, this assumption indicates that only Eu3+, Na+, Mg2+ and SO42− aqueous species are considered in the chemical systems studied (in addition to H2O, H+ and OH− water species). Neither aqueous complexes nor ion pairs are explicitly accounted for in the following: they are represented by specific interactions, instead.
It should however be noted that previous studies have reported the formation of the Eu(SO4)+, Eu(SO4)2− and Eu(SO4)33− aqueous complexes.4,39–48 Although the consideration of these aqueous complexes allows a more realistic description of the aqueous phase, the number of interaction parameters required for accurate model calculations using the Pitzer formalism increases significantly, with the consequent risk of overparametrization of the investigated system. These aspects are further addressed in Part II of this work (F. dos Santos et al.;49 this journal).
4. Parametrization procedure
To reproduce the solubility behavior of the Eu2(SO4)3–MgSO4–H2O and Eu2(SO4)3–Na2SO4–H2O systems, the parameters to be determined are:- The solubility products at infinite dilution,  and
and  ;
;
- The binary (β(0)ij, β(1)ij, Cϕij, θik) and ternary (Ψijk) specific interaction parameters of the Pitzer model (see the ESI†).
Estimation of these parameters not only requires the experimental solubility data acquired in the present work for the two aforementioned salts, but also the interaction parameters for the binary systems MgSO4–H2O and Na2SO4–H2O, which were determined previously by Lach et al.50 In the present case, the parameterization procedure includes two successive steps in order to develop a consistent model for the two systems investigated. First, the specific interaction parameters and the solubility product log10![[thin space (1/6-em)]](https://www.rsc.org/images/entities/char_2009.gif) Ks,0 were determined for the Eu2(SO4)3–MgSO4–H2O system, which is more constrained than the Eu2(SO4)3–Na2SO4–H2O system due to the formation of the double-salt in the latter case. In the second step, the parameters obtained in the first step were kept unchanged and the parameters specific to the Eu2(SO4)3–Na2SO4–H2O system were determined.
Ks,0 were determined for the Eu2(SO4)3–MgSO4–H2O system, which is more constrained than the Eu2(SO4)3–Na2SO4–H2O system due to the formation of the double-salt in the latter case. In the second step, the parameters obtained in the first step were kept unchanged and the parameters specific to the Eu2(SO4)3–Na2SO4–H2O system were determined.
Optimizations were performed by coupling the geochemical calculation code PhreeSCALE50 with the parameter estimation software PEST51 according to the following principle.16,50,52 PEST calls PhreeSCALE to calculate the target properties of the chemical systems of interest (in this work, the saturation ratio, SR), using an initial set of guess values for the parameters to be estimated (binary and ternary interaction parameters and solubility products). The calculation results are compared to the corresponding experimental values by calculating the objective function that characterizes the deviation with respect to the experimental data. If the convergence criterion is not satisfactory, a new series of calculations is started with a new set of parameters. The optimization is carried out by successive iterations of this procedure until the convergence criterion is satisfactory or the objective function does not evolve any further. In total, 45 solubility data points were used to estimate 9 parameters.
5. Results and discussion
5.1. Solid phase characterization
Fig. 1 shows the powder XRD patterns of the samples A–F equilibrated in MgSO4 solutions (see Table 1 for a description of the sample conditions). In all these samples, Eu2(SO4)3·8H2O(cr) was found to be the only solid phase controlling the solubility of Eu(III). A Rietveld refinement was performed using the structure data of Xu et al.53 The size of the coherent scattering domains was calculated by the double Voigt approach based on the integral breadth using Lorentzian and Gaussian type component convolutions.54 From sample A to sample C, a gradual decrease in the crystal size from 670 to 130 nm is observed, correlating with a small decrease in the volume of the unit cell. Sample D shows once again a greater crystal size of around 350 nm. Samples E and F further show significantly smaller crystal sizes of 130 and 147 nm, respectively. A similar correlation is observed considering the volume of the unit cell. The overall large crystal size of all investigated solids reflects the high crystallinity of the solid phases controlling the solubility.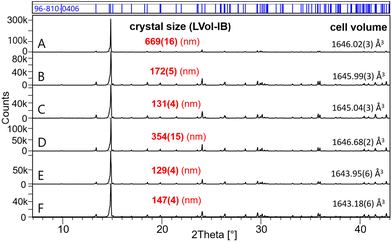 | ||
| Fig. 1 XRD patterns of samples A–F (in MgSO4 aqueous solutions). All patterns match the COD 96-810-0406 for Eu2(SO4)3·8H2O(cr). The calculated crystal size and the cell volume are also shown. | ||
![[thin space (1/6-em)]](https://www.rsc.org/images/entities/char_2009.gif) :
:![[thin space (1/6-em)]](https://www.rsc.org/images/entities/char_2009.gif) Eu or Na
Eu or Na![[thin space (1/6-em)]](https://www.rsc.org/images/entities/char_2009.gif) :
:![[thin space (1/6-em)]](https://www.rsc.org/images/entities/char_2009.gif) Eu ratio) and TG-DTA (number of hydration water molecules, nH2O)
Eu ratio) and TG-DTA (number of hydration water molecules, nH2O)
| Samples | mMgSO4 (mol kg−1) | mNa2SO4 (mol kg−1) | XRD | Raman/IR | ICP-OES | TG-DTA | |||
|---|---|---|---|---|---|---|---|---|---|
| Single salta | Double saltb | Single salta | Double saltb | S![[thin space (1/6-em)]](https://www.rsc.org/images/entities/char_2009.gif) : :![[thin space (1/6-em)]](https://www.rsc.org/images/entities/char_2009.gif) Eu Eu |
Na![[thin space (1/6-em)]](https://www.rsc.org/images/entities/char_2009.gif) : :![[thin space (1/6-em)]](https://www.rsc.org/images/entities/char_2009.gif) Eu Eu |
nH2O | |||
| a Eu2(SO4)3·8H2O(cr). b Na2Eu2(SO4)4·2H2O(cr). c Identified phase. d By IR spectrometry. e By Raman spectrometry. f Presence of Na2SO4 solid. | |||||||||
| A | 0.006 | Xc | Xc,d | 1.62 ± 0.08 | 7.98 ± 0.03 | ||||
| B | 0.052 | Xc | Xc,d | 1.60 ± 0.08 | |||||
| C | 0.804 | Xc | Xc,d | 1.66 ± 0.08 | |||||
| D | 1.310 | Xc | Xc,d | 1.60 ± 0.08 | |||||
| E | 2.490 | Xc | Xc,d | 1.61 ± 0.08 | |||||
| F | 2.695 | Xc | Xc,d | 1.81 ± 0.08 | |||||
| G | 0.000 | Xc | Xc,e | 1.55 ± 0.08 | 8.03 ± 0.07 | ||||
| H | 0.008 | Xc | Xc,e | 1.58 ± 0.08 | |||||
| I | 0.010 | Xc | Xc,e | 1.64 ± 0.08 | |||||
| J | 0.100 | Xc | Xc,e | 1.10 ± 0.06 | 2.08 ± 0.13 | ||||
| K | 0.122 | Xc | Xc,e | 1.07 ± 0.05 | |||||
| L | 0.035 | Xc | Xc,e | 1.07 ± 0.05 | |||||
| M | 0.643 | Xc | Xc,e | 6.59f ± 0.33 | |||||
| N | 1.560 | Xc | Xc,e | 7.03f ± 0.35 | |||||
Fig. 2 shows the powder XRD patterns of samples G–N equilibrated in Na2SO4 solutions (0.00–1.56 mol kg−1). Samples G, H and I consist entirely of Eu2(SO4)3·8H2O(cr), whereas the double-salt Na2Eu2(SO4)4·2H2O(cr) is the only solid phase identified in samples J–N. Samples M and N show the additional presence of thenardite Na2SO4(VI) and a minor fraction of Na2SO4(III). The latter is known as a product of the thermal treatment of the former. With increasing Na2SO4 concentration from 0.1 mol kg−1 (sample J) to 0.35 mol kg−1 (sample L), the formed Na2Eu2(SO4)4·2H2O(cr) shows an increasing crystallinity with the size of the coherent scattering domains varying from 170 nm (sample J), 180 nm (sample K) to 390 nm (sample L). The samples with excess Na2SO4 (samples M and N) show again smaller crystal sizes of 125 and 145 nm, respectively. As in the case of MgSO4 systems, these results confirm the high crystallinity of the solid phases controlling the solubility of Eu(III) in Na2SO4 systems. It should be noted that for solid phases above 100 nm, the impact of the particle size on the ΔfG° of the solid phase (and by extension on its solubility product) is considered negligible.55
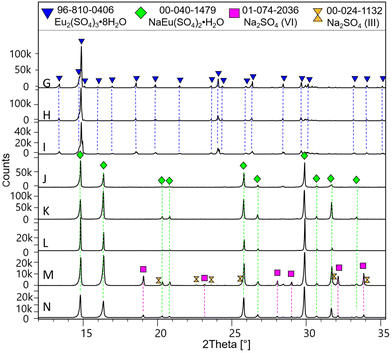 | ||
| Fig. 2 XRD patterns of samples G–N (in Na2SO4 aqueous solutions). The chemical formula NaEu(SO4)2·H2O stands for the Na2Eu2(SO4)4·2H2O(cr) solid phase. | ||
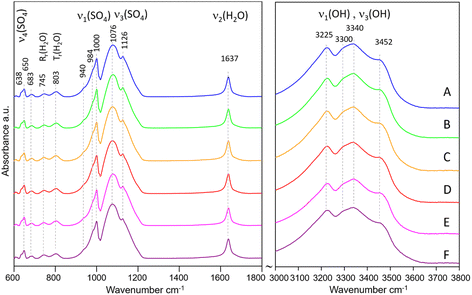
The IR spectra of samples A–F are shown in Fig. 3. All spectra show typical features of Eu2(SO4)3·8H2O(cr). The band assignment was made according to Denisenko et al.56–58 and Ram.59 The internal vibrations of the SO4 tetrahedra are observed as: (1) broad bands in the range 1050–1200 cm−1 with the main peaks at 1076 and 1126 cm−1 assigned to ν3(SO4), (2) a sharp band at 1000 cm−1 with shoulders at 984 and 940 cm−1 (ν1(SO4)), and (3) small bands at 638 and 650 cm−1, assigned to ν4(SO4). The observed frequencies match very well those reported by Buyer et al.60 for Y2(SO4)3·8H2O, although their assignment of the bands at 688 and 743 cm−1 to ν4(SO4) raises some doubts. We favor the assignment of the similar bands at 683 and 745 cm−1 in our spectra to H2O vibrations as reported by Ram,59 given the broadness of these bands. The vibrations due to H2O are manifested by: (1) a very sharp band at 1637 cm−1 (H–O–H bending, ν2), (2) several broad bands with low intensity at 683, 745 and 803 cm−1 assigned to H2O vibrations (rocking, twisting), and (3) broad bands in the OH stretching region (3000–3600 cm−1) centered at 3225, 3300, 3340, and 3452 cm−1. The latter confirm the presence of four distinct H2O coordinating Eu along with four oxygens from SO4 tetrahedra. Once again, there is a striking similarity to the frequencies of the OH stretching vibrations reported by Buyer et al.60
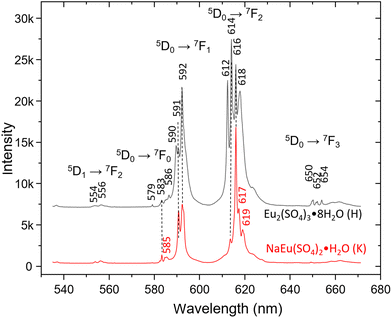
The trivalent Eu3+ ion shows very strong “red” luminescence, which obscures the Raman spectra when excited with a 532 nm laser. Due to the strong dependence of the number and intensity of the emission lines on the site symmetry and environment of the Eu ion in different structures,1 it could be used for identification purposes. Fig. 4 shows the emission spectra of Eu2(SO4)3·8H2O(cr) (sample H) and Na2Eu2(SO4)4·2H2O(cr) (sample K) excited by the 532 nm laser recorded with 600 L mm−1 grating in the range 530–680 nm. The hypersensitive 5D0 → 7F2 transition between 610 and 630 nm dominates both spectra, followed by 5D0 → 7F2 transition lines. The spectrum of Eu2(SO4)3·8H2O(cr) shows strong resemblance to that published by Xu et al.53 with the highest intensity of the 614 nm line. On the other side, the spectrum of Na2Eu2(SO4)4·2H2O(cr) resembles the one published by Wu and Liu61 and matches perfectly that reported by Buyer et al.60 for Na2Y2(SO4)4·2H2O(cr) doped with Eu3+ at 300 K.
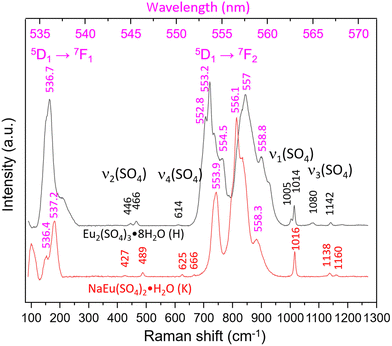
Fig. 5 shows the Raman spectra of both aforementioned samples taken with 1800 L mm−1 grating in the range 100–1300 cm−1 (530–570 nm). Once again the spectra are dominated by luminescence, but higher excited states most probably 5D1 → 7F1 and 5D1 → 7F21, to our knowledge, have not been reported so far. The Raman bands typical of the internal vibrations of SO42− are visible and allow the differentiation between the Eu2(SO4)3·8H2O(cr) and Na2Eu2(SO4)4·2H2O(cr) systems. The former shows bands at 446 and 466 cm−1 (ν2), 614 cm−1 (ν4), 1005 cm−1, 1014 cm−1 (ν1) and 1080 cm−1, 1142 cm−1, 1180 cm−1 (ν3) in accordance with Ram.59 In the spectrum of Na2Eu2(SO4)4·2H2O(cr), the corresponding modes give rise to bands at 427, 489 cm−1 (ν2), 625, 666 cm−1 (ν4), 1016 cm−1 (ν1) and 1138, 1160 cm−1 (ν3). The number and positions of these bands show strong similarity to those reported by Buyer et al.60 for Na2Y2(SO4)4·2H2O(cr) doped with Eu3+ with maximal shifts of 2–4 cm−1.
Quantitative evaluation of the TG-DTA data obtained for the initial solid of Eu2(SO4)3·8H2O(cr) indicates a content of (8.01 ± 0.03) mol of H2O per mol of solid. After completing the solubility experiments, the water content quantified by TG-DTA for the solid samples equilibrated in MgSO4 aqueous solutions was (7.98 ± 0.03) mol of H2O per mol of solid. As for the samples G, H, I of the Na2SO4 aqueous system (in the region with no phase change, i.e. Na2SO4 ≤ 0.01 mol kg−1), a water content of (8.03 ± 0.07) mol of H2O per mol of solid was identified. This confirms that in these samples the Eu2(SO4)3·8H2O(cr) phase actually controlled equilibrium – as was already shown by XRD and Raman spectroscopy measurements. In the samples where the presence of Na2Eu2(SO4)4·2H2O(cr) was identified by XRD and Raman spectroscopy, the measured water content was (2.08 ± 0.13) mol of H2O per mol of solid, consistent with the formation of the double salt in the samples J to N, with concentrations of Na2SO4 > 0.01 mol kg−1.
Furthermore, in the Eu2(SO4)3–Na2SO4–H2O system, the S![[thin space (1/6-em)]](https://www.rsc.org/images/entities/char_2009.gif) :
:![[thin space (1/6-em)]](https://www.rsc.org/images/entities/char_2009.gif) Eu (∼1.5) and Na
Eu (∼1.5) and Na![[thin space (1/6-em)]](https://www.rsc.org/images/entities/char_2009.gif) :
:![[thin space (1/6-em)]](https://www.rsc.org/images/entities/char_2009.gif) Eu (∼1.0) ratios determined by ICP-OES and quantitative chemical analyses on solid samples are in excellent agreement with the XRD data. They support the predominance of Eu2(SO4)3·8H2O(cr) (samples G to I) and Na2Eu2(SO4)4·2H2O(cr) (samples J to N) at room temperature (Table 1). In samples M and N, with higher concentrations of Na2SO4, namely 0.643 and 1.560 mol kg−1, the Na
Eu (∼1.0) ratios determined by ICP-OES and quantitative chemical analyses on solid samples are in excellent agreement with the XRD data. They support the predominance of Eu2(SO4)3·8H2O(cr) (samples G to I) and Na2Eu2(SO4)4·2H2O(cr) (samples J to N) at room temperature (Table 1). In samples M and N, with higher concentrations of Na2SO4, namely 0.643 and 1.560 mol kg−1, the Na![[thin space (1/6-em)]](https://www.rsc.org/images/entities/char_2009.gif) :
:![[thin space (1/6-em)]](https://www.rsc.org/images/entities/char_2009.gif) Eu ratios are well above 1, suggesting the presence of sodium sulfate in the solid phase. This is confirmed in Fig. 2, where the XRD pattern shows peaks of thenardite Na2SO4(VI) and Na2SO4(III). In the Eu2(SO4)3–MgSO4–H2O system, the S
Eu ratios are well above 1, suggesting the presence of sodium sulfate in the solid phase. This is confirmed in Fig. 2, where the XRD pattern shows peaks of thenardite Na2SO4(VI) and Na2SO4(III). In the Eu2(SO4)3–MgSO4–H2O system, the S![[thin space (1/6-em)]](https://www.rsc.org/images/entities/char_2009.gif) :
:![[thin space (1/6-em)]](https://www.rsc.org/images/entities/char_2009.gif) Eu ratio values found confirm the presence of the Eu2(SO4)3·8H2O(cr) phase only (samples A to F), in agreement with the other analyses carried out on the corresponding solid phases.
Eu ratio values found confirm the presence of the Eu2(SO4)3·8H2O(cr) phase only (samples A to F), in agreement with the other analyses carried out on the corresponding solid phases.
The main results of the solid phase characterization obtained by XRD, Raman and IR spectrometry, quantitative chemical analysis and TG-DTA are summarized in Table 1.
5.2. Solubility measurements
Experimental results of Eu(III) solubility at different aqueous concentrations of MgSO4 and Na2SO4 are shown in Fig. 6 and 7. Experimental solubility data, as well as the pH and uncertainty values of each sample are summarized in the ESI.† As mentioned earlier, only experimental data on solubility in pure water have been published. Taking these data into account, our Eu(III) solubility point differs by 2.7% from the data published by Barabash et al.23 and by 2.3% from the data published by Rard3 – showing good consistency among the sources of solubility data in pure water. Comparing the experimental results in water with two other interpolated points (0.076 and 0.0668 mol kg−1) discussed previously by Rard3,62 taking into account the work of Spedding and Jaffe63 and Jackson and Rienäcker,24 we obtain differences of 22.0% and 7.2%, respectively. Spedding and Jaffe63 performed several measurements of the solubility of the sulfates of various lanthanides (Ce, Pr, Nd, Sm, Gd, Ho, Er, Yb, except Eu) at 25 °C. Rard60 then performed an interpolation of these solubility points to estimate the solubility of Eu2(SO4)3 in water. Jackson and Rienäcker24 reported Eu(III) solubility values in water at temperatures of 20 and 40 °C. Rard3 then interpolated these values to 25 °C. Such discrepancies provide evidence that these interpolations can lead to considerable overestimation, as discussed by Rard himself. Thus, these interpolation values will no longer be taken into account in our work.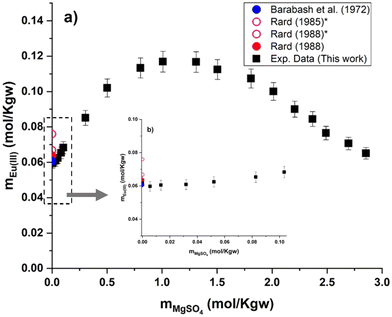 | ||
| Fig. 6 (a) Solubility in the system Eu2(SO4)3–MgSO4–H2O as a function of MgSO4 concentration at room temperature on a linear scale. (b) Zoom of graph (a) in the low MgSO4 concentration region. *Interpolated points proposed by Rard.3,62 | ||
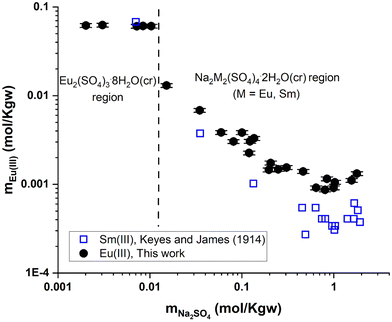 | ||
| Fig. 7 Solubility in the system Eu2(SO4)3–Na2SO4–H2O (this work) and Sm2(SO4)3–Na2SO4–H2O25 as a function of Na2SO4 concentration at room temperature on a logarithmic scale. | ||
Eu2(SO4)3·8H2O(cr) is the only solid phase that controls the Eu(III) solubility in all the MgSO4 aqueous solutions investigated. The europium concentration in the studied MgSO4 concentration range (up to 2.854 mol kg−1) increases by a factor of 2 with increasing ionic strength, up to a maximum of 0.117 mol kg−1 (for an ionic strength of I ≈ 4.8 eq. per kg), and then decreases again (Fig. 6). This behavior is probably due to ionic interactions and aqueous complexation of Eu(III) with sulfates in concentrated aqueous MgSO4 systems. As illustrated by the limited dispersion of the experimental data points, the measurements are very repeatable. However, it is not possible to compare our experimental data since they are the first of this type, to our knowledge.
Fig. 7 shows the experimental results of Eu(III) solubility in Na2SO4 aqueous solutions. Two well-defined regions can be distinguished: (1) a flat region that corresponds to the phase Eu2(SO4)3·8H2O(cr) prevailing at concentrations of mNa2SO4 ≤ 0.01 mol kg−1 and (2) a second region (mNa2SO4 > 0.01 mol kg−1) that corresponds to the stability of Na2Eu2(SO4)4·2H2O(cr). As the concentration of Na2SO4 increases in this region, the solubility of the double salt decreases down to a minimum (at mNa2SO4 ≈ 1 mol kg−1) and then slightly increases beyond. No experimental data on the solubility of Na2Eu2(SO4)4·2H2O(cr) in Na2SO4 aqueous solutions have been published that could be used for direct comparison purposes, but experiments with other lanthanides (La, Ce, Nd, Sm, and Gd)26 have been reported. The solubility results reported by Keyes and James25 for the Sm2(SO4)3–Na2SO4–H2O system are also shown in Fig. 7. These authors mentioned the presence of the double salt Na2Sm2(SO4)4·2H2O(cr) while the solubility trend of Sm(III), which is also discussed in the work of Das et al.,26 is clearly similar to our finding. This shows that our experiments are consistent with the expected behavior of the ternary system Eu2(SO4)3–Na2SO4–H2O.
5.3. Thermodynamic modelling
The solubility products at infinite dilution and the binary and ternary specific interaction parameters were optimized from the solubility data described above. The parameters determined for the Pitzer model are listed below in Table 2. Despite the high charges of the aqueous species involved in the systems, only three binary interaction parameters (β(0)ij, β(1)ij and Cϕij) were used to describe the binary solution properties of the Eu2(SO4)3–H2O system. Several published works used the fourth binary interaction parameter β(2)ij with 3![[thin space (1/6-em)]](https://www.rsc.org/images/entities/char_2009.gif) :
:![[thin space (1/6-em)]](https://www.rsc.org/images/entities/char_2009.gif) 2 type electrolytes.34,35,38 Pitzer and Silvester38 studied the La2(SO4)3–H2O system, whose solubility is low (about 0.024 mol kg−1), and used enthalpy of dilution data to estimate a value for the β(2)ij (with i = La3+ and j = SO42−). Reardon34 and Christov35 studied the more soluble Al2(SO4)3–H2O system (up to 1.118 mol kg−1) and used osmotic coefficient data to determine specific interaction parameters, including β(2)ij (with i = Al3+ and j = SO42−). Although originally considered in our study, the use of the isopiestic experimental method to measure osmotic coefficients was finally disregarded due to the significantly low solubility observed in the two investigated Eu(III)–SO4 systems.64
2 type electrolytes.34,35,38 Pitzer and Silvester38 studied the La2(SO4)3–H2O system, whose solubility is low (about 0.024 mol kg−1), and used enthalpy of dilution data to estimate a value for the β(2)ij (with i = La3+ and j = SO42−). Reardon34 and Christov35 studied the more soluble Al2(SO4)3–H2O system (up to 1.118 mol kg−1) and used osmotic coefficient data to determine specific interaction parameters, including β(2)ij (with i = Al3+ and j = SO42−). Although originally considered in our study, the use of the isopiestic experimental method to measure osmotic coefficients was finally disregarded due to the significantly low solubility observed in the two investigated Eu(III)–SO4 systems.64
| Species, i | Species, j | β (0)ij | β (1)ij | β (2)ij | C ϕij | References |
|---|---|---|---|---|---|---|
| Pitzer binary parameters | ||||||
| Eu3+ | SO42− | 1.775 | 6.877 | — | −2.150 | This work |
| La3+ | SO42− | 0.083 | −0.202 | −51.3 | — | Pitzer and Silvester38 |
| Cr3+ | SO42− | 0.448 | 6.197 | 4.869 | 0.020 | Christov35 |
| Al3+ | SO42− | 0.566 | 12.161 | 3.075 | 0.0005 | Christov37 |
| Cm3+ | SO42− | 1.792 | 15.04 | — | 0.600 | Fanghänel and Kim64 |
| Species, i | Species, j | Species, k | θ ik | Ψ ijk |
|---|---|---|---|---|
| Pitzer mixing parameters | ||||
| Eu3+ | SO42− | Mg2+ | −0.182 | 1.347 |
| Eu3+ | SO42− | Na+ | 0.2223 | 0.3804 |
| Reactions | References | |
|---|---|---|
| a Values calculated from the Gibbs energies of formation proposed by the author together with the Gibbs energies of formation of each species from the Thermochimie database.65 b Calculated from the Rard3 solubility data and Davies equation66 for the activity coefficient. c Uncertainty = 2σ. | ||
| Solubility products of Eu2(SO4)3·8H2O(cr) and Na2Eu2(SO4)4·2H2O(cr) | ||
| Eu2(SO4)3·8H2O(cr) ↔ 2Eu(aq)3+ + 3SO4(aq)2− + 8H2O(l) | −11.232 ± 0.02c | This work |
| −11.911a | Das et al.26 | |
| −9.510 ± 0.100b | Jordan et al.2 | |
| Na2Eu2(SO4)4·2H2O(cr) ↔ 2Na(aq)+ + 2Eu(aq)3+ + 4SO4(aq)2− + 2H2O(l) | −17.056 ± 0.03c | This work |
| −17.518a | Das et al.26 | |
As illustrated by the graphical representation in Fig. 8, the proposed model can reproduce the experimental data reliably. More specifically, the average absolute deviation ( , with N being the number of points) is less than 2% over the 19 data points measured in the present study for the Eu2(SO4)3–MgSO4–H2O system. This value can be compared with the experimental dispersion of the experimental solubility data in pure water reported from the literature with respect to our measured value: 2.7% and 2.3% for Barabash et al.23 and Rard,3 respectively.
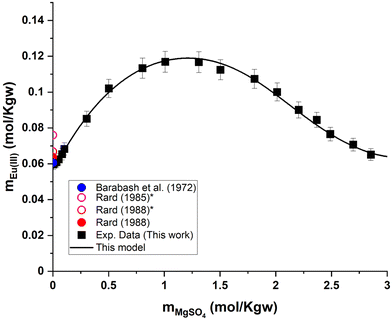 | ||
| Fig. 8 Eu(III) solubility in aqueous MgSO4 solution calculated using PhreeSCALE vs. experimental data at room temperature.3,23,62 *Interpolated points by Rard.3,62 | ||
Regarding the Eu2(SO4)3–Na2SO4–H2O system, Fig. 9 also shows that the model can reasonably reproduce the experimental solubility data given their dispersion. The deviation between the model and the experimental data is up to 4.3% in the single salt region (i.e., Eu2(SO4)3·8H2O(cr), flat region). This deviation generally lies within the reported experimental uncertainty. In the double salt region, the calculated solubility of Na2Eu2(SO4)4·2H2O(cr) is generally in good agreement with the experimental solubility data, although more significant deviations can be noted at intermediate Na2SO4 concentration values (≤1.0 mol kg−1).
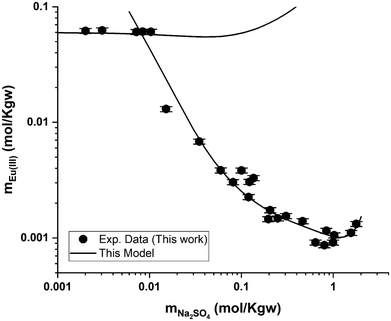 | ||
| Fig. 9 Eu(III) solubility in aqueous Na2SO4 solution calculated using PhreeSCALE vs. experimental data at room temperature. | ||
Table 2 summarizes the solubility product values proposed in the literature for the single and double salts considered in the present study. Das et al.26 proposed values of the Gibbs energies of formation (ΔGf) for both phases – Eu2(SO4)3·8H2O(cr) and Na2Eu2(SO4)4·2H2O(cr). The value of ΔGf{Eu2(SO4)3·8H2O(cr)} was reported on the basis of a regression of experimental data, whereas the value of ΔGf{Na2Eu2(SO4)4·2H2O(cr)} was estimated empirically based on the trends observed along the lanthanide series. The authors did not report the values of ΔGf considered for the species involved in the dissolution/precipitation reactions (Na+, Eu3+, SO42− and H2O). The corresponding values selected in the Thermochimie database65 have been considered instead, leading to log10![[thin space (1/6-em)]](https://www.rsc.org/images/entities/char_2009.gif) Ks,0 values of −11.911 and −17.518 for the simple salt and double salt, respectively. These values can be compared moderately well with those obtained in our work: −11.232 and −17.056, respectively (Table 2).
Ks,0 values of −11.911 and −17.518 for the simple salt and double salt, respectively. These values can be compared moderately well with those obtained in our work: −11.232 and −17.056, respectively (Table 2).
Jordan et al.2 proposed a calculation of  (“for information only”, according to the author) using the Rard3 solubility value (0.06372 mol kg−1) as a basis. Since Rard3 did not use any background electrolyte, Jordan et al.2 calculated the
  value by using the Davies equation to estimate the activity coefficients γEu3+ and γSO42− (0.061 and 0.288, respectively), considering that the ionic strength of the saturated solution (Im = 0.478 eq kg-1) lies within the range of validity of the Davies equation (below seawater salinity, ∼0.8 eq·kg-1). The authors obtained a value of −9.51 ± 0.1. Using the same calculation as proposed by the author, but using the values of γEu3+ and γSO42− from our model instead (0.010 and 0.259, respectively), we obtained a
  value of −11.240, in good agreement with our value and that of Rard,3 given the associated uncertainty. This is not surprising given the good agreement between the solubility values measured by Rard3 and those in the present work.
The Pitzer interaction coefficients determined in this work can be compared with previous studies in the literature investigating 3![[thin space (1/6-em)]](https://www.rsc.org/images/entities/char_2009.gif) :
:![[thin space (1/6-em)]](https://www.rsc.org/images/entities/char_2009.gif) 2 electrolytes34,35,38 and assuming the complete dissociation of ions, as considered in this work. The parameters of interactions between La(III)–SO4, Cr(III)–SO4 and Al(III)–SO4 are all described taking into account the β(2)ij parameters and some without Cϕij – as shown in Table 2. This comparison shows that the values of the Eu(III)–SO4 interaction parameters of the present work are quite strong – values presented for β(0)ij by the authors are less than 1; Cϕij positive and close to 0, but with differences between the proposed values of β(1)ij and β(2)ij. These strong values can be explained by: (1) the lack of solution data to better constrain the parameter optimization and the choice for null β(2)ij; (2) the formation of Eu(III)–SO4 aqueous complexes in the investigated solution as suggested by Pitzer and Silvester38 for the La2(SO4)3–H2O system. This is thoroughly explored in Part II of this work (F. dos Santos;49 this journal), where spectroscopic evidence is also reported.
2 electrolytes34,35,38 and assuming the complete dissociation of ions, as considered in this work. The parameters of interactions between La(III)–SO4, Cr(III)–SO4 and Al(III)–SO4 are all described taking into account the β(2)ij parameters and some without Cϕij – as shown in Table 2. This comparison shows that the values of the Eu(III)–SO4 interaction parameters of the present work are quite strong – values presented for β(0)ij by the authors are less than 1; Cϕij positive and close to 0, but with differences between the proposed values of β(1)ij and β(2)ij. These strong values can be explained by: (1) the lack of solution data to better constrain the parameter optimization and the choice for null β(2)ij; (2) the formation of Eu(III)–SO4 aqueous complexes in the investigated solution as suggested by Pitzer and Silvester38 for the La2(SO4)3–H2O system. This is thoroughly explored in Part II of this work (F. dos Santos;49 this journal), where spectroscopic evidence is also reported.
6. Conclusion
A comprehensive solubility study was conducted at T = (22 ± 2) °C for the systems Eu2(SO4)3–MgSO4–H2O and Eu2(SO4)3–Na2SO4–H2O, covering dilute to concentrated MgSO4 (0.006–2.854 mol kg−1) and Na2SO4 (0.000–1.784 mol kg−1) acidic solutions. Solid phase characterization (XRD, Raman, IR, TG-DTA and quantitative chemical analysis) conducted after attaining equilibrium conditions unequivocally confirms that Eu2(SO4)3·8H2O(cr) is the only phase controlling the solubility of Eu(III) in MgSO4 systems. The same binary phase controls the solubility in Na2SO4 systems with salt concentrations <0.01 mol kg−1, whereas the double salt Na2Eu2(SO4)4·2H2O(cr) was identified as the only Eu(III) solid phase above this Na2SO4 concentration.Based on the experimental solubility data acquired in this work, we derived a thermodynamic model including a set of ionic interaction parameters using the Pitzer formalism, which successfully describes the solubility of Eu(III) in sodium sulfate and magnesium sulfate systems up to high ionic strength conditions (11.5 eq·kg−1). The solubility product determined for the binary salt,  , is in excellent agreement with previous solubility studies available in the literature. For the first time, we report an experimentally determined solubility product for the double salt with Na,
  . This model considers the full dissociation of the Eu(III) species in MgSO4 and Na2SO4 aqueous solutions, as is often favored in the description of high saline systems with Pitzer equations. On the basis of additional spectroscopic evidence, Part II of this contribution will focus on the description of Eu(III)–SO4 aqueous complexes using both SIT and Pitzer activity models and a re-interpretation of the data presented here with an alternate modeling approach.
This manuscript is the first of a series providing a quantitative thermodynamic description of high saline systems with special relevance in the context of nuclear waste disposal. The ternary and quaternary systems Eu(III)–Mg(NO3)2–H2O, Eu(III)–NaNO3–H2O, Eu(III)–MgSO4–Mg(NO3)2–H2O and Eu(III)–Na2SO4–NaNO3–H2O will be tackled in the following publications.
Conflicts of interest
There are no conflicts to declare.Acknowledgements
The present work was carried out under the collaborative project co-funded by KIT–INE, BRGM and ANDRA (contract numbers KIT–3508079 and COX–20086445).References
- K. Binnemans, Coord. Chem. Rev., 2015, 295, 1–45 CrossRef CAS.
- N. Jordan, T. Thoenen, S. Starke, K. Spahiu and V. Brendler, Coord. Chem. Rev., 2022, 473, 214608 CrossRef CAS.
- J. A. Rard, J. Solution Chem., 1988, 17, 499–517 CrossRef CAS.
- T. Vercouter, B. Amekraz, C. Moulin, E. Giffaut and P. Vitorge, Inorg. Chem., 2005, 44, 7570–7581 CrossRef CAS PubMed.
- P. R. Zalupski, R. McDowell and S. L. Clegg, J. Chem. Eng. Data, 2014, 59, 1574–1582 CrossRef CAS.
- S. Guignot, A. Lassin, C. Christov, A. Lach, L. André and P. Henocq, J. Chem. Eng. Data, 2019, 64, 345–359 CrossRef CAS.
- M. R. Beccia, G. Creff, C. Den Auwer, C. Di Giorgio, A. Jeanson and H. Michel, ChemPlusChem, 2022, 87, e202200108 CrossRef CAS PubMed.
- S. T. Liddle, Angew. Chem., Int. Ed., 2019, 58, 5140–5141 CrossRef CAS PubMed.
- E. C. Gaucher, C. Tournassat, F. J. Pearson, P. Blanc, C. Crouzet, C. Lerouge and S. Altmann, Geochim. Cosmochim. Acta, 2009, 73, 6470–6487 CrossRef CAS.
- É. C. Gaucher, P. Blanc, F. Bardot, G. Braibant, S. Buschaert, C. Crouzet, A. Gautier, J.-P. Girard, E. Jacquot, A. Lassin, G. Negrel, C. Tournassat, A. Vinsot and S. Altmann, C. R. Geosci., 2006, 338, 917–930 CrossRef.
- A. Vinsot, S. Mettler and S. Wechner, Phys. Chem. Earth, Parts A/B/C, 2008, 33, S75–S86 CrossRef.
- A. Vinsot, C. A. J. Appelo, C. Cailteau, S. Wechner, J. Pironon, P. De Donato, P. De Cannière, S. Mettler, P. Wersin and H.-E. Gäbler, Phys. Chem. Earth, Parts A/B/C, 2008, 33, S54–S60 CrossRef.
- B. Kienzler, P. Vejmelka, H.-J. Herbert, H. Meyer and C. Altenhein-Haese, Nucl. Technol., 2000, 129, 101–118 CrossRef CAS.
- J. F. Lucchini, M. Borkowski, M. K. Richmann and D. T. Reed, Radiochim. Acta, 2013, 101, 391–398 CrossRef CAS.
- A. Guerrero, M.-S. Hernández and S. Goñi, J. Am. Ceram. Soc., 2004, 83, 2803–2808 CrossRef.
- A. Lassin, S. Guignot, A. Lach, C. Christov, L. André and B. Madé, J. Chem. Eng. Data, 2020, 65, 3613–3626 CrossRef CAS.
- Z.-C. Wang, M. He, J. Wang and J.-L. Li, J. Solution Chem., 2006, 35, 1137–1156 CrossRef CAS.
- A. Lach, L. André, S. Guignot, C. Christov, P. Henocq and A. Lassin, J. Chem. Eng. Data, 2018, 63, 787–800 CrossRef CAS.
- C. Christov and N. Moller, Geochim. Cosmochim. Acta, 2004, 68, 1309–1331 CrossRef CAS.
- C. Christov and N. Moller, Geochim. Cosmochim. Acta, 2004, 68, 3717–3739 CrossRef CAS.
- L. Shen, H. Sippola, X. Li, D. Lindberg and P. Taskinen, J. Chem. Eng. Data, 2020, 65, 2310–2324 CrossRef CAS PubMed.
- H. Sippola and P. Taskinen, J. Chem. Eng. Data, 2014, 59, 2389–2407 CrossRef CAS.
- A. I. Barabash, L. L. Zaitseva and V. S. II’yashenko, Russ. J. Inorg. Chem. (Engl. Trans.), 1972, 17, 1039 Search PubMed.
- K. S. Jackson and G. Rienäcker, J. Chem. Soc. (Resumed), 1930 Search PubMed.
- D. B. Keyes and C. James, J. Am. Chem. Soc., 1914, 36, 634–638 CrossRef CAS.
- G. Das, M. M. Lencka, A. Eslamimanesh, P. Wang, A. Anderko, R. E. Riman and A. Navrotsky, J. Chem. Thermodyn., 2019, 131, 49–79 CrossRef CAS.
- E. P. Lokshin, O. A. Tareeva and T. G. Kashulina, Russ. J. Appl. Chem., 2007, 80, 1275–1280 CrossRef CAS.
- M. Kul, Y. Topkaya and İ. Karakaya, Hydrometallurgy, 2008, 93, 129–135 CrossRef CAS.
- S. B. Duckworth, X. Gaona, A. Baumann, K. Dardenne, J. Rothe, D. Schild, M. Altmaier and H. Geckeis, Radiochim. Acta, 2021, 109, 681–697 CrossRef CAS.
- K. S. Pitzer, J. Phys. Chem., 1973, 77, 268–277 CrossRef CAS.
- K. S. Pitzer, Activity coefficients in electrolyte solutions, CRC press, 1991 Search PubMed.
- C. E. Harvie, N. Møller and J. H. Weare, Geochim. Cosmochim. Acta, 1984, 48, 723–751 CrossRef CAS.
- N. Møller, Geochim. Cosmochim. Acta, 1988, 52, 821–837 CrossRef.
- E. J. Reardon, J. Phys. Chem., 1988, 92, 6426–6431 CrossRef CAS.
- C. Christov, Calphad, 2001, 25, 445–454 CrossRef CAS.
- C. Christov, Calphad, 2002, 26, 85–94 CrossRef CAS.
- C. Christov, J. Chem. Thermodyn., 2004, 36, 223–235 CrossRef CAS.
- K. S. Pitzer and L. F. Silvester, J. Phys. Chem., 1978, 82, 1239–1242 CrossRef CAS.
- B. M. L. Bansal, S. K. Patil and H. D. Sharma, J. Inorg. Nucl. Chem., 1964, 26, 993–1000 CrossRef CAS.
- J. C. Barnes, J. Chem. Soc. (Resumed), 1964, 3880 RSC.
- R. G. de Carvalho and G. R. Choppin, J. Inorg. Nucl. Chem., 1967, 29, 725–735 CrossRef.
- A. Aziz, S. J. Lyle and S. J. Naqvi, J. Inorg. Nucl. Chem., 1968, 30, 1013–1018 CrossRef CAS.
- C. F. Hale and F. H. Spedding, J. Phys. Chem., 1972, 76, 2925–2929 CrossRef CAS.
- C. F. Hale and F. H. Spedding, J. Phys. Chem., 1972, 76, 1887–1894 CrossRef CAS.
- W. J. McDowell and C. F. Coleman, J. Inorg. Nucl. Chem., 1972, 34, 2837–2850 CrossRef CAS.
- B. A. Bilal and V. Koß, J. Inorg. Nucl. Chem., 1980, 42, 1064–1065 CrossRef CAS.
- J. Schijf and R. H. Byrne, Geochim. Cosmochim. Acta, 2004, 68, 2825–2837 CrossRef CAS.
- S. Friesen, S. Krickl, M. Luger, A. Nazet, G. Hefter and R. Buchner, Phys. Chem. Chem. Phys., 2018, 20, 8812–8821 RSC.
- P. F. dos Santos, X. Gaona, A. Lassin, A. Skerencak, D. Fellhauer, M. Altmaier and B. Madé, Dalton Trans., 2024 10.1039/d3dt04323a.
- A. Lach, F. Boulahya, L. André, A. Lassin, M. Azaroual, J.-P. Serin and P. Cézac, Comput. Geosci., 2016, 92, 58–69 CrossRef CAS.
- J. Doherty, PEST: Model-Independent Parameter Estimation, 5th edn, 2004 Search PubMed.
- L. André, A. Lassin and M. Azaroual, Geochim. Cosmochim. Acta, Suppl., 2009, 73, A41–A41 Search PubMed.
- Y. Xu, S. Ding and X. Zheng, J. Solid State Chem., 2007, 180, 2020–2025 CrossRef CAS.
- 6 TOPAS , Technical reference manual.
- V. Neck, M. Altmaier, A. Seibert, J. I. Yun, C. M. Marquardt and T. Fanghänel, Radiochim. Acta, 2007, 95, 193–207 CrossRef CAS.
- Yu. G. Denisenko, N. A. Khritokhin, O. V. Andreev, S. A. Basova, E. I. Sal'nikova and A. A. Polkovnikov, J. Solid State Chem., 2017, 255, 219–224 CrossRef CAS.
- Y. G. Denisenko, V. V. Atuchin, M. S. Molokeev, A. E. Sedykh, N. A. Khritokhin, A. S. Aleksandrovsky, A. S. Oreshonkov, N. P. Shestakov, S. V. Adichtchev, A. M. Pugachev, E. I. Sal'nikova, O. V. Andreev, I. A. Razumkova and K. Müller-Buschbaum, Molecules, 2022, 27, 3966 CrossRef CAS PubMed.
- Y. G. Denisenko, A. E. Sedykh, S. A. Basova, V. V. Atuchin, M. S. Molokeev, A. S. Aleksandrovsky, A. S. Krylov, A. S. Oreshonkov, N. A. Khritokhin, E. I. Sal'nikova, O. V. Andreev and K. Müller-Buschbaum, Adv. Powder Technol., 2021, 32, 3943–3953 CrossRef CAS.
- S. Ram, J. Raman Spectrosc., 1987, 18, 537–548 CrossRef CAS.
- C. Buyer, D. Enseling, T. Jüstel and T. Schleid, Crystals, 2021, 11, 575 CrossRef CAS.
- C.-D. Wu and Z.-Y. Liu, J. Solid State Chem., 2006, 179, 3500–3504 CrossRef CAS.
- J. A. Rard, J. Solution Chem., 1985, 14, 457–471 CrossRef CAS.
- F. H. Spedding and S. Jaffe, J. Am. Chem. Soc., 1954, 76, 882–884 CrossRef CAS.
- Th. Fanghänel and J.-I. Kim, J. Alloys Compd., 1998, 271–273, 728–737 CrossRef.
- E. Giffaut, M. Grivé, Ph. Blanc, Ph. Vieillard, E. Colàs, H. Gailhanou, S. Gaboreau, N. Marty, B. Madé and L. Duro, Appl. Geochem., 2014, 49, 225–236 CrossRef CAS.
- C. W. Davies, Ion association, Butterworths, London, 1962 Search PubMed.
Footnote |
| † Electronic supplementary information (ESI) available. See DOI: https://doi.org/10.1039/d3dt04322c |
| This journal is © The Royal Society of Chemistry 2024 |

