
 Open Access Article
 This Open Access Article is licensed under a
 Creative Commons Attribution 3.0 Unported Licence
CatScore: evaluating asymmetric catalyst design at high efficiency
Bing
Yan
 * and
Kyunghyun
Cho
* and
Kyunghyun
Cho
Department of Computer Science, New York University, 60 5th Avenue, New York, NY 10011, USA. E-mail: bing.yan@nyu.edu
First published on 11th July 2024
Abstract
Asymmetric catalysis plays a crucial role in advancing medicine and materials science. However, the prevailing experiment-driven methods for catalyst evaluation are both resource-heavy and time-consuming. To address this challenge, we present CatScore – a learning-centric metric designed for the automatic evaluation of catalyst design models at both instance and system levels. This approach harnesses the power of deep learning to predict product selectivity as a function of reactants and the proposed catalyst. The predicted selectivity serves as a quantitative score, enabling a swift and precise assessment of a catalyst's activity. On an instance level, CatScore's predictions correlate closely with experimental outcomes, demonstrating a Spearman's ρ = 0.84, which surpasses the density functional theory (DFT) based linear free energy relationships (LFERs) metric with ρ = 0.55 and round-trip accuracy metrics at ρ = 0.24. Importantly, when ranking catalyst candidates, CatScore achieves a mean reciprocal ranking significantly superior to traditional LFER methods, marking a considerable reduction in labor and time investments needed to find top-performing catalysts.
1 Introduction
Asymmetric catalysis – the process of synthesizing chiral compounds with high selectivity – is a vital research field within medicinal chemistry and materials science.1 Designing effective catalysts is central to asymmetric catalysis, but evaluating these catalysts remains a labor-intensive and inefficient task. Catalyst evaluation often focuses on measuring its efficacy in converting reactants to the desired product, which is typically quantified by the yield and selectivity of the target product.Traditional techniques for evaluating catalysts include experimental and computational approaches, each with notable drawbacks. Experimental methods are resource-intensive and time-consuming, involving significant financial cost and environmental impact due to the use of expensive materials and waste production.2 For instance, one study required 45 separate four-hour experiments to adequately assess a new catalyst.3 On the computational side, the methods demand extensive data and substantial computational resources. For example, the calculation of descriptors for a typical rhodium-based catalyst used in the asymmetric hydrogenation of olefins took 75 CPU hours using density functional theory (DFT) and linear free energy relationships (LFERs).
These challenges highlight the need for a more efficient evaluation method. The advent of learning-based approaches has made significant progress in molecule generation tasks including catalyst design by leveraging supervised data.4–9 However, the standard evaluation method in molecule generation tasks of pitting a designed molecule against a benchmarked reference molecule10 does not apply to the catalyst design task due to the possibility of multiple catalysts resulting in similar activity.
To address this gap, we introduce CatScore, a learning-based metric for the automated evaluation of catalysts. CatScore evaluates catalyst design using a product prediction model to predict the outcomes of reactions with the designed catalysts (Fig. 1). CatScore quantifies a catalyst's effectiveness based on its predicted probability of yielding the target product.
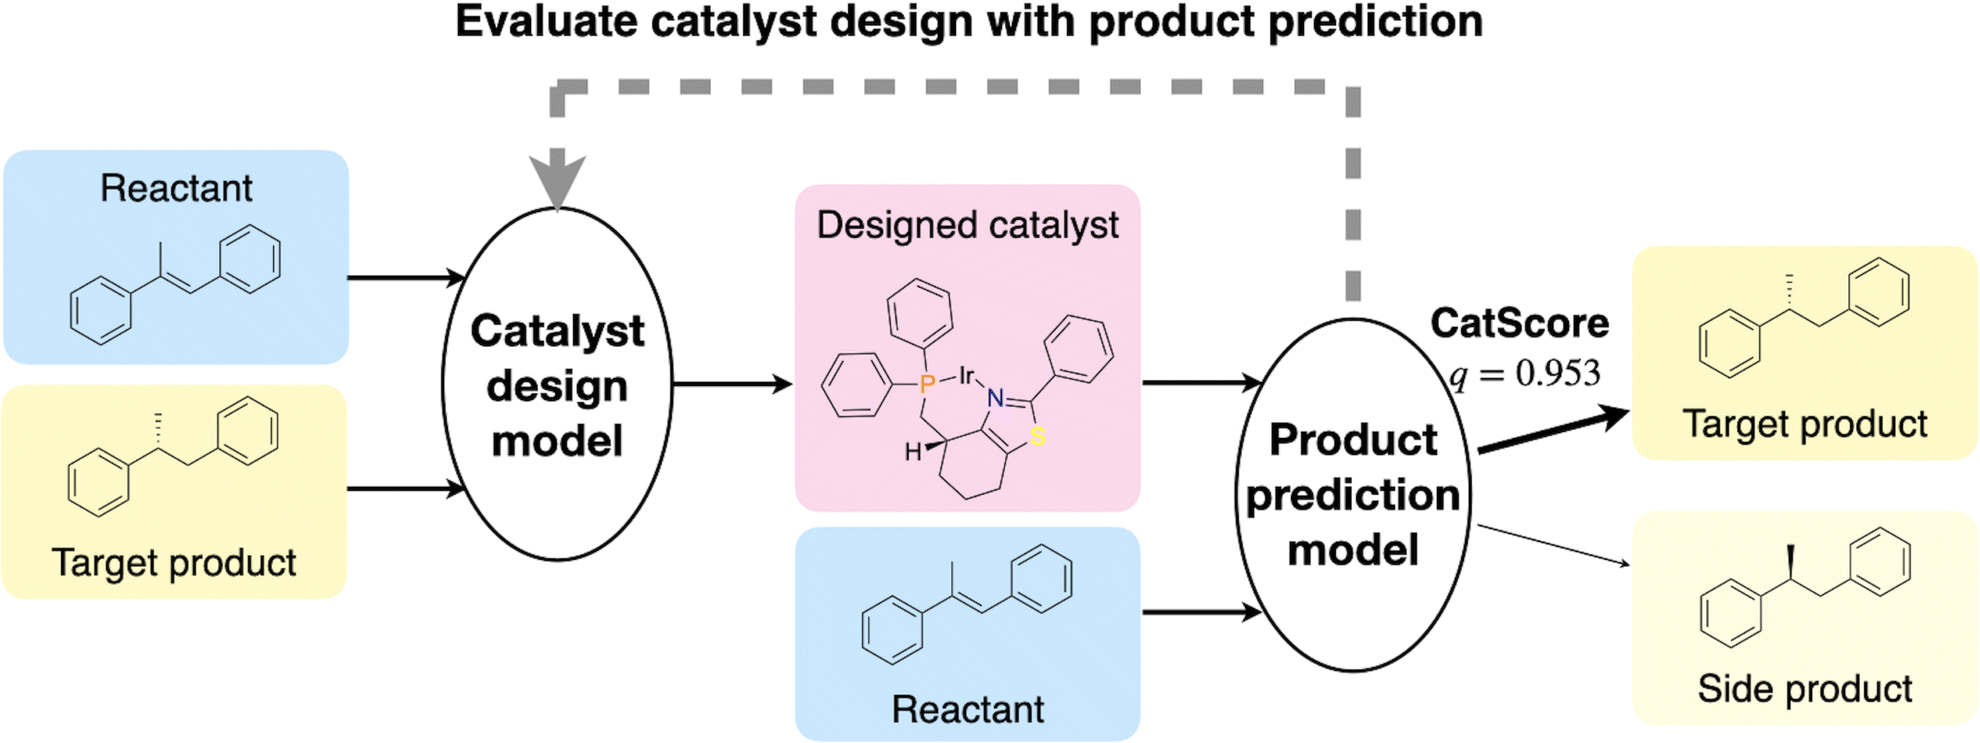 | ||
| Fig. 1 Illustration of the CatScore workflow. The goal is to evaluate the performance of a catalyst design model, which generates a catalyst given the reactants and the target product. The designed catalyst is evaluated using a product prediction model fθ, which was trained to predict the probability distribution of target products given the reactants and the catalyst. CatScore is defined as the probability (q) of generating the target product. | ||
Our work builds upon the concept of model-based evaluation, which involves a score derived from a learned model and has been applied in areas such as retrosynthesis11–13 and natural language processing.14,15 CatScore distinguishes itself from other model-based evaluation metrics, such as round-trip accuracy,11–13 by supporting both system and instance-level evaluations while the round-trip accuracy primarily focuses on system-level evaluations. It is at this granular level where identifying promising catalyst candidates becomes vital. By emphasizing instance-level evaluation, CatScore aims to fill this crucial gap.
CatScore is orders of magnitude faster than the LFER evaluation method. For example, it only took 3 CPU seconds to calculate the CatScore for the same rhodium-based catalyst.
To validate CatScore's effectiveness, we compare the evaluation outcomes from our method against experimental data and the LFER-based metric. Results indicate that CatScore's predictions align closely with both experimental and LFER-based evaluations, delivering a more time and labor-efficient approach.
2 Experiments
2.1 CatScore
 and a catalyst c from the set
  of all possible catalysts. It then yields a product p from the set
  of possible products. Mathematically, this can be represented as:
Catalyst design's overarching goal is to find a model d(r, p) which, when presented with reactants r and a target product p, produces an optimal catalyst c from  :
:

To evaluate this catalyst design model, we need to verify whether freact(r, d(r, p)) = p or not.
| q(p|r,d(r,p)) ∈ [0,1]. | (1) |
The central idea of this paper is to approximate freact using a product prediction model fθ. This model, trained on an extensive dataset of experimentally validated reaction-catalyst-product tuples, predicts the final product distribution Q(p). We define CatScore as the model probability qθ that fθ allocates to the target product. In essence, CatScore acts as an efficient proxy for freact in the evaluation of catalyst design. The evaluation workflow is illustrated in Fig. 1.
We base our work on T5Chem, a unified deep learning model for multi-task reaction predictions.16 T5Chem uses a pre-trained language model CodeT5 as the base model,17,18 which is an extension of T5.19 T5 is an encoder-decoder model pre-trained on text-to-text tasks. CodeT5 builds on the T5 architecture and is pre-trained on unlabelled source code for code understanding and generation.
Similar to T5Chem, we fine-tune the CodeT5 models for (1) catalyst design and (2) product prediction. Since not all catalysts in the dataset exhibit high selectivity toward the target product, in training the product prediction model fθ, we adapt the standard language modeling loss to integrate the dataset's actual selectivity. The loss attributed to each training instance (p, r, c) is adjusted by the proportion (wk) of each product pk compared to the totality of products derived from (r, c) (eqn (2)). This method leverages product weights to represent the target product distribution rather than solely optimizing the likelihood of an individual target product. This adaption guarantees that the predicted probability reflects the selectivity of the catalyst.
 | (2) |
To assess the impact of model size, we experiment with three variants of CodeT5: small (60M parameters), base (220M parameters), and large (770M parameters). Beyond these, we construct more compact models by removing the initial one to five layers from the “small” variant. This operation yields models with parameter sizes ranging from 53M down to 24M. Moreover, the 24M-parameter model is further condensed by scaling down its hidden size using factors such as 2, 4, 8, and 64.
To assess the effects of pre-training on the quality of the catalyst design models, we also train a catalyst design model from scratch.
Details about the training and hyperparameters, as well as input and output examples can be found in Appendix B.
2.2 LFERScore
 | (3) |
Initially developed on recognized catalysts, these LFERs allow for the subsequent prediction of ΔΔG‡ for novel catalysts. With ΔΔG‡, the enantiomeric ratio, Er, which is the ratio of the target product over the side product, can be predicted using the Arrhenius equation20 (eqn (4)):
 | (4) |
To derive catalyst descriptors for LFERs, we use the 3D geometry in the AHO dataset (see Section 2.3 for details about the dataset), which includes complete stereochemistry information, especially for chiral ligands with axial or planar chirality (i.e., biaryl and ferrocene-containing ligands). We perform DFT geometry optimization using Gaussian 16.27 The functional used is B3LYP-D3(BJ), with the LanL2DZ basis set and its effective core potential (ECP) for metals,28,29 and 6-31G(d,p) for non-metals.
We calculate the metal–ligand bonding orbital energies and NBO charges using NBO 7.0. We use an adapted version of the  package30 to calculate %Vbur and Sterimol parameters L, B1, and B5. More details on descriptor calculation can be found in Appendix A.
 | (5) |
To calculate LFERScore, we construct multivariate LFERs with all of the descriptors and use Lasso regularization to prevent overfitting. We group the reactions in the training set by (r, p) combinations. For groups with three or more reactions, we perform Lasso regression between log![[thin space (1/6-em)]](https://www.rsc.org/images/entities/char_2009.gif) Er and the catalyst descriptors D (eqn (6)) where
Er and the catalyst descriptors D (eqn (6)) where  and
and  are the coefficients and the intercept, respectively.
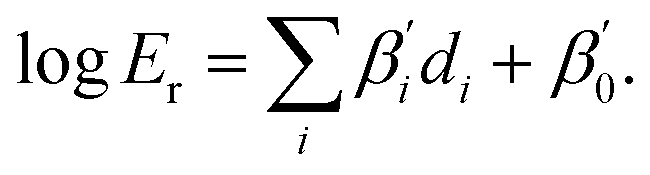 | (6) |
The Lasso objective function is as eqn (7), where {((d1)j,(d2)j,…,(dn)j),(logEr)j} represents a data point in a reaction group, and λ is the regularization parameter chosen by cross-validation between 0.01 and 10. The distribution of the mean square error (MSE) of all (r, p) groups is plotted as a histogram in Appendix A.2.
 | (7) |
During prediction, for each (r, p) combination in the test set, we use the corresponding LFERs to calculate logEr and then LFERScore using eqn (5) for the catalyst to be evaluated. We evaluate the LFERScore by Spearman correlation between LFERScore and experimental selectivity.
Our calculated descriptors for all catalysts in the AHO dataset and the fitting results are available on our GitHub repository.
2.3 Data
We employ the AHO dataset,31 a resource initially assembled to study the asymmetric hydrogenation of olefins. This comprehensive collection captures detailed records of catalysts, reactants, and products, as well as selectivity recorded as enantiomeric excess.All entities within this dataset, be they catalysts, reactants, or products, are represented using the SMILES strings.32 The SMILES for the catalysts consist of coordination tags that can be recognized by RDKit to generate the corresponding chemical structure of coordinated species. SMILES representation is conducive to our approach, wherein language models are employed for catalyst designing (d) and product prediction (fθ). By concatenating SMILES strings as inputs, we can generate designed catalysts or predict products using the language modeling formulation.
To produce models of a range of quality, we partition the AHO dataset into training, validation, and test sets, and partition the training and validation sets into subsets of varying sizes (1%, 5%, 10%, 20%, 50%, 100%). To ensure evaluation consistency, we consistently employ the entire test set.
We also consider a setting where the training/validation/test partitioning considers catalyst scaffolds. Specifically, we exclude ferrocene-type catalysts from training data and reserve them for testing and validation. This setup allows us to assess the model's generalization capabilities to unseen scaffolds, which has been found challenging for many existing approaches.33
To focus on applicable cases of catalyst selectivity when training fθ, we remove reactions without stereocenters in the product. For the remaining data, we augment the data to include minor products and calculate their proportions based on enantiomeric excess, assuming minimal by-products resulting from reactions other than hydrogenation (see Section 2.1 for more details).
3 Results
3.1 Evaluation of the product prediction model
We first evaluate if our product prediction model, fθ, can effectively approximate experimental data for predicting product selectivity. To this end, we use Spearman correlation to evaluate the correlation between predicted and experimental selectivity values for the 516 reactions in our test set. Notably, only 339 out of these 516 reactions have valid LFER predictions, owing to insufficient experimental data for LFER construction. In this evaluation, the Spearman correlation coefficient is 0.585 for fθ (0.541 when considering the full test set) and 0.415 for LFERs across the 339 reactions. These results show that fθ is as effective as LFERs in approximating experimental data but has the added advantage of broader applicability.3.2 Instance-level evaluation of CatScore: correlation with experimental and LFERScore metrics
We evaluate CatScore's effectiveness as an instance-level metric for catalyst design by comparing it with experimental selectivity and LFERScore. For a baseline, we employ round-trip accuracy,11–13 a metric designed initially for system-level evaluation, but here we use it at an instance level by checking if the predicted product matches the target product: | (8) |
We observe a marked computational advantage of CatScore over LFERScore. Acquiring descriptors for our test set through DFT calculations takes 921 CPU days, and LFERs for training catalysts add another 29 CPU years. In stark contrast, CatScore computations are completed in a mere 29 CPU minutes, leveraging a product prediction model that is trained in less than 3 GPU hours.
Focusing on the correlation with experimental data, we select catalysts that have both experimental evaluations and LFERScores. For the 60M-parameter catalyst design model trained on the complete training set, 86 out of 516 catalysts meet this criterion. The Spearman correlation results show a strong association between CatScore and experimental selectivity (ρ = 0.84), surpassing both LFERScore (ρ = 0.55) and round-trip accuracy (ρ = 0.24).
We further assess the correlations between CatScore and LFERScore across various catalyst design models, as detailed in Table 1. Across all models, CatScore maintains a positive correlation with LFERScore. In comparison, round-trip accuracy shows a notably weaker correlation, possibly due to its binary predictions (either matching or not) at the instance level. These findings highlight CatScore's potential as a quick and competitive alternative to LFERScore for instance-level catalyst design evaluation.
| Catalyst design model | CatScore | Round-trip accuracy | ||
|---|---|---|---|---|
| Model | Data | Val loss | ||
| 660M | 100% | 0.033 | 0.455 | 0.080 |
| 220M | 100% | 0.030 | 0.358 | 0.153 |
| 60M | 100% | 0.030 | 0.421 | −0.010 |
| 53M | 100% | 0.031 | 0.259 | 0.014 |
| 46M | 100% | 0.030 | 0.261 | 0.053 |
| 38M | 100% | 0.032 | 0.326 | 0.076 |
| 31M | 100% | 0.032 | 0.415 | 0.034 |
| 24M | 100% | 0.037 | 0.325 | 0.027 |
| 60M | 50% | 0.056 | 0.319 | 0.177 |
| 60M | 20% | 0.080 | 0.008 | −0.010 |
| 60M | 10% | 0.113 | 0.067 | 0.017 |
| 60M | 5% | 0.158 | 0.050 | −0.053 |
3.3 Instance-level evaluation of CatScore: reranking catalysts
To assess CatScore's efficiency in identifying top-performing catalysts, we conduct a mean reciprocal rank (MRR) analysis.34 MRR is a statistical measure used to evaluate the ability of a system to return the best result as one of its top recommendations. Specifically, for each unique combination of reactants and products in the test set, we compute and rank CatScore for all (1,681) catalysts. We then look at the rank of the target catalyst and take its reciprocal. The MRR is the average of these reciprocals, as shown in eqn (9).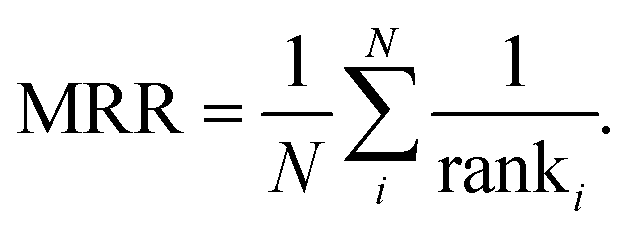 | (9) |
With an MRR of 0.062, CatScore ranks the target catalyst, on average, among the top 16 (1/0.062). For comparison, the MRRs for LFERScore and round-trip accuracy are both 0.003, meaning that the target catalyst is among the top 333 catalysts, respectively. These results show that CatScore outperforms the other two methods in efficiently identifying superior catalysts.
3.4 System-level evaluation of CatScore: correlation with LFERScore
In this section, we aim to assess how well CatScore can evaluate catalyst design models at the system level. We compare its performance with LFERScore and use round-trip accuracy as a baseline.11–13 For this comparison, system-level scores are derived by taking the average of their respective instance-level scores.As shown in Fig. 2a, there is a strong correlation between CatScore and LFERScore, with a Spearman correlation coefficient of 0.85. For comparison, the correlation between system-level round-trip accuracy (our baseline) and LFERScore yields a Spearman coefficient of 0.80, as presented in Fig. 2b. These results show that CatScore is a reliable and competitive method for evaluating catalyst design models at the system level.
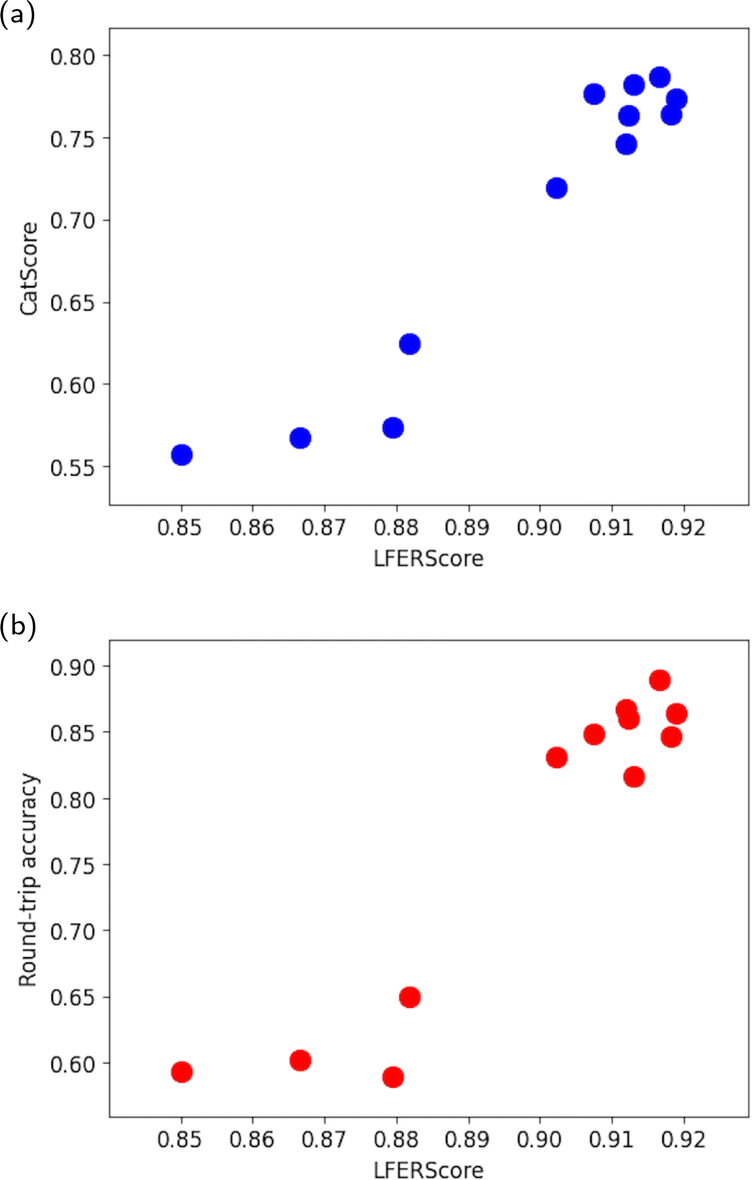 | ||
| Fig. 2 (a) Scatter plot visualizing the system-level correlation between CatScore and LFERScore across various catalyst design models, with a Spearman correlation coefficient of 0.85. (b) Scatter plot visualizing the system-level correlation between round-trip accuracy and LFERScore across various catalyst design models, with a Spearman correlation coefficient of 0.80. | ||
4 Analysis
4.1 Error analysis at the instance level
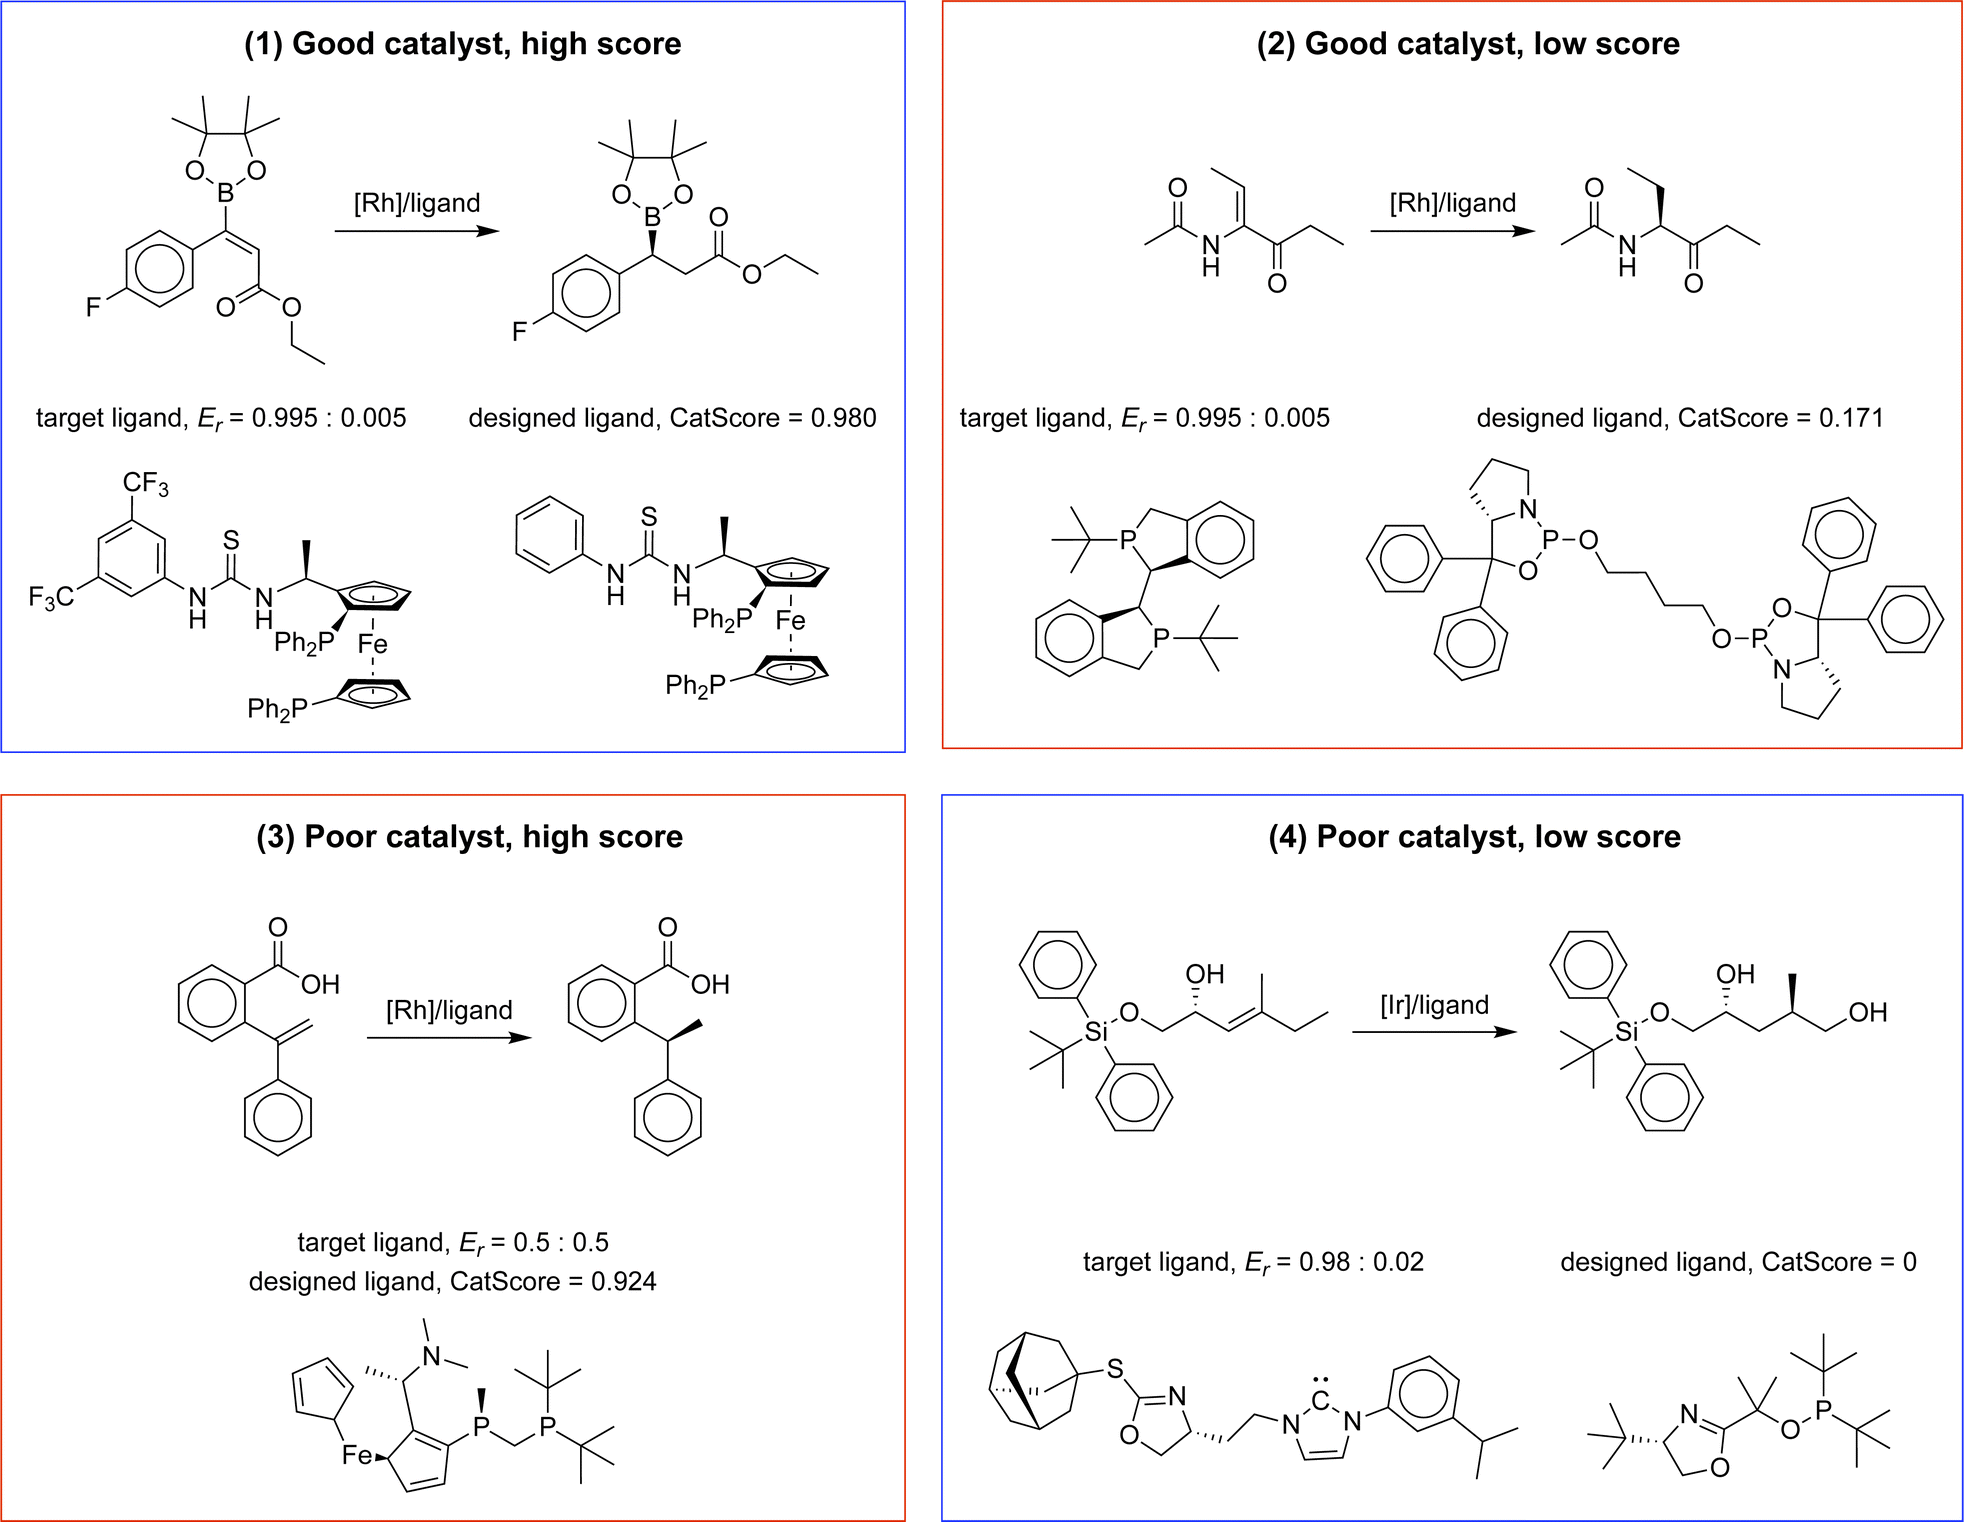 | ||
| Fig. 3 Illustrative examples of four evaluation scenarios using CatScore: examples 1 and 4 showcase successful CatScore predictions for high-performing and low-performing catalysts, respectively. Example 2 demonstrates an erroneous prediction where a good catalyst receives a low CatScore, while example 3 depicts an erroneous prediction in which a poor catalyst is inaccurately assigned a high CatScore. | ||
1. Good catalyst with a high score (successful prediction)
2. Good catalyst with a low score (erroneous prediction)
3. Poor catalyst with a high score (erroneous prediction)
4. Poor catalyst with a low score (successful prediction)
In the first example, where a good catalyst receives a high score, the designed and target catalysts share notable similarities, like their metal center and ligand scaffold. Previous research has shown that the designed catalyst possesses high selectivity with a similar substrate (refer to Scheme 1).35,36 Conversely, in the fourth example, the designed catalyst differs from the target in terms of its ligand scaffold, and it exhibits low selectivity with a similar substrate (refer to Scheme 2).37
 | ||
| Scheme 1 Reaction using the designed catalyst in example 1. | ||
 | ||
| Scheme 2 Reaction using the designed catalyst in example 4. | ||
The second example highlights a scenario where a high-performing catalyst receives a low CatScore. Notably, this catalyst has shown high selectivity on a similar substrate (refer to Scheme 3),38 but its rarity in the dataset (3 out of 12k total instances) might contribute to the lower score.
 | ||
| Scheme 3 Reaction using the designed catalyst in example 2. | ||
The third example showcases a poor catalyst that receives an unexpectedly high CatScore. Although both the designed and target catalysts are identical and known to have weak selectivity, CatScore assigns a high value. Further analysis suggests that this might be due to the fact that external factors, like solvent type, affect selectivity. For example, when dichloromethane (CH2Cl2) is used, the catalyst has poor selectivity; on the contrary, when a mixed solvent, ethanol:2,2,2-trifluoroethanol (EtOH:CF3CH2OH) = 1:1, is used, the catalyst exhibits a high selectivity of Er = 0.995:0.005.39 These findings suggest the potential benefit of integrating reaction conditions into the evaluation metric, which could be an avenue for future work. More examples of error analysis can be found in Appendix C.
4.2 Analysis at system level
This section analyzes the capability of CatScore to differentiate various catalyst design models.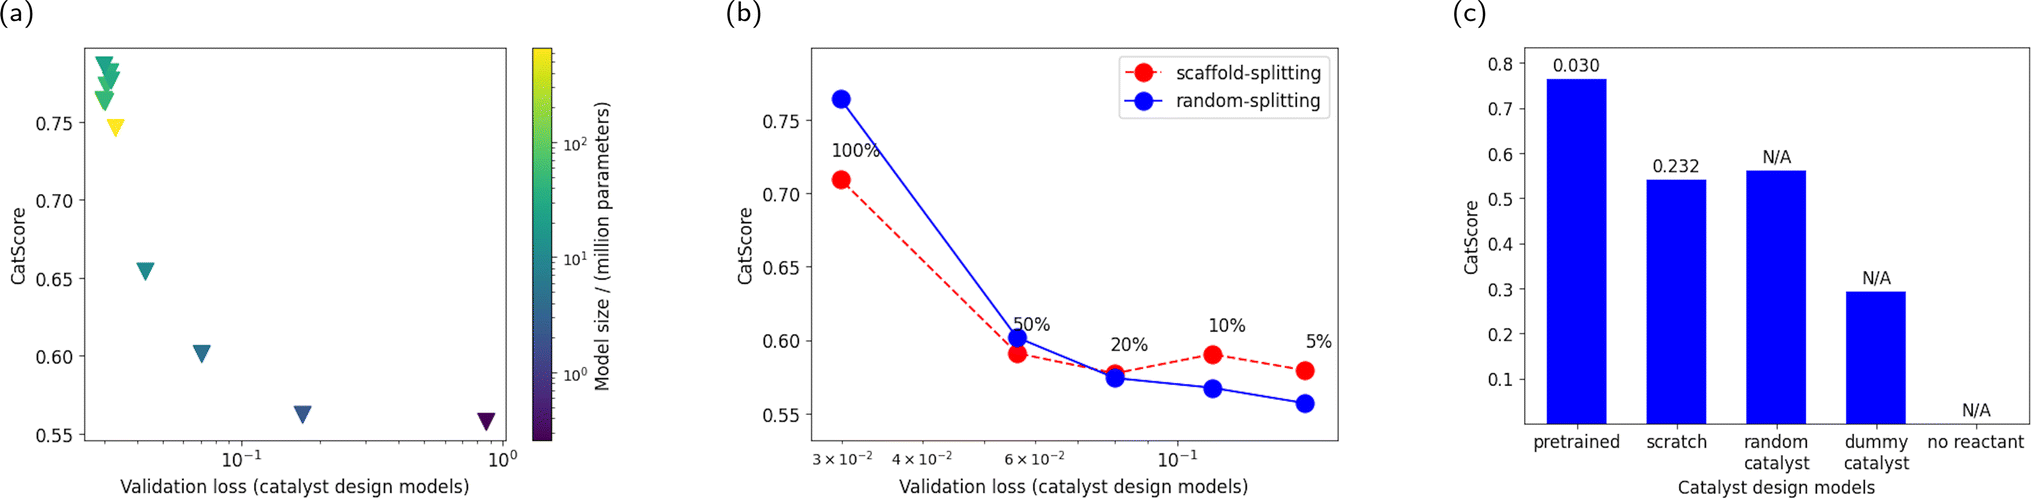 | ||
| Fig. 4 (a) CatScores versus validation loss for catalyst design models with varying model sizes. The model size varies from 259k parameters to 660M parameters, and the number of parameters is represented by the marker color and illustrated in the color map. (b) CatScore versus validation loss for catalyst design models with varying amounts of training data. From left to right, 100%, 50%, 20%, 10%, and 5% portion of the training data are used. Different product prediction models are used to compute the CatScore: the blue markers represent the CatScore computed by a product prediction model trained on random-splitting data, and the red markers represent one trained on scaffold-splitting data. (c) Sanity checks of CatScores with extreme model scenarios: models trained from scratch, random catalyst assignments, and inputs with dummy catalysts or absent reactants. When applicable, the validation loss of the catalyst design model is annotated above the bar chart. | ||
Furthermore, we examine a catalyst design model trained on scaffold-splitting data, which yields a high validation loss of 0.693 and, consequently, a lower CatScore of 0.469 compared to the random-splitting catalyst design model (validation loss at 0.030, CatScore at 0.764). These patterns again confirm CatScore's sensitivity and reliability.
4.3 Robustness of CatScore to the product prediction model
To examine the robustness of CatScore to variations in the product prediction model (fθ), we conduct experiments that change fθ in different ways. | ||
| Fig. 5 Analysis of CatScore's sensitivity relative to the product prediction model fθ’s quality. The x-axis is the validation loss of the catalyst design models obtained by varying the amount of training data. The y-axis depicts the CatScore. The color gradient represents the validation loss of the product prediction models, also obtained by varying the amount of training data, with brighter colors indicating smaller validation loss. The legends annotate the amount of training data used to train fθ. The results show that the discriminating power of CatScore depends on the quality of the product prediction model, emphasizing the necessity of employing a sufficiently accurate model in practice. | ||
These results together emphasize the importance of using a high-quality product prediction model for effective evaluation.
5 Conclusion
In this study, we introduce CatScore, a learning-based metric to evaluate catalyst design models on both instance and system levels. The foundation of CatScore rests on training a product prediction model to approximate the true reaction model, providing an alternative to running chemical experiments.Our experimental results demonstrate a strong correlation between CatScore and both experimental selectivity and the LFER-based score at both the system and instance levels. Furthermore, CatScore offers an advantage in computational efficiency. This faster evaluation technique paves the way for expedited discovery and development of new catalysts, with potential implications for progress in a wide range of chemical processes and applications.
Our findings underscore the necessity of utilizing a high-quality product prediction model to maintain the discerning capabilities of CatScore. Additionally, qualitative analyses hint at the prospective advantages of incorporating reaction conditions into the evaluation metric. Future endeavors could focus on refining the product prediction model to further enhance CatScore's robustness and explore the incorporation of additional factors, such as reaction conditions, into the CatScore framework.
Data availability
The code and data of CatScore and LFERScore are available at https://github.com/bingyan4science/CatScore.Author contributions
B. Y. contributed to the methodology, software, formal analysis, and writing (original draft). K. C. contributed to the project supervision, writing (review and editing), and funding acquisition. Both authors have given approval to the final version of the manuscript.Conflicts of interest
There are no conflicts to declare.Appendices
A LFERScore
For the electronic property, we use two comprehensive descriptors: the natural bond orbital (NBO) charges of the metal and the ligand, and the metal–ligand bonding orbital energies (Fig. 6a). The NBO charges are atomic charges that are computationally derived based on natural population analysis for the DFT-optimized catalyst structures.21 The bonding energies quantify the strength of the coordination bonds between the metal and the ligand, which are also obtained from the natural population analysis.
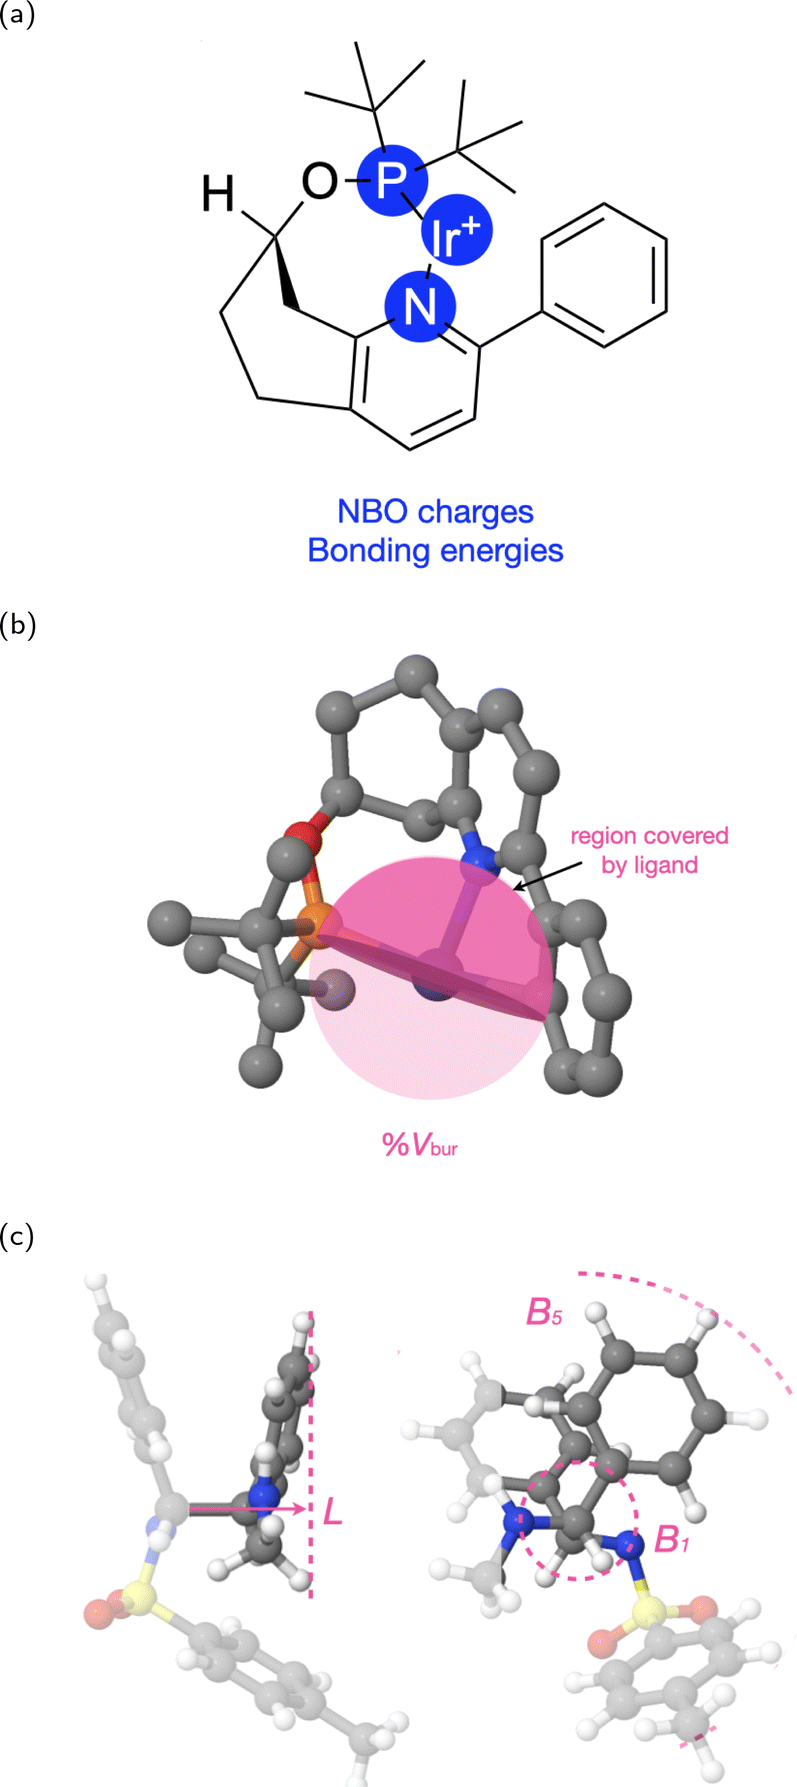 | ||
| Fig. 6 Illustration of the electronic and steric descriptors for an example catalyst. (a) The electronic descriptors are NBO charges and bonding orbital energies. (b) The steric descriptor, buried volume, %Vbur. The shaded part of the sphere represents the region covered by the ligand. (c) The steric descriptors, Sterimol parameters, L, B1, and B5. | ||
To represent the steric property, we use the percent buried volume (%Vbur) of metal centers (Fig. 6b and the Sterimol parameters L, B1, and B5 (Fig. 6c) to reflect the ligand sterics. The calculation of %Vbur is based on the volume occupied by a ligand in an abstract sphere centered on the metal atom.22,30 We adapt the MORFEUS buried volume package to consider the metal as the center when calculating %Vbur.30
The Sterimol parameter L describes the length of the substituent along the direction of the primary bond axis, and B1 and B5 are defined as the minimum and maximum widths perpendicular to the primary bond, respectively.42,43 To calculate the Sterimol parameter, we first define the primary bond axis. We take the bond with one end as the coordinating atom as a candidate for the primary bond axis. For ligands with more than one candidate for the primary bond, we choose the one that produces the longest L. With the chosen primary bond axis, we use the MORFEUS Sterimol package to calculate the Sterimol parameters.30
 , which is available on our GitHub repository.
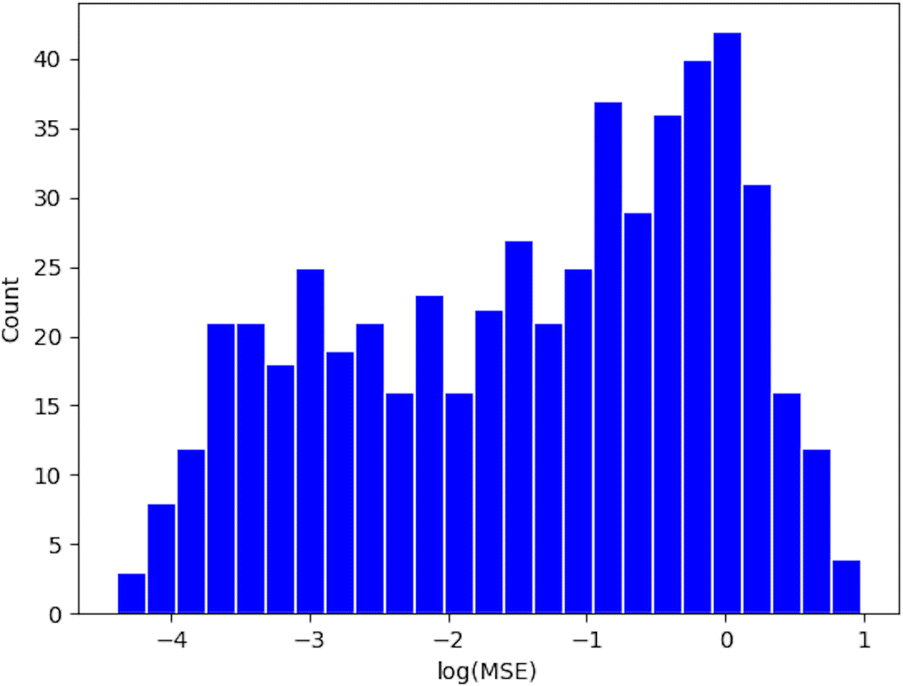 | ||
| Fig. 7 The distribution of the mean square error (MSE) for the LFERs. The x-axis, “log(MSE)”, is the logarithm of MSE. The y-axis, “Count”, is the number of reaction groups whose LFER MSE falls in a specific bin. | ||
B Implementation details
We train the learning-based models with 1 Nvidia A100 GPU. For DFT calculation, we use Intel i9-9900K CPUs.
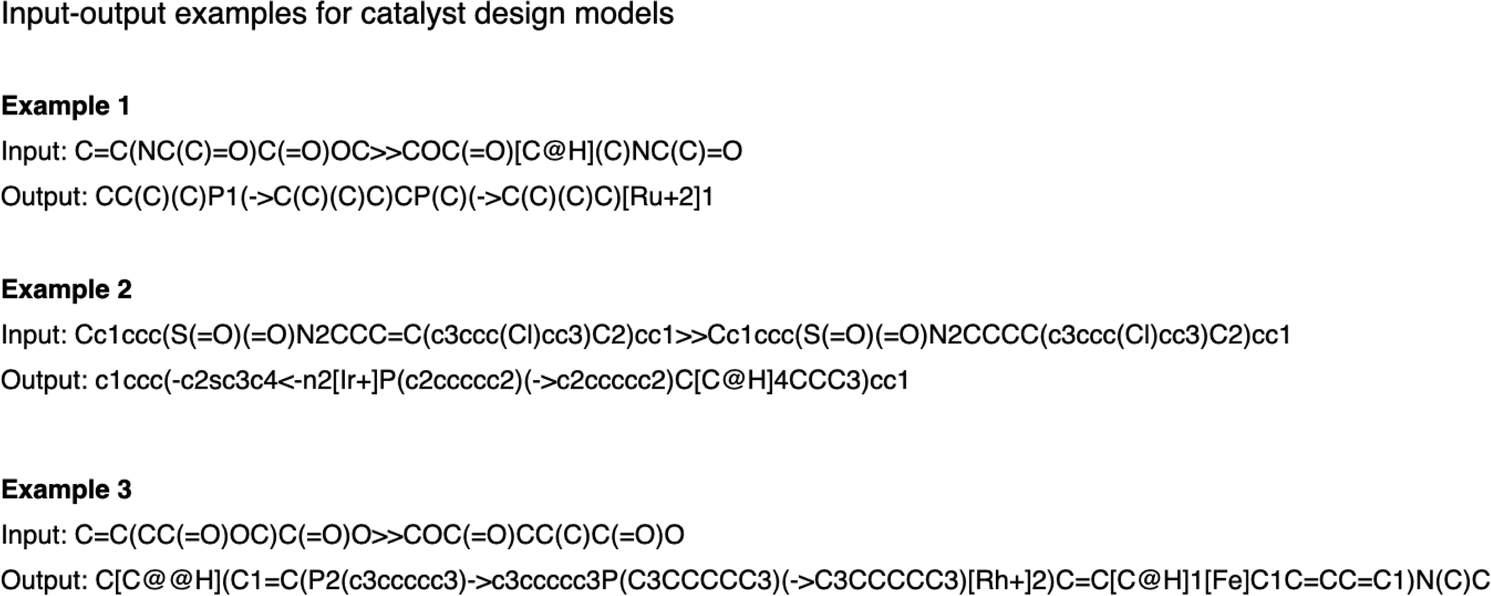 | ||
| Fig. 8 Examples of input and output for the catalyst design models. | ||
For the product prediction models, the input is the SMILES strings of the reactants and the catalyst, and the output is the SMILES string of the product. In the training stage, we include the proportion of each product in the output to represent the product distribution. Fig. 9 and 10 list some examples of inputs and outputs for the training and inference stage of the product prediction models respectively.
 | ||
| Fig. 9 Examples of input and output for the product prediction models in the training stage. | ||
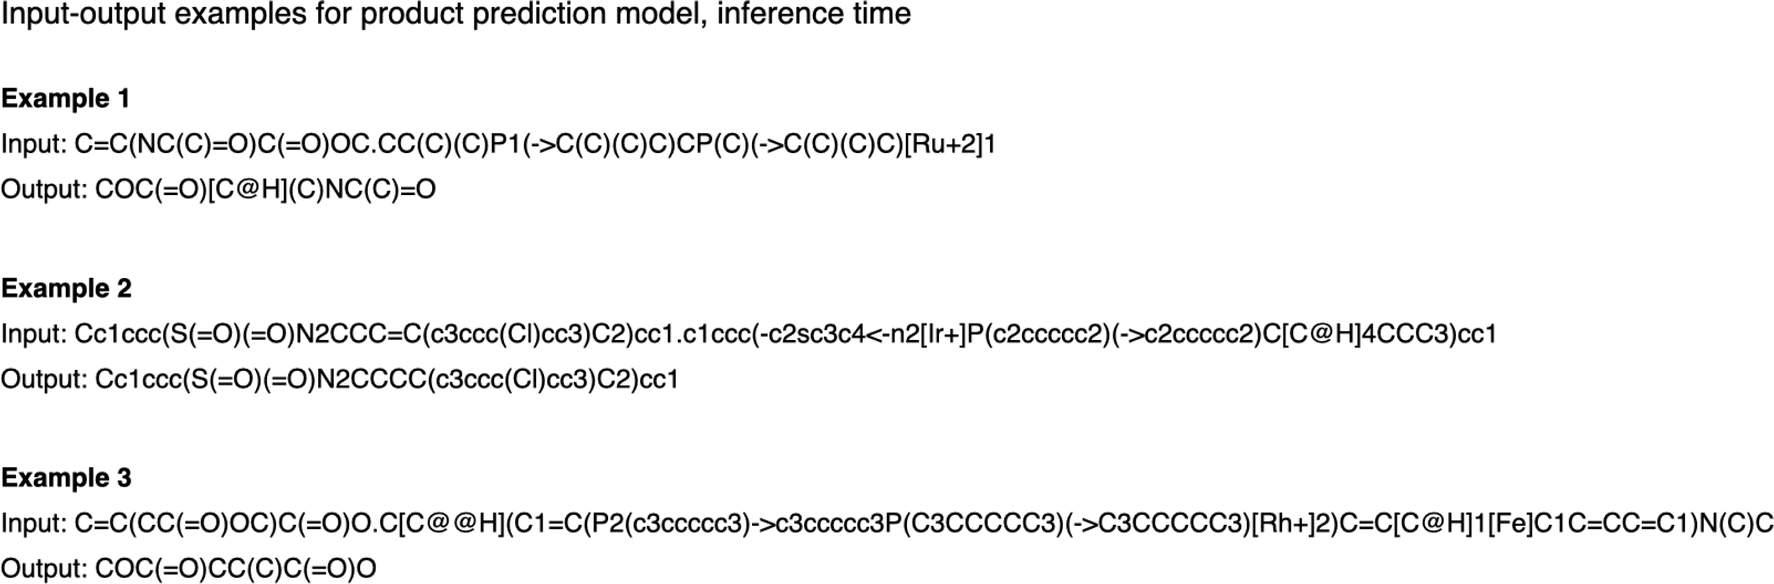 | ||
| Fig. 10 Examples of input and output for the product prediction models in the inference stage. | ||
C Instance-level CatScore error analysis
Here we provide more examples of instance-level CatScore error analysis on similar reactants (Fig. 11). The errors in examples 2 and 3 are both due to the presence of counterexamples in the dataset when the reaction conditions are not included in the prediction.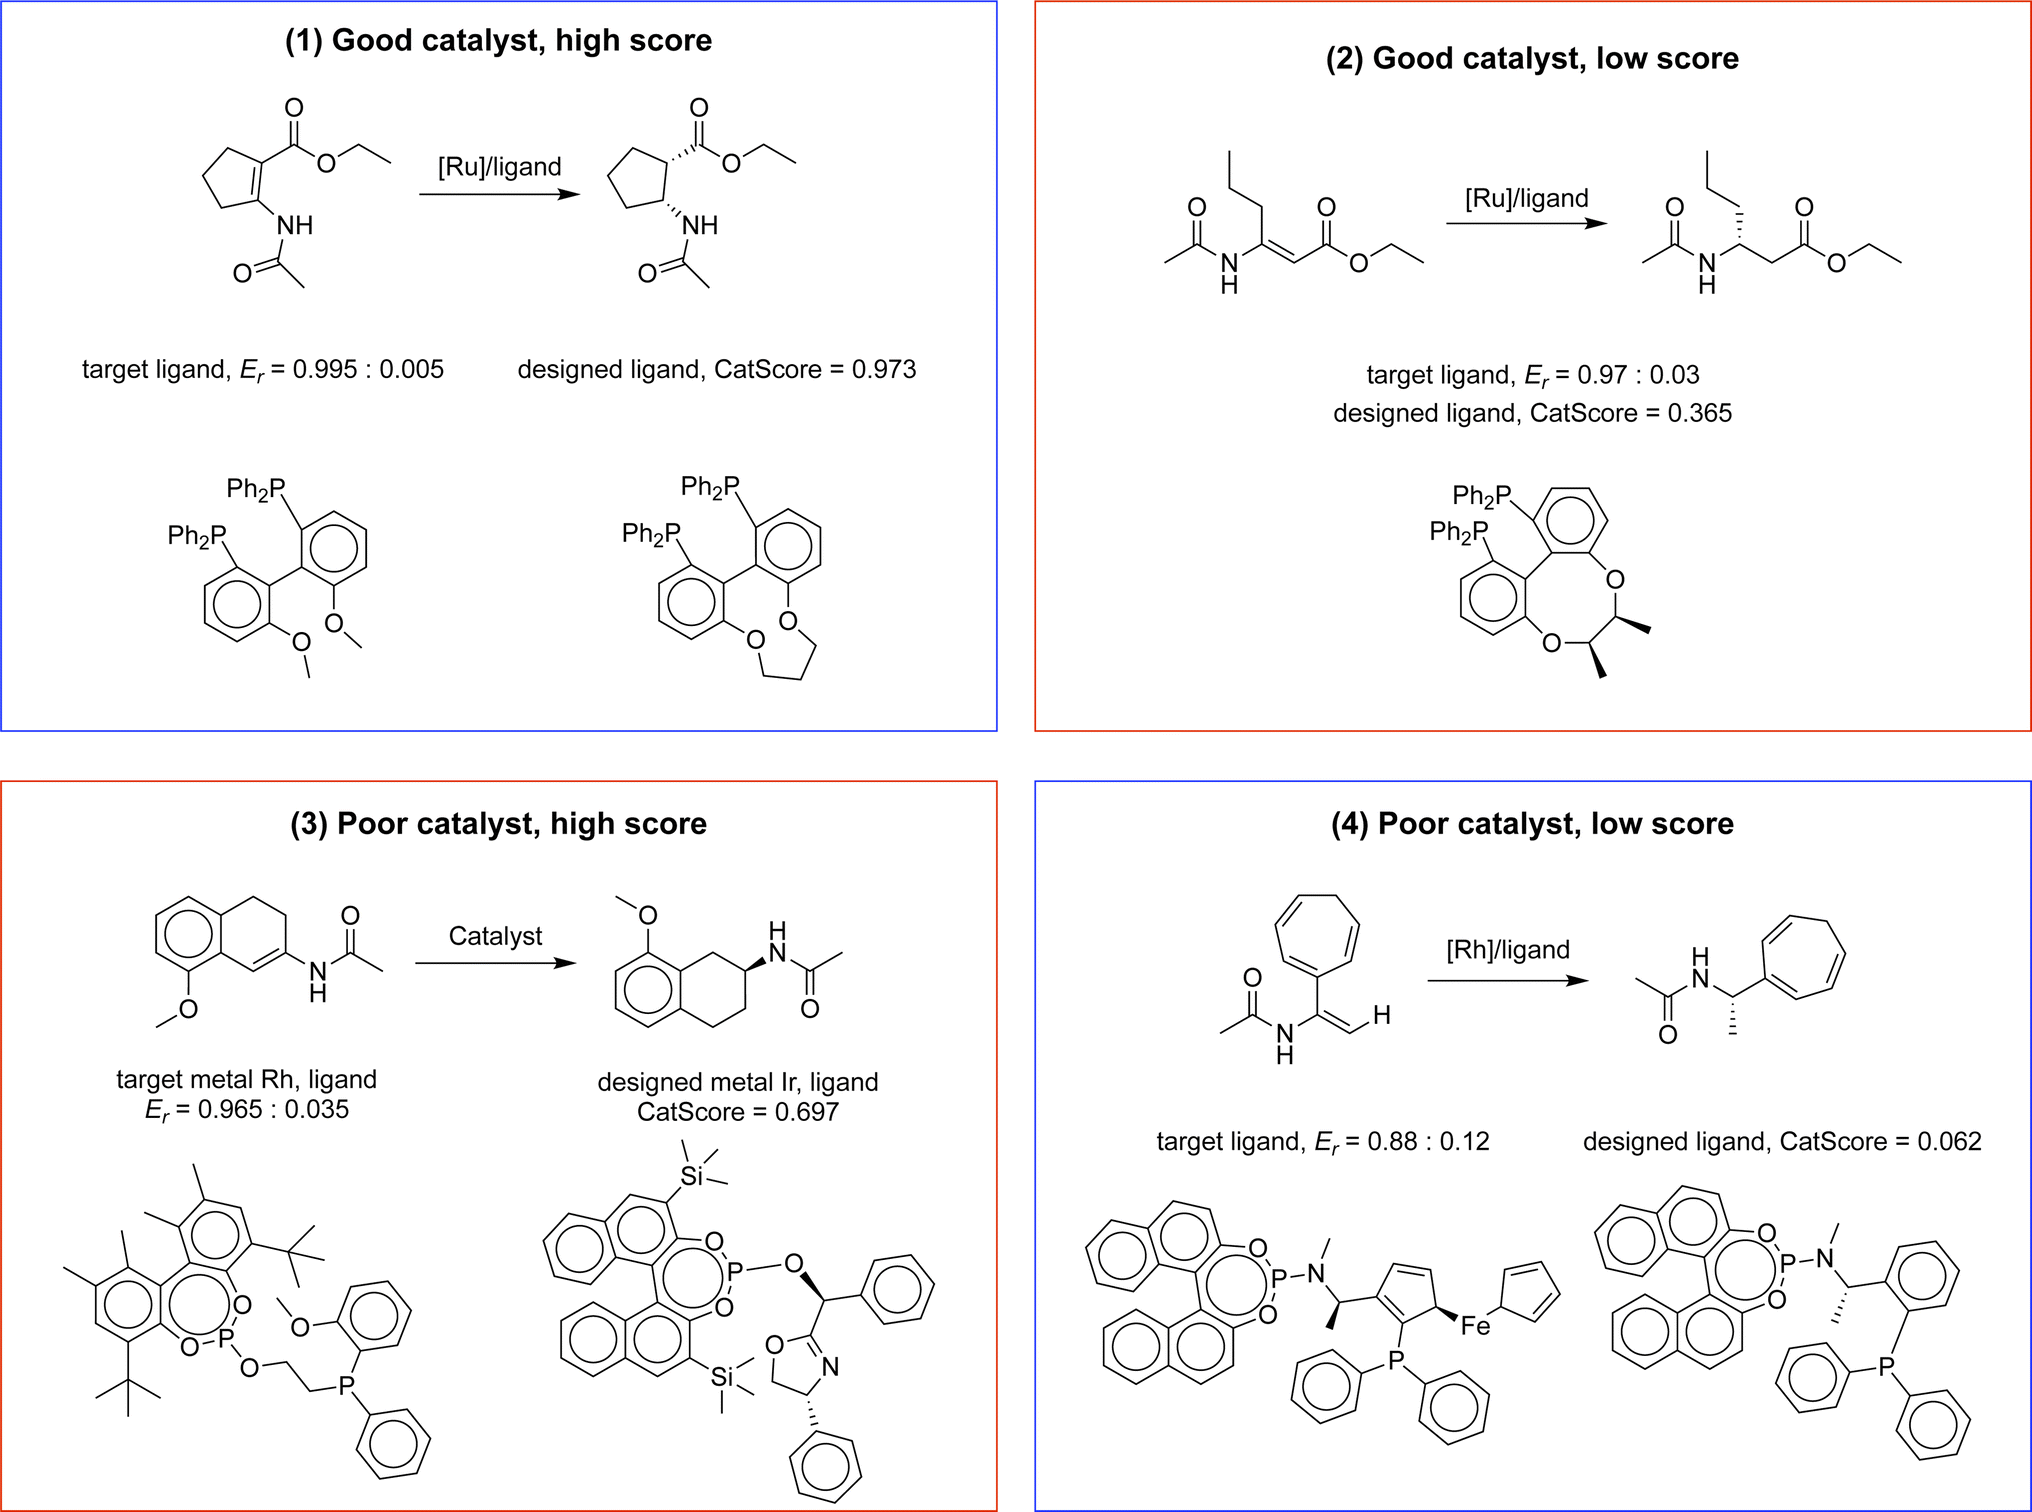 | ||
| Fig. 11 Illustrative examples of four evaluation scenarios using CatScore for similar reactants: examples 1 and 4 showcase successful CatScore predictions for high-performing and low-performing catalysts, respectively. Example 2 demonstrates an erroneous prediction where a good catalyst receives a low CatScore, while example 3 depicts an erroneous prediction in which a poor catalyst is inaccurately assigned a high CatScore. | ||
D Instance-level CatScore–LFERScore correlation
Here, we plot the test results of instance-level CatScores and LFERScores for the catalyst design models evaluated. We vary the model size (Fig. 12) and the training dataset size (Fig. 13), and we explore some boundary cases as sanity checks (Fig. 14).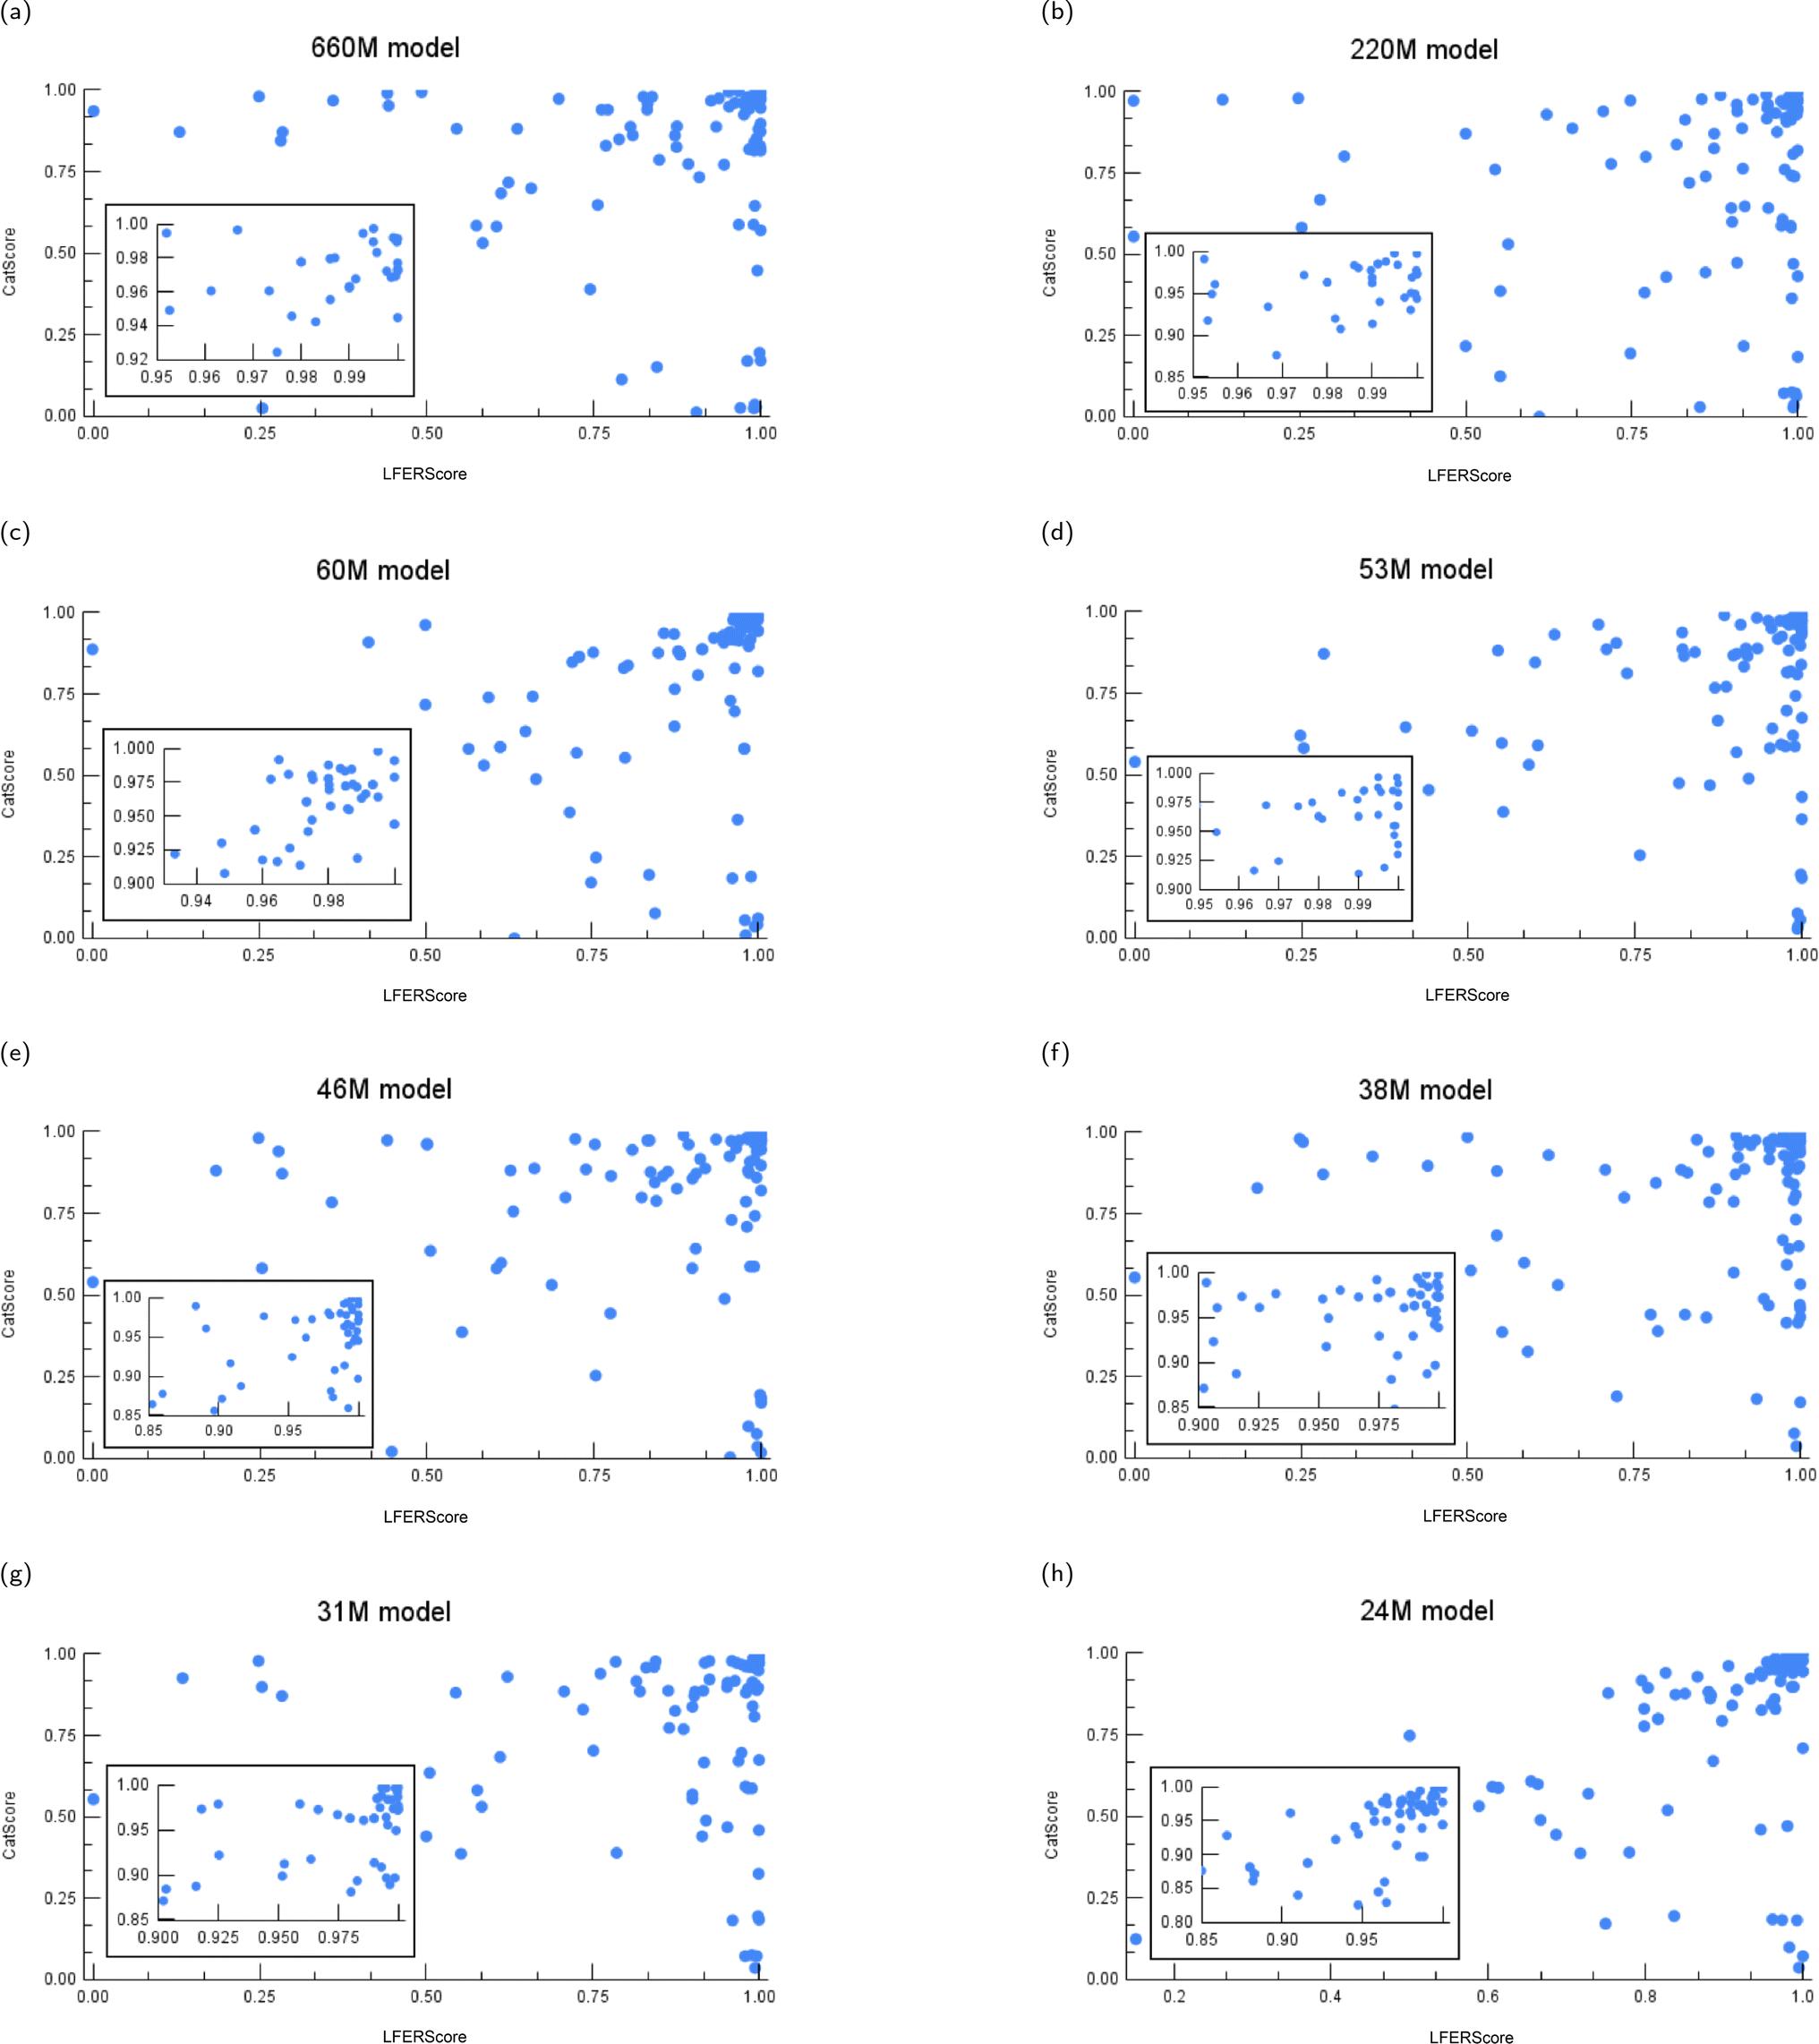 | ||
| Fig. 12 The instance-level CatScore versus LFERScore for catalyst design models of varying parameter sizes: (a) 660M, (b) 220M, (c) 60M, (d) 53M, (e) 46M, (f) 38M, (g) 31M, and (h) 24M models. | ||
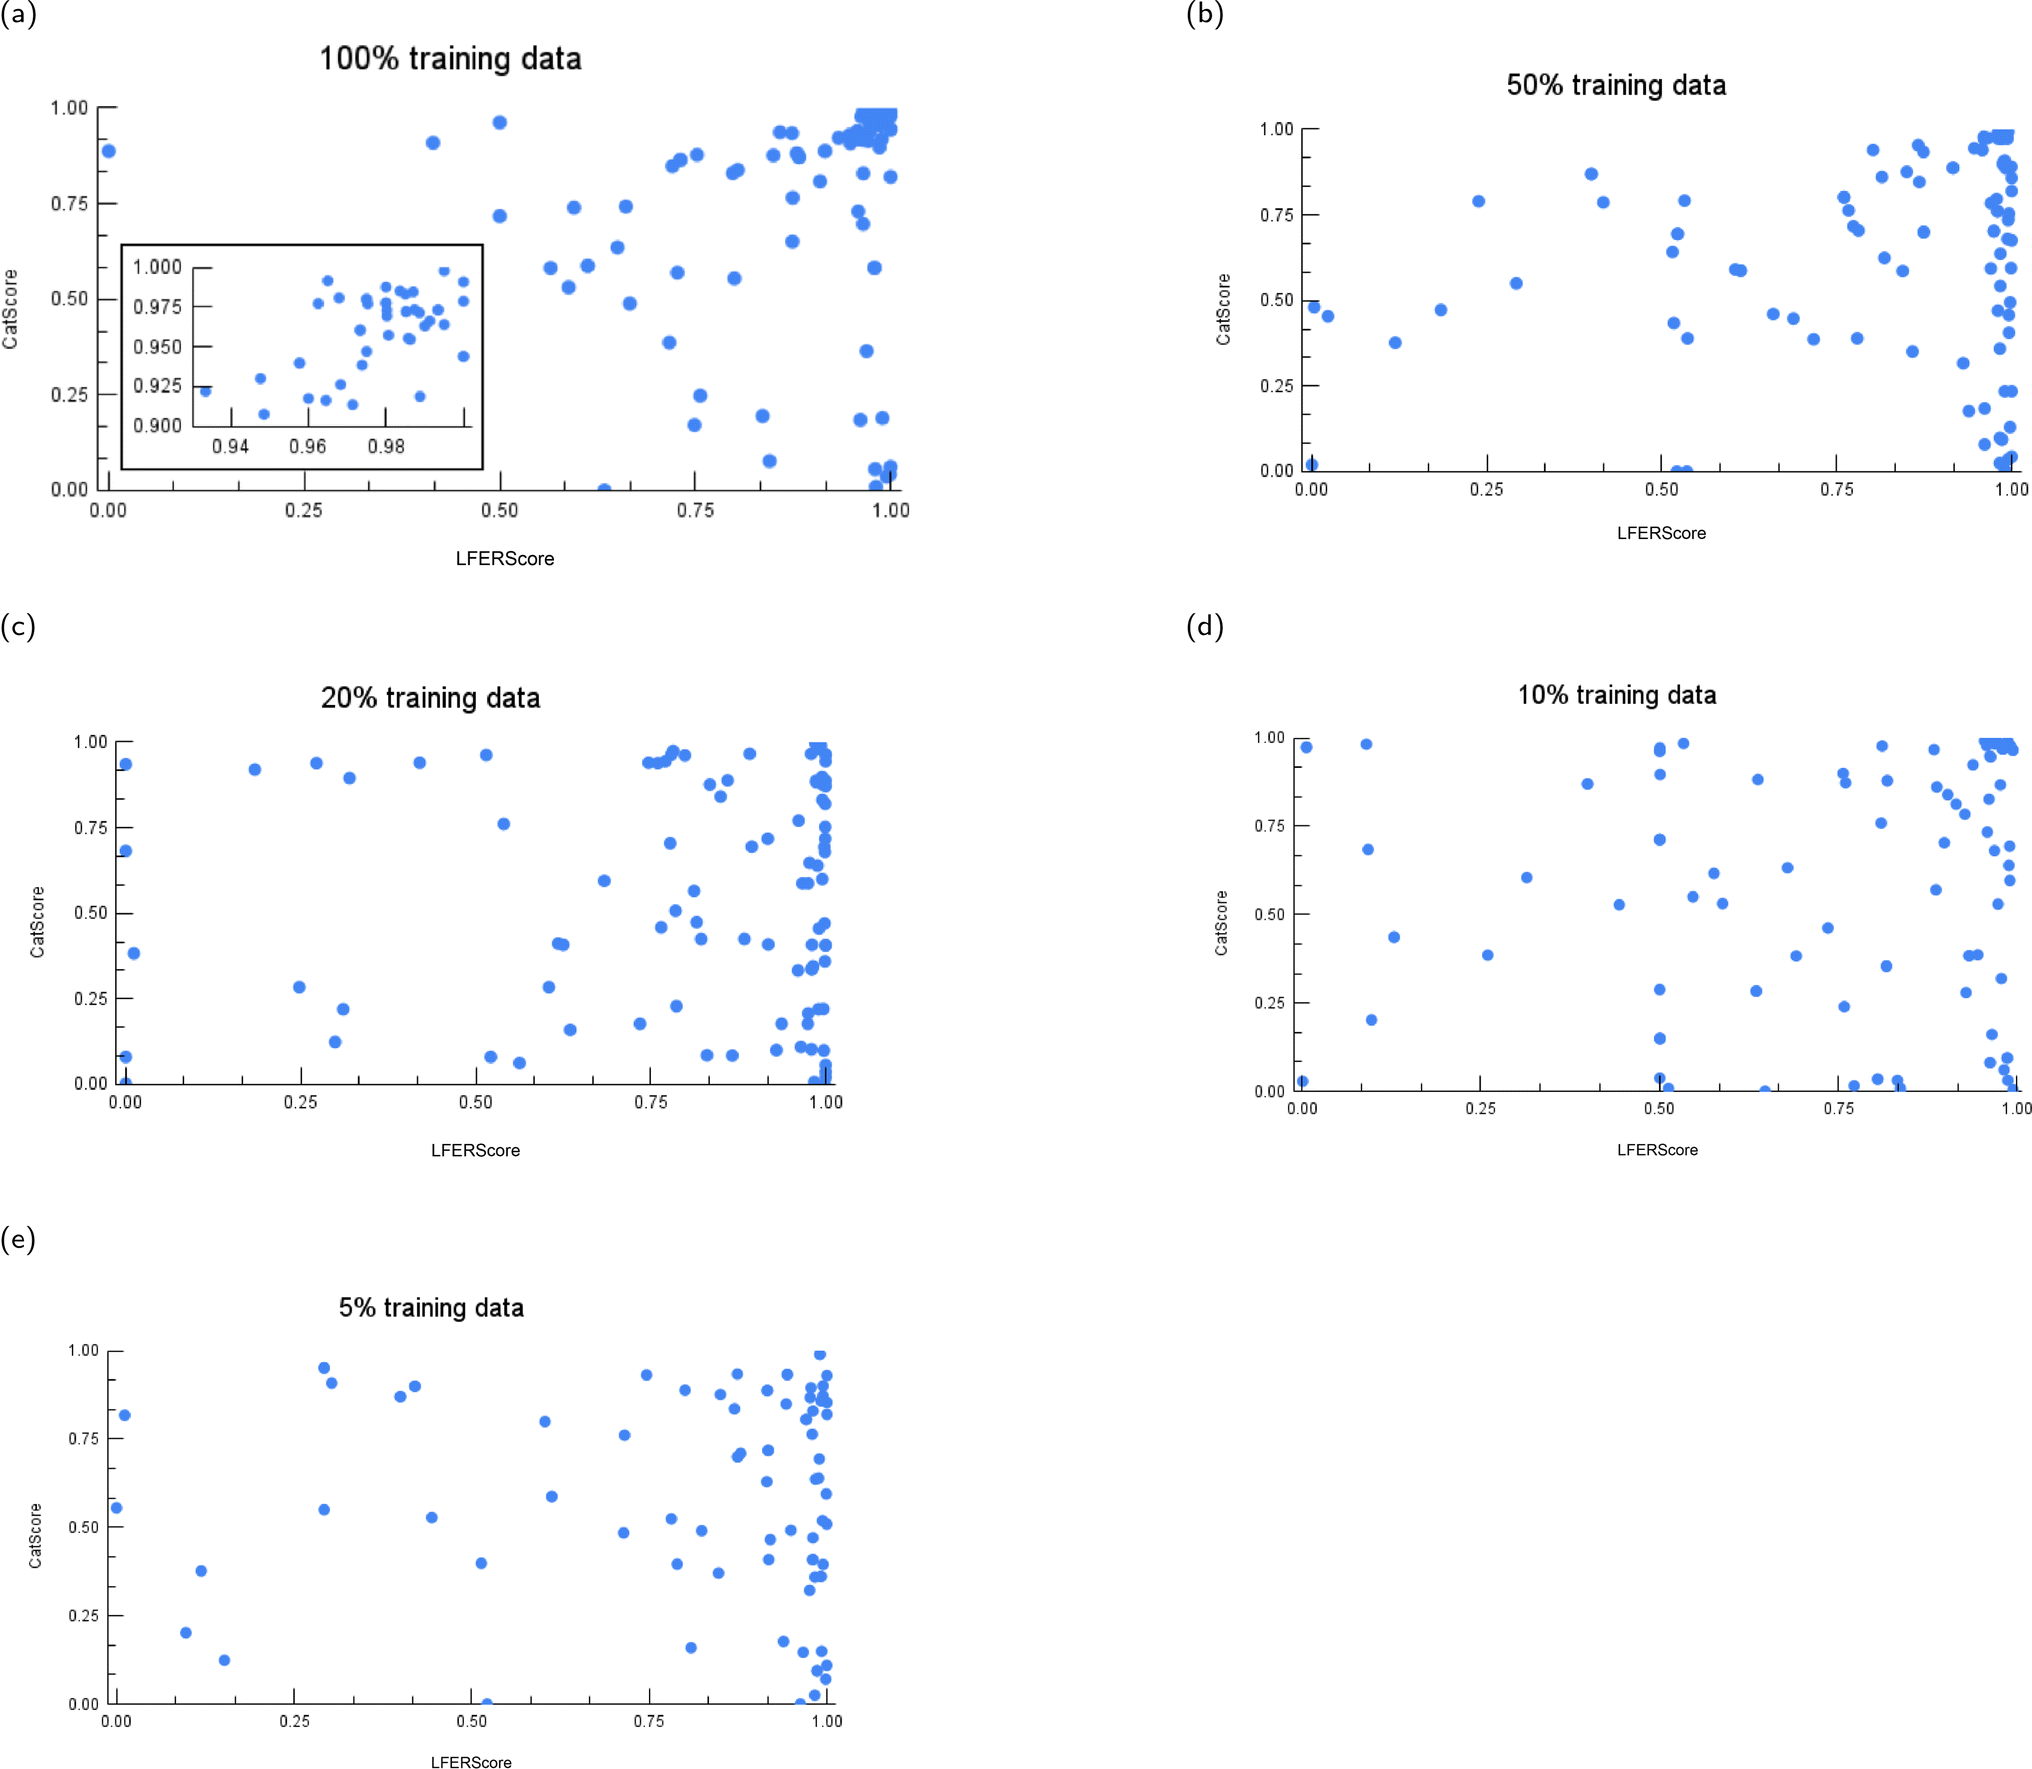 | ||
| Fig. 13 The instance-level CatScore versus LFERScore for catalyst design models trained on varying amounts of training data: (a) 100%, (b) 50%, (c) 20%, (d) 10%, and (e) 5% of training data. | ||
 | ||
| Fig. 14 The instance-level CatScore versus LFERScore for catalyst design models that are (a) trained from scratch, (b) trained on scaffold-splitting data where ferrocene-type catalysts are excluded from the training data, and (c) a random combination of the catalyst with the reactant. | ||
Acknowledgements
The authors acknowledge Dr Stephen Ra, Dr Kangway Chuang, and Dr Vishnu Sresht for their insightful discussions. This work was supported by the Samsung Advanced Institute of Technology (under the project Next Generation Deep Learning: From Pattern Recognition to AI) and the National Science Foundation (under NSF Award 1922658).Notes and references
- B. M. Trost, Proc. Natl. Acad. Sci. U. S. A., 2004, 101, 5348–5355 CrossRef CAS PubMed
.
- D. C. Blakemore, L. Castro, I. Churcher, D. C. Rees, A. W. Thomas, D. M. Wilson and A. Wood, Nat. Chem., 2018, 10, 383–394 CrossRef CAS PubMed
- Y. Dong, K. Shin, B. K. Mai, P. Liu and S. L. Buchwald, J. Am. Chem. Soc., 2022, 144, 16303–16309 CrossRef CAS PubMed
- S. Singh, M. Pareek, A. Changotra, S. Banerjee, B. Bhaskararao, P. Balamurugan and R. B. Sunoj, Proc. Natl. Acad. Sci. U. S. A., 2020, 117, 1339–1345 CrossRef CAS PubMed
- H. Chen, S. Yamaguchi, Y. Morita, H. Nakao, X. Zhai, Y. Shimizu, H. Mitsunuma and M. Kanai, Cell Rep. Phys. Sci., 2021, 2, 100679 CrossRef CAS
- M. Das, P. Sharma and R. B. Sunoj, J. Chem. Phys., 2022, 156, 114303 CrossRef CAS PubMed
- Y. Amar, A. Schweidtmann, P. Deutsch, L. Cao and A. Lapkin, Chem. Sci., 2019, 10, 6697–6706 RSC
- S. Gallarati, R. Fabregat, R. Laplaza, S. Bhattacharjee, M. D. Wodrich and C. Corminboeuf, Chem. Sci., 2021, 12, 6879–6889 RSC
- B. Owen, K. Wheelhouse, G. Figueredo, E. Özcan and S. Woodward, Results Chem., 2022, 4, 100379 CrossRef CAS
- H. Gao, T. J. Struble, C. W. Coley, Y. Wang, W. H. Green and K. F. Jensen, ACS Cent. Sci., 2018, 4, 1465–1476 CrossRef CAS PubMed
- P. Schwaller, R. Petraglia, V. Zullo, V. H. Nair, R. A. Haeuselmann, R. Pisoni, C. Bekas, A. Iuliano and T. Laino, Chem. Sci., 2020, 11, 3316–3325 RSC
- F. Jaume-Santero, A. Bornet, A. Valery, N. Naderi, D. Vicente Alvarez, D. Proios, A. Yazdani, C. Bournez, T. Fessard and D. Teodoro, J. Chem. Inf. Model., 2023, 63, 1914–1924 CrossRef CAS PubMed
- S. Chen and Y. Jung, JACS Au, 2021, 1, 1612–1620 CrossRef CAS PubMed
-
A. Wang, K. Cho and M. Lewis, Proceedings of the 58th Annual Meeting of the Association for Computational Linguistics, Online, 2020, pp. 5008–5020 Search PubMed
- W. Yuan, G. Neubig and P. Liu, Adv. Neural Inf. Process. Syst., 2021, 34, 27263–27277 Search PubMed
- J. Lu and Y. Zhang, J. Chem. Inf. Model., 2022, 62, 1376–1387 CrossRef CAS PubMed
-
Y. Wang, W. Wang, S. Joty and S. C. Hoi, Proceedings of the 2021 Conference on Empirical Methods in Natural Language Processing, EMNLP 2021, 2021 Search PubMed
- H. Le, Y. Wang, A. D. Gotmare, S. Savarese and S. C. H. Hoi, arXiv, 2022, preprint, arXiv:2207.01780, DOI:10.48550/arXiv.2207.01780.
- C. Raffel, N. Shazeer, A. Roberts, K. Lee, S. Narang, M. Matena, Y. Zhou, W. Li and P. J. Liu, J. Mach. Learn. Res., 2020, 21, 5485–5551 Search PubMed
-
P. Walsh and M. Kozlowski, Fundamentals of Asymmetric Catalysis, University Science
Books, 2009 Search PubMed
- J.-Y. Guo, Y. Minko, C. B. Santiago and M. S. Sigman, ACS Catal., 2017, 7, 4144–4151 CrossRef CAS
- A. C. Hillier, W. J. Sommer, B. S. Yong, J. L. Petersen, L. Cavallo and S. P. Nolan, Organometallics, 2003, 22, 4322–4326 CrossRef CAS
- L. Falivene, R. Credendino, A. Poater, A. Petta, L. Serra, R. Oliva, V. Scarano and L. Cavallo, Organometallics, 2016, 35, 2286–2293 CrossRef CAS
- A. Poater, B. Cosenza, A. Correa, S. Giudice, F. Ragone, V. Scarano and L. Cavallo, Eur. J. Inorg. Chem., 2009, 2009, 1759–1766 CrossRef
-
A. Verloop, W. Hoogenstraaten and J. Tipker, Drug Design, Academic Press, Amsterdam, 1976, vol. 11, pp. 165–207 Search PubMed
-
A. Verloop, Pesticide Chemistry: Human Welfare and Environment, Pergamon, 1983, pp. 339–344 Search PubMed
-
M. J. Frisch, G. W. Trucks, H. B. Schlegel, G. E. Scuseria, M. A. Robb, J. R. Cheeseman, G. Scalmani, V. Barone, G. A. Petersson, H. Nakatsuji, X. Li, M. Caricato, A. V. Marenich, J. Bloino, B. G. Janesko, R. Gomperts, B. Mennucci, H. P. Hratchian, J. V. Ortiz, A. F. Izmaylov, J. L. Sonnenberg, D. Williams-Young, F. Ding, F. Lipparini, F. Egidi, J. Goings, B. Peng, A. Petrone, T. Henderson, D. Ranasinghe, V. G. Zakrzewski, J. Gao, N. Rega, G. Zheng, W. Liang, M. Hada, M. Ehara, K. Toyota, R. Fukuda, J. Hasegawa, M. Ishida, T. Nakajima, Y. Honda, O. Kitao, H. Nakai, T. Vreven, K. Throssell, J. A. Montgomery Jr, J. E. Peralta, F. Ogliaro, M. J. Bearpark, J. J. Heyd, E. N. Brothers, K. N. Kudin, V. N. Staroverov, T. A. Keith, R. Kobayashi, J. Normand, K. Raghavachari, A. P. Rendell, J. C. Burant, S. S. Iyengar, J. Tomasi, M. Cossi, J. M. Millam, M. Klene, C. Adamo, R. Cammi, J. W. Ochterski, R. L. Martin, K. Morokuma, O. Farkas, J. B. Foresman and D. J. Fox, Gaussian ∼16 Revision C.01, Gaussian Inc., Wallingford CT, 2016 Search PubMed
- P. J. Hay and W. R. Wadt, J. Chem. Phys., 1985, 82, 299–310 CrossRef CAS
- P. J. Hay and W. R. Wadt, J. Chem. Phys., 1985, 82, 270–283 CrossRef CAS
- T. Gensch, G. dos Passos Gomes, P. Friederich, E. Peters, T. Gaudin, R. Pollice, K. Jorner, A. Nigam, M. Lindner-D’Addario, M. S. Sigman and A. Aspuru-Guzik, J. Am. Chem. Soc., 2022, 144, 1205–1217 CrossRef CAS PubMed
- L.-C. Xu, S.-Q. Zhang, X. Li, M.-J. Tang, P.-P. Xie and X. Hong, Angew.
Chem., Int. Ed., 2021, 60, 22804–22811 Search PubMed
- D. Weininger, J. Chem. Inf. Comput. Sci., 1988, 28, 31–36 Search PubMed
- Z.-W. Zhao, M. del Cueto and A. Troisi, Digital Discovery, 2022, 1, 266–276 Search PubMed
- E. M. Voorhees, TREC, 1999, 77–82 Search PubMed
- G. Liu, Z. Han, X.-Q. Dong and X. Zhang, Org. Lett., 2018, 20, 5636–5639 Search PubMed
- G. Liu, A. Li, X. Qin, Z. Han, X.-Q. Dong and X. Zhang, Adv. Synth. Catal., 2019, 361, 2844–2848 CrossRef CAS
- A. Wang, M. Bernasconi and A. Pfaltz, Adv. Synth. Catal., 2017, 359, 2523–2529 CrossRef CAS
- M. T. Reetz, G. Mehler and O. Bondarev, Chem. Commun., 2006, 2292–2294 RSC
- S. Wen, C. Chen, S. Du, Z. Zhang, Y. Huang, Z. Han, X.-Q. Dong and X. Zhang, Org. Lett., 2017, 19, 6474–6477 CrossRef CAS PubMed
- A. F. Zahrt, S. V. Athavale and S. E. Denmark, Chem. Rev., 2020, 120, 1620–1689 Search PubMed
- D. J. Durand and N. Fey, Chem. Rev., 2019, 119, 6561–6594 Search PubMed
- K. C. Harper, E. N. Bess and M. S. Sigman, Nat. Chem., 2012, 4, 366–374 CrossRef CAS PubMed
- A. V. Brethomé, S. P. Fletcher and R. S. Paton, ACS Catal., 2019, 9, 2313–2323 Search PubMed
- D. P. Kingma and J. Ba, arXiv, 2014, preprint, arXiv:1412.6980, DOI:10.48550/arXiv.1412.6980.
- I. Loshchilov and F. Hutter, arXiv, 2017, preprint, arXiv:1711.05101, DOI:10.48550/arXiv.1711.05101.
| This journal is © The Royal Society of Chemistry 2024 |