 Open Access Article
Creative Commons Attribution 3.0 Unported Licence
Automated odor-blending with one-pot Bayesian optimization†
Yota
Fukui
ab,
Kosuke
Minami
 *c,
Kota
Shiba
 c,
Genki
Yoshikawa
 cd,
Koji
Tsuda
 *ab and
Ryo
Tamura
 *ab
*ab
aGraduate School of Frontier Sciences, The University of Tokyo, 5-1-5 Kashiwanoha, Kashiwa, Chiba 277-8568, Japan. E-mail: tamura.ryo@nims.go.jp; tsuda@k.u-tokyo.ac.jp
bCenter for Basic Research on Materials, National Institute for Materials Science, 1-1 Namiki, Tsukuba, Ibaraki 305-0044, Japan
cResearch Center for Macromolecules and Biomaterials, National Institute for Materials Science, 1-1 Namiki, Tsukuba, Ibaraki 305-0044, Japan. E-mail: minami.kosuke@nims.go.jp
dMaterials Science and Engineering, Graduate School of Pure and Applied Science, University of Tsukuba, 1-1-1 Tennodai, Tsukuba, Ibaraki 305-8571, Japan
First published on 16th April 2024
Abstract
The creation of new odors by blending existing ones is usually done manually based on the human sense. To enable robots to perform this automatically, we developed an automated odor-blending system. In this system, an olfactory sensor system composed of an array of Membrane-type Surface stress Sensors (MSSs) performs odor measurement of a blended liquid, and Bayesian optimization controls the blending concentration. The actual blending of the liquid samples is performed by automated syringe pumps. Our system performs odor-blending by injecting liquid samples into a pot or by draining some of the liquid from the pot. The one-pot strategy has the advantage of reducing the amount of liquid samples used in the entire optimization task and reduces the problem of pot replacement. To implement this one-pot strategy effectively, a Drainable One-Pot Bayesian Optimization (DOPBO) algorithm was developed and applied to our system. The system was tested using a ternary liquid mixture.
Introduction
Odor is a complex gas mixture consisting of thousands of different molecules. Humans perceive different odors when the composition and concentration of the gas molecules are altered. Since there are over 400![[thin space (1/6-em)]](https://www.rsc.org/images/entities/char_2009.gif) 000 types of odorous/odorless molecules,1,2 an exceptionally large number of odors exist. Although such complexity of odors makes it difficult to create the desired odors, flavor chemists can create odors by blending natural and artificial fragrances based on the human sense.3,4 However, the human sense for odor varies significantly across individuals. Moreover, the number of flavor chemists is limited because of the rigorous training required to become one.
000 types of odorous/odorless molecules,1,2 an exceptionally large number of odors exist. Although such complexity of odors makes it difficult to create the desired odors, flavor chemists can create odors by blending natural and artificial fragrances based on the human sense.3,4 However, the human sense for odor varies significantly across individuals. Moreover, the number of flavor chemists is limited because of the rigorous training required to become one.
If we replace the flavor chemists with automated odor-blending systems, even with a limited number of flavor chemists, a desired odor can be created conveniently by automatically blending a small number of odor samples. After the blend recipe of a desired odor is identified, the odor can be digitized, and its odor information can be shared worldwide. In addition, it would be feasible to handle the cases where the blending of odors is difficult by human from a safety perspective. That is, it would be possible to create odors from hazardous samples, chemicals, and gases for the human body by blending safe odor samples. This would enable humans to understand these hazardous odors and dramatically reduce the number of accidents based on hazardous odors such as natural gas leaked from pipelines5 and volcanic gases.6 To establish an automated odor-blending system, we need to develop three elements: an olfactory sensor7–13 to replace the human sense of odors, black-box optimization14–16 to determine the amount of blending, and a robotic system17–25 to perform actual blending of samples.
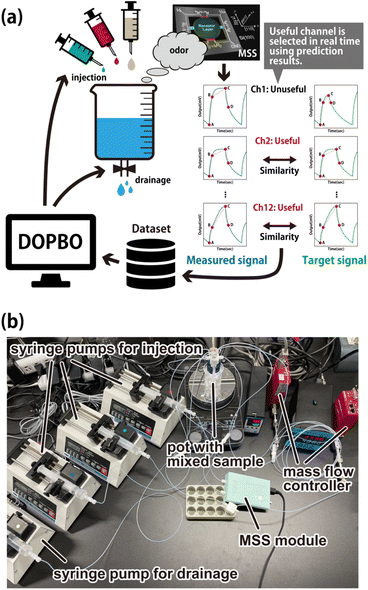
In this study, we integrated the olfactory sensor technique, black-box optimization method, and automated devices to develop a robotic system that can automatically blend odors in a one-pot system (Fig. 1). Here, the blending of the liquid samples was targeted. To produce a liquid mixture that exhibits the desired odor, liquid samples are injected into a pot. Some of the mixed liquid sample in the pot can be drained. The advantages of our one-pot system are as follows: (i) the amount of the mixed liquid sample in a pot does not vary significantly, (ii) the amount of liquid samples used in the entire optimization task can be reduced, and (iii) the problem of replacing the pot is eliminated. The odor of the mixed liquid sample is a gas that evaporates from the sample and is measured using an olfactory sensor. Variations in the amount of the mixed liquid sample in the pot can affect the concentration of gas in the headspace,26,27 and the response of the olfactory sensor should change. Thus, maintaining a constant amount of the sample in the pot is an important factor for stable measurements by the olfactory sensor system. However, if we prepare mixed liquid samples in different pots in each optimization cycle, the amount of liquid samples required to complete the optimization would increase, and the replacement of the pot in the odor measurement system would be time-consuming. The one-pot strategy can solve these problems simultaneously. We developed a Bayesian optimization (BO) algorithm for a one-pot odor-blending system, which is called the Drainable One-Pot Bayesian Optimization (DOPBO) algorithm. An olfactory sensor system composed of an array of Membrane-type Surface stress Sensors (MSSs)28–30 with 12 channels was used. The robot system was developed by automating the operation of a syringe pump using an in-house LabVIEW program. In our system, the response signals of the MSS for the target odor were first measured. To reproduce the response signals, the liquid samples were mixed in a one-pot system. Our system was tested to create the odors of a ternary liquid mixture and two seasonings.
Methods
One-pot Bayesian optimization algorithm (OPBO)
Before introducing the BO algorithm used in our one-pot odor-blending system, called DOPBO, we explain the algorithm without drainage, which is called One-Pot Bayesian Optimization (OPBO). This method optimizes the concentration of a liquid mixture. It minimizes the objective function f(w) by successively injecting the liquid samples into a pot. In our system, the objective function f(w) is defined by the similarity of response signals between the target odor and the liquid mixture in the pot. When three liquid samples are to be mixed, the OPBO procedure is as follows:(i) If there are M mixed liquid samples for which the objective function f(w) with the concentration of w is known in advance, the initial training data are defined as Dtrain = {(wi, f(wi))}i=1,…,M. When the amount of the three liquid samples is defined as x = (x1, x2, x3), the concentration of each liquid sample w = (w1, w2, w3) is obtained using
 | (1) |
(ii) The initial amounts of the three liquid samples in the pot are determined as x1 = (x11, x12, x13). The corresponding concentrations are calculated using eqn (1), and the objective function of f(w1) is measured. These data are added to Dtrain, and the number of training data becomes M + 1.
(iii) We assume that (δ1, δ2, δ3) are the minimum units of the injection amounts for each liquid sample and the total injection amounts should not exceed Δ. Using these parameters, we prepare a dataset Dcand that lists the amounts of the three liquid samples in the pot after injecting liquid samples. For example, when δ1 = δ2 = δ3 = 0.1 and Δ = 0.2, the candidate dataset from x1 = (x11, x12, x13) is defined as
| Dcand = {(x11, x12, x13 + 0.1), (x11, x12 + 0.1, x13), (x11 + 0.1, x12, x13), (x11, x12, x13 + 0.2), (x11, x12 + 0.2, x13), (x11 + 0.2, x12, x13), (x11, x12 + 0.1, x13 + 0.1), (x11 + 0.1, x12 + 0.1, x13), (x11 + 0.1, x12, x13 + 0.1)}. | (2) |
(iv) We prepare a candidate dataset containing the concentrations Dcandw. These were converted from Dcand using eqn (1).
(v) The Gaussian process regression is trained using Dtrain. The objective function and its uncertainty are predicted when Dcandw is used as the testing dataset. A promising candidate that minimizes the objective function is selected using an acquisition function based on the predicted value and its uncertainty.
(vi) The liquid samples are injected according to the selected candidate. As a result, the amounts of the three liquid samples in the pot become x2 = (x21, x22, x23). The objective function is measured as f(w2) with the concentration of w2 converted from x2. These data are added to Dtrain, and the number of training data becomes M + 2.
(vii) OPBO can be performed by repeating steps (iii)–(vi).
In this study, the Bayesian optimization package PHYSBO31 was used in (v), and Thompson sampling is used to generate the acquisition function. The OPBO algorithm has no upper limit of the number of liquid samples although the case of mixing three liquid samples is used as an example.
In the BO approach, it is common to use a fixed objective function of f(w). On the other hand, in our study, we adopted the strategy where the objective function is updated in each cycle. This is because it is not known in advance which of the multiple MSS channels is effective for the target odors. In this case, in (vi), the effective channels are appropriately selected using a method to be explained later, and f(w) is updated to the new objective function defined by the selected channels and returned to step (iii).
Drainable one-pot Bayesian optimization algorithm (DOPBO)
In the OPBO algorithm, only the injection into the pot is considered. However, if we can consider the drainage from the pot, the search space of the liquid mixture can be extended further. In addition, since the amount of liquid sample in the pot is not only increasing, the amount of sample in the pot would remain constant. DOPBO is a drainable version of OPBO. In this algorithm, in the step (iii) of OPBO, the number of candidates increases because of the diverse concentrations owing to drainage. Let η = (η1, η2,…,ηn) be the candidates of the ratio of the amounts to be reduced from the pot. For example, ηi = 0 represents the case where no liquid sample is drained, and ηi = 0.4 represents the case where 40% of the liquid sample in the pot is drained. When δ1 = δ2 = δ3 = 0.1 and Δ = 0.2, the candidate dataset is defined as| Dcand = {[x11 × (1 − ηi), x12 × (1 − ηi), x13 × (1 − ηi) + 0.1], [x11 × (1 − ηi), x12 × (1 − ηi) + 0.1, x13 × (1 − ηi)], [x11 × (1 − ηi) + 0.1, x12 × (1 − ηi), x13 × (1 − ηi)], [x11 × (1 − ηi), x12 × (1 − ηi), x13 × (1 − ηi) + 0.2], [x11 × (1 − ηi), x12 × (1 − ηi) + 0.2, x13 × (1 − ηi)], [x11 × (1 − ηi) + 0.2, x12 × (1 − ηi), x13 × (1 − ηi)], [x11 × (1 − ηi), x12 × (1 − ηi) + 0.1, x13 × (1 − ηi) + 0.1], [x11 × (1 − ηi) + 0.1, x12 × (1 − ηi) + 0.1, x13 × (1 − ηi)], [x11 × (1 − ηi) + 0.1, x12 × (1 − ηi), x13 × (1 − ηi) + 0.1]}i=1,…,n. | (3) |
Compared with OPBO, the search space increases, and more accurate optimization may be performed. DOPBO is available on GitHub (https://github.com/tsudalab/DOPBO). In the script, physbo 1.1.1 is used.
Automated odor-blending system for a ternary liquid mixture
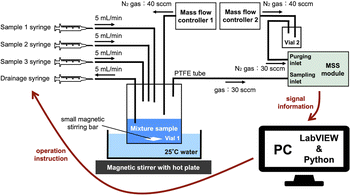
As shown in Fig. 2, four syringe pumps were set up. The error in adding liquid samples with syringe pumps was approximately 3 microliters. Three of them contained three types of liquid samples, and the fourth was empty. The sample was supplied at 5 mL min−1 by connecting PTFE tubes to the syringes. The sample was added dropwise by inserting the PTFE tubes through the holes in the lid of glass vial 1. A PTFE tube connected to the empty syringe was also inserted into a hole in the lid of vial 1 so that the mixed liquid sample in vial 1 could be drained. Vial 1 was maintained at 25 °C using a heating bath. The mixed liquid sample was stirred well with a small magnetic stirring bar at 300 rpm. Vial 1 was connected to two PTFE tubes. One of them was connected to mass flow controller 1, and 40 sccm of nitrogen was supplied to vial 1. The other PTFE tube was connected to the sampling gas inlet of the standard module containing the MSS chips with 12 channels and was set to capture the gas in vial 1 at 30 sccm. The nitrogen supply line was created using mass flow controller 1 to prevent measurement errors caused when outside air with high humidity is drawn in. Specifically, by providing a larger amount of nitrogen to vial 1 than the sampling inflow from vial 1, we prevented the outside air from entering its headspace (the space with only the target gas above the mixed liquid sample). Mass flow controller 2 was connected to the purge gas inlet of the standard module through empty glass vial 2 and supplied nitrogen at 40 sccm. Moreover, the purge gas inlet of the standard module was set to capture gas at 30 sccm. This difference between the two flow rates was maintained to prevent the outside air with high humidity from entering vial 2.To realize an automated odor-blending system, the LabVIEW program was developed to control the pumping by the syringe pumps, perform DOPBO, and analyze the response signals of the MSS. Our developed LabVIEW program (National Instruments) and the program controlling the standard module for the MSS were executed simultaneously on the same PC. Using the LabVIEW program, the timing for measuring the target sample by the MSS was specified, and a demonstration was conducted with measurements at approximately 8 min intervals. The devices used in our system are summarized in ESI Note A.†
Features of each response in a signal
To obtain the response signals for the odor sample, the following protocol using MSSs was iterated. First, the sampling and purging were repeated two times for 10 s each. Subsequently, a long purge time of 120 s was applied. A schematic of this response is shown in Fig. 3. For the second peak with a 10 s sample and purge, four parameters were extracted. Parameter 1 is defined by the slope of the line joining points A and B shown in Fig. 3. This is related to the adsorption process on the odor receptor materials. The slope of the line joining points B and C was used as parameter 2, and the quasi-equilibrium state information was reflected. Parameter 3 is defined as the slope of the line joining points C and D. It is related to the odor desorption process. Finally, parameter 4 represents the height of the signal and includes information on the adsorption capacity of each receptor material. Here, we fixed the time difference between points A and B as 0.5 s. It was also used for points C and D. Since we prepared 12 channels, each odor sample was represented by 48 parameters (i.e., four features times 12 channels). That is, the feature vector extracted from the MSS signal was 48-dimensional. This definition of the feature was used in our previous studies,32–34 and the odor quantification and detection of quasi-primary odors can be achieved using these features.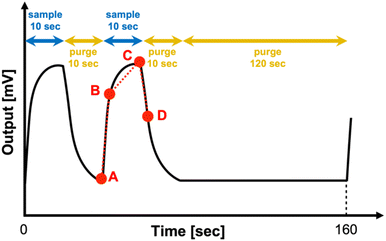 | ||
| Fig. 3 Schematic response signal from the MSS and the protocol to obtain the feature of the response signal. | ||
Selection strategy of effective channels in MSSs
From the response signals obtained by the standard module, 48-dimensional features were obtained. The objective function for DOPBO is defined by the similarity between the features of the target odor and liquid mixture. However, since effective channels depend on liquid samples, ineffective channels may become noise for the optimization task. The effective channel will also be affected by the combination of samples to be mixed. Thus, we consider the case that the effective channel is not known before optimization, and when the data are increased by the optimization task, the search for the effective channel is performed simultaneously with the optimization. We introduced a strategy in which four effective channels were selected during the optimization process, and the objective function was defined using only the selected channels. Here, we assumed effective channels to be those that can correctly predict the concentration of the mixture. For each channel, four-dimensional features were extracted and used to predict the concentration of each liquid sample by linear regression. To estimate the prediction accuracy, we performed a five-fold cross-validation and calculated the mean squared error for each concentration of the mixture. The average value of the mean squared errors for each concentration was used as a measure of the channel that could correctly predict the concentration of the mixture. Thus, the top four channels in ascending order of this value were selected as the effective channels. For each step in the optimization cycle, this selection was performed using the data obtained at that time. Since the data for the initial step was inadequate, optimization was started on a predetermined channel. When the number of training data points reached five, the above selection was started.Using the selected four effective channels, the objective function for BO algorithms is defined as
| f(w) = |z(w) − z*|, | (4) |
Results
Performance of drainable one-pot Bayesian optimization using a test function
We evaluated the performance of DOPBO using a test function before considering a real blending system. Assuming a ternary mixture case, a three-dimensional Ackley function was used. The target concentration for the three samples is defined as with
with  and
and  . Rather than using eqn (4), the objective function is set as follows when the concentration of the mixture in the pot is w:
 | (5) |
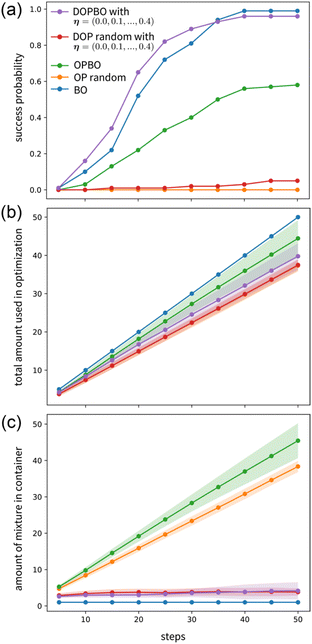
To evaluate the optimization performance, 100 random target concentrations  were generated. When |w* − w| < 0.01 was achieved via optimization, the optimization was assumed to be successful. In the one-pot algorithms, the minimum unit of the injection amount for each liquid sample was set to 0.1, i.e., δ1 = δ2 = δ3 = 0.1. In addition, the maximum total injection amount at each step was set to Δ = 1.0. The dependence on the minimum injection amount is discussed in ESI Note B.† First, we considered the case where the initial training data included the data at wi = (1.0, 0.0, 0.0) and (0.0, 1.0, 0.0), and the initial concentrations of the three liquid samples were set to w1 = (0.0, 0.0, 1.0). The number of targets that attained |w* − w| < 0.01, where the optimization was succeeded, by the time of each step was counted. This value divided by 100 is defined as “success probability” and its step dependence is shown in Fig. 4(a). The results of conventional BO (where it is necessary to empty the pot at every step), OPBO without drainage, and DOPBO were compared. Here, η = (0.0, 0.1, 0.2, 0.3, 0.4), which determines the amount to be reduced from the pot, was used in DOPBO. That is, the maximum drainage was 40% of the liquid mixture in the pot. For BO, the minimum unit of concentration was fixed as 0.01, and 5148 candidates were generated, and the amount of prepared mixture was assumed to be one. One-pot versions of a random exploration were also compared as One-Pot (OP) random without drainage and Drainable One-Pot (DOP) random. In OP random and DOP random, from the candidate datasets defined by eqn (2) and (3), one condition is randomly selected, respectively.
Fig. 4(a) shows that OPBO performed better than random explorations, with successful optimization of approximately half of the target concentrations after 50 steps. The performances of BO and DOPBO were comparable. This verified that optimization was achieved at most of the target concentrations. These results highlight the importance of drainage in one-pot systems. The total amount of liquid samples used for each method depending on the steps is shown in Fig. 4(b). It was observed that the total amount of liquid samples could be reduced by DOPBO compared with the conventional BO. The amount of liquid samples in the pot at each step is shown in Fig. 4(c). The amount of liquid in the pot was controlled when drainage was considered. This is an important aspect when conducting experiments using olfactory sensors. It indicates that DOPBO is a suitable algorithm for automated odor-blending that can reduce the total amount of liquid samples used compared with that for the conventional BO. In contrast, OPBO is not suitable in the absence of drainage because of its low success probability and ineffective control over the amount of liquid in the pot. In ESI Note B,† the optimization performances depending on η, initial training dataset, and initial concentrations are investigated. In addition, we performed the calculations on several functions known as test functions with 3-dimensional variables, and the results are summarized in ESI Note C.† In all cases, we found that DOPBO performed better and in some cases had a better success probability than BO.
Demonstration of automated odor-blending in a real device
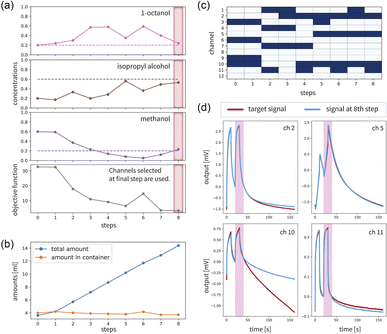
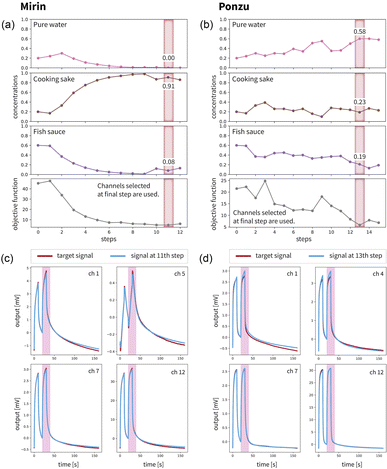
To demonstrate our automated odor-blending system (Fig. 1(b)), a mixture of 1-octanol (FujiFilm Wako Pure Chemical Corporation, 97%), isopropyl alcohol (FujiFilm Wako Pure Chemical Corporation, ≥98%), and methanol (Kanto Chemical Co., Ltd, 99.8%) was considered. For the target liquid mixture, we prepared a sample of (1-octanol, isopropyl alcohol, methanol) = (0.2, 0.6, 0.2) and measured it using a MSS. Automated odor-blending was performed using the initial training data of [(0.8, 0.1, 0.1), (0.1, 0.8, 0.1)], and (0.8 mL, 0.8 mL, 2.4 mL) as the initial amount in the pot according to the best case for the test function shown in ESI Note B.† The initial concentrations of (0.2, 0.2, 0.6) are not close to the target concentration. The maximum injection volume was set to Δ = 1.5 mL. Moreover, δ1 = δ2 = δ3 = 0.3 mL was used. The step dependences of the concentrations of 1-octanol, isopropyl alcohol, and methanol and the value of the objective function f(w) defined by eqn (4) when the effective channels selected in the final step were used are summarized in Fig. 5(a). At the final step, the value of the objective function was minimized, and the concentrations of the mixture in the pot were close to the correct values in this cycle. This result indicated that odor-blending was performed correctly using our robotic system. Fig. 5(b) shows the total amount of liquid samples used in the optimization and the transition of the amount of liquid in the pot. The amount of liquid in the pot could be controlled. The selected effective channels depending on the step are shown in Fig. 5(c). This indicates that channels 2, 5, 10, and 11 are important in the final step. These channels are different from the channels used in the initial step, and the effective channels are selected automatically through the optimization cycle. The response signals obtained in the final step for the selected channels at the final step were compared with those obtained as the targets, as summarized in Fig. 5(d). The signals of the mixture accurately reproduced the target signals. In addition, an experiment when the target mixture is set to (1-octanol, isopropyl alcohol, methanol) = (0.6, 0.1, 0.3) was performed, and we confirmed that the correct mixture was achieved. The results are summarized in Fig. S6.† Thus, we demonstrated that automated odor-blending can be realized correctly using the developed system. The operation of our automated odor-blending system is illustrated in ESI Movie 1.†Finally, we attempted to create odors of some seasonings by mixing other seasonings using an automated odor-blending system. We considered mixing pure water, cooking sake (Hinode Holdings Co., Ltd), and fish sauce (Allied Corporation Co., Ltd). These seasonings are known to have characteristic signals measured by the MSS module,34 although it is different from the current MSS module. The target seasonings were mirin (Hinode Holdings Co., Ltd) and ponzu (Mizkan Holdings Co., Ltd). For each case, the step dependence of the concentrations of pure water, cooking sake, and fish sauce and the value of the objective function f(w) defined by eqn (4) when the effective channels selected in the final step are used are summarized in Fig. 6(a) and (b). In addition, the response signals at the step in which the objective function is minimized are compared with those obtained as targets in Fig. 6(c) and (d). The total amount of liquid samples used in the optimization and the amount of liquid in the pot and selected four effective channels depending on the steps are summarized in Fig. S7.† In both cases, the signals can be reproduced with high accuracy. For mirin, the main component in the mixture was cooking sake. This is consistent with the fact that the main components of mirin are ethanol and some kinds of sugars, and the smell would be similar to cooking sake. For ponzu, which is created by mixing soy sauce, brewed vinegar, and citrus juice, the three seasonings are mixed to form similar signals to target ones. On the other hand, there is no sour smell in the mixed seasonings, and it is difficult to perfectly reproduce the odor of ponzu based on vinegar and citrus, as a smell that human perceive.
Discussion and conclusions
In this study, we developed an automated odor-blending system using MSSs and machine learning. In our system, blending of liquid samples was targeted, and the liquid samples were injected into a pot. When olfactory sensors are used, it is important to control the amount of liquid in the pot. That is, the amount of liquid should not vary significantly. To achieve this, an effective algorithm called drainable one-pot Bayesian optimization (DOPBO) was developed. Using some test functions, we demonstrated that the total amount of liquid used in the optimization can be decreased by DOPBO compared with conventional Bayesian optimization. Moreover, the optimization performance of DOPBO is approximately equal to that of the conventional Bayesian optimization in the verification using test functions. Blending experiments were conducted using a mixture of 1-octanol, isopropyl alcohol, and methanol. Liquid samples with the correct concentration were produced successfully using the proposed system. In addition, we attempted to create odors for two seasonings (mirin and ponzu) by mixing other seasonings (pure water, cooking sake, and fish sauce) using our system and verified that mixing can produce sensor signals similar to the target signals. In the future, we will attempt to solve real problems such as the blending of perfumes and artificial flavors.In this study, an MSS was used as the olfactory sensor. The receptor materials used in the MSS do not match human olfactory receptors, and the odors produced by our automated odor-blending systems are often different from those perceived by humans. The development of receptor materials with properties similar to human olfactory receptors is an important perspective for the future, as it will complete the technology to create odors that are consistent with human perception. In addition, our automated odor-blending system can be easily applied to other odor sensors such as metal oxide sensors,35,36 quartz resonator type sensors,37 and piezoresistive sensors.38,39 Thus, the improvement of olfactory sensor technology will promote the practical application of our automated odor-blending system.
Data availability
The code of our algorithm called DOPBO and experimental results are available at https://github.com/tsudalab/DOPBO.Author contributions
Yota Fukui: formal analysis (equal); methodology (equal); software (equal); investigation (equal); visualization (equal); writing – original draft (equal). Kosuke Minami: methodology (equal); project administration (equal); writing – review & editing (equal). Kota Shiba: methodology (supporting); writing – review & editing (equal). Genki Yoshikawa: methodology (supporting); writing – review & editing (equal). Koji Tsuda: conceptualization (equal); methodology (equal); project administration (equal); writing – review & editing (equal). Ryo Tamura: conceptualization (equal); formal analysis (equal); methodology (equal); investigation (equal); software (equal); visualization (equal); project administration (equal); writing – original draft (equal).Conflicts of interest
The authors declare no competing interests.Acknowledgements
We thank Dissanayake Santha Kumara (NIMS) for the coating of the receptor layers onto the MSS chips. We thank Takahiro Nemoto (NIMS), Masaaki Matoba (NIMS), and Masahito Kumada (U. Tokyo) for valuable discussions. This study was partially supported by a project subsidized by a Grant-in-Aid for Scientific Research (B), JSPS, MEXT, Japan (21H01971 and 21H01008); a Grant-in-Aid for Scientific Research (C), JSPS, MEXT, Japan (22K05324); a Grant-in-Aid for Challenging Research (Exploratory), JSPS, MEXT, Japan (21K18859); Fund for the Promotion of Joint International Research, International Collaborative Research, JSPS, MEXT, Japan (JP19KK0141).References
- J. T. E. Richardson and G. M. Zucco, Psychol. Bull., 1989, 105, 352–360 CAS.
- J. A. Gottfried, Curr. Opin. Neurobiol., 2009, 19, 422–429 CrossRef CAS PubMed.
- H. Heath and G. Reineccius, Flavor Chemistry and Technology, Springer Dordrecht, 1986 Search PubMed.
- R. Teranishi, Challenges in Flavor Chemistry: An Overview, in Flavor Analysis, American Chemical Society, 1998, vol. 705, pp. 1–6 Search PubMed.
- A. Bianchini, A. Guzzini, M. Pellegrini and C. Saccani, Int. J. Pressure Vessels Piping, 2018, 168, 24–38 CrossRef.
- H. Sigurdsson, Encyclopedia of Volcanoes, Academic Press, 2015 Search PubMed.
- J. W. Gardner and P. N. Bartlett, Sens. Actuators, B, 1994, 18, 210–211 CrossRef.
- K. Persaud and G. Dodd, Nature, 1982, 299, 352–355 CrossRef CAS PubMed.
- G. Konvalina and H. Haick, Acc. Chem. Res., 2014, 47, 66–76 CrossRef CAS PubMed.
- J. Gutiérrez and M. C. Horrillo, Talanta, 2014, 124, 95–105 CrossRef PubMed.
- R. A. Potyrailo, Chem. Rev., 2016, 116, 11877–11923 CrossRef CAS PubMed.
- J.-W. Yoon and J.-H. Lee, Lab Chip, 2017, 17, 3537–3557 RSC.
- I. Manzini, D. Schild and C. Di Natale, Physiol. Rev., 2022, 102, 61–154 CrossRef CAS PubMed.
- T. Ueno, T. D. Rhone, Z. Hou, T. Mizoguchi and K. Tsuda, Mater. Discovery, 2016, 4, 18–21 CrossRef.
- K. Terayama, M. Sumita, R. Tamura and K. Tsuda, Acc. Chem. Res., 2021, 54, 1334–1346 CrossRef CAS PubMed.
- Y. Jin and P. V. Kumar, Nanoscale, 2023, 15, 10975–10984 RSC.
- B. Burger, P. M. Maffettone, V. V. Gusev, C. M. Aitchison, Y. Bai, X. Wang, X. Li, B. M. Alston, B. Li, R. Clowes, N. Rankin, B. Harris, R. S. Sprick and A. I. Cooper, Nature, 2020, 583, 237–241 CrossRef CAS PubMed.
- A. Dave, J. Mitchell, K. Kandasamy, H. Wang, S. Burke, B. Paria, B. Póczos, J. Whitacre and V. Viswanathan, Cell Rep. Phys. Sci., 2020, 1, 100264 CrossRef CAS.
- R. Shimizu, S. Kobayashi, Y. Watanabe, Y. Ando and T. Hitosugi, APL Mater., 2020, 8, 111110 CrossRef CAS.
- B. P. MacLeod, F. G. L. Parlane, T. D. Morrissey, F. Häse, L. M. Roch, K. E. Dettelbach, R. Moreira, L. P. E. Yunker, M. B. Rooney, J. R. Deeth, V. Lai, G. J. Ng, H. Situ, R. H. Zhang, M. S. Elliott, T. H. Haley, D. J. Dvorak, A. Aspuru-Guzik, J. E. Hein and C. P. Berlinguette, Sci. Adv., 2020, 6, eaaz8867 CrossRef CAS PubMed.
- L. M. Roch, F. Häse, C. Kreisbeck, T. Tamayo-Mendoza, L. P. E. Yunker, J. E. Hein and A. Aspuru-Guzik, PLoS One, 2020, 15, e0229862 CrossRef CAS PubMed.
- S. Matsuda, G. Lambard and K. Sodeyama, Cell Rep. Phys. Sci., 2022, 3, 100832 CrossRef CAS.
- K. Nagai, T. Osa, G. Inoue, T. Tsujiguchi, T. Araki, Y. Kuroda, M. Tomizawa and K. Nagato, Sci. Rep., 2022, 12, 1615 CrossRef CAS PubMed.
- R. Tamura, K. Tsuda and S. Matsuda, Sci. Technol. Adv. Mater.: Methods, 2023, 3, 2232297 Search PubMed.
- K. Hippalgaonkar, Q. Li, X. Wang, J. W. Fisher, J. Kirkpatrick and T. Buonassisi, Nat. Rev. Mater., 2023, 8, 241–260 CrossRef.
- T. Górecki, Analyst, 1997, 122, 1079–1086 RSC.
- An Introduction to Headspace Sampling in Gas Chromatography, PerkinElmer, https://www.perkinelmer.com/libraries/gde_intro_to_headspace, accessed 13 February 2024 Search PubMed.
- G. Yoshikawa, T. Akiyama, S. Gautsch, P. Vettiger and H. Rohrer, Nano Lett., 2011, 11, 1044–1048 CrossRef CAS PubMed.
- G. Yoshikawa, T. Akiyama, F. Loizeau, K. Shiba, S. Gautsch, T. Nakayama, P. Vettiger, N. F. de Rooij and M. Aono, Sensors, 2012, 12, 15873–15887 CrossRef PubMed.
- K. Minami, G. Imamura, R. Tamura, K. Shiba and G. Yoshikawa, Biosensors, 2022, 12, 762 CrossRef CAS PubMed.
- Y. Motoyama, R. Tamura, K. Yoshimi, K. Terayama, T. Ueno and K. Tsuda, Comput. Phys. Commun., 2022, 278, 108405 CrossRef CAS.
- K. Shiba, R. Tamura, G. Imamura and G. Yoshikawa, Sci. Rep., 2017, 7, 1–12 CrossRef CAS PubMed.
- K. Shiba, R. Tamura, T. Sugiyama, Y. Kameyama, K. Koda, E. Sakon, K. Minami, H. T. Ngo, G. Imamura, K. Tsuda and G. Yoshikawa, ACS Sens., 2018, 3, 1592–1600 CrossRef CAS PubMed.
- H. Xu, K. Kitai, K. Minami, M. Nakatsu, G. Yoshikawa, K. Tsuda, K. Shiba and R. Tamura, Sci. Rep., 2021, 11, 12070 CrossRef CAS PubMed.
- H. Meixner and U. Lampe, Sens. Actuators, B, 1996, 33, 198–202 CrossRef CAS.
- C. Wang, L. Yin, L. Zhang, D. Xiang and R. Gao, Sensors, 2010, 10, 2088–2106 CrossRef CAS PubMed.
- K. Ema, M. Yokoyama, T. Nakamoto and T. Moriizumi, Sens. Actuators, 1989, 18, 291–296 CrossRef CAS.
- Md. M. Hossain, M. Toda, T. Hokama, M. Yamazaki, K. Moorthi and T. Ono, IEEE Sens. Lett., 2019, 3, 1–4 Search PubMed.
- M. Toda, K. Moorthi, T. Hokama, Z. Wang, M. Yamazaki and T. Ono, Sens. Actuators, B, 2021, 333, 129524 CrossRef CAS.
Footnote |
| † Electronic supplementary information (ESI) available. See DOI: https://doi.org/10.1039/d3dd00215b |
| This journal is © The Royal Society of Chemistry 2024 |

