
 Open Access Article
 This Open Access Article is licensed under a Creative Commons Attribution-Non Commercial 3.0 Unported Licence
Unlocking the predictive power of quantum-inspired representations for intermolecular properties in machine learning†
Raul
Santiago
 *,
Sergi
Vela
,
Mercè
Deumal
and
Jordi
Ribas-Arino
*,
Sergi
Vela
,
Mercè
Deumal
and
Jordi
Ribas-Arino
Departament de Ciència de Materials i Química Física, Institut de Química Teòrica i Computacional (IQTCUB), Universitat de Barcelona, Martí i Franquès, 1, 08028 Barcelona, Spain. E-mail: raul.sant.1972@gmail.com
First published on 14th November 2023
Abstract
The quest for accurate and efficient Machine Learning (ML) models to predict complex molecular properties has driven the development of new quantum-inspired representations (QIR). This study introduces MODA (Molecular Orbital Decomposition and Aggregation), a novel QIR-class descriptor with enhanced predictive capabilities. By incorporating wave-function information, MODA is able to capture electronic structure intricacies, providing deeper chemical insight and improving performance in unsupervised and supervised learning tasks. Specially designed to be separable, the multi-moiety regularization technique unlocks the predictive power of MODA for both intra- and intermolecular properties, making it the first QIR-class descriptor capable of such distinction. We demonstrate that MODA shows the best performance for intermolecular magnetic exchange coupling (JAB) predictions among the descriptors tested herein. By offering a versatile solution to address both intra- and intermolecular properties, MODA showcases the potential of quantum-inspired descriptors to improve the predictive capabilities of ML-based methods in computational chemistry and materials discovery.
Introduction
Machine Learning (ML) is having a tremendous impact in Quantum Chemistry (QC).1–6 Several research fields are benefiting from new computational strategies combining QC and ML, such as molecular electronics,7,8 excited states,9–11 low cost discovery of materials,12,13 or catalysis.14 Generally, ML models require data to be transformed into a fixed-size representation, usually in the form of a vector, where each element represents a specific attribute or feature. In chemistry, the construction of these elements (typically called descriptors) is particularly challenging due to the diversity and complexity of chemical systems and their interactions. Unlike other applications, molecules do not possess an intrinsic order, structure or size, which makes it difficult to define a universal representation. In the last decade, significant efforts have been made to develop reliable descriptors.15 These can be classified in three different categories. The first one are cheminformatics descriptors, based on either string fingerprints16,17 or on descriptive properties that are easily obtainable by a priori knowledge, such as the number of aromatic rings or the molecular size.18,19 The second category comprises descriptors based on three-dimensional structural information, usually supplemented with parameters inherited from classical mechanics (e.g., electrostatic potentials, or local density overlaps). In essence, this category does not consider the principles of quantum mechanics and, thus, the descriptors belonging to this category can be referred to as classical-informed representations (CIR). Examples include SOAP20 (Smooth Overlap of Atomic Positions), SLATM21 (Spectrum of London and Axilrod–Teller–Muto), many-body interaction descriptor,22 MBTR23 (Many-Body Tensor Representation), BoB24 (Bag of Bonds) or ACSF25 (Atom-Centered Symmetry Functions). Finally, the third category are descriptors that utilize principles of quantum mechanics to represent the molecular systems and, hence, can be referred to as quantum-informed representations (QIR), with SPAHM26 (Spectrum of Approximated Hamiltonian Matrices Representation), FJK27 (Fock–Coulomb-Exchange) and MAOC28 (Matrix of Orthogonalized Atomic Orbital Coefficients) being the few existing ones.The main advantage of QIR over CIR descriptors is that the former can explicitly encode the electronic state of a system, including its electronic structure, charge and spin multiplicity. These attributes are necessary to discriminate, e.g., radicals from closed-shell molecules, or neutral from charged species, particularly when the molecular geometry is not significantly affected (and thus, CIR does not significantly change). Although in their early stage of development, QIR descriptors are believed to have the potential to enhance the prediction of properties rooted in the electronic structure of a system. However, a common problem for both CIR and QIR approaches when combined with ML models is the prediction of intermolecular properties.29,30 The reason is that, for the sake of better sensitivity, the majority of the descriptors emphasize the magnitude of short-range interactions to better capture the local atomic environment. As a result, these representations can underperform in cases where medium- or long-range (possibly intermolecular) interactions are crucial.15,31 This issue can be addressed by decoupling intra- and intermolecular interactions in the representation, and simply ignoring the former in the construction of the descriptor.29,32 Although this approach has proven to be successful, neglecting the intramolecular components might be a rather severe simplification, since they can be correlated to the intermolecular property to some extent. For this reason, we here present a mathematical formalism able to accommodate fine-tuned contributions of intra- and intermolecular components in kernel-based ML models.
In general, the possibility to decouple atomic interactions depends on the strategy used to encode molecular information. For instance, BoB is based on 2-body Coulomb potentials and, hence, it can be decoupled using some distance or connectivity criterion. Contrarily, SPAHM and MAOC, being based on an eigen-decomposition of the Hamiltonian, are not compatible with such an approach, as the resulting eigen-states are related to many-body interactions, potentially gathering contributions from atoms in different moieties. The development of methods that combine the advantages of QIR descriptors for fine-grained representations and the separability of some CIR are sought, as would enable accurate predictions of intermolecular properties while maintaining the benefits of QIR approaches. The relevance of such methods is thus clear, as it would significantly extend the capabilities of ML models in predicting complex intermolecular properties. Herein, we introduce the Molecular Orbital Decomposition and Aggregation (MODA) as a new QIR descriptor, the first of its kind that allows decoupling strategies. As in SPAHM and MAOC, MODA does not require the calculation of self-consistent field (SCF) solutions. Instead, MODA representation can be constructed using well-established “guess” Hamiltonians,33 such as the Superposition of Atomic Densities (SAD),34 the Superposition of Atomic Potentials (SAP),35 or the extended Huckel method36 (EH), which are typically starting points in quantum chemistry. The use of these “guess” Hamiltonians provides a computationally-light, yet powerful and simple framework to develop QIR descriptors.
One adequate platform to test and develop new QIR descriptors and also evaluate the possibility to separate intra- and intermolecular components is molecular magnetism. In particular, we have focused on the evaluation of magnetic exchange couplings, JAB, which quantify the strength and character of the spin–spin interactions between two, A and B, spin carrying moieties. As it has been shown for datasets comprising di-copper complexes described by BoB, SOAP and MBTR, among others, the prediction of JAB with non-linear regression models can be challenging.37 Moreover, magnetic interactions often occur through-space between independent molecular units and, thus, JAB becomes an intermolecular property. In the following sections, (a) we present the formalism to derive MODA and the strategy to decouple it in intra- and intermolecular components, (b) we discuss the modifications required to kernel-based ML models to accommodate the decoupled representations and, (c) we assess the performance of MODA and other descriptors at predicting magnetic exchange couplings, JAB, as a representative example of an intermolecular property.
In this work, we implement decoupled versions of BoB and SOAP, and we show its advantages over the standard versions when intermolecular properties are targeted. Additionally, we prove that MODA outperforms the decoupled versions of BoB and SOAP in standard supervised regression methods and unsupervised classification models, such as Kernel Ridge Regression38 (KRR) and Agglomerative Clustering39 (AC). Overall, we will demonstrate that MODA is the best representation, among the descriptors here tested, to tackle the prediction of intermolecular JAB interactions, while still being suitable for intramolecular ones.
Methodology
Mathematical formalism
The computation of MODA starts from the atomic positions, which are the only required input (see Fig. 1, step 1). Subsequently, molecular orbitals, the core mathematical object to assemble the representation, are calculated, and expanded as a linear combination of atomic orbitals (see Fig. 1, step 2):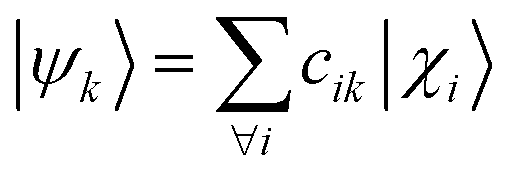 | (1) |
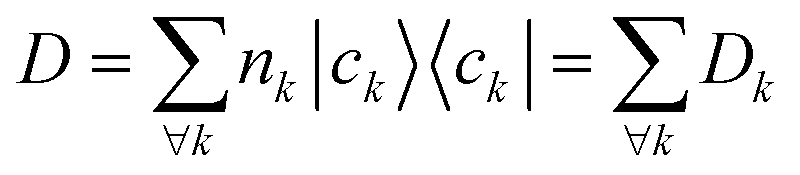 | (2) |
 is determined by the trace of the product of PAB and PBA blocks, which contain the rows and columns of P associated with the atomic orbitals centered at atoms A and B. Formally, the Mayer's bond order is defined as
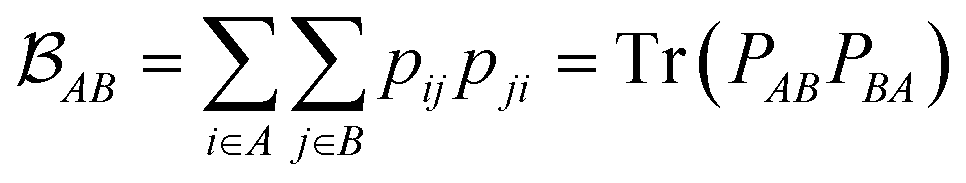 | (3) |
 each corresponding to the contribution of a specific molecular orbital, |ψk〉, to
 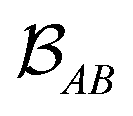 (see Fig. 1, steps 3 & 4).
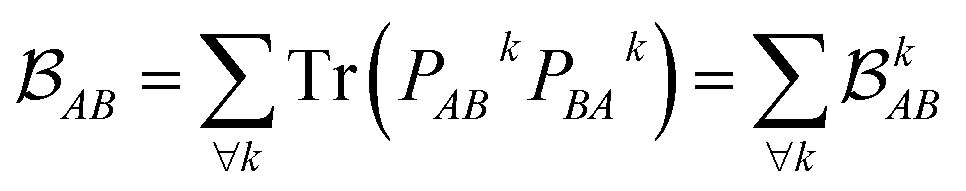 | (4) |
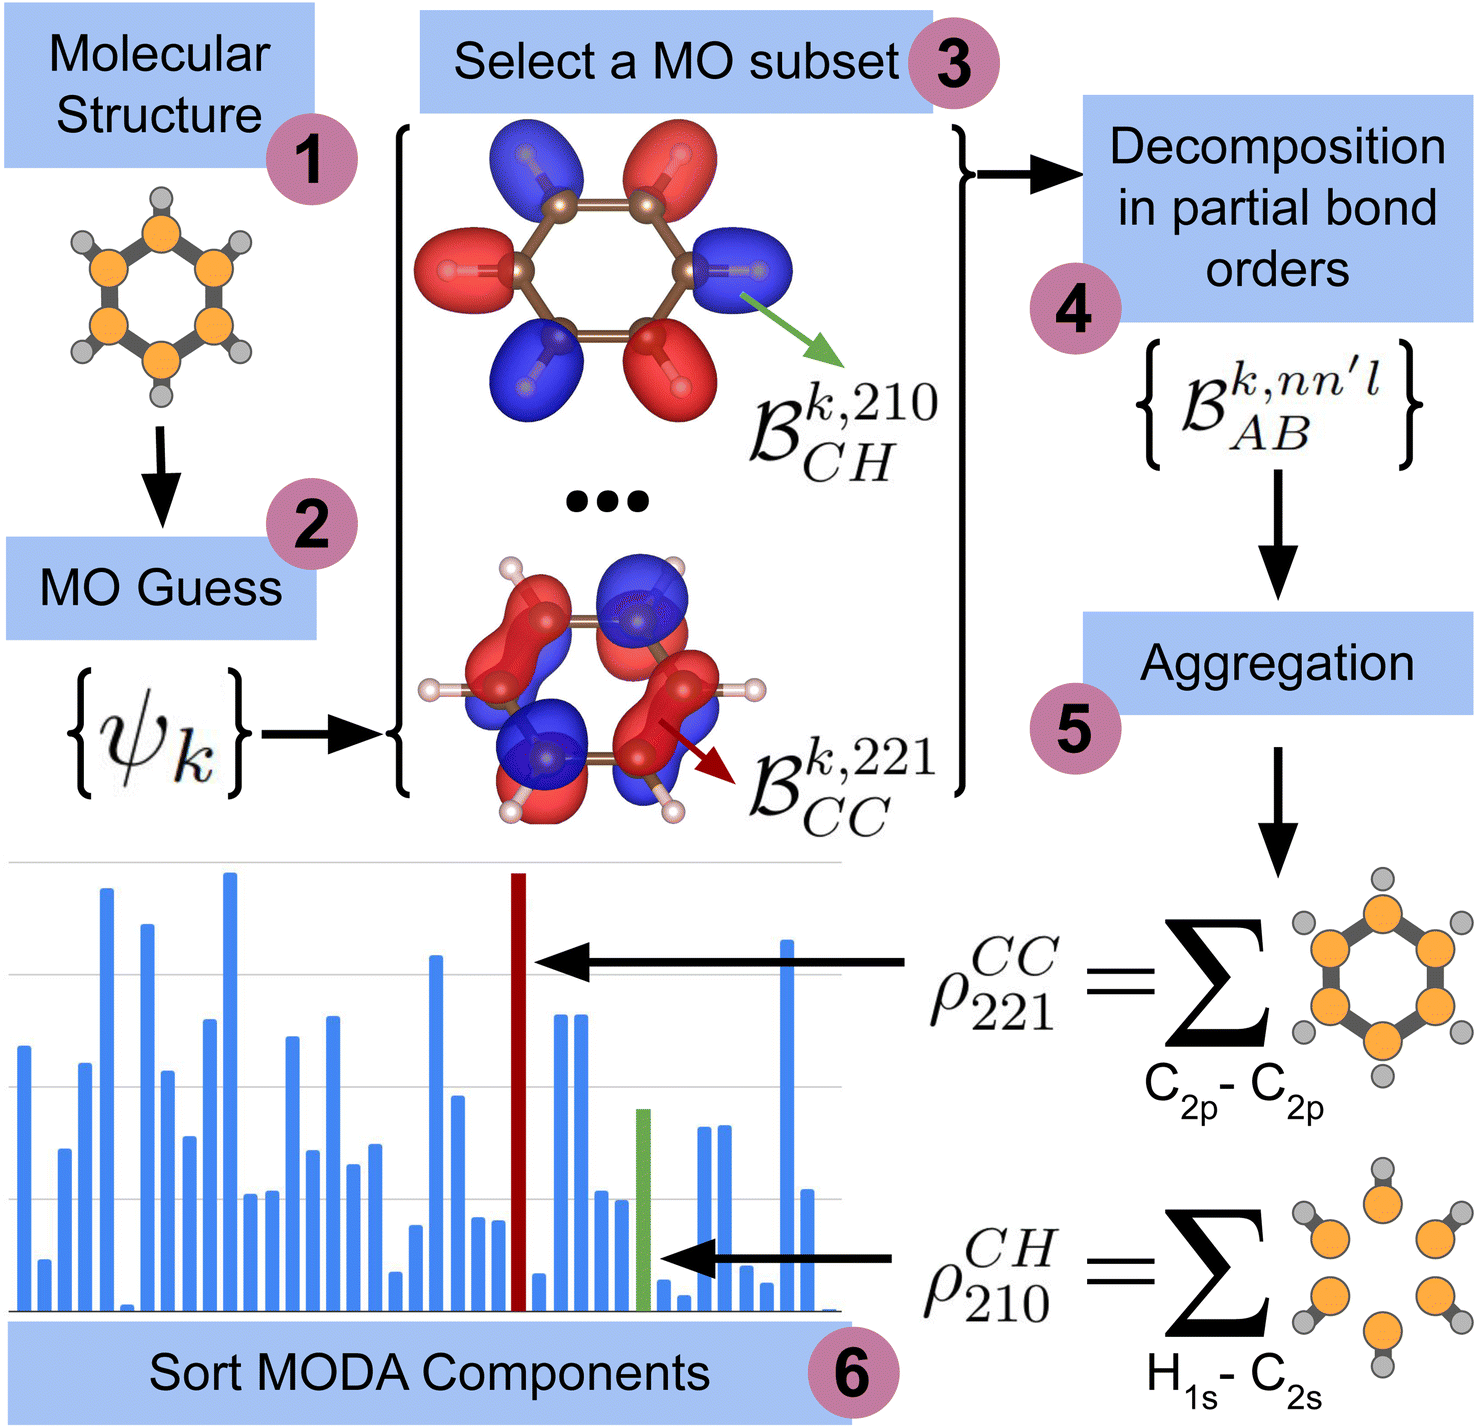 | ||
| Fig. 1 Scheme of the workflow to compute the features of MODA. The figure shows the process that produces MODA features from the molecular structure to the final representation. | ||
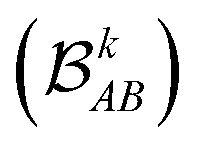
The contributions to the partial bond can be decomposed even further. Specifically, we can examine the contributions stemming from the different atomic orbitals of |ψk〉. To this end, we introduce an orbital-specific partial bond order contribution, here represented as 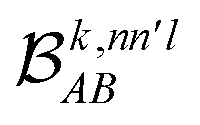 . In this notation n and n′ correspond to the principal quantum number of the basis functions of atoms A or B, while l corresponds to the azimuthal quantum number. Building upon that, the centerpiece strategy to generate MODA components consists of the aggregation of such orbital-specific partial bond orders in many-body batches to guarantee the translational, permutational and rotational invariance of the representation. Mathematically, MODA representation corresponds to the set
 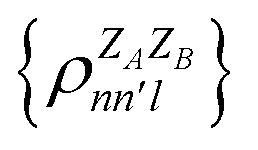 , where each element is defined as (see step 5 in Fig. 1):
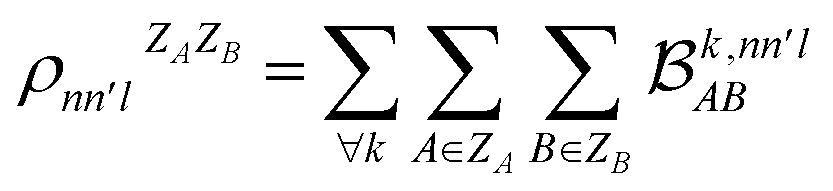 | (5) |
Intra-/intermolecular decoupling strategy in MODA
As MODA batches result from the aggregation of pairwise interactions, it can be adapted to decouple intra- and intermolecular interactions. This capability can be incorporated directly into our formalism through a minor modification of eqn (5). For instance, consider δAB as a parameter that takes a value of 1 when atoms A and B belong to the same molecule, and 0 otherwise. Accordingly, MODA components ascribed to intra- and intermolecular interactions (with super-index I and i, respectively) can be defined as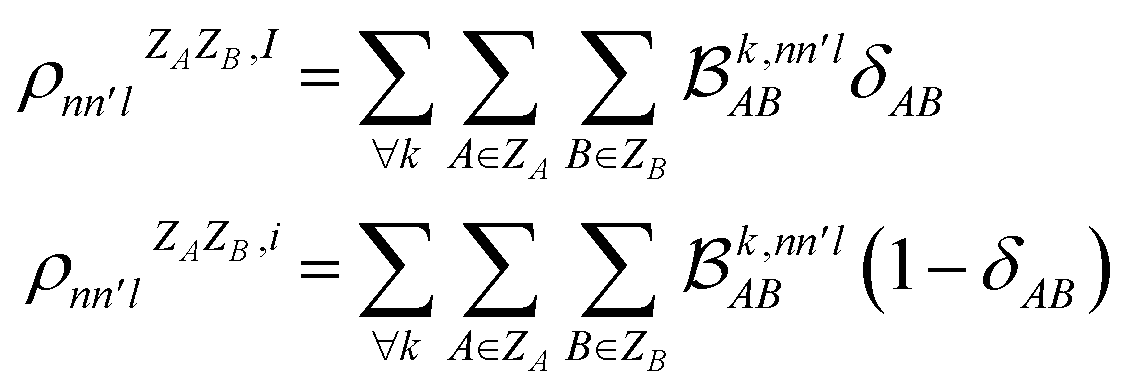 | (6) |
Although eqn (5) and (6) consider the contribution of all molecular orbitals (see the range of k in the outermost summation), we can tune MODA components to include only a  subset of orbitals, denoted as
  . This is beneficial to avoid the computation of bond orders between orbitals with negligible contributions (e.g., core orbitals), or when the property under examination arises primarily from a specific group of molecular orbitals. For instance, here we have selected the singly-occupied natural orbitals (SONOs) to interpret our property of interest, JAB. Accordingly, the described methodology can be applied to any set of orbitals, and allows the flexible selection of both the level of theory and the basis set, which should be considered as hyperparameters of the MODA representation.
In line with other works in this field,26 our implementation of MODA employs the SAD “guess”, which is a good compromise between computational efficiency and quality of the approximate electronic structure. Note that, resembling the impact of basis sets in quantum chemistry computations, larger basis sets lead to better MODA representations and, thus, better predictions (see Section 1 in the ESI†).
Multi-moiety decoupling
Many ML models, such as Kernel Ridge Regression (KRR) or Agglomerative Clustering (AC), utilize the kernel trick41,42 to map the features space into samples space, allowing to use non-linear metrics in practice. The radial basis function (RBF) is a common kernel of choice, which can be defined as| κ(ρ1, ρ2; γ) = e−γ‖ρ1−ρ2‖2 | (7) |
| ‖ρ1 − ρ2‖2 = ‖ρ1I − ρ2I‖2 + ‖ρi1 − ρi2‖2 | (8) |
Consequently, the RBF kernel can be expressed as the product of intra- and intermolecular kernels, where γ is replaced by two hyperparameters (γI, γi) that control the width of intra- and intermolecular components, respectively. The definition of the RBF kernel (eqn (7)) can then be combined with the former splitting (eqn (8)) as
 | (9) |
The use of separate hyperparameters for intra- and intermolecular components provides a more nuanced approach to model molecular interactions of multi-moiety systems, as the ML model can calibrate the effect of γI and γi separately. Moreover, the user can aid in the interpretation of the model's predictions by simply inspecting γI/(γI + γi). However, it is important to consider the trade-off between the added flexibility and the increased difficulty in training the model. As the number of hyperparameters increases, so does the effort required to properly fit the model to the data. Additionally, having a larger number of hyperparameters also increases the risk of overfitting, leading to poor generalization performance on unseen data. Therefore, it is crucial to balance the benefits of having more fine-tuned control of the interactions against the increased complexity and the risk of overfitting. We consider the former intra-/intermolecular splitting of the kernel as a reasonable balance between model complexity and interpretability. In addition, note that the here-derived formalism is not specific of the RBF kernel, instead, it can be adapted to a Laplacian kernel or cosine-similarity-based kernels, among other choices.
Finally, it is crucial to note that the formalism derived herein requires the detection of the intra- vs. intermolecular origin of the contributions. Consequently, the algorithm assigned to this task should be informed of the nature of the interaction occurring between each pair of atoms. Given that datasets customarily encompass hundreds or even thousands of data samples, it is crucial that this process is automated in practice to facilitate its efficient application. To meet this requirement, we have devised an algorithm anchored in spectral clustering elaborated in detail in the Section 2 in the ESI.†
Dataset
Next, we introduce all the datasets chosen to illustrate the performance of MODA, prior to present all results and discuss them. Three different datasets have been used in this study to investigate the connection between structural representation and JAB. All three focus on purely organic radicals, since they undergo massive variations in JAB as a result of subtle structural changes.43 The first two datasets are computationally tailored to explore changes along a specific internal coordinate of the system to reduce the structural complexity, providing a simple and chemically intuitive platform to expose the differences between CIR and QIR descriptors. The third dataset comprises a challenging and experimentally realized scenario that includes changes in all structural degrees of freedom in order to test the performance of the evaluated descriptors under more complex conditions.The first ad hoc dataset consists of 60 different conformations of phenalenyl (PHYL, see Fig. 2a) radical pairs, arranged at a fixed inter-planar distance of 3.50 Å and varying the twist in the stacked dimer, θ, from fully eclipsed to staggered configurations (θ = 0° and 60°, respectively). This dataset provides insight into the influence of relative orientation and molecular orbital symmetry on intermolecular JAB couplings.44 The second ad hoc dataset, containing 180 different conformations of Thiele's diradical45 (THIL, see Fig. 2b), spans the central phenyl ring's rotational angle from θ = 0° to 180° (see θ in Fig. 2b). Notice that the substantial bulkiness of the terminal phenyl groups induces an out-of-plane twist to alleviate steric hindrance. As a result, the symmetry of the molecule in the planar conformation diminishes from D2h to either D2 or C2h. Our dataset is based on the rotation of the central phenyl ring of the C2h conformer along the axis connecting the two –ĊPh2 moieties. Note that this rotation implies a sweeping range from θ = 0° to 180° without mirror symmetry at 90° (refer to Section 5 in the ESI† for a 3D representation of the THIL diradical). This dataset provides a valuable test case for analyzing variations of intramolecular JAB as a result of conformational changes.46,47
 | ||
| Fig. 2 (a) π-Stacked pair of phenalenyl radicals (PHYL), (b) Thiele's diradical (THIL) and (c) chemical representation overlapped with the SONO of TTTA. Red arrows indicate the rotational internal coordinate (θ) explored to obtain all geometries of PHYL and THIL. (d) π-Stack of TTTA radicals, with a dimer highlighted. (e) Time resolved evolution of JAB of two TTTA radicals forming a dimer along a time interval of 10 ps of AIMD simulation. Insets highlight two regions with extremely different JAB values: −4300 cm−1 (red) and +20 cm−1 (blue). | ||
The third dataset is made of dimers of 1,3,5-trithia-2,4,6-triazapentalenyl (TTTA see Fig. 2c). In the solid state, TTTA molecules experimentally arrange forming labile 1D π-stacks48 (see Fig. 2d). At low temperatures, these remain as alternated dimers but, at higher temperatures, a Pair-Exchange Dynamics (PED) process is triggered, in which the inter-planar distance between a given pair of TTTA molecules oscillates between ca. 3.25 Å and ca. 4.5 Å.49 Such subtle structural changes lead to massive time- and temperature-dependent variations in the JAB interaction between pairs of π-stacked TTTA units,50 ranging from weakly ferromagnetic (FM, ca. 50 cm−1) to strongly antiferromagnetic (AFM, ca. −5000 cm−1), as shown in Fig. 2e.
Following the approach of previous works for sample mining,7,30,32,51 we obtained TTTA dimers from ab initio molecular dynamics (AIMD) simulations of the high-temperature (HT) phase, carried out at two different temperature conditions, 300 K (HT-300K) and 250 K (HT-250K), in order to explore different regions of the thermally available configurational space. Each AIMD simulation had an independent 10 ps run, yielding a variety of structures. The data from the HT-300K phase, detailed in a previous publication49 by some of the present authors, included 30![[thin space (1/6-em)]](https://www.rsc.org/images/entities/char_2009.gif) 000 configurations selected from 3 different dimers of the crystal structure (10000 of each one). These configurations have been used to train and test the ML models, offering a diverse training set that encapsulates a wide range of structural variations. Conversely, the HT-250K phase data is a new addition, generated specifically for this study. We extracted 20000 structures from this phase, following the same selection strategy. The HT-250K structures have served as a separate dataset for evaluating the extrapolation capabilities of the models, ensuring that our ML models can make accurate predictions on unseen data spanning different regions of the configurational space. A detailed analysis of the TTTA dataset can be found in Section 3 of the ESI.†
000 configurations selected from 3 different dimers of the crystal structure (10000 of each one). These configurations have been used to train and test the ML models, offering a diverse training set that encapsulates a wide range of structural variations. Conversely, the HT-250K phase data is a new addition, generated specifically for this study. We extracted 20000 structures from this phase, following the same selection strategy. The HT-250K structures have served as a separate dataset for evaluating the extrapolation capabilities of the models, ensuring that our ML models can make accurate predictions on unseen data spanning different regions of the configurational space. A detailed analysis of the TTTA dataset can be found in Section 3 of the ESI.†
Results and discussion
The discussion of the results is organized into five subsections. In the first part, we evaluate the capabilities of CIR and QIR descriptors in unsupervised learning tasks involving JAB predictions by means of Agglomerative Clustering (AC). The second section demonstrates the benefits of separating intra- from intermolecular degrees of freedom in descriptors when predicting intermolecular JAB values for both CIR and QIR-type representations. In the third section, we highlight the key qualitative differences between CIR and QIR-type descriptors using the TTTA dataset. Complementing the former, the fourth section validates quantitatively the observations discussed in the previous section using variance–covariance and mutual information analyses. Lastly, in the fifth section, we provide additional evidence supporting MODA's superior performance in TTTA dataset by presenting our findings from KRR predictions. Throughout the discussion, we compare structure-average SOAP and MODA as the main representative examples of CIR and QIR-class descriptors, respectively, that enables the decoupling of intra- and intermolecular components (see similar analyses for BoB in Sections 4 and 6 of the ESI†). As mentioned in previous sections, MODA describes a specific subset of molecular orbitals. In this case, the MODA representation of the systems under study is constructed using their respective SONOs, since these MOs play a crucial role in determining the JAB values52 (see more information in Section 5 of the ESI†).CIR vs. QIR performance on ad hoc datasets
PHYL and THIL datasets focus on an intermolecular JAB with fixed intra-molecular components, and a fully intramolecular JAB, respectively. As introduced in the dataset section, both datasets have been specially designed to simplify the structural variability to a single internal coordinate (a rotational angle, θ). DFT calculations have been performed along this coordinate to retrieve θ vs. JAB curves, and the clusters resulting from the AC model are projected onto these curves (see Fig. 3 for PHYL and Section 4 of the ESI† for THIL). | ||
| Fig. 3 J AB profile of PHYL conformers from eclipsed (θ = 0°) to staggered (θ = 60°) geometries. The color code indicates the clustering produced by (a) SOAP and (b) MODA descriptors. The insets of (a) indicate the evolution of the point group symmetry at specific values of θ associated with the geometry of the dimer. Analogously, the insets in (b) indicate the point group symmetry associated with the SONOs. The bottom part of the figure illustrates the SONOs at θ = 0° and θ = 60°, in which the highlighted hydrogen shows that the structure is different, while the SONO remains unaltered. | ||
The JAB curve of PHYL spans a wide range of values from strongly AFM couplings in eclipsed and staggered conformations (with D3h and D3d point group symmetries, respectively) to slightly FM couplings at θ = 30° (S6 point group), and displays symmetry around θ = 30° (see Fig. 3a). The mirror-symmetric profile of JAB around θ = 30° (see Fig. 3a) is at odds with the point group symmetry associated to the PHYL's conformers along θ (D3h → S6 → D3d). The reason for such discrepancy can be grasped by the electronic structure of the SONOs of the PHYL dimer. Both SONOs at the eclipsed and staggered conformations belong to D3h point group, while the θ = 30° conformer belongs to the D3d point group in this case (see SONOs in Fig. 3b). Thus, the SONOs of the PHYL conformers from θ = 0° to 30° (D3h → D3d) are mirror-symmetric to the conformers from θ = 30° to 60° (D3d → D3h), just as the JAB curve along θ. That is, the relevant symmetry to interpret the JAB evolution is not the symmetry associated to the geometry, but the one emerging from the electronic structure.53 Consistent with this observation, the clustering patterns of SOAP (which is exclusively based on structural information) fail to capture the symmetry around θ = 30°, and instead follow the clustering pattern arising from structural symmetries (Fig. 3a). In contrast, MODA, being a QIR descriptor, produces a mirror-symmetric clustering pattern around θ = 30°, in agreement with the molecular orbital symmetry associated to JAB (Fig. 3b).
It is worth noting that the use of structure-average SOAP vectors might not fully leverage the potential of the descriptor. This is particularly relevant given that the performance of clustering techniques can be significantly impacted by minor distortions in the distance between samples. To substantiate our comparison between SOAP and MODA further, we expanded our investigation to include the use of a more general local SOAP representation, employing the Regularized Entropy Match54 (REMatch) together with RBF kernel to evaluate AC performance from the local SOAP representation. This exploration consistently validated our initial observations regarding the structure-average version of the descriptor, as detailed in Section 4.2 of the ESI.†
To further extend the analysis of the capabilities of SOAP and MODA, we assessed their performance using the THIL dataset, which features a molecular diradical instead of a pair of radicals. Here, JAB is geometrically controlled by the through-bond conjugation of both –ĊPh2 groups to the central phenyl group guided by the angle: JAB is largely AFM when the central phenyl group remains in-plane (θ = 0° and θ = 180°), and it drops to zero as the phenyl moiety approaches an orthogonal conformation (θ = 90°). Upon examining the electronic structure of THIL no special symmetry arising from the SONOs can be anticipated and, thus, the atomic disposition and electronic structure of the SONOs are bijectively related (see section 5.3 in the ESI†), which suggests that CIR descriptors can well describe JAB in the THIL dataset. Agglomerative clustering results further confirm this observation, showing small variation among SOAP and MODA descriptors with no significant impact on the AC performance (elaborated in detail in Section 4 of the ESI†). This scenario arises when the system, like THIL, is well-characterized by geometry, rendering CIR and QIR-based descriptors, such as MODA, comparably efficient.
Consequently, our analyses underline MODA's superior performance over CIR methods like SOAP and BoB (as further discussed in Section 4 of the ESI†) in scenarios that present challenges to geometry-based descriptors, as evidenced in the PHYL results. This enhanced performance is due to the QIR's inclusion of wave-function information, capturing crucial, otherwise overlooked, electronic structure elements. Nonetheless, in scenarios where the system is properly defined by geometric descriptors, such as in the THIL dataset, both CIR and QIR-based descriptors can achieve similarly proficient results.
Decoupling intra- and intermolecular features in SOAP
In the previous subsection, we focused on cases with controlled ad hoc structural changes, in order to illustrate some fundamental differences between CIR and QIR-type descriptors. However, a more appealing challenge for a ML model is the prediction of intermolecular properties in conditions where the intramolecular degrees of freedom of each moiety are not artificially constrained. To address this scenario, we turn our attention to the TTTA dimers dataset, where the samples originate from AIMD simulations and, thus, the motion of atoms is uncontrolled and conditioned by thermal fluctuations. As demonstrated below, this is the perfect platform to evaluate the importance of decoupling the components of descriptors. Our analysis initially focuses on structure-average SOAP, as a formerly validated choice in PHYL by Agglomerative Clustering experiments, and then extends to MODA.The advantages of decoupling intra- and intermolecular interactions become clear when comparing the target JAB with the intra- and intermolecular components of SOAP separately (see Fig. 4). Intramolecular features span a larger range of values, showing the tendency of CIR descriptors to emphasize short-range interactions, but these features show no correlation whatsoever with JAB (see Fig. 4a and b). Thus, even if some degree of correlation exists between intermolecular components and JAB (see Fig. 4b and c), the strong and noisy intramolecular components can make the standard (i.e., not decoupled) SOAP struggle when capturing the evolution of JAB values. Fine ML predictions are still possible, since the intramolecular components might still be correlated with intermolecular ones to some extent (e.g., the variation of the bond lengths when forming a dimer) and hence to JAB. However, such predictive models will primarily memorize data rather than generalize the trends governing the descriptor-to-target mapping, resulting in overfitted ML models that struggle to interpolate and extrapolate beyond the available data. Analogously, the result obtained for SOAP regarding the decoupling of intra/inter features is consistent with the observations for BoB and MODA (see Section 6 of the ESI†).
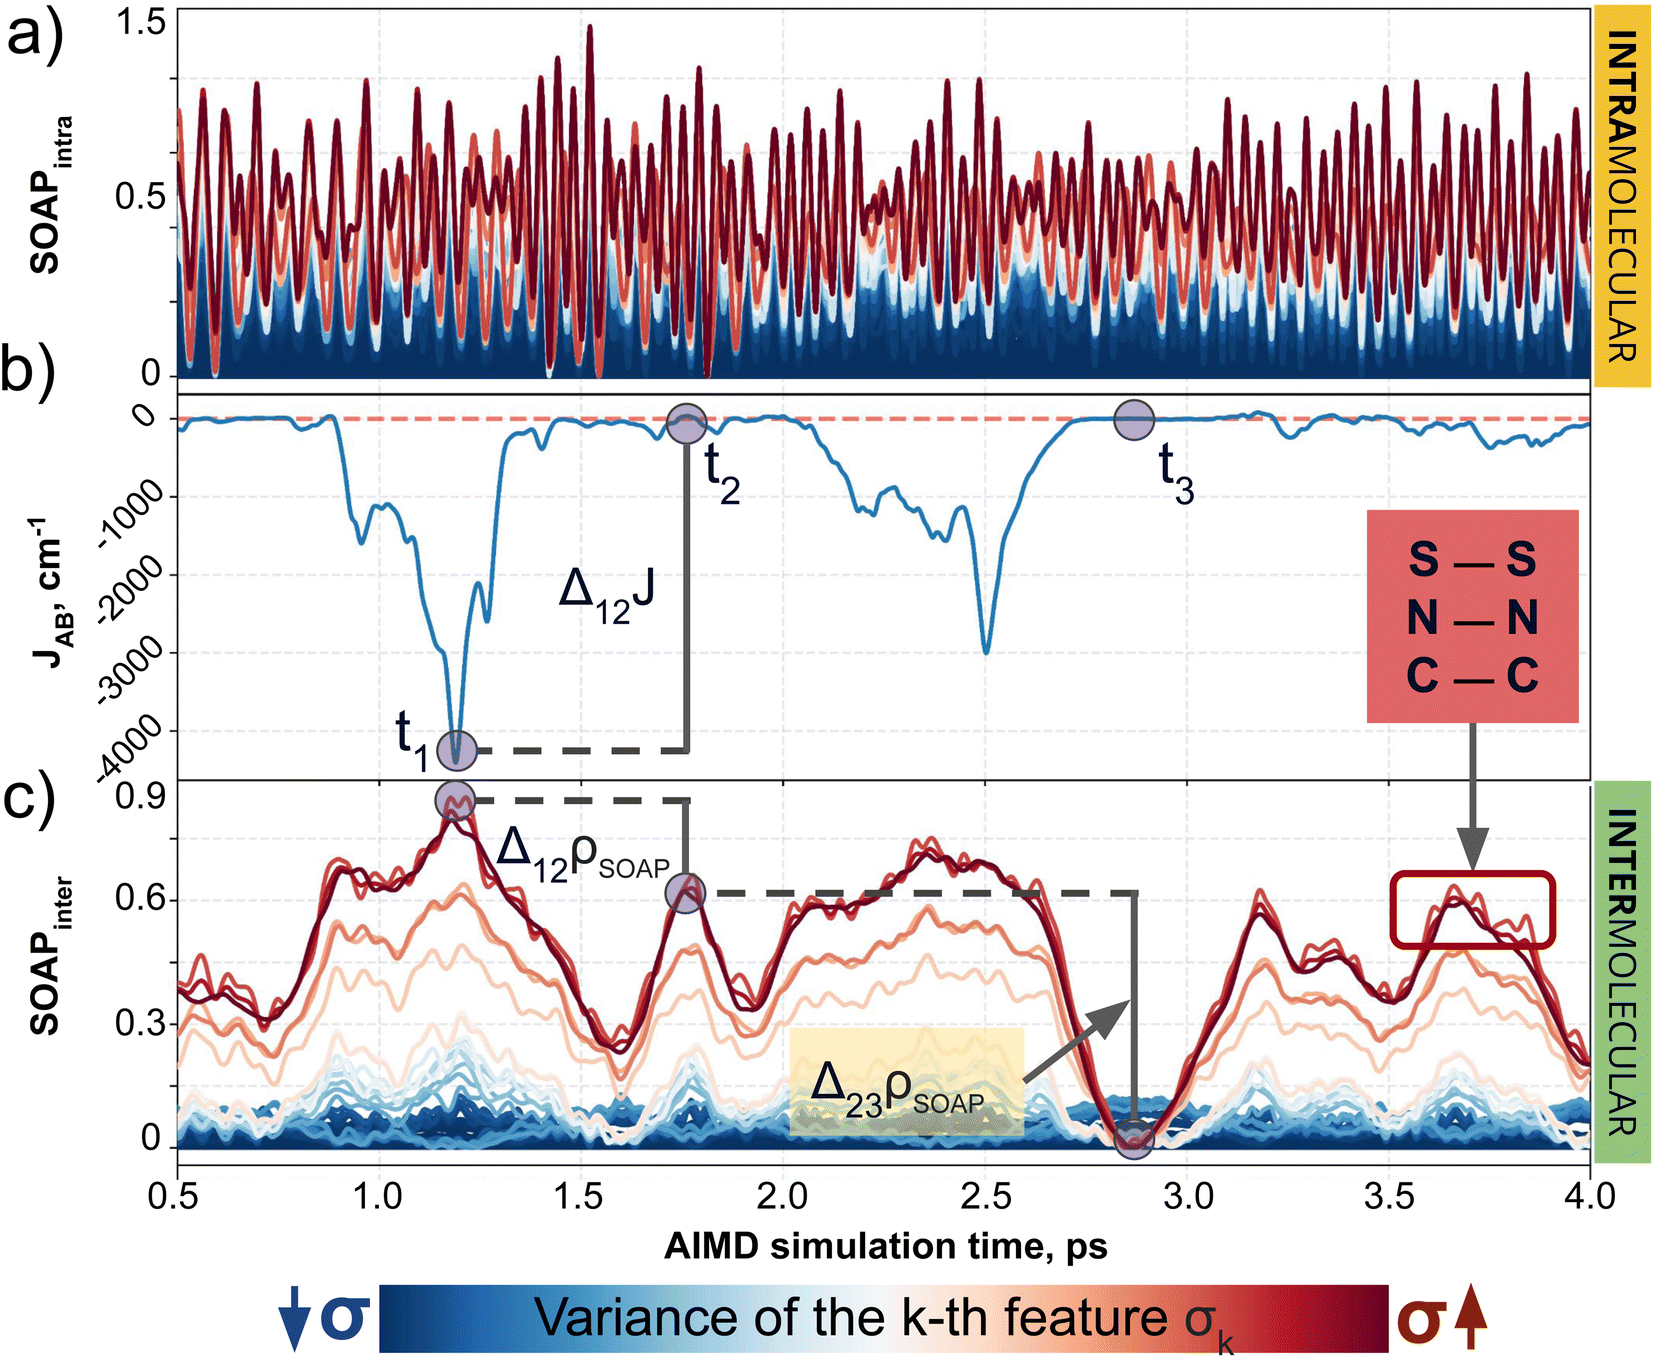 | ||
| Fig. 4 Evolution of (a) intra- and (c) intermolecular SOAP features (colored by variance value) of a TTTA dimer along the structures explored during the 0.5–4.0 ps time interval of AIMD, as well as (b) the associated time-resolved evolution of JAB in this interval. The blue circles in (b) and (c) indicate three regions with specific values of JAB, where one can compare the change associated with JAB and SOAP. | ||
Performance of MODA and SOAP in the TTTA dataset
Having established (i) the importance of having a QIR descriptor for the prediction of JAB values, and (ii) the advantages of the decoupling strategy, we will now discuss the role of both elements in the case of the TTTA dataset. The SONOs of TTTA have dominant S and N contributions, and negligible contribution from its C atoms (Fig. 2c). Accordingly, MODA components related to C–C interactions are negligible in comparison to the components associated with S–S or N–N interactions (see Fig. 5a). Contrarily, SOAP overemphasizes C–C interactions, thereby rendering them comparable to N–N and S–S components across most of the examined range of Fig. 4. These are the three interaction types that exhibit the highest variance, and whose curves jointly vary along the AIMD simulation time (see highlighted red-most curves in Fig. 4c).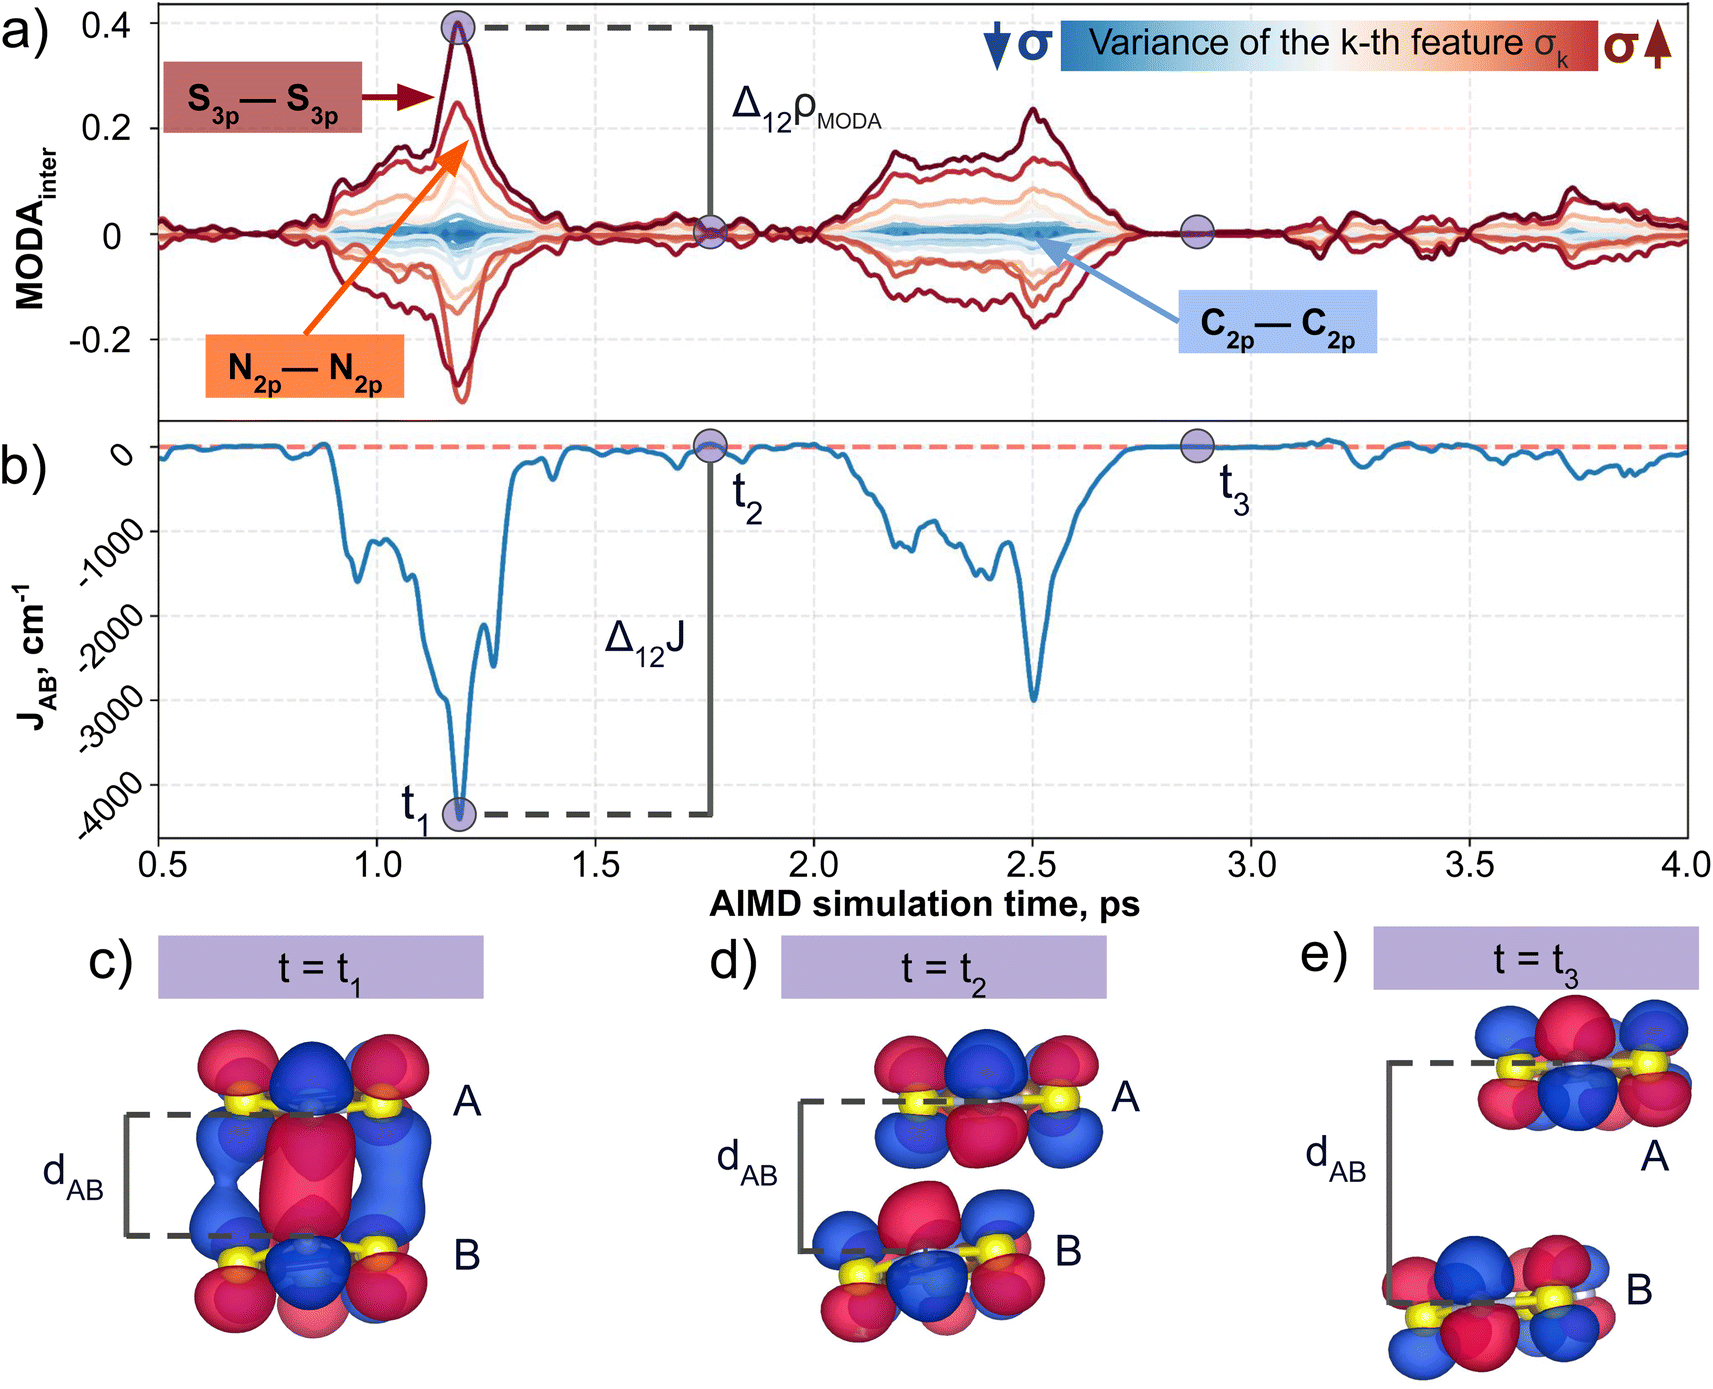 | ||
| Fig. 5 Evolution of (a) intermolecular MODA features (colored by variance value) of a TTTA dimer along the structures explored during the 0.5–4.0 ps time interval of AIMD, as well as (b) the associated time-resolved evolution of JAB in this interval. The blue circles in (a) and (b) allow for comparison between variations in JAB and variations in the features of MODA. TTTA dimer's SONOs at three representative time steps: (c) t = t1, (d) t = t2, and (e) t = t3. | ||
Moreover, MODA's features exhibit a stronger correlation with JAB compared to the intermolecular SOAP components discussed above. This correlation becomes apparent when examining the descriptor response (Δρ) to changes in JAB over the AIMD simulation time (t). For instance, when TTTA dimers undergo abrupt structural changes that shift their associated JAB from paramagnetic to strongly AFM regimes (large Δ12J, t1vs. t2 in Fig. 5b), MODA accurately captures these changes (large Δ12ρMODA, Fig. 5a). Conversely, SOAP fails to accurately represent these variations (small Δ12ρSOAP, Fig. 4c), causing completely opposite structures to appear incorrectly similar. In the same vein, JAB values at t = t2 and t = t3 are almost identical in both cases. In this situation, MODA assigns a similar response to both representations, while SOAP indicates an abrupt change (Δ23ρSOAP), even larger than the change associated with the extremely contrasting regimes at t = t1 and t = t2. The primary explanation for this discrepancy is illustrated in Fig. 5d and e, which displays the structure and SONOs of the TTTA dimer at t = t2 and t = t3, see dAB in the figure. Accordingly, the TTTA moieties at t = t2 are notably closer than at t = t3. Nevertheless, the overlap between the SONOs is nearly zero in both cases (compare to the shared isosurface between TTTA SONOs of t = t1 in Fig. 5c), resulting in a similar JAB. This situation is particularly challenging for SOAP, which fails to capture these subtleties due to its lack of electronic structure information. As a result, MODA's ability to capture electronic structure information translates into a higher correlation with JAB than that exhibited by SOAP in this specially critical ill-defined situation for CIR descriptors.
Mutual information and covariance analyses
Our qualitative comparison between descriptors can be complemented using the point-wise Global Feature Reconstruction Error, GFRE(t)(F,F′). This method involves reconstructing the features of a given descriptor (F′) using another one (F), in order to assess the presence/absence of mutual information.55 In this case we have assessed how intermolecular components of SOAP can reconstruct MODA, and vice versa. For completeness, we have used two flavors of MODA: the one we have used along this section, using only the SONOs (MODASONOs), and a complete one in which all the occupied MOs are considered (referred to as MODAocc.). The large value around t = t3 in both GFRE(t) spectra indicates that neither descriptor can reproduce the other, meaning that MODASONOs and SOAP carry substantially different information in their representation (see Fig. 6a). This is expected, since SOAP contains structural information, while MODASONOs contains electronic structure information specially devoted to capture JAB changes. Besides t = t3, we can observe that MODASONOs frequently struggles to reconstruct SOAP, while the opposite rarely happens (see Fig. 6a). The overall perspective can be quantified using the global GFRE(F,F′)(see Fig. 6b), resulting in a reconstruction error that is larger when going from MODASONOs to SOAP (0.531) than the other way around (0.029) (see light blue frames in Fig. 6b). Interestingly, when using MODAocc., mutual reconstruction error with SOAP is similar and low. This suggests that MODA, in its different flavors dictated by the choice of molecular orbitals, can range from being a specialized (e.g., MODASONOs) to a general (e.g., MODAocc.) descriptor. On a lesser note, the reconstruction error associated with BoB, irrespective of during reconstruction or being reconstructed, is substantially higher compared to the rest of the cases (see red-framed values in Fig. 6b). However, the descriptor accomplishing this task more successfully is SOAP, emphasizing the shared CIR origin of both representations.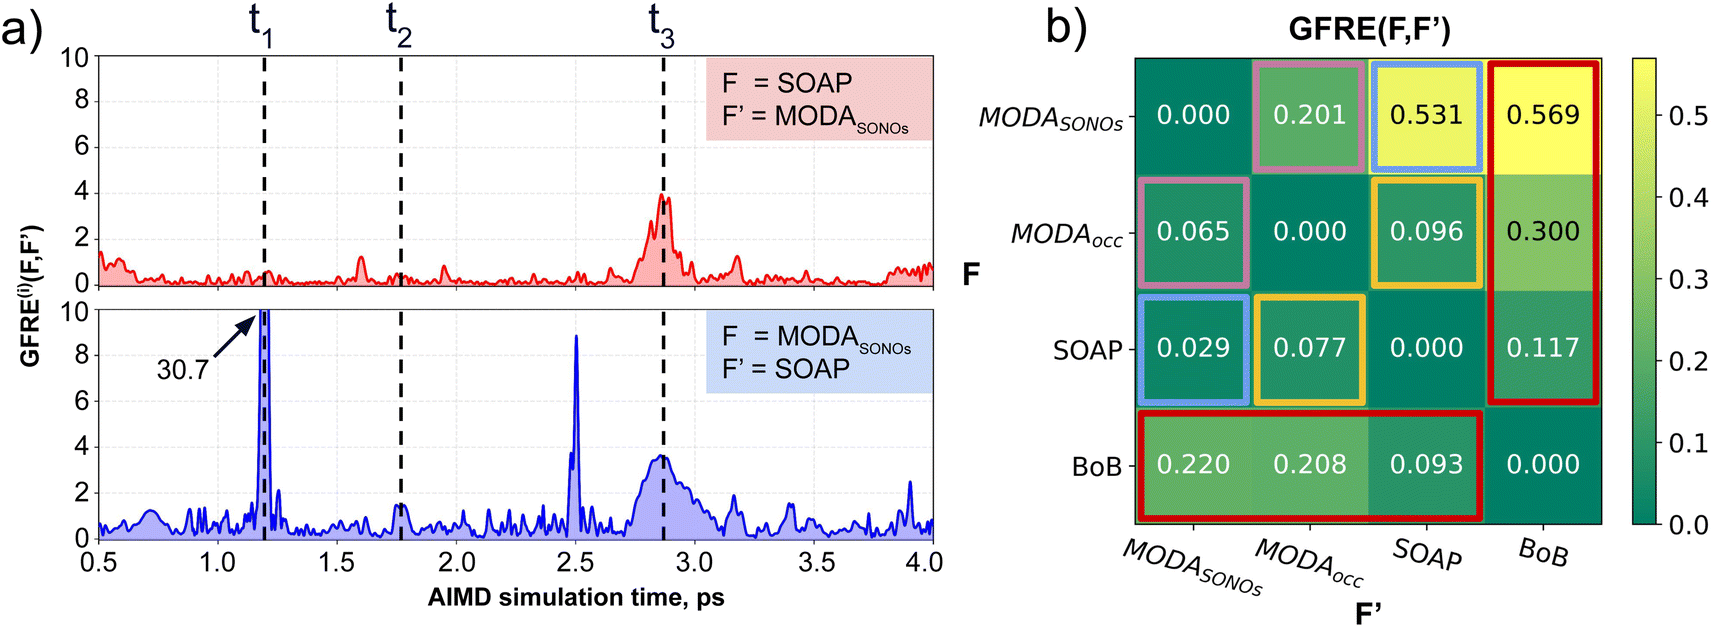 | ||
| Fig. 6 (a) Point-wise Global Feature Reconstruction Error GFRE(t)(F,F′) during the 0.5–4 ps time interval of AIMD. The upper panel (red curve) shows the error spectrum associated to the reconstruction of MODASONOs (F′) using SOAP (F), while the lower panel (blue curve) corresponds to the reconstruction of SOAP features (F′) using MODASONOs (F). Dashed black lines indicate three different time regions discussed in the main text. The matrix in (b) indicates the Global Feature Reconstruction Error GFRE(F,F′) using the descriptors in each row (F) to reconstruct the descriptor indicated in each column label (F′). Some matrix elements are highlighted to facilitate the discussion in the text (using color frames). | ||
To further support our conclusions, we have performed a variance–covariance analysis of the intermolecular features of BoB, SOAP and MODA (refer to Fig. 7). For MODA, the features bearing a larger variance (that is, those exerting the greatest influence on the overall molecular descriptor, see Section 8 in ESI† for an elaborate discussion) simultaneously possess the highest covariance with JAB (Fig. 7a). In essence, the components with the highest variance are also those exhibiting the strongest linear correlation with JAB. This finding stands in stark contrast to the results obtained for SOAP and BoB (Fig. 7b and c). For instance, in SOAP, the component with the largest impact (σ1 in Fig. 7b) demonstrates a covariance with JAB that is comparable to the 6th most influential feature (σ6 in Fig. 7a) of the MODA descriptor. In addition, the covariance of the 20 top most determining features of SOAP and BoB (338.2 and 162.1, respectively) are smaller than in MODA (598.2). However, we acknowledge that the variance–covariance analysis assumes linear relationships, while the features may generally exhibit non-linear connections with target properties. Indeed, while linear relationships are favored for their simplicity and stronger generalization capabilities that illustrates significant differences of the performance of each descriptor in the TTTA dataset, we are aware that variance–covariance analysis can over-simplify the data complexity. To account for non-linearity, we have performed a Kernel Ridge Regression (KRR), further enhancing our understanding of descriptor behavior.
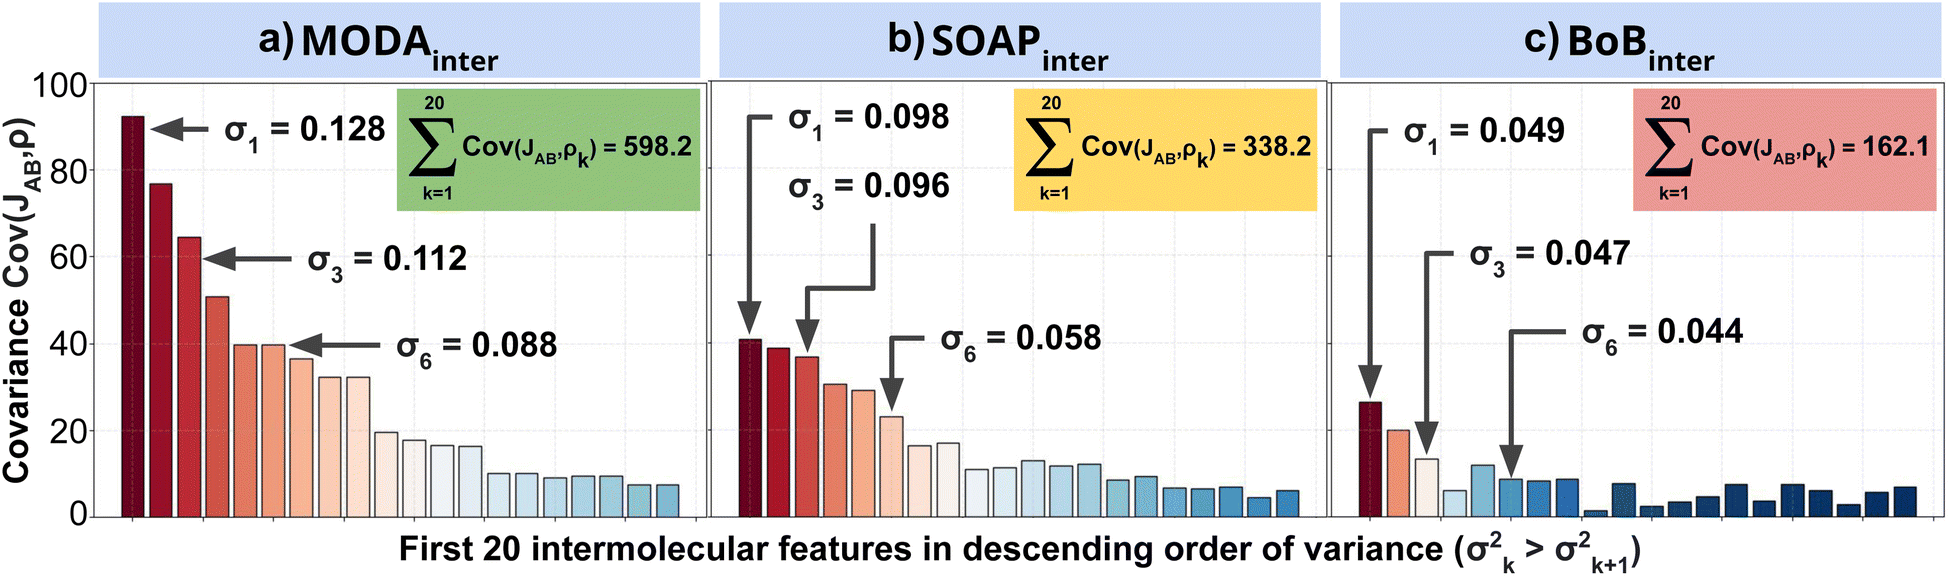 | ||
| Fig. 7 Variance–covariance plots for intermolecular components of (a) MODA, (b) SOAP and (c) BoB with JAB. The x-axis on each plot (and the color of each bar) corresponds to the variance of the 20 intermolecular features with highest variance, while the y-axis corresponds to the covariance of the component with JAB. Insets show the cumulative covariance of all the plotted features. | ||
KRR predictions
In order to assess the effect of non-linear relations between data representation and JAB, we have employed KRR together with RBF kernel. The learning curves produced by the evaluation of optimal KRR models are presented in Fig. 8, where SOAP, BoB and MODA descriptors have been used. Within the cross-validation leave-p-groups out scheme (see Section 7 of ESI† for more details), we have used different fractions of the HT-300K data for training, testing, and searching the optimal hyperparameters for γI, γi, and α (the regularization parameter of KRR method), while the model performance is evaluated with data samples from the HT-250K AIMD trajectory (validation set). As discussed in the dataset section, the HT-250K trajectory mostly explores the same potential energy surface region compared to HT-300K, but it also includes unseen regions due to the different thermally-available configurational space (see Section 3.1 of the ESI†), which enables to assess the ability of the model in both interpolation and extrapolation tasks.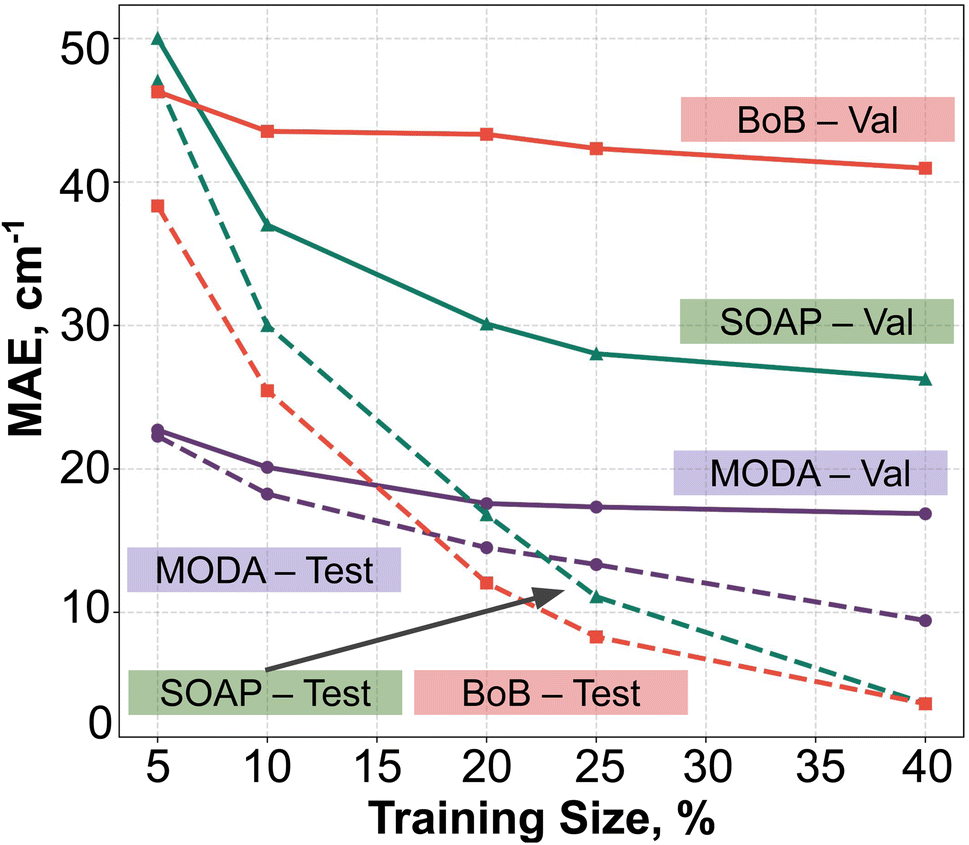 | ||
| Fig. 8 KRR learning curves using BoB (red), SOAP (green) or MODA (purple), using the leave p-groups-out strategy. Solid and dashed lines indicates the data source: HT-300K (test) and HT-250K (validation), respectively. | ||
For all the descriptors, the test curves (dashed lines in Fig. 8) still exhibit a reduction in MAE beyond a training size of 40%. However, the validation curves (solid lines) reach a saturation plateau at 25% regardless of the descriptor in use. This indicates that each model achieves an adequate training size at 25%, and increasing the data size beyond this point only results in KRR models with similar extrapolation and interpolation capabilities. Concerning the accuracy of the different descriptors, KRR models based on BoB and SOAP display MAEs around 40 cm−1 and 28 cm−1, respectively. In contrast, the KRR model utilizing MODA representation outperforms both SOAP and BoB, registering a substantially lower MAE under 20 cm−1. While the test curve for BoB and SOAP (dashed red and dashed green lines in Fig. 8) reaches the lowest MAE, their respective validation curves (solid red and sold green lines) register substantially higher MAEs in both cases. In contrast, test and validation curves employing MODA (dashed and solid purple lines in Fig. 8, respectively) show a joint evolution along the entire range, which indicates that KRR model trained upon MODA does not present as much overfitting as in BoB and SOAP. These differences reinforce the superior performance of MODA in predicting JAB values in the TTTA dataset, making it a better choice for capturing the underlying relationships in the data and generating more accurate predictions of JAB at a reasonable computational cost (see Section 8 in the ESI†).
Finally, it is pertinent to place the improvement demonstrated in MODA in a proper context. While the overall range of JAB extends approximately from −4000 cm−1 to +100 cm−1, a detailed examination reveals that the data points predominantly cluster around 0 cm−1 (as detailed in Fig. 3 of the ESI†). The distribution is significantly skewed, with the mean JAB value around 300 cm−1, and a median, which is a more appropriate measure of central tendency for this skewed distribution, approximately at 200 cm−1.
From this standpoint, the MAE of 20 cm−1 recorded for MODA corresponds to a 10% error margin with respect to the median, a substantial enhancement compared to the 15% and 21% errors represented by MAEs of 30 cm−1 and 42 cm−1 for SOAP and BoB, respectively. This improvement is particularly impactful in practical applications. For instance, in molecular magnetism applications, the accurate JAB predictions are crucial, as they serve as intermediate steps in calculating thermodynamic properties like magnetic susceptibility. It is well-established that the prediction of such macroscopic observables from first-principles JAB calculations is highly sensitive to even small variations in JAB, especially in regions nearing 0 cm−1.56 Therefore, the enhanced precision of JAB prediction offered by MODA is often of critical importance.
Conclusions
We report the development, implementation and validation of the Molecular Orbital Decomposition and Aggregation (MODA) approach, a novel QIR-class descriptor that encodes the electronic structure of molecules. MODA uses the density matrix of a subset of molecular orbitals to euclidate the contributions of atom pairs as bond orders, and groups these interactions by atom types and classes of atomic orbitals, leading to an invariant representation for molecules. MODA is designed to work in multi-moiety regularization schemes, where the kernel is split into intra- and intermolecular components. We demonstrate that this particular setup results in a better performance in unsupervised and supervised learning tasks targeting intermolecular interactions.Our study offers a detailed analysis comparing the performance of MODA to some separable CIR descriptors. The examination of pairwise sample–sample maps, along with the application of unsupervised Agglomerative Clustering on ad hoc PHYL and THIL datasets, emphasize the importance of capturing the key electronic structure information for an accurate representation of properties rooted in quantum mechanics. Notably, our results show that MODA effectively captures the molecular orbital symmetry, which is crucial for the classification of JAB values, as opposed to other CIR-type representations. The performance of MODA has been further assessed with TTTA dataset, which reinforces the importance of this separation in both CIR and QIR-based representations. Particularly, the variance–covariance analysis and KRR predictions provide additional evidence of MODA's superior performance in capturing relationships with JAB compared to other separable CIR representations.
Overall, MODA, as the first separable QIR-type descriptor, shows potential in enhancing the prediction of molecular properties rooted in quantum chemistry. Based on the specific evaluations presented in this study for JAB values, we believe that MODA will be also applicable to other properties such as HOMO energies or transfer integral predictions.
Computational details
Data mining and JAB evaluation
The AIMD simulation of the HT phase of TTTA at 250 K and 300 K used the same computational protocol employed in earlier works describing this molecule,49,50 and other organic radicals.57,58 A monoclinic supercell was prepared containing 32 TTTA molecules arranged in 8 stacks of radicals, each of them containing 4 radicals. The AIMD simulation was run for ca. 10 ps and a time step of 4 a.u. Vanderbilt ultrasoft pseudopotentials59 were employed, together with the PBE functional60 within the spin unrestricted formalism and the Grimme D2 correction,61 and a Γ-point sampling of the Brillouin zone. The Car–Parrinello62 propagation scheme was employed as implemented in CPMD,63 using a fictitious mass for the orbitals of 400 a.u. The simulations were performed in the canonical (or NVT) ensemble using Nosé–Hoover chain thermostats.64 All JAB values were evaluated as the difference between the energy of the Broken Symmetry65 (EBS) and Triplet (ET) electronic states assuming the Heisenberg hamiltonian, Ĥ = −2JABŜAŜB.66EBS and ET were computed at the UB3LYP67–69/6-31+G*70,71 level as implemented in Gaussian09.72 We have employed the two-sample Kolmogorov–Smirnov test73 (as implemented in the scipy module in Python) on the statistical distributions of both the centroid–centroid distances between TTTA units, and the JAB values associated with structures extracted from the HT-300K and HT-250 K trajectories, to guarantee that the configurational space sampled at 300 K and 250 K is different (see more details in Section 3.1 of the ESI†). Moreover, PHYL and THIL conformations have been obtained via a rigid rotational scan of the angle θ, as described in the dataset section, after a geometry relaxation in the triplet state. We have then calculated JAB values of every configuration following the same level of theory described above for TTTA, and without imposing structural or orbital symmetry (“NoSymm” keyword).Descriptors and molecular representations
The decoupled version of BoB, SOAP and MODA descriptors has been obtained through our code implemented in Python and collected in the MLcool module (https://github.com/GEM2-UB/MODA). The decoupling scheme applied to BoB (refer to Section 2.1 in the ESI†) is similar to MODA, as both are built from 2-body interactions. However, SOAP, as implemented in many packages, is a 3-body descriptor,74 and necessitates a different approach. Therefore, we adopted the approach proposed by Cersonsky et al. for SOAP decoupling,75 detailed in Section 2.2 in the ESI.† In particular, BoB has been implemented from scratch, while we use the DScribe76 module for local and structure-average versions of SOAP are used in the backend. The version of MODA employed in the manuscript computes the natural orbitals (NOs) and occupation numbers by means of the following two steps: (1) the density matrix is obtained by means of the SAD guess (with guess = “atom”) as implemented in pySCF.77 (2) A Lowdin's symmetric diagonalization78 is performed to solve the generalized eigenvalues equation79 (DSC = Cn, see details in Section 5.1 of the ESI†). It is important to note that all the molecules considered in this work are radicals, thus, the SAD guess has been computed in the open-shell spin state. Specifically, for THIL, we have computed the density matrix in the triplet state. In contrast, for PHYL and TTTA (both being pairs of radicals), the density matrix was computed for each monomer separately and subsequently, the dimer electronic structure was approximated as a sum of doublets (see more details is section 5.1.1 of the ESI†). SOAP partial power spectrum vector has been calculated on the atomic positions both locally (average = “off” in DScribe) and in its structure-average version (average = “outer”). We used a Gaussian-type orbital radical decay function and set the nmax, lmax and rcut hyperparameters to 6, 4, and 7, respectively. Moreover, σ has been varied to specific values (0.1, 1, 2, 3 and 10), with no extra radial scaling weighting of the atomic density to let intermolecular components dominate the SOAP spectrum. MODA representations have been computed using different basis sets (STO-6G, 6-31G, 6-31G*, 6-31+G* and aug-cc-pvdz). We found a significant effect of the basis set on the performance of the model (see Section 1 of the ESI†). Only the results of 6-31+G* basis set are reported in the main text, as it has been found to be the best balance for accuracy and computational cost.Supervised and unsupervised learning
AC and KRR models have been used as implemented in scikit-learn Python's package.80 In both cases the kernel = “precomputed” option was used to provide our implementation of intra/intermolecular separable RBF kernel version (as described in the methodology section and ESI†) transpiled from Fortran95 and capable of parallel computing. For the local SOAP representation we have employed the Regularized Entropy Match kernel54 (REMatch) to evaluate global similarities from local representations. In this case we have experimented with different values of the entropic penalty parameter: α = 0.01 (best match), α = 1.0 (intermediate) and α = 10 (average-like regime), which constitutes a reasonable choice to sweep the spectrum of regimes that this kernel can work in ref. 81 (see Section 4.1 of the ESI†). Before the RBF kernel is computed, the intra- and intermolecular features have been separately normalized to max = 1 in order to guarantee reasonable optimal values of the hyperparameters. In AC experiments, the whole PHYL and THIL datasets have been used with linkage = “complete”,39 which minimizes the maximum distance between observations of pairs of clusters. A varying number of clusters has been used, ranging from 2 to 10 (the latter is shown in the main text and the rest in Section 4 of the ESI†). We have fitted the KRR model according to a custom implementation of a grid search cross-validation (CV) with leave p-groups-out strategy over γI and γi hyperparameters of the decoupled RBF kernel, and the ridge regularization term (“alpha” in sklearn implementation). We applied the CV search to TTTA structures of the HT-300K dataset computing R2, MAE and RMSE mean values across all the N!/p!(N − p)! CV splits (where N and p stand for total number of groups and number of groups out, respectively), and then used data from the HT-250K phase as our validation set. The grid search for the ridge regularization parameters explored 50 equidistant values in a logarithmic scale ranging from 10−11 to 10−1. Similarly, 100 values have been tested for γI and γi in the interval (10−100, 103). The learning curves have been produced by selecting a specific number of total groups and groups out N/p, to get 5% (20/1), 10% (10/1), 20% (5/1), 25% (4/1) and 40% (5/2). GFRE(F,F′) and GFRE(t)(F,F′) feature reconstruction measures have been calculated by means of the scikit-matter82 Python module, using only intermolecular features of the descriptors. The regression weights for GFRE(t) were calculated from the samples in the time interval t ∈ (4, 10) ps and evaluated at t ∈ (0.5, 4) ps, while a strict 50/50 split have been used in GFRE before random shuffling to decorrelate time-evolution samples.Data availability
The code and tutorial for the MLcool package, including examples for using BoB, SOAP, and MODA, are available at the GitHub repository: https://github.com/GEM2-UB/MODA. A tutorial showing the data analysis of this paper is available in the interactive notebook “MODA_tutorial.ipynb” at https://github.com/GEM2-UB/MODA. The complete dataset used for this study, encompassing THIL, PHYL, and TTTA datasets, is accessible at Zenodo: https://doi.org/10.5281/zenodo.8032717. Other algorithms and analyses have been uploaded as a part of the ESI.† Both the code and dataset are required to be formally cited in the reference section of this article.Conflicts of interest
There are no conflicts to declare.Acknowledgements
The authors are thankful for the financial support of the Spanish Ministerio de Economía y Competitividad (Project: CTQ2017-87773-P/AEI/FEDER), the Spanish Ministerio de Ciencia e Innovación (Projects PID2020-117803GB-I00 and CEX2021-001202-M). The authors also acknowledge support from project grant 2021SGR00354 funded by the Generalitat de Catalunya. R. S. acknowledges a predoctoral FPI grant from MINECO under grant agreement PRE2018-084053. S. V. acknowledges Generalitat de Catalunya for a Beatriu de Pinós grant (2020 BP 00043).References
- J. A. Keith, V. Vassilev-Galindo, B. Cheng, S. Chmiela, M. Gastegger, K. R. Müller and A. Tkatchenko, Chem. Rev., 2021, 121, 9816–9872 CrossRef CAS.
- B. Huang and O. A. von Lilienfeld, Chem. Rev., 2021, 121, 10001–10036 CrossRef CAS.
- A. Glielmo, B. E. Husic, A. Rodriguez, C. Clementi, F. Noé and A. Laio, Chem. Rev., 2021, 121, 9722–9758 CrossRef CAS.
- A. Nandy, C. Duan, M. G. Taylor, F. Liu, A. H. Steeves and H. J. Kulik, Chem. Rev., 2021, 121, 9927–10000 CrossRef CAS.
- H. J. Kulik, T. Hammerschmidt, J. Schmidt, S. Botti, M. A. Marques, M. Boley, M. Scheffler, M. Todorović, P. Rinke, C. Oses, A. Smolyanyuk, S. Curtarolo, A. Tkatchenko, A. P. Bartók, S. Manzhos, M. Ihara, T. Carrington, J. Behler, O. Isayev, M. Veit, A. Grisafi, J. Nigam, M. Ceriotti, K. T. Schütt, J. Westermayr, M. Gastegger, R. J. Maurer, B. Kalita, K. Burke, R. Nagai, R. Akashi, O. Sugino, J. Hermann, F. Noé, S. Pilati, C. Draxl, M. Kuban, S. Rigamonti, M. Scheidgen, M. Esters, D. Hicks, C. Toher, P. V. Balachandran, I. Tamblyn, S. Whitelam, C. Bellinger and L. M. Ghiringhelli, Electron. Struct., 2022, 4(2), 023004 CrossRef.
- N. Fedik, R. Zubatyuk, M. Kulichenko, N. Lubbers, J. S. Smith, B. Nebgen, R. Messerly, Y. W. Li, A. I. Boldyrev, K. Barros, O. Isayev and S. Tretiak, Nat. Rev. Chem., 2022, 6, 653–672 CrossRef CAS.
- M. Deffner, M. P. Weise, H. Zhang, M. Mücke, J. Proppe, I. Franco and C. Herrmann, J. Chem. Theory Comput., 2023, 19, 992–1002 CrossRef CAS PubMed.
- K. P. Greenman, W. H. Green and R. Gómez-Bombarelli, Chem. Sci., 2022, 13, 1152–1162 RSC.
- J. Westermayr and P. Marquetand, Chem. Rev., 2021, 121, 9873–9926 CrossRef CAS.
- P. O. Dral and M. Barbatti, Nat. Rev. Chem., 2021, 5, 388–405 CrossRef CAS PubMed.
- P. Marquetand, Chem. Rev., 2022, 122, 15996–15997 CrossRef CAS PubMed.
- H. Türk, E. Landini, C. Kunkel, J. T. Margraf and K. Reuter, Chem. Mater., 2022, 34, 9455–9467 CrossRef.
- S. Wengert, G. Csányi, K. Reuter and J. T. Margraf, J. Chem. Theory Comput., 2022, 18, 4586–4593 CrossRef CAS PubMed.
- J. T. Margraf, H. Jung, C. Scheurer and K. Reuter, Nat. Catal., 2023, 6, 112–121 CrossRef.
- M. F. Langer, A. Goeßmann and M. Rupp, npj Comput. Mater., 2022, 8, 41 CrossRef.
- D. Weininger, J. Chem. Inf. Comput. Sci., 1988, 28, 31–36 CrossRef CAS.
- S. R. Heller, A. McNaught, I. Pletnev, S. Stein and D. Tchekhovskoi, J. Cheminf., 2015, 7, 23 Search PubMed.
- H. L. Morgan, J. Chem. Doc., 1965, 5, 107–113 CrossRef CAS.
- A. Capecchi, D. Probst and J. L. Reymond, J. Cheminf., 2020, 12, 43 CAS.
- A. P. Bartók, R. Kondor and G. Csányi, Phys. Rev. B: Condens. Matter Mater. Phys., 2013, 87, 184115 CrossRef.
- B. Huang and O. A. von Lilienfeld, Nat. Chem., 2020, 12, 945–951 CrossRef CAS.
- W. Pronobis, A. Tkatchenko and K.-R. Müller, J. Chem. Theory Comput., 2018, 14, 2991–3003 CrossRef CAS.
- H. Huo and M. Rupp, Mach. Learn.: Sci. Technol., 2022, 3, 045017 Search PubMed.
- K. Hansen, F. Biegler, R. Ramakrishnan, W. Pronobis, O. A. von Lilienfeld, K.-R. Müller and A. Tkatchenko, J. Phys. Chem. Lett., 2015, 6, 2326–2331 CrossRef CAS PubMed.
- J. Behler, J. Chem. Phys., 2011, 134, 074106 CrossRef.
- A. Fabrizio, K. R. Briling and C. Corminboeuf, Digital Discovery, 2022, 286–294 RSC.
- K. Karandashev and O. A. von Lilienfeld, J. Chem. Phys., 2022, 156, 114101 CrossRef CAS PubMed.
- S. Llenga and G. Gryn'ova, ChemRxiv, 2023, preprint, DOI:10.26434/chemrxiv-2023-9pggs.
- M. Rinderle, W. Kaiser, A. Mattoni and A. Gagliardi, J. Phys. Chem. C, 2020, 124, 17733–17743 CrossRef CAS.
- C.-I. Wang, I. Joanito, C.-F. Lan and C.-P. Hsu, J. Chem. Phys., 2020, 153, 214113 CrossRef CAS PubMed.
- A. Grisafi and M. Ceriotti, J. Chem. Phys., 2019, 151, 204105 CrossRef.
- C.-I. Wang, M. K. E. Braza, G. C. Claudio, R. B. Nellas and C.-P. Hsu, J. Phys. Chem. A, 2019, 123, 7792–7802 CrossRef CAS PubMed.
- S. Lehtola, J. Chem. Theory Comput., 2019, 15, 1593–1604 CrossRef CAS PubMed.
- J. H. V. Lenthe, R. Zwaans, H. J. J. V. Dam and M. F. Guest, J. Comput. Chem., 2006, 27, 926–932 CrossRef.
- S. Lehtola, Phys. Rev. A, 2020, 101, 012516 CrossRef CAS.
- R. Hoffmann, J. Chem. Phys., 1963, 39, 1397–1412 CrossRef CAS.
- M. P. Bahlke, N. Mogos, J. Proppe and C. Herrmann, J. Phys. Chem. A, 2020, 124, 8708–8723 CrossRef CAS.
- T. Hastie, J. Friedman and R. Tibshirani, The Elements of Statistical Learning, Springer, New York, 2001 Search PubMed.
- D. Müllner, Modern hierarchical, agglomerative clustering algorithms, 2011 Search PubMed.
- A. J. Bridgeman, G. Cavigliasso, L. R. Ireland and J. Rothery, Dalton Trans., 2001, 2095–2108 RSC.
- T. Hofmann, B. Schölkopf and A. J. Smola, Ann. Stat., 2008, 36, 1171–1220 Search PubMed.
- A. E. Hoerl and R. W. Kennard, Technometrics, 1970, 12, 55–67 CrossRef.
- O. Sato, Nat. Chem., 2016, 8, 644–656 CrossRef CAS.
- Z. H. Cui, H. Lischka, H. Z. Beneberu and M. Kertesz, J. Am. Chem. Soc., 2014, 136, 5539–5542 CrossRef CAS PubMed.
- J. Thiele and H. Balhorn, Ber. Dtsch. Chem. Ges., 1904, 37, 1463–1470 CrossRef.
- C. Wentrup, M. J. Regimbald-Krnel, D. Müller and P. Comba, Angew. Chem., Int. Ed., 2016, 55, 14600–14605 CrossRef CAS PubMed.
- Y. Su, X. Wang, L. Wang, Z. Zhang, X. Wang, Y. Song and P. P. Power, Chem. Sci., 2016, 7, 6514–6518 RSC.
- W. Fujita and K. Awaga, Science, 1999, 286, 261–262 CrossRef CAS.
- S. Vela, F. Mota, M. Deumal, R. Suizu, Y. Shuku, A. Mizuno, K. Awaga, M. Shiga, J. J. Novoa and J. Ribas-Arino, Nat. Commun., 2014, 5, 4411 CrossRef CAS PubMed.
- S. Vela, M. Deumal, M. Shiga, J. J. Novoa and J. Ribas-Arino, Chem. Sci., 2015, 6, 2371–2381 RSC.
- O. Çaylak, A. Yaman and B. Baumeier, J. Chem. Theory Comput., 2019, 15, 1777–1784 CrossRef PubMed.
- J. J. Girerd, Y. Journaux and O. Kahn, Chem. Phys. Lett., 1981, 82, 534–538 CrossRef CAS.
- Despite the MO symmetry is usually given in terms of an irreducible representation of the point group to which the molecular structure belongs, in this case we are treating the molecular orbitals as the object to which the point group is assigned to.
- S. De, A. P. Bartók, G. Csányi and M. Ceriotti, Phys. Chem. Chem. Phys., 2016, 18, 13754–13769 RSC.
- A. Goscinski, G. Fraux, G. Imbalzano and M. Ceriotti, Mach. Learn.: Sci. Technol., 2021, 2, 025028 Search PubMed.
- J. J. Novoa, M. Deumal and J. Jornet-Somoza, Chem. Soc. Rev., 2011, 40, 3182 RSC.
- A. Paul, R. Nasani, A. Mondal, S. Roy, S. Vela and S. Konar, Cryst. Growth Des., 2020, 20, 6296–6301 CrossRef CAS.
- S. Vela, M. B. Reardon, C. E. Jakobsche, M. M. Turnbull, J. Ribas-Arino and J. J. Novoa, Chem.–Eur. J., 2017, 23, 3479–3489 CrossRef CAS.
- D. Vanderbilt, Phys. Rev. B: Condens. Matter Mater. Phys., 1990, 41, 7892–7895 CrossRef PubMed.
- J. P. Perdew, K. Burke and M. Ernzerhof, Phys. Rev. Lett., 1996, 77, 3865–3868 CrossRef CAS PubMed.
- S. Grimme, J. Comput. Chem., 2006, 27, 1787–1799 CrossRef CAS.
- R. Car and M. Parrinello, Phys. Rev. Lett., 1985, 55, 2471–2474 CrossRef CAS PubMed.
- R. Car and M. Parrinello, Phys. Rev. Lett., 1985, 55, 2471–2474 CrossRef CAS.
- G. J. Martyna, M. L. Klein and M. Tuckerman, J. Chem. Phys., 1992, 97, 2635–2643 CrossRef.
- L. Noodleman, J. Chem. Phys., 1981, 74, 5737–5743 CrossRef CAS.
- R. Caballol, O. Castell, F. Illas, I. d. P. R. Moreira and J. P. Malrieu, J. Phys. Chem. A, 1997, 101, 7860–7866 CrossRef CAS.
- A. D. Becke, Phys. Rev. A, 1988, 38, 3098–3100 CrossRef CAS.
- A. D. Becke, J. Chem. Phys., 1993, 98, 5648–5652 CrossRef CAS.
- C. Lee, W. Yang and R. G. Parr, Phys. Rev. B: Condens. Matter Mater. Phys., 1988, 37, 785–789 CrossRef CAS PubMed.
- P. C. Hariharan and J. A. Pople, Theor. Chim. Acta, 1973, 28, 213–222 CrossRef CAS.
- M. M. Francl, W. J. Pietro, W. J. Hehre, J. S. Binkley, M. S. Gordon, D. J. DeFrees and J. A. Pople, J. Chem. Phys., 1982, 77, 3654–3665 CrossRef CAS.
- M. J. Frisch, G. W. Trucks, H. B. Schlegel, G. E. Scuseria, M. A. Robb, J. R. Cheeseman, G. Scalmani, V. Barone, B. Mennucci, G. A. Petersson, H. Nakatsuji, M. Caricato, X. Li, H. P. Hratchian, A. F. Izmaylov, J. Bloino, G. Zheng, J. L. Sonnenberg, M. Hada, M. Ehara, K. Toyota, R. Fukuda, J. Hasegawa, M. Ishida, T. Nakajima, Y. Honda, O. Kitao, H. Nakai, T. Vreven, J. A. Montgomery Jr, J. E. Peralta, F. Ogliaro, M. Bearpark, J. J. Heyd, E. Brothers, K. N. Kudin, V. N. Staroverov, R. Kobayashi, J. Normand, K. Raghavachari, A. Rendell, J. C. Burant, S. S. Iyengar, J. Tomasi, M. Cossi, N. Rega, J. M. Millam, M. Klene, J. E. Knox, J. B. Cross, V. Bakken, C. Adamo, J. Jaramillo, R. Gomperts, R. E. Stratmann, O. Yazyev, A. J. Austin, R. Cammi, C. Pomelli, J. W. Ochterski, R. L. Martin, K. Morokuma, V. G. Zakrzewski, G. A. Voth, P. Salvador, J. J. Dannenberg, S. Dapprich, A. D. Daniels, O. Farkas, J. B. Foresman, J. V. Ortiz, J. Cioslowski and D. J. Fox, Gaussian 09 Revision A.1, Gaussian Inc., Wallingford CT, 2009 Search PubMed.
- F. James, Statistical Methods in Experimental Physics, WORLD SCIENTIFIC, 2006 Search PubMed.
- V. L. Deringer, A. P. Bartók, N. Bernstein, D. M. Wilkins, M. Ceriotti and G. Csányi, Chem. Rev., 2021, 121, 10073–10141 CrossRef CAS.
- R. K. Cersonsky, M. Pakhnova, E. A. Engel and M. Ceriotti, Chem. Sci., 2023, 14, 1272–1285 RSC.
- L. Himanen, M. O. J. Jäger, E. V. Morooka, F. Federici Canova, Y. S. Ranawat, D. Z. Gao, P. Rinke and A. S. Foster, Comput. Phys. Commun., 2020, 247, 106949 CrossRef CAS.
- Q. Sun, T. C. Berkelbach, N. S. Blunt, G. H. Booth, S. Guo, Z. Li, J. Liu, J. D. McClain, E. R. Sayfutyarova, S. Sharma, S. Wouters and G. K.-L. Chan, Wiley Interdiscip. Rev.: Comput. Mol. Sci., 2017, 8, e1340 Search PubMed.
- P.-O. Löwdin, J. Chem. Phys., 1950, 18, 365–375 CrossRef.
- P. Pulay and T. P. Hamilton, J. Chem. Phys., 1988, 88, 4926–4933 CrossRef CAS.
- F. Pedregosa, G. Varoquaux, A. Gramfort, V. Michel, B. Thirion, O. Grisel, M. Blondel, P. Prettenhofer, R. Weiss, V. Dubourg, J. Vanderplas, A. Passos, D. Cournapeau, M. Brucher, M. Perrot and E. Duchesnay, J. Mach. Learn. Res., 2011, 12, 2825–2830 Search PubMed.
- F. Musil, A. Grisafi, A. P. Bartók, C. Ortner, G. Csányi and M. Ceriotti, Chem. Rev., 2021, 121, 9759–9815 CrossRef CAS PubMed.
- A. Goscinski, V. P. Principe, G. Fraux, S. Kliavinek, B. A. Helfrecht, P. Loche, M. Ceriotti and R. K. Cersonsky, Open Res. Europe, 2023, 3, 81 Search PubMed.
Footnote |
| † Electronic supplementary information (ESI) available: (1) Assessment of the effect of the basis set in MODA intermolecular components. (2) Decoupling formalism used to separate intra- and intermolecular components of BoB and SOAP; methodology based on spectral clustering for automatic detection of moieties in multi-moiety systems. (3) Detailed description of the TTTA dataset; two-sample Kolmogorov–Smirnov test for HT-300K and HT-250K AIMD simulations. (4) Results of agglomerative clustering for BoB, SOAP, and MODA with a varying number of clusters. (5) Formalism and strategy to calculate natural orbitals from the density matrix, including an extension for approximating multi-moiety NOs from linear combinations of NOs; representation of the SONOs for TTTA, THIL, and PHYL included in the MODA representation. (6) Analysis of MODA and BoB results for intra- and intermolecular decoupling. (7) Description of the leave-p-groups-out cross-validation strategy used in the KRR predictions. (8) Notes on the performance of descriptors. See DOI: https://doi.org/10.1039/d3dd00187c |
| This journal is © The Royal Society of Chemistry 2024 |