 Open Access Article
Creative Commons Attribution 3.0 Unported Licence
Mechanism for Cu-enhanced hydrothermal stability of Cu–CHA for NH3-SCR†
Shivangi
Singh
*ab,
Ton V. W.
Janssens
 b and
Henrik
Grönbeck
 *a
*a
aDepartment of Physics, Competence Centre for Catalysis, Chalmers University of Technology, Sweden. E-mail: shivangi.singh@chalmers.se; ghj@chalmers.se; Tel: +46 3177 22963
bUmicore Denmark ApS, DK 2970 Horsholm, Denmark
First published on 6th May 2024
Abstract
Exposure of acidic zeolite-based catalysts to water at high temperatures generally leads to deactivation due to dealumination. In Cu–CHA zeolite, which is a preferred catalyst for the selective catalytic reduction of NO by NH3 (NH3-SCR), the acidic protons in the zeolite are partially exchanged by Cu ions. The presence of Cu has been measured to reduce the rate of dealumination, thus stabilizing the catalyst. To understand the stabilizing effect of Cu, density functional theory calculations, ab initio thermodynamics and microkinetic modeling are used to compare the reaction mechanism for the dealumination of H–CHA to Cu–CHA. For H–CHA, we find that dealumination leads to the formation of mobile Al(OH)3H2O (extra-framework aluminum) species, whereas for Cu–CHA, formation of framework bound Cu–Al species is thermodynamically preferred over Al(OH)3H2O, which results in the increased stability of Cu–CHA. The formation of mobile Al(OH)3H2O in Cu–CHA is, moreover, associated with a high energy barrier. The phase diagrams show the formation of Al(OH)3H2O and Al2O3 from H–CHA and that high temperatures favor the formation of Al2O3. For Cu–CHA, high temperatures lead to the formation of CuO and Al2O3, which is favored over Al(OH)3H2O + CuO. The microkinetic model shows that the formation of Al(OH)3H2O in the presence of water starts at 380 K and 800 K in H–CHA and Cu–CHA, respectively. Additionally, the time evolution of the Al(OH)3H2O coverage at 923 K reveals that the process of dealumination is significantly faster for H–CHA as compared to Cu–CHA, which is in accordance with the measured increased stability.
1 Introduction
Selective catalytic reduction of nitrogen oxides (NOx) with NH3 as a reducing agent (NH3-SCR) is a leading technology for diesel exhaust emission control. NH3-SCR involves the reduction of NOx to N2 and H2O in the presence of NH3 and O2.1–3 In the last two decades, Cu-exchanged zeolites with a chabazite structure (Cu–CHA) have emerged as the preferred catalysts thanks to their high activity, selectivity and high tolerance to sulfur oxides.3–5 Zeolites are alumino-silicates composed of tetrahedral units of SiO4 and AlO4.6 The tetrahedral units are in CHA arranged to form 4-, 6-, and 8-membered rings. The presence of Al creates a negative charge that is balanced by a proton or in the case of Cu–CHA, Cu ions. One general issue with zeolite-based catalysts is deactivation due to dealumination when the catalyst material is exposed to water vapor at high temperatures (>850 K for Cu–CHA7). Dealumination refers to the removal of aluminum from the zeolite framework, resulting in structural changes that adversely affect the catalytic activity, leading to catalyst degradation.8,9The exhaust stream of diesel engines contains typically 2–9% water. The interaction of water with aluminum in the zeolite framework results in sequential breakage of the Al–O bonds and ultimately to the formation of silanol groups and extra-framework aluminum.10,11 Extra-framework aluminum in HCHA has been measured to contain different forms of aluminum oxide (Al2O3), together with tetrahedral, pentagonal and octahedral coordinated aluminum ions.12,13 Octahedrally coordinated Al ions (Al(OH)3(H2O)3) are unstable above 395 K and converts to tetrahedrally coordinated aluminum (Al(OH)3H2O).12 A recent infrared spectroscopy study has indicated the formation of hydroxylated aluminum oxide clusters during the steaming process.14 Solid-state nuclear magnetic resonance measurements show a reduction in tetrahedrally coordinated framework aluminum upon water exposure, indicating dealumination. Dealumination is associated with a decrease in the number of Brønsted acid sites, which has been measured with infrared spectroscopy and temperature-programmed desorption.14–16
Atomic scale computational studies have primarily focused on the dealumination mechanism in H–CHA. The initial stage of dealumination involves water adsorbing on aluminum, yielding a pentahedral or distorted tetrahedral Al atom. Following this, the first Al–O hydrolysis step occurs through the dissociation of a water molecule. The sequential addition of water molecules results in extra-framework aluminum.17–19 Monte Carlo simulations for H–CHA under steam conditions (725 K, 1 bar) predict that more than three water molecules are present per unit cell and the collective action of more than one water molecule has been found to decrease the energy barrier for dealumination.20 Dealumination is usually associated with high temperature although NH4-Y zeolite dealuminates already at 450–500 K.15
The protons in H–CHA can be replaced with Cu ions, which at high temperatures predominately are present in the Cu2+ oxidation state as Z2Cu (where Z represents the anionic Al site in the zeolite framework).9 Copper is in the Z2-configuration located in the plane of a 6-membered ring, balancing the negative charge of two aluminum sites. Cu–CHA has demonstrated a higher resistance to dealumination than H–CHA when exposed to water vapor at high temperatures. Early XRD measurements have shown that the zeolite structure of NH4–CHA breaks down at 850–900 K, whereas Cu–CHA remains stable up to 1100–1150 K.21 Moreover, Kwak et al. observed that the NOx conversion over Cu–CHA was only weakly affected by hydrothermal aging at 800 °C for 16 hours, which was consistent with minor changes in the solid state Al-NMR spectra between fresh and aged samples.22
Linking hydrothermal deactivation of Cu–CHA with atomic-scale reactions is complex because of the possibility of many simultaneous processes and products.23 The processes include (1) dealumination as for H–CHA, (2) the formation of copper oxide (CuO) species, (3) the agglomeration of Cu–Al species into copper aluminate (CuAl2O4) and (4) complete collapse of the zeolite framework. Previous studies have reported the formation of a Cu–Al phase in a hydrothermally aged Cu-ZSM-5 zeolite and the clustering of Cu–Al species in Cu–CHA zeolite.23,24 The major product depends on the Cu/Al ratio; samples with a high Cu content show CuOx cluster formation and conversion of ZCuOH to CuOx.25
Numerous experimental studies have been performed to elucidate the kinetics of dealumination. Masuda et al. studied the dealumination in MFI-type zeolite and measured the reaction order with respect to steam partial pressure to be 1.5 at 1 bar and 773 K.11 Furthermore, the apparent activation energy of dealumination in HZSM-5 has been measured to be about 1.1 eV at a water pressure of 5 kPa and 873 K.8 In a recent study, density functional theory (DFT) calculations and microkinetic modeling were used to investigate the dealumination of H–CHA, allowing for a detailed understanding of the measured reaction kinetics.20 Previous studies have primarily focused on the dealumination mechanism in H–CHA and HZSM-5 zeolites. An atomic-level understanding explaining how copper stabilizes the zeolite framework in Cu–CHA and why dealumination in Cu–CHA is delayed compared to H/NH4–CHA is still lacking. Here, we use DFT calculations to compare the dealumination mechanisms in H–CHA and Cu–CHA and elucidate the enhanced hydrothermal stability of Cu–CHA. The study is performed in three steps. First, the potential energy landscapes for dealumination of H–CHA and Cu–CHA are calculated to identify the reaction pathway and analyze the reaction barriers. Second, phase diagrams are constructed to investigate the thermodynamic stability of different reaction products resulting from dealumination under different temperature and pressure conditions. Third, a DFT-informed microkinetic model is constructed to simulate the evolution of extra-framework alumina as a function of temperature and water pressure. We find that the formation of extra-framework aluminum species is faster for H–CHA as compared to Cu–CHA, which is related to higher barriers for hydrolysis in Cu–CHA. An additional reason for the increased stability of Cu–CHA is the preferential formation of framework bound Cu–Al species instead of mobile Al(OH)3H2O. Our work provides a material-based description of the hydrothermal stability of Cu–CHA catalysts for NH3-SCR.
2 Computational methods
2.1 Electronic structure calculations
Spin-polarized density functional theory (DFT) calculations are performed with the Vienna ab initio simulation package (VASP).26–29 The interaction between the valence and core electrons is described by the plane augmented wave (PAW) method, and the Kohn–Sham orbitals are expanded with plane waves using an energy cutoff of 480 eV.30,31 The number of electrons treated in the valence is Cu(11), Si(4), Al(3), O(6), and H(1). The Perdew–Burke–Ernzerhof (PBE) exchange–correlation functional is used together with a Grimme-D3 correction, which accounts for the van der Waals interactions.32–34 Moreover, a Hubbard-U correction of 6 eV is applied to enforce the localization of 3d electrons in Cu.35,36 The chosen treatment of the electronic interactions is evaluated by comparative calculations using the hybrid functional HSE06.37,38 The relative stability of the considered solid phases is found to depend weakly on the functional, see the ESI.† The electronic structure is considered to be converged when the change of electronic energy and Kohn–Sham eigenvalues between two iterations is smaller than 1 × 10⁻⁶ eV.Structures are optimized with the conjugate gradient method. Geometries are considered to be converged when the largest force is smaller than 0.05 eV Å−1. Only the gamma point was used to sample the Brillouin zone. Transition states are located using the climbing image nudge elastic band (NEB) method39–41 with a spring constant of 5.0 eV Å−1. Transition states are confirmed by vibrational analysis using the finite difference method. Born–Oppenheimer ab initio molecular dynamics (AIMD) with a time step of 1 fs is employed to explore and identify the minimum energy structure of CHA in a canonical (NVT) ensemble at 300 K. The temperature of the simulation is controlled using a Nosé–Hoover thermostat42,43 and the masses of the H atoms are set to 3 amu to allow for a large time step.
The chabazite structure is modeled with a hexagonal unit cell, which includes 36 tetrahedrally coordinated silicon atoms (T-sites). Calculations are performed with the experimental lattice parameters of a = b = 13.8 Å, c = 15.0 Å, α = β = 90.0°, and γ = 120.0°. H–CHA is modeled with either one or two aluminum (Al) in a 6-membered ring. Thus, the considered Si/Al ratios are 35 and 17. The two models are denoted as 1H–CHA and 2H–CHA, respectively. The results for 1H–CHA are reported in the ESI.†
2.2 Evaluation of entropy
The rate constant includes both enthalpy and entropy changes. Evaluation of entropies for species in confined volumes, such as zeolites, is generally challenging.44,45 The entropy of a gas phase water molecule is given by:| Sgas = Sgastrans + Sgasrot + Sgasvib | (1) |
 | (2) |
2.3 Evaluation of phase diagrams
To study the temperature-dependent relative stability of extra-framework aluminum species and alumina, Gibbs free energies at 50 mbar pressure (water) are determined for the optimized zeolite structure. The enthalpy is approximated by the zero-point corrected electronic energy, neglecting the pV term. This approximation is based on the assumption that the pressure–volume work is small compared to the electronic energy contributions, which is reasonable as the volume and pressure do not change in the reaction. The entropy contributions from the lattice vibration for the zeolite and the considered bulk phases are calculated using the PHONOPY code.46 The Gibbs free energy (ΔG) for the formation of extra-framework aluminum species and alumina is calculated according to:47| ΔG(T, p) = GSi34AlO72H5(T) + GAl(OH)3H2O(T, p) − GSi34Al2O72H2(T) − 4μH2O(T, p) | (3) |
| ΔG(T, p) = GSi34O72H8(T) + 2GAl(OH)3H2O(T, p) + GCuO(T) − GSi34Al2O72Cu1(T) − 9μH2O | (4) |
 | (5) |
| ΔG(T, p) = GSi34O72H8(T) + GAl2O3(T) + GCuO(T) − GSi34Al2O72Cu1(T) − 4μH2O(T, p) | (6) |
2.4 Microkinetic model
The microkinetic model is based on the mean-field approach, which assumes that the system is homogeneous and that species are randomly distributed. The time evolution of the surface coverages is obtained by solving a set of ordinary differential equations.48 | (7) |
The rate constant for the adsorption of water on the Brønsted acid site is estimated using collision theory:48
 | (8) |
 | (9) |
 | (10) |
3 Results and discussion
3.1 Potential energy landscapes
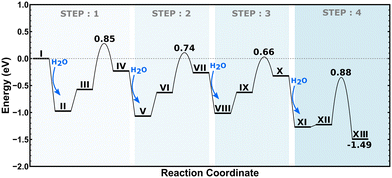
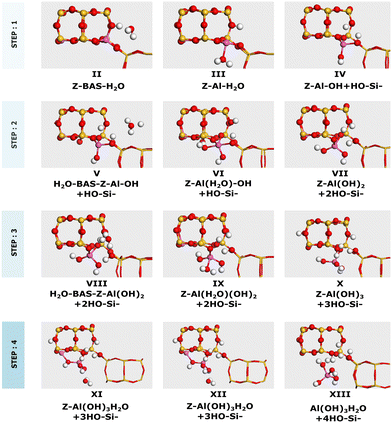
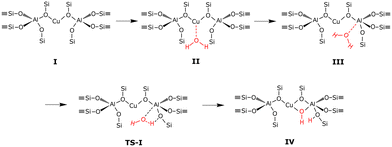
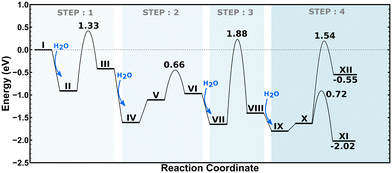
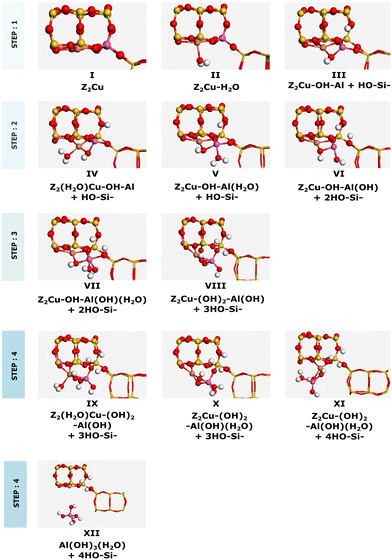
The considered dealumination pathway is based on the mechanism proposed by Silaghi et al.19 The complete dealumination requires a minimum of four water molecules and consists of four hydrolysis steps in which the breaking of the Al–O bonds takes place. The reaction scheme for hydrolysis of the first Al–O bond is shown in Fig. 1. The hydrolysis process starts with (II) adsorption on the Brønsted acid site, which has the highest adsorption energy, (III) diffusion of the water molecule to the aluminum site, (TS-I) initiation of hydrolysis of the Al–O–Si bond, and (IV) breaking of the Al–O–Si bond. The hydrolysis of the remaining three Al–O bonds occurs in a similar fashion leading to the formation of an Al(OH)3H2O species and a so-called silanol nest (four hydrogen bonded Si–OH groups).The energy landscape for the dealumination process of Cu–CHA is shown in Fig. 5 with the corresponding structures in Fig. 6. The first water molecule adsorbs on the copper site with an adsorption energy of −0.90 eV and dissociates over the copper site with an energy barrier of 1.33 eV. The second water molecule adsorbs at the copper site with an adsorption energy of −1.20 eV. Subsequently, water diffuses to the aluminum site where it dissociates. This step involves a barrier of 0.66 eV. The third water molecule adsorbs at the aluminum site with an adsorption energy of −0.68 eV, where it dissociates forming IX. Finally, the fourth water molecule adsorbs at the copper site with an adsorption energy of −0.40 eV. After diffusion to the aluminum site, either an extra-framework aluminum species (Al(OH)3H2O) or a copper–aluminum species is formed. The barrier to form the extra-framework aluminum species is higher than that to form the framework-bound copper–aluminum species, 1.54 eV as compared to 0.72 eV. Both reaction products are exothermic with respect to Z2Cu and water in the gas phase. However, the formation of structure XII (with Al(OH)3H2O) is endothermic with respect to structure X, whereas structure XI (with the Cu–Al species) is exothermic with respect to structure X. The barriers for hydrolysis of the Al–O bonds in Cu–CHA are higher than those for the 2H–CHA case. The third hydrolysis step has the highest barrier being 1.88 eV.
3.2 Thermodynamic stability
Before discussing the kinetics of the dealumination reaction for 2H–CHA and Cu–CHA, it is interesting to examine the thermodynamic stability of the products formed during dealumination. Previous studies have established that exposing zeolites to steam at high temperatures leads to the formation of Al2O3 and Al(OH)3H2O.14,50 The phase diagrams for the reactions at different temperatures have been constructed considering a fixed water partial pressure of 50 mbar. The reactions of interest are: | (11) |
 | (12) |
 | (13) |
 | (14) |
Fig. 7 shows the formation of Al(OH)3H2O and Al2O3 from 2H–CHA and Cu–CHA, respectively. The phase diagram shows that the free energy of the formation of Al(OH)3H2O is endothermic after 350 K, which is in agreement with a previous report by Nielsen et al.51 The formation of Al(OH)3H2O is endothermic already at 335 K in the case of Cu–CHA. Al(OH)3H2O will eventually form bulk phases and the formation of the aluminum oxide is found to be endothermic above 510 K for 2H–CHA, whereas the formation of aluminum oxide and copper oxide is endothermic above 840 K for Cu–CHA. The reason that the formation of dealumination products is endothermic at elevated temperatures is connected to the considerable loss of entropy during hydrolysis of gas-phase water. The entropy contribution to the free energy of a water molecule at 1000 K is ∼2.4 eV.
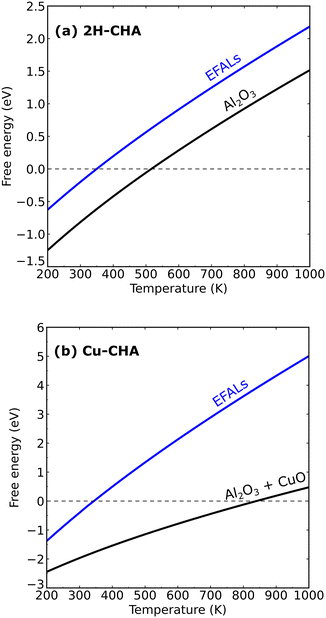 | ||
| Fig. 7 Phase diagram showing the stability of extra-framework aluminum species, aluminum oxide and copper oxide in 2H–CHA and Cu–CHA. | ||
The relative thermodynamic stability could be affected by the choice of the exchange–correlation functional. To ensure the accuracy of the results, we compared the results of the PBE + U + D3 calculations with calculations using a hybrid functional (HSE06 + D3), see the ESI.† The enthalpy change between the functionals differs only by 0.15 eV for eqn (13). The relatively small discrepancy suggests that the phase diagrams with the PBE + U + D3 approach have a reasonable accuracy. The phase diagrams suggest that the thermodynamics of dealumination, in principle, does not require high temperatures. The high temperature could instead be needed for kinetic reasons, which have motivated us to construct a microkinetic model for the dealumination of 2H–CHA and Cu–CHA.
3.3 Microkinetic modeling of dealumination
A microkinetic model for dealumination in 2H–CHA and Cu–CHA has been constructed to investigate kinetic limitations. A microkinetic model provides a possibility to examine dominant species as a function of time and temperature. Additionally, it assists in identifying which elementary steps influence the kinetics of the overall dealumination mechanism. In the microkinetic model, some intermediates have been omitted for simplicity and a state of “gas-phase” water inside the zeolite cage has been added. The state with gas-phase water is added to simplify the handling of entropy changes. The entropy for the gas-phase water state in the zeolite is evaluated according to eqn (2). The entropy of other intermediate states is determined within the harmonic approximation treating rotations and translations as frustrated vibrations. The last elementary step in both reaction paths is considered to be irreversible. Treating the last step as irreversible effectively accounts for a large entropy barrier adding an Al ion from an extra-framework aluminum species to the zeolite framework. The elementary steps involved in the dealumination of 2H–CHA and Cu–CHA are described in Table 1.| No. | Elementary step | E ‡f | E ‡b | S ‡f | S ‡b |
|---|---|---|---|---|---|
| 2H–CHA | |||||
| r1 | I-H2O (cage) ![[left over right harpoons]](https://www.rsc.org/images/entities/char_21cb.gif) II II |
−0.73 | 0.73 | −95.86 | 95.86 |
| r2 | II ![[left over right harpoons]](https://www.rsc.org/images/entities/char_21cb.gif) IV IV |
1.25 | 0.51 | −1.30 | −3.06 |
| r3 | IV + H2O ![[left over right harpoons]](https://www.rsc.org/images/entities/char_21cb.gif) V V |
−0.84 | 0.84 | −105.59 | 105.59 |
| r4 | V ![[left over right harpoons]](https://www.rsc.org/images/entities/char_21cb.gif) VII VII |
1.18 | 0.37 | 6.58 | 2.98 |
| r5 | VII + H2O ![[left over right harpoons]](https://www.rsc.org/images/entities/char_21cb.gif) VIII VIII |
−0.75 | 0.75 | −100.17 | 100.17 |
| r6 | VIII ![[left over right harpoons]](https://www.rsc.org/images/entities/char_21cb.gif) X X |
1.04 | 0.35 | −0.18 | −18.77 |
| r7 | X + H2O ![[left over right harpoons]](https://www.rsc.org/images/entities/char_21cb.gif) XI XI |
−0.95 | 0.95 | −111.56 | 111.56 |
| r8 | XI → XIII | 0.92 | 0.62 | 3.49 | −10.72 |
| Cu–CHA | |||||
|---|---|---|---|---|---|
| r9 | I-H2O (cage) ![[left over right harpoons]](https://www.rsc.org/images/entities/char_21cb.gif) II II |
−0.67 | 0.67 | −77.04 | 77.04 |
| r10 | II ![[left over right harpoons]](https://www.rsc.org/images/entities/char_21cb.gif) III III |
1.33 | 0.84 | −31.09 | −8.01 |
| r11 | III + H2O ![[left over right harpoons]](https://www.rsc.org/images/entities/char_21cb.gif) IV IV |
−1.19 | 1.19 | −99.77 | 99.77 |
| r12 | IV ![[left over right harpoons]](https://www.rsc.org/images/entities/char_21cb.gif) VI VI |
1.16 | 0.52 | −5.02 | −2.10 |
| r13 | VI + H2O ![[left over right harpoons]](https://www.rsc.org/images/entities/char_21cb.gif) VII VII |
−0.68 | 0.68 | −96.70 | 96.70 |
| r14 | VII ![[left over right harpoons]](https://www.rsc.org/images/entities/char_21cb.gif) VIII VIII |
1.88 | 1.63 | 3.61 | 8.25 |
| r15 | VIII + H2O ![[left over right harpoons]](https://www.rsc.org/images/entities/char_21cb.gif) IX IX |
−0.40 | 0.40 | −81.85 | 81.85 |
| r16 | IX → XII | 1.73 | 0.31 | −10.16 | 0.87 |
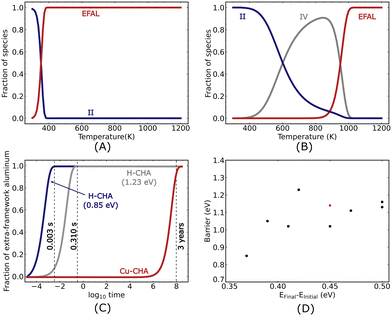
The microkinetic analysis is performed at a water partial pressure of 50 mbar. The temperature-dependent coverages are shown in Fig. 8(A) for 2H–CHA after 107 seconds. The surface is predominantly occupied by species II below 380 K, which refers to the state where one water molecule is adsorbed on the Brønsted acid site. This is a consequence of the strong adsorption of water on the Brønsted acid site (−0.73 eV). The fraction of species II decreases with increasing temperature, while the fraction of extra-framework aluminum species reaches unity. The switch in the dominant surface species occurs at about 380 K.
The temperature-dependent fraction of surface species for Cu–CHA is shown in Fig. 8(B) after 107 seconds. The dominant surface species is II below 600 K, IV at intermediate temperatures and extra-framework aluminum in the high-temperature limit. The low-temperature preference for II is a consequence of the relatively high adsorption energies (−1.19 eV). Similarly, the presence of IV is related to the high adsorption energies and high barriers for continuing the reaction. The appearance of the extra-framework aluminum species becomes noticeable at 900 K, indicating that the formation of extra-framework aluminum is favored only at high temperatures.
To facilitate the comparison between the two systems, we study the time dependence of the extra-framework aluminum formation at 923.15 K, Fig. 8(C). Specifically, we find that the coverage of extra-framework aluminum species in 2H–CHA becomes appreciable after 0.003 seconds, whereas the corresponding time is 108 seconds (3 years) for Cu–CHA. The comparison shows that the process of dealumination in Cu–CHA is slow as compared to 2H–CHA and that the presence of copper in the zeolite significantly influences the dealumination reaction.
The kinetics of the dealumination for 2H–CHA is largely determined by the first barrier. This is corroborated by a sensitivity analysis where the barrier for the different reactions is changed while keeping the thermodynamics fixed. Increasing the different barriers by 0.2 eV, we find that the evolution of the surface species is mainly dependent on the first hydrolysis step. Knowing that the first barrier mainly determines the kinetics for 2H–CHA, it is interesting to investigate the dependence of this barrier on the Al distribution. We calculated the barrier for the first hydrolysis step for 8 different Al configurations (see the ESI† for details). We find that the barrier is lowest (0.85 eV) when the Al atoms are placed on opposite sides of a 6-membered ring (two Si atoms apart). Higher barriers are calculated for configurations with one Al atom in the 6-membered ring and the other Al atom in an 8-membered ring with the highest barrier being 1.23 eV. The hydrolysis step is in these cases performed on the Brønsted site connected to the Al in the 6-membered ring. With the calculations for different Al distributions, we are able to establish a relationship, which shows the barrier of the reaction as a function of the difference in energy between the final and initial states of the reaction. The results are shown in Fig. 8(D).
As the Al distribution can result in a wide range of hydrolysis barriers, we simulate the evolution of the extra framework aluminum for different barriers. In Fig. 8(C), we show the time dependence of the extra framework aluminum formation at 923.15 K for the highest and lowest barriers associated with the first hydrolysis step. For the highest barrier (1.23 eV), we find that the formation of extra-framework aluminum becomes appreciable only after a duration of 0.3 seconds, which is a noticeable delay in the formation of extra-framework aluminum as compared to the case with the lowest barrier (0.85 eV). The delay demonstrates that the Al distribution clearly affects the rate of dealumination.
The reaction orders and apparent activation energies for dealumination in 2H–CHA and Cu–CHA were calculated to further characterize the kinetics of the dealumination. The reaction order was determined at the initial rise of the reaction rate curve, ensuring that the coverage of extra-framework aluminum is low. The reaction order for 2H–CHA was calculated to be 1.6 at a temperature of 295 K and in a pressure range between 50 mbar and 55 mbar, which is fairly close to the experimentally determined reaction order of 1.5 (at 773 K and in a pressure range between 10 mbar and 1 bar).11 The apparent activation energy of 2H–CHA was calculated to be 1.2 eV at a pressure of 50 mbar within a temperature range of 290 to 305 K. The apparent activation energy can largely be related to the first adsorption energy and first dealumination barrier. The calculated apparent activation energy is close to the experimental value of 1.09 eV reported by Sano et al. at 50 mbar and temperatures between 740 and 1000 K.8 The reaction order and apparent activation energy for Cu–CHA were calculated to be 4.7 (analyzed at 50–55 mbar and 820 K) and 2.6 eV (analyzed at 785–920 K at 50 mbar), respectively. The high apparent activation energy for Cu–CHA is related to the third reaction barrier together with the low barrier for the reversed second hydrolysis step, making IV the dominant species at intermediate temperatures (Fig. 8B).
4 Conclusion
Using density functional theory calculations in combination with ab initio thermodynamics and microkinetic modeling, we have investigated the dealumination mechanism in H–CHA and Cu–CHA. We find that the introduction of copper into the zeolite structure increases the barriers for dealumination compared to the H–CHA. Thus, the rate of dealumination is decreased in the presence of Cu. With Cu, some of the extra-framework Al species in the zeolite form bonds with the copper ions, resulting in Cu-bound Al species. The formation of copper-bound aluminum species is thermodynamically favorable compared to the formation of Al(OH)3H2O species. The reversibility of the formation of the Cu-bound Al species is an additional reason for a decreased rate of dealumination in the presence of Cu. We find that the formation of Al2O3 or Al2O3 + CuO is thermodynamically preferred with respect to the formation of extra-framework aluminum at high temperatures. The microkinetic model revealed a clear temperature difference in the onset of dealumination for H–CHA and Cu–CHA. In the case of H–CHA, the barrier for the first hydrolysis step was calculated for different Al distributions. The Al distribution was found to clearly affect the barrier, with a difference of ∼0.4 eV between the lowest and highest barriers. Our results rationalize the higher hydrothermal stability of Cu–CHA as compared to H–CHA and show that careful steering of the Al distribution is one route for increased hydrothermal stability.Conflicts of interest
There are no conflicts to declare.Acknowledgements
We acknowledge support from the European Union's Horizon 2020 Research and Innovation Programme under the Marie Sklodowska-Curie grant agreement no. 955839 (CHASS). Additional support from the Swedish Energy Agency (47110-1) is acknowledged. The calculations have been performed at C3SE (Göteborg) and NSC (Linköping) through a NAISS grant. The Competence Centre for Catalysis (KCK) is hosted by Chalmers University of Technology and financially supported by the Swedish Energy Agency (52689-1) and the member companies Johnson Matthey, Perstorp, Powercell, Preem, Scania CV, Umicore and Volvo Group.Notes and references
- A. M. Beale, F. Gao, I. Lezcano-Gonzalez, C. H. Peden and J. Szanyi, Chem. Soc. Rev., 2015, 44, 7371–7405 RSC.
- R. K. Srivastava, W. Neuffer, D. Grano, S. Khan, J. Staudt and W. Jozewicz, Environ. Prog., 2005, 24, 181–197 CrossRef CAS.
- F. Gao, J. H. Kwak, J. Szanyi and C. H. Peden, Top. Catal., 2013, 56, 1441–1459 CrossRef CAS.
- J. H. Kwak, R. G. Tonkyn, D. H. Kim, J. Szanyi and C. H. Peden, J. Catal., 2010, 275, 187–190 CrossRef CAS.
- S. J. Schmieg, S. H. Oh, C. H. Kim, D. B. Brown, J. H. Lee, C. H. Peden and D. H. Kim, Catal. Today, 2012, 184, 252–261 CrossRef CAS.
- R. E. Morris and P. Nachtigallet al., Zeolites in catalysis: properties and applications, Royal Society of Chemistry, 2017 Search PubMed.
- F. Gao and J. Szanyi, Appl. Catal., A, 2018, 560, 185–194 CrossRef CAS.
- T. Sano, H. Ikeya, T. Kasuno, Z. Wang, Y. Kawakami and K. Soga, Zeolites, 1997, 19, 80–86 CrossRef CAS.
- J. Luo, F. Gao, K. Kamasamudram, N. Currier, C. H. Peden and A. Yezerets, J. Catal., 2017, 348, 291–299 CrossRef CAS.
- S. M. Campbell, D. M. Bibby, J. M. Coddington, R. F. Howe and R. H. Meinhold, J. Catal., 1996, 161, 338–349 CrossRef CAS.
- T. Masuda, Y. Fujikata, S. R. Mukai and K. Hashimoto, Appl. Catal., A, 1998, 172, 73–83 CrossRef CAS.
- J. A. van Bokhoven, A. M. Van der Eerden and D. C. Koningsberger, J. Am. Chem. Soc., 2003, 125, 7435–7442 CrossRef CAS PubMed.
- D. L. Bhering, A. Ramírez-Solís and C. J. Mota, J. Phys. Chem. B, 2003, 107, 4342–4347 CrossRef CAS.
- K. Khivantsev, N. R. Jaegers, L. Kovarik, M. A. Derewinski, J.-H. Kwak and J. Szanyi, Molecules, 2022, 27, 2352 CrossRef CAS PubMed.
- G. Agostini, C. Lamberti, L. Palin, M. Milanesio, N. Danilina, B. Xu, M. Janousch and J. A. Van Bokhoven, J. Am. Chem. Soc., 2010, 132, 667–678 CrossRef CAS PubMed.
- Y. Xi, C. Su, N. A. Ottinger and Z. G. Liu, Appl. Catal., B, 2021, 284, 119749 CrossRef CAS.
- S. Malola, S. Svelle, F. L. Bleken and O. Swang, Angew. Chem., Int. Ed., 2012, 51, 652–655 CrossRef CAS PubMed.
- K. Stanciakova, B. Ensing, F. Goltl, R. E. Bulo and B. M. Weckhuysen, ACS Catal., 2019, 9, 5119–5135 CrossRef CAS.
- M.-C. Silaghi, C. Chizallet, J. Sauer and P. Raybaud, J. Catal., 2016, 339, 242–255 CrossRef CAS.
- M. Nielsen, A. Hafreager, R. Y. Brogaard, K. De Wispelaere, H. Falsig, P. Beato, V. Van Speybroeck and S. Svelle, Catal. Sci. Technol., 2019, 9, 3721–3725 RSC.
- D. W. Fickel and R. F. Lobo, J. Phys. Chem. C, 2010, 114, 1633–1640 CrossRef CAS.
- J. H. Kwak, D. Tran, S. D. Burton, J. Szanyi, J. H. Lee and C. H. Peden, J. Catal., 2012, 287, 203–209 CrossRef CAS.
- J. E. Schmidt, R. Oord, W. Guo, J. D. Poplawsky and B. M. Weckhuysen, Nat. Commun., 2017, 8, 1666 CrossRef PubMed.
- P. N. Vennestrøm, T. V. Janssens, A. Kustov, M. Grill, A. Puig-Molina, L. F. Lundegaard, R. R. Tiruvalam, P. Concepción and A. Corma, J. Catal., 2014, 309, 477–490 CrossRef.
- J. Song, Y. Wang, E. D. Walter, N. M. Washton, D. Mei, L. Kovarik, M. H. Engelhard, S. Prodinger, Y. Wang and C. H. Peden, et al. , ACS Catal., 2017, 7, 8214–8227 CrossRef CAS.
- G. Kresse and J. Hafner, Phys. Rev. B: Condens. Matter Mater. Phys., 1993, 48, 13115 CrossRef CAS PubMed.
- G. Kresse and J. Hafner, Phys. Rev. B: Condens. Matter Mater. Phys., 1994, 49, 14251 CrossRef CAS PubMed.
- G. Kresse and J. Furthmüller, Comput. Mater. Sci., 1996, 6, 15–50 CrossRef CAS.
- G. Kresse and J. Furthmüller, Phys. Rev. B: Condens. Matter Mater. Phys., 1996, 54, 11169 CrossRef CAS PubMed.
- P. E. Blöchl, Phys. Rev. B: Condens. Matter Mater. Phys., 1994, 50, 17953 CrossRef PubMed.
- G. Kresse and D. Joubert, Phys. Rev. B: Condens. Matter Mater. Phys., 1999, 59, 1758 CrossRef CAS.
- J. P. Perdew, K. Burke and M. Ernzerhof, Phys. Rev. Lett., 1996, 77, 3865 CrossRef CAS PubMed.
- S. Grimme, J. Antony, S. Ehrlich and H. Krieg, J. Chem. Phys., 2010, 132, year CrossRef PubMed.
- S. Grimme, S. Ehrlich and L. Goerigk, J. Comput. Chem., 2011, 32, 1456–1465 CrossRef CAS PubMed.
- L. Chen, T. V. Janssens and H. Grönbeck, Phys. Chem. Chem. Phys., 2019, 21, 10923–10930 RSC.
- L. Y. Isseroff and E. A. Carter, Phys. Rev. B: Condens. Matter Mater. Phys., 2012, 85, 235142 CrossRef.
- J. Heyd, G. E. Scuseria and M. Ernzerhof, J. Chem. Phys., 2003, 118, 8207–8215 CrossRef CAS.
- J. Heyd and G. E. Scuseria, J. Chem. Phys., 2004, 121, 1187–1192 CrossRef CAS PubMed.
- G. Mills, H. Jónsson and G. K. Schenter, Surf. Sci., 1995, 324, 305–337 CrossRef CAS.
- H. Jónsson, G. Mills and K. W. Jacobsen, Classical and quantum dynamics in condensed phase simulations, World Scientific, 1998, pp. 385–404 Search PubMed.
- G. Henkelman and H. Jónsson, J. Chem. Phys., 2000, 113, 9978–9985 CrossRef CAS.
- S. Nosé, J. Chem. Phys., 1984, 81, 511–519 CrossRef.
- S. Nosé, Mol. Phys., 1984, 52, 255–268 CrossRef.
- M. Jørgensen, L. Chen and H. Gronbeck, J. Phys. Chem. C, 2018, 122, 20351–20357 CrossRef.
- G. Piccini, M. Alessio, J. Sauer, Y. Zhi, Y. Liu, R. Kolvenbach, A. Jentys and J. A. Lercher, J. Phys. Chem. C, 2015, 119, 6128–6137 CrossRef CAS.
- A. Togo and I. Tanaka, Scr. Mater., 2015, 108, 1–5 CrossRef CAS.
- J. Rogal and K. Reuter, Ab initio atomistic thermodynamics for surfaces: A primer, in Experiment, Modeling and Simulation of Gas-Surface Interactions for Reactive Flows in Hypersonic Flights, Educational Notes RTO-EN-AVT-142, Paper 2, France: RTO, Neuilly-sur Seine, 2006, pp. 2-1–2-18 Search PubMed.
- I. Chorkendorff and J. W. Niemantsverdriet, Concepts of modern catalysis and kinetics, John Wiley & Sons, 2017 Search PubMed.
- H. Eyring, Chem. Rev., 1935, 17, 65–77 CrossRef CAS.
- R. Simancas, A. Chokkalingam, S. P. Elangovan, Z. Liu, T. Sano, K. Iyoki, T. Wakihara and T. Okubo, Chem. Sci., 2021, 12, 7677–7695 RSC.
- M. Nielsen, R. Y. Brogaard, H. Falsig, P. Beato, O. Swang and S. Svelle, ACS Catal., 2015, 5, 7131–7139 CrossRef CAS.
Footnote |
| † Electronic supplementary information (ESI) available: Results for dealumination with SAR = 35, thermodynamic results with a hybrid functional, hydrolysis barriers for different Al-distributions, and DFT optimized atomic structures. See DOI: https://doi.org/10.1039/d4cy00373j |
| This journal is © The Royal Society of Chemistry 2024 |


