
 Open Access Article
 This Open Access Article is licensed under a
 Creative Commons Attribution 3.0 Unported Licence
Enhancing the durability of Pt nanoparticles for water electrolysis using ultrathin SiO2 layers†
Ming
Li
ab,
Saeed
Saedy
 a,
Shilong
Fu
b,
Teise
Stellema
a,
Ruud
Kortlever
*b and
J. Ruud
van Ommen
a
a,
Shilong
Fu
b,
Teise
Stellema
a,
Ruud
Kortlever
*b and
J. Ruud
van Ommen
a
aDepartment of Chemical Engineering, Faculty of Applied Sciences, Delft University of Technology, Van der Maasweg 9, 2629 HZ, Delft, The Netherlands
bProcess & Energy Department, Faculty of Mechanical, Maritime and Materials Engineering, Delft University of Technology, Leeghwaterstraat 39, 2628 CB, Delft, The Netherlands. E-mail: R.Kortlever@tudelft.nl
First published on 26th January 2024
Abstract
Extending the lifetime of electrocatalytic materials is a major challenge in electrocatalysis. Here, we employ atomic layer deposition (ALD) to coat the surface of carbon black supported platinum nanoparticles (Pt/CB) with an ultra-thin layer of silicon dioxide (SiO2) to prevent deactivation of the catalyst during H2 evolution. Our results show that after an accelerated durability test (ADT) the current density at −0.2 V vs. reversible hydrogen electrode (RHE) of the unprotected Pt/CB catalyst was reduced by 34%. By contrast, after coating the Pt/CB catalyst with 2 SiO2 ALD cycles, the current density at the same potential was reduced by 7% after the ADT procedure, whereas when the Pt/CB sample was coated with 5 SiO2 ALD cycles, the current density was reduced by only 2% after the ADT. Characterization of the Pt particles after electrochemical testing shows that the average particle size of the uncoated Pt/CB catalyst increases by roughly 16% after the ADT, whereas it only increases by 3% for the Pt/CB catalyst coated with 5 cycles of SiO2 ALD. In addition, the coating also strongly reduces the detachment of Pt nanoparticles, as shown by a strong decrease in the Pt concentration in the electrolyte after the ADT. However, 20 cycles of SiO2 ALD coating results in an over-thick coating that has an inhibitory effect on the catalytic activity. In summary, we demonstrate that only a few cycles of SiO2 ALD can strongly improve the stability of Pt catalyst for the hydrogen evolution reaction.
Introduction
Hydrogen is a pivotal feedstock for the chemical industry and is one of the pillars of the energy transition, as it is a clean and sustainable energy carrier.1 Currently, the most widely used method for hydrogen production is natural gas reforming, which emits large amounts of CO2, relies on fossil inputs, and produces blue or grey hydrogen. When integrated with renewable electricity production, water electrolysis yields nearly no CO2 emissions during operation and produces green hydrogen.2 Platinum (Pt) is one of the most effective electrocatalysts for both water reduction to hydrogen in polymer electrolyte membrane (PEM) electrolyzers and hydrogen oxidation in PEM fuel cells. However, as a noble metal, its high costs and scarcity limit its application.To overcome these challenges, most of the research focusses on two potential solutions. The first approach is to decrease the Pt amount in the electrolyzer and improve the Pt utilization efficiency via decreasing the Pt particle size. For instance, Wan et al.3 confined sub-nanometer Pt clusters in hollow mesoporous carbon spheres to stabilize and immobilize the Pt clusters, enhancing the mass activity of the Pt catalyst. Additionally, Cheng et al.4 produced isolated single Pt atoms and clusters on a N-doped graphene substrate using atomic layer deposition (ALD) and found that these have a higher activity compared to commercial Pt/C catalysts. This is due to their small sizes and the unique electronic interaction between the adsorbed Pt single atoms and N-doped graphene. The second approach is to protect the Pt catalyst from degradation and prolong its lifetime. The Pt catalysts used for water electrolysis mainly degrade via dissolution, catalyst detachment, and agglomeration processes as deactivation mechanisms.1,5 Marichy et al.6 combined electrospinning, microwave-assisted synthesis, and ALD to synthesize Pt nanoparticles on carbon fibers with a SnO2 coating. They found that with the SnO2 coating, the Pt catalyst durability increased remarkably during voltage cycling between 0.6 V and 1.2 V vs. reversible hydrogen electrode (RHE) and that the activity towards the oxygen reduction reaction (ORR) increased slightly. The SnO2 layer lowered the corrosion of the carbon support and prevented the aggregation of Pt particles. Kim et al.7 found that a TiO2 coating can be used to enhance the activity and stability of Co/C catalysts for electrochemical water oxidation. The TiO2 coating can prevent the catalyst from sintering as it decorates the undercoordinated Co nanoparticles at defects, corners, and edges, protecting those sites. However, the intrinsic instability of these metal oxides coatings remains a concern when they are applied for protection under reductive potentials.8
SiO2 is stable under acidic (pH ≥ 2) as well as moderately alkaline (pH ≤ 10) conditions, and exhibits outstanding electrochemical stability under both reductive and oxidative potentials.9,10 Its high-temperature resistance is also outstanding, allowing it to remain stable up to 650 °C.11,12 This makes it a suitable material for catalyst protection and therefore it is already used for the protection of catalysts in thermochemical and photochemical processes. For example, Wang et al.13 used SiO2 to introduce a strong metal–support interaction with Cu catalysts and to stabilize these catalysts for hydrogenation reactions. Li et al.14 applied SiO2 to encapsulate cobalt oxide nanoparticles used as methane combustion catalyst. They found that the embedded CoOx@SiO2 catalyst showed superior performance compared to the bare supported CoOx@SiO2 catalyst. Trompoukis et al.15 used SiO2 to protect a Pt photocatalyst and found that the SiO2 can increase the minority carrier lifetimes and avoids the growth of thin interfacial oxide between the photoactive material and the catalyst. Takenaka et al.16 used an impregnation method to deposit different amounts of SiO2 on a Pt/CB electrocatalyst to increase the durability of this catalyst in a polymer electrolyte fuel cell (PEFC). However, due to the impregnation method they used, the lowest SiO2 coating loading achieved in the catalyst is 12.5 wt%, which, while considered low, still represents a relatively high percentage. While the durability of the catalyst used at the cathode is increased, the relatively thick SiO2 coating decreases the Pt/CB catalyst activity. Since SiO2 is more insulating than the metal oxides mentioned before, minimizing the coating thickness is crucial to maintain the electrical conductivity of the catalyst during electrocatalysis to avoid inactivate the catalyst. As such, very thin insulator films (thickness of <2 nm) are still conductive due to the tunneling effect, while very thick coatings will have a suppressive effect on the catalytic activity.17,18 To achieve a uniformly covered surface of the catalyst with an ultrathin coating, a gentle and delicate method with precise control at the nanometer scale is required. ALD is a suitable choice due to its sub-nanometer control over layer thickness, enabling the production of uniform and conformal coatings on various surfaces.19 Furthermore, investigating the impact of the SiO2 coating on the water splitting, rather than application in a PEFC, is also necessary.
In this work, we demonstrate the potential of ultrathin SiO2 coatings made via ALD to enhance the stability of commercial Pt on carbon black (Pt/CB) catalysts for the hydrogen evolution reaction. We find that an ultrathin SiO2 coating can efficiently provide a strongly protective effect, preventing the catalyst from agglomeration and detachment in accelerated durability tests (ADT). While the thickness of the protective layer has a stronger effect on catalyst performance than was previously recognized.
Experimental section
Materials
Silicon tetrachloride (SiCl4, 99%) was purchased from Alfa Aesar, isopropanol (≥98%) was purchased from Honeywell, Nafion™ perfluorinated resin solution (5 wt% in lower aliphatic alcohols and 15–20% water) and sulfuric acid (H2SO4, 95–97%) were purchased from Sigma-Aldrich. Deionized water with the resistivity of 18.2 MΩ were used as the co-reactant. 40 wt% of Pt on carbon black – Vulcan XC 72R catalyst was purchased from the FuelCell store. Glassy carbon rods and glassy carbon plates were ordered from HTW Hochtemperatur-Werkstoffe GmbH (Germany). The electrolyte solution was prepared from ultrapure water (Milli-Q IQ 7000, 18.2 MΩ). All chemicals were received and used without further purification.Catalyst synthesis
The SiO2 coatings on the catalyst were deposited in a custom-built flat substrate ALD reactor19–21 operating at atmospheric pressure. The reactor chamber consists of a metal cylinder with an inner diameter of 40 mm and a length of 190 mm, along with a substrate holder with dimensions of 30 mm by 125 mm. The deposition temperature was monitored and controlled using two thermocouples installed inside and outside wall of the ALD reactor to ensure an even temperature profile. We employed atmospheric pressure ALD here instead of vacuum ALD since at large scale it will reduce the investment costs and increase the throughput.20,21 The ALD procedure of SiO2 deposition is modified from the reported literature.22 Nevertheless, the time settings of the reaction and the precursor gas flow rate we used were different. In brief, SiCl4 and H2O serving as ALD reactants were kept in stainless-steel bubblers and evaporated at room temperature. N2, with a purity of 99.999%, was utilized as both the carrier and purging gas, and a gas flow of 0.5 L min−1 was used throughout the whole process. The gas flowed parallel to the surface of the substrate in the reactor. The samples were pre-treated under air plasma at room temperature and at 4 mbar pressure for 60 seconds using a Harrick plasma machine before each experiment. The ALD reactor was heated and maintained at 100 °C for the entire ALD process. 15 seconds pulses were used to introduce SiCl4 into the reactor, followed by 60 seconds purging with N2 and 30 seconds dosing of H2O vapor. After that, 60 seconds purging with N2 was used to finish a full ALD cycle. More detailed information on SiO2 ALD operation conditions can be found in Table S1.† Samples with different numbers of ALD cycles were obtained by repeating the ALD cycles for the required times. At the end of synthesis process, the reactor was purged with N2 flow for 15 minutes and cooled down to room temperature.Material characterization
The JEOL JEM1400 transmission electron microscope (TEM) operating at 120 kV voltage was employed to examine and analyze the microstructures and particle size distribution of various catalysts. To assess the crystal structure of the catalysts, X-ray diffraction (XRD) measurements were conducted utilizing a Bruker D8 advance diffractometer with Bragg–Brentano geometry and a Lynxeye position-sensitive detector. The X-ray was generated using Cu Kα radiation at 45 kV and 40 mA. The Pt concentration in the electrolyte was quantified using the inductively coupled plasma-optical emission spectrometry (ICP-OES) method, employing a PerkinElmer Optima 5300 DV ICP-OES instrument. X-ray photoelectron spectroscopy (XPS) measurements were performed employing a Thermo Scientific™ K-alpha™ (ThermoFisher™ Scientific) utilizing a monochromated X-ray of aluminum Kα radiation (1486.7 eV) with a spot size of 400 μm. For survey scans, a pass energy of 200 eV and a step size of 1 eV were used, while the high-resolution spectra were acquired with a pass energy of 50 eV and a step size of 0.1 eV. All peak positions were analyzed and calibrated, referencing the aliphatic C1s peak at 284.8 eV, using CasaXPS.Electrochemical measurements
The electrochemical measurements were conducted using a H-cell setup.23 The preparation of the working electrodes involved a drop-casting technique. Initially, a catalyst ink was created by mixing 4 mg of catalyst with 800 μL of deionized water, 150 μL of isopropanol, and 50 μL of Nafion perfluorinated resin solution. The mixture was sonicated in an ice bath for 1 hour. Subsequently, 50 μL of the catalyst ink was drop cast onto the glassy carbon electrode surface, repeating the process 4 times. The prepared working electrodes were coated with SiO2 using the ALD process, as described earlier, and subsequently used as working electrode. An Ag/AgCl electrode served as the reference electrode, while a graphite rod was utilized as the counter electrode. All potentials used in this work were converted to the RHE scale according to the equation:24| ERHE = EAg/AgCl + 0.197 + 0.059 × pH |
Results and discussion
A series of SiO2-coated Pt/CB samples was prepared using ALD and compared with the uncoated Pt/CB sample. The deposition procedure used to prepare the coated samples can be found in the experimental section and Table S1.† In summary, the SiCl4 vapor in a nitrogen stream and a humidified nitrogen stream was alternatingly fed into the home-built tubular flat substrate reactor25 to initiate the layer by layer growth of SiO2 on the surface of Pt/CB catalyst. By varying the number of coating cycles of the ALD process, the film thickness was changed accordingly. As can be seen in Fig. 1, the TEM images of the original Pt/CB catalyst indicate Pt nanoparticles of 3.2 ± 0.5 nm (number-averaged diameter ± standard deviation). Fig. 1 also shows that the average Pt particle size after SiO2 ALD does not change considerably. The average Pt size measured through TEM imaging remains 3.2 ± 0.5 nm and 3.2 ± 0.6 for the sample with 5 and 20 ALD cycles, respectively. Considering the reported growth per cycle of SiO2 using SiCl4 in the employed experimental conditions, which is around 2 Å per cycle,26,27 a very thin SiO2 layer is expected even after 20 cycles of ALD coating. We have conducted the TEM characterization towards the outmost layer of the 20 cycles ALD coated sample, as shown in Fig. S1.† The film thickness of this sample is around 5.8 nm after 20 cycles ALD. This leads to an estimated growth per cycle for SiO2 of 2.9 Å. | ||
| Fig. 1 TEM images and particle size distribution of Pt/CB catalysts before and after SiO2 ALD coating: (a and d) original Pt/CB without ALD coating; (b and e) Pt/CB catalyst after 5 cycles of SiO2 ALD coating, and (c and f) Pt/CB catalyst after 20 cycles of SiO2 ALD coating. | ||
X-ray diffraction (XRD) analysis of the original Pt/CB catalyst and of the Pt/CB catalyst after applying a variant number of ALD cycles of SiO2 coating were carried out to investigate the crystallinity of the catalysts. Fig. S2† shows that there is no significant distinction between the samples before and after SiO2 ALD. Two strong carbon peaks are observed in the diffractogram, whereas the Pt signal is relatively weak and only a small peak at 39.8° that represents the Pt(111) plane is observed. SiO2 peaks were not detected, as is expected since the SiO2 grown by ALD is mostly amorphous.28
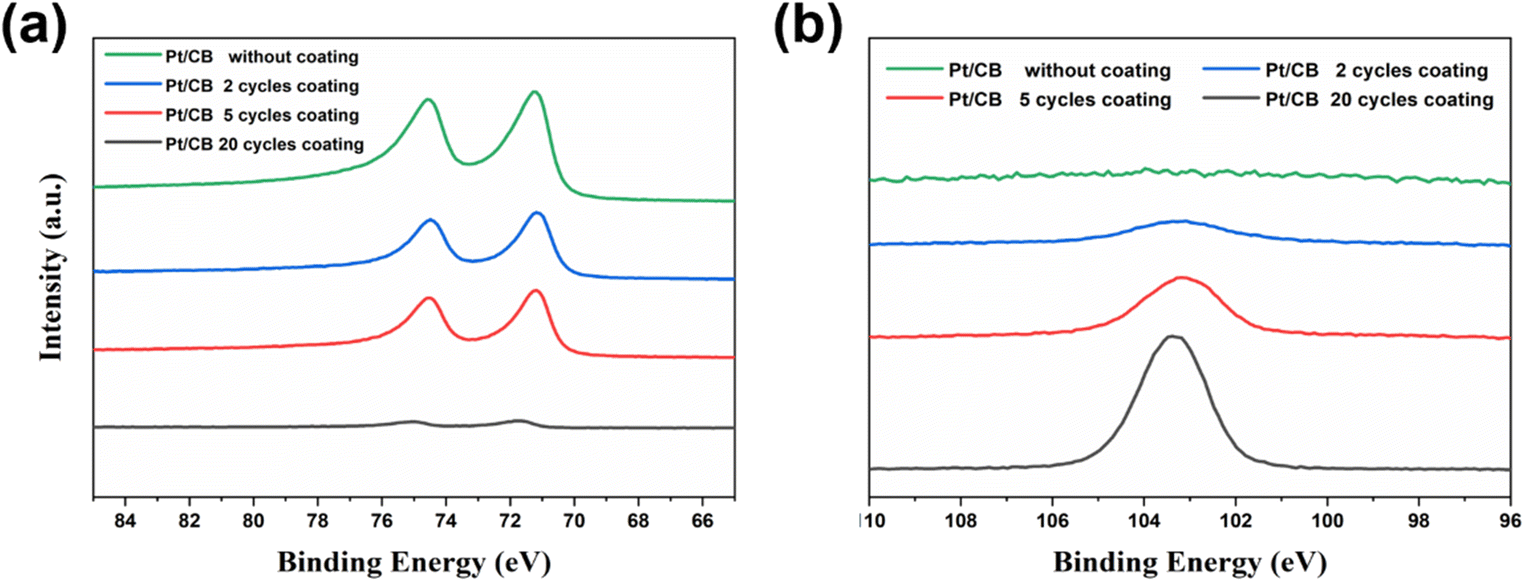
The uniform deposition of SiO2 on the surface of the catalyst is confirmed with SEM-EDS (Fig. 2). The color bar on the left side of the SEM-EDS maps (Fig. 2a–c) is an indicator of the Si Kα signal intensity in each sample. The SEM-EDS maps indicate that the surface concentration of Si increases with an increase in ALD cycles. It is worth noting that the EDS spectra also reveal a small peak of fluorine which originates from the Nafion™ polymer used as binder to stabilize the catalyst on the surface of the glassy carbon during the drop-casting process. XPS was employed to investigate the surface chemistry of the ALD coated Pt/CB samples. The Si 2p high-resolution spectra (Fig. S3†) suggest that Si in the studied samples exist in the SiO2 state and can be deconvoluted into Si 2p3/2 and Si 2p1/2. The Pt 4f peak intensity slightly diminishes as the number of ALD cycles increases from 2 to 5 cycles (Fig. 3a). However, it becomes vanishingly low after 20 cycles. This indicates a significant coating thickness of SiO2 after 20 cycles of ALD, which is further supported by the peak intensity of Si shown in Fig. 3b. The Si peak intensity exhibits a slight increase as the number of ALD cycles increases, with a sharp rise after 20 ALD cycles. The analysis depth of XPS is about 4 nm,29,30 and having a thicker SiO2 film can strongly attenuate the signal underneath. The very weak Pt 4f peak in the sample coated with 20 ALD cycles compared to the bare sample suggests that the SiO2 film is above 4 nm. In Fig. S4,† the SiO2 growth rate was characterized by XPS and EDS, respectively. Due to the detection depth variation of these two techniques,31 Fig. S4† shows different Si atomic percentages on the surface of the identical sample. However, both characterizations methods show a monotonic increase of the Si atomic percentage as a function of ALD cycles applied.
 | ||
| Fig. 2 SEM-EDS elemental mapping of the Pt/CB catalysts after SiO2 ALD coating, the color bar indicates the Si Kα signal intensity in each sample: (a–c) SEM images of Pt/CB catalysts after 2, 5, and 20 cycles of SiO2 ALD coating; (d and e) EDS spectra of Pt/CB catalysts with and without 20 cycles of SiO2 ALD coating. | ||
 | ||
| Fig. 3 The Pt and Si XPS spectra of the Pt/CB catalyst with and without SiO2 coating: (a) Pt 4f XPS spectra, (b) Si 2p XPS spectra. | ||
XPS line scanning was conducted to investigate the SiO2 uniformity on the catalyst surface. Photoelectron signals were collected from the scanning line through the whole catalyst region, extended to the bare surface of the glassy carbon substrate, and plotted as the function of the horizontal distance. As can be seen from Fig. 4, the surface concentration of Pt 4f, Si 2p, and O 1s reveals a step increase and decrease, indicating the region where the catalyst is drop casted.
 | ||
| Fig. 4 XPS line scan profiles of Pt/CB catalyst after SiO2 ALD coating: (a) 2 ALD cycles, (b) 5 ALD cycles, and (c) 20 ALD cycles of SiO2 coating. | ||
The Si 2p and O 1s signals follow the trend of the Pt 4f signal along the line. The C 1s signal shows a trough in the catalyst spot region, stemming from the emerging SiO2 coverage and the higher Pt atomic percentage in the catalyst region. The Si concentration on the surface of the drop casted catalyst area is significantly higher than on the bare glassy carbon substrate at the edges and increases with the number of ALD cycles. A similar trend can also be seen for the O 1s signal. This observation suggests that the SiO2 growth rate is much higher on the catalyst surface than on the glassy carbon substrate, and results in selective deposition of SiO2 on the surface of the Pt/CB catalyst. Two crossover XPS line scans in every sample show comparable results in the X and Y axis, indicating the homogeneity of the catalyst region on the glassy carbon substrate (see Fig. S5†).
To further investigate the SiO2 distribution on the catalyst area and the glassy carbon substrate, XPS area scans were conducted (Fig. S6 and S7†). The area scan reveals that Pt is homogeneously dispersed over the catalyst region and there is no Si signal detected on the surface of the original Pt/CB catalyst (Fig. S6†). After 5 SiO2 ALD cycles, the Si 2p signal is clearly visible in Fig. S7† and aligns with Pt/CB region. This again indicates selective deposition of SiO2 on the catalyst surface rather than on the glassy carbon substrate.
The effect of different thicknesses of SiO2 coating on the Pt stability during electrochemical hydrogen evolution was evaluated in a H-cell using a 0.5 M H2SO4 electrolyte. ADT of the catalysts were conducted similar to literature procedures.32,33 In brief, cyclic voltammograms were recorded with a scan rate of 50 mV s−1 from 0.35 V to −0.20 V vs. RHE for 1000 cycles. Linear sweep voltammograms (LSV) were recorded before and after the ADT to measure the catalytic activity of the electrode toward hydrogen evolution (Fig. 5). For the Pt/CB catalyst without ALD coating, the current density at −0.20 V vs. RHE was reduced by 34% in the water reduction potential range after the ADT. By contrast, the catalyst coated with 2 ALD cycles of SiO2 showed a current density reduction at the same voltage of only 7% after the same ADT procedure. After applying 5 cycles of SiO2 ALD, the catalyst current density was merely reduced by 2% after the ADT. The Nyquist plots shown in Fig. S8† indicate that the charge transfer resistance between the catalysts with and without 5 cycles of ALD coating is comparable. This means that the SiO2 coating didn't hinder the proton transfer to the Pt catalyst within 5 cycles of ALD coating. However, 20 cycles of SiO2 deposition showed an inhibitory effect on the catalytic activity, with a 65% decrease in the HER activity compared to the uncoated sample. This indicates that 20 cycles of ALD results in a too thick SiO2 layer, possibly hindering the electron transfer and suppressing the HER. However, the HER activity of the sample coated with 20 ALD cycles of SiO2 increased 94% post ADT. Zhuravlev34 summarized that the surface hydroxyl groups in SiO2 can form due to the rehydroxylation of SiO2 in aqueous solutions, and the surface SiO2 atoms' free valence tend to become saturated with hydroxyl groups in aqueous medium. This process can also happen on our SiO2 layer, especially during the ADT process. Kang et al.35 reported that the silicon hydroxide deposited on the surface of anion-exchange membrane can drastically increase the proton transport number in the membrane. We hypothesize that the increase of silanol groups on the surface of SiO2 during ADT helps to improve proton transfer in relatively thick SiO2 layers. Consequently, this process partially restores the HER activity and increases the current density of the 20 cycles coated sample after the ADT procedure.
 | ||
| Fig. 5 Linear sweep voltammogram (LSV) curves of the Pt/CB catalysts before and after accelerated durability tests: (a) original catalyst, Pt/CB catalyst coated with SiO2 using (b) 2 ALD cycles, (c) 5 ALD cycles, and (d) 20 ALD cycles. | ||
The particle size distribution (PSD) analysis (shown in Fig. 6) of Pt/CB catalysts before and after the ADT tests demonstrates that the average particle size of the Pt/CB catalyst without ALD coating increased from 3.2 ± 0.5 nm to 3.7 ± 0.7 nm after the ADT, an increase of 16%. In comparison, the particle size of the Pt particles only increased from 3.2 ± 0.5 nm to 3.3 ± 0.6 nm after being protected by 5 cycles of SiO2 ALD coating, an increase of 3% after the ADT. This proves that the SiO2 coating prevents catalyst growth/agglomeration during the ADT, which is one of the main deactivation mechanisms of Pt electrocatalysts during water electrolysis. Fig. S9† further displays the Pt particle size evolution from TEM imaging after the ADT. Also, Fig. S10 and S11† show that without SiO2 ALD coating, the bare Pt/CB catalyst surface becomes rougher, and cavities can be seen on the catalyst surface. However, with SiO2 ALD, the surface of the catalyst before and after the ADT remains nearly similar. The electrolyte after the ADT was collected and analyzed by ICP-OES to measure the Pt concentration in the electrolyte before and after the ADT, and the resulting data is summarized in Table 1. Before the ADT, the Pt concentration in the electrolyte is near 0 mg L−1. During the ADT, the Pt/CB catalyst gradually degrades, and we observed an increase in Pt concentration to 8.9 mg L−1 in the Pt/CB sample without ALD coating after ADT. However, after applying 2 cycles of SiO2 ALD, the Pt concentration in the electrolyte reduced to 4.1 mg L−1 post ADT. Applying 5 cycles of SiO2 coating further decreased the Pt concentration in the electrolyte to 1.9 mg L−1. Nevertheless, continuing to increase the ALD coating to 20 cycles only caused a minor decrease in Pt concentration and did not significantly enhance the protection effect. This might be due to the crack formation on the relatively thick coating during the ADT process decreasing its protection ability.36 This process can take place since the flexibility of SiO2 decreases as the thickness increases and it has very low coefficient of expansion.37 This implies that simply increasing ALD cycles to further reduce the Pt detachment after ADT is very challenging. The electrochemical oxidation potential of Pt is above 1.2 V vs. RHE.38 Hence, Pt leaching during the ADT process should be negligible. The main mechanism for the Pt concentration increase after the ADT process should therefore be Pt detachment from the Pt/CB catalyst or catalyst peel off from the electrode. Overall, we show that the ultrathin SiO2 layers deposited via ALD can be used to strongly reduce the Pt catalyst agglomeration and detachment during water splitting reaction.
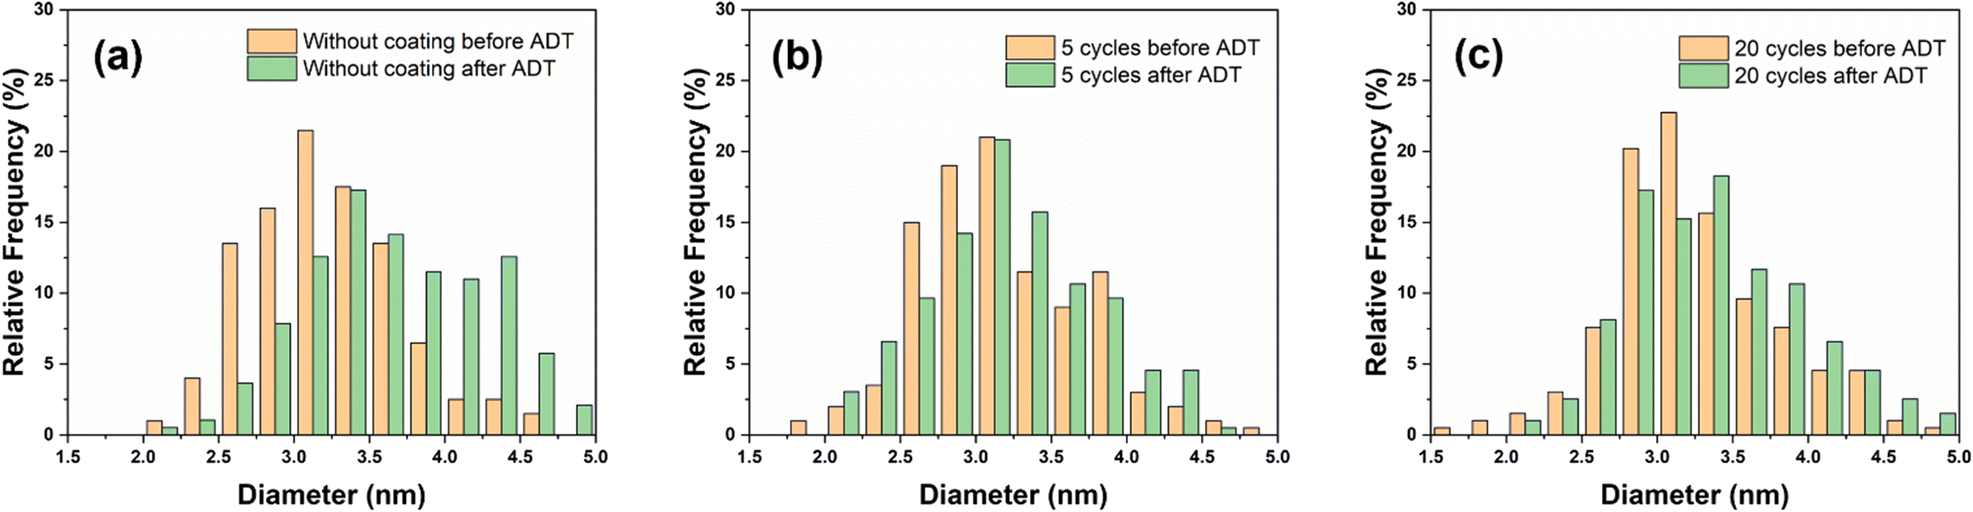 | ||
| Fig. 6 Particle size distribution of the Pt/CB catalyst before and after ADT: (a) original catalyst, Pt/CB catalyst coated with SiO2 using (b) 5 ALD cycles, (c) 20 ALD cycles. | ||
| Sample | Pt concentration (mg L−1) |
|---|---|
| Fresh 0.5 M H2SO4 electrolyte | <0,02 |
| Pt/CB without ALD coating | 8.94 |
| Pt/CB with 2 cycles coating | 4.11 |
| Pt/CB with 5 cycles coating | 1.94 |
| Pt/CB with 20 cycles coating | 1.48 |
Conclusions
ALD was employed to coat the surface of Pt/CB electrocatalysts with an ultrathin layer of SiO2 to prevent deactivation during water electrolysis. Our findings show that without SiO2 coating, the current density of the untreated Pt/CB catalyst was reduced by 34% at −0.2 V vs. RHE after an ADT. However, after coating the Pt/CB catalyst with 2 SiO2 ALD cycles, the current density was only reduced by 7% under the same conditions. With 5 SiO2 ALD cycles, the current density decrease was 2%. The Pt particle size increased by 16% after ADT without SiO2 coating, but only by 3% after being protected by 5 cycles of SiO2 deposition. Additionally, we observed severe Pt detachment after the ADT in the Pt/CB catalyst without ALD coating, with the Pt concentration in the electrolyte increasing to 8.9 mg L−1 after ADT. The Pt detachment can be alleviated by the ultrathin SiO2 coating synthesized by ALD. After applying 5 cycles of SiO2 ALD, the Pt detachment/dissolution was reduced to one-fifth compared to the sample without ALD coating. In summary, a nanoscale SiO2 protective layer strongly reduces Pt agglomeration and detachment during the hydrogen evolution reaction in acidic conditions. By performing just a few ALD cycles, keeping this coating ultrathin, an inhibitory effect on the electrocatalytic activity is avoided.Author contributions
M. Li: conceptualization, methodology, formal analysis, validation, writing – original draft. S. Saedy: conceptualization, formal analysis, visualization, writing – review & editing. S. Fu: methodology, resources, investigation, writing – review & editing. T. Stellema: data curation, methodology, formal analysis, validation, visualization. R. Kortlever: supervision, writing – review & editing, project administration J. R. van Ommen: supervision, writing – review & editing, funding acquisition.Conflicts of interest
There are no conflicts to declare.Acknowledgements
M. L. and S. F. acknowledge the PhD scholarship awarded by the China Scholarship Council (CSC). The authors thank Mojgan Talebi for the help in the lab, Bart Boshuizen for the XPS line scan and XPS area scan training, Ruud Hendrikx for the XRD testing and Baukje Terpstra for the ICP-OES analysis.References
- H. Jin, B. Ruqia, Y. Park, H. J. Kim, H. S. Oh, S. I. Choi and K. Lee, Adv. Energy Mater., 2020, 11, 2003188 CrossRef.
- D. Merki and X. Hu, Energy Environ. Sci., 2011, 4, 3878–3888 RSC.
- X. K. Wan, H. B. Wu, B. Y. Guan, D. Luan and X. W. D. Lou, Adv. Mater., 2020, 32, e1901349 CrossRef PubMed.
- N. Cheng, S. Stambula, D. Wang, M. N. Banis, J. Liu, A. Riese, B. Xiao, R. Li, T. K. Sham, L. M. Liu, G. A. Botton and X. Sun, Nat. Commun., 2016, 7, 13638 CrossRef CAS.
- S. Cherevko, N. Kulyk and K. J. J. Mayrhofer, Nano Energy, 2016, 29, 275–298 CrossRef CAS.
- C. Marichy, G. Ercolano, G. Caputo, M. G. Willinger, D. Jones, J. Rozière, N. Pinna and S. Cavaliere, J. Mater. Chem. A, 2016, 4, 969–975 RSC.
- H. J. Kim, D. H. K. Jackson, J. Lee, Y. Guan, T. F. Kuech and G. W. Huber, ACS Catal., 2015, 5, 3463–3469 CrossRef CAS.
- Y. Shao, J. Liu, Y. Wang and Y. Lin, J. Mater. Chem., 2009, 19, 46–59 RSC.
- Z. Liu, V. Bode, P. Hadayati, H. Onay and E. J. R. Sudhölter, Fuel, 2020, 280, 118650 CrossRef CAS.
- S. Ghanbari, E. Kazemzadeh, M. Soleymani and A. Naderifar, Colloid Polym. Sci., 2015, 294, 381–388 CrossRef.
- Z. W. Liwei Wang, H. Yang and G. Yang, Materials Science Commuication, 1998, 57, 260–263 Search PubMed.
- M. Liehr, J. E. Lewis and G. W. Rubloff, J. Vac. Sci. Technol., A, 1987, 5, 1559–1562 CrossRef CAS.
- S. Wang, K. Feng, D. Zhang, D. Yang, M. Xiao, C. Zhang, L. He, B. Yan, G. A. Ozin and W. Sun, Adv. Sci., 2022, 9, e2104972 CrossRef PubMed.
- L. Li, H. Chen, C. Zhang and Z. Fei, Mol. Catal., 2019, 469, 155–160 CrossRef CAS.
- C. Trompoukis, J.-Y. Feng, T. Bosserez, J. Rongé, J. Dendooven, C. Detavernier, R. Baets and J. A. Martens, Sustainable Energy Fuels, 2021, 5, 3115–3123 RSC.
- S. Takenaka, H. Matsumori, H. Matsune and M. Kishida, Appl. Catal., A, 2011, 409–410, 248–256 CrossRef CAS.
- W. C.-Y. Ma, H.-S. Hsu, C.-C. Fang, C.-Y. Jao and T.-H. Liao, Thin Solid Films, 2018, 660, 926–930 CrossRef CAS.
- K. Kato, T. Mori, Y. Morita, T. Matsukawa, M. Takenaka and S. Takagi, Appl. Phys. Express, 2020, 13, 074004 CrossRef CAS.
- H. Van Bui, F. Grillo and J. R. van Ommen, Chem. Commun., 2016, 53, 45–71 RSC.
- K. S. Yoo, D.-G. Kim, S. Lee, W.-B. Lee and J.-S. Park, Ceram. Int., 2022, 48, 18803–18810 CrossRef CAS.
- D. H. Levy, D. Freeman, S. F. Nelson, P. J. Cowdery-Corvan and L. M. Irving, Appl. Phys. Lett., 2008, 92, 192101 CrossRef.
- D. La Zara, F. Sun, F. Zhang, F. Franek, K. Balogh Sivars, J. Horndahl, S. Bates, M. Brannstrom, P. Ewing, M. J. Quayle, G. Petersson, S. Folestad and J. R. van Ommen, ACS Nano, 2021, 15, 6684–6698 CrossRef CAS PubMed.
- P. N. Pintauro and J. R. Bontha, J. Appl. Electrochem., 1991, 21, 799–804 CrossRef CAS.
- L. Wang, C.-Y. Lee and P. Schmuki, J. Mater. Chem. A, 2013, 1, 212–215 RSC.
- A. Santoso, A. Damen, J. R. van Ommen and V. van Steijn, Chem. Commun., 2022, 58, 10805–10808 RSC.
- Y. Du, X. Du and S. M. George, Thin Solid Films, 2005, 491, 43–53 CrossRef CAS.
- J. W. Klaus, O. Sneh and S. M. George, Science, 1997, 278, 1934–1936 CrossRef CAS PubMed.
- J. Guo, D. Benz, T.-T. Doan Nguyen, P.-H. Nguyen, T.-L. Thi Le, H.-H. Nguyen, D. La Zara, B. Liang, H. T. Hintzen, J. R. van Ommen and H. Van Bui, Appl. Surf. Sci., 2020, 530, 147244 CrossRef CAS.
- T. A. Carlson and G. E. McGuire, J. Electron Spectrosc. Relat. Phenom., 1972, 73, 161–168 CrossRef.
- B. R. Strohmeier, Surf. Interface Anal., 1990, 15, 51–56 CrossRef CAS.
- K. Rokosz, T. Hryniewicz, D. Matysek, S. Raaen, J. Valicek, L. Dudek and M. Harnicarova, Materials, 2016, 9, 318 CrossRef PubMed.
- M. Smiljanić, M. Bele, F. Ruiz-Zepeda, M. Šala, A. Kroflič and N. Hodnik, Electrochim. Acta, 2021, 400, 139435 CrossRef.
- Y. Lai, Z. Zhang, Z. Zhang, Y. Tan, L. Yu, W. Wu, Z. Wang, T. Jiang, S. Gao and N. Cheng, Chem. Eng. J., 2022, 435, 135102 CrossRef CAS.
- L. T. Zhuravlev, Colloids Surf., A, 1999, 173(2000), 1–38 Search PubMed.
- M. S. Kang, Y. J. Choi, H. J. Lee and S. H. Moon, J. Colloid Interface Sci., 2004, 273, 523–532 CrossRef CAS PubMed.
- M. Putkonen, M. Bosund, O. M. E. Ylivaara, R. L. Puurunen, L. Kilpi, H. Ronkainen, S. Sintonen, S. Ali, H. Lipsanen, X. Liu, E. Haimi, S.-P. Hannula, T. Sajavaara, I. Buchanan, E. Karwacki and M. Vähä-Nissi, Thin Solid Films, 2014, 558, 93–98 CrossRef CAS.
- H. Shan, X. Wang, F. Shi, J. Yan, J. Yu and B. Ding, ACS Appl. Mater. Interfaces, 2017, 9, 18966–18976 CrossRef CAS PubMed.
- S. Bawari, T. N. Narayanan and J. Mondal, Electrochem. Commun., 2023, 147, 107440 CrossRef CAS.
Footnote |
| † Electronic supplementary information (ESI) available. See DOI: https://doi.org/10.1039/d3cy00996c |
| This journal is © The Royal Society of Chemistry 2024 |