
 Open Access Article
 This Open Access Article is licensed under a
 Creative Commons Attribution 3.0 Unported Licence
Strongly-confined colloidal lead-halide perovskite quantum dots: from synthesis to applications
Junzhi
Ye
 a,
Deepika
Gaur
b,
Chenjia
Mi
c,
Zijian
Chen
d,
Iago López
Fernández
b,
Haitao
Zhao
d,
Yitong
Dong
c,
Lakshminarayana
Polavarapu
*b and
Robert L. Z.
Hoye
*a
a,
Deepika
Gaur
b,
Chenjia
Mi
c,
Zijian
Chen
d,
Iago López
Fernández
b,
Haitao
Zhao
d,
Yitong
Dong
c,
Lakshminarayana
Polavarapu
*b and
Robert L. Z.
Hoye
*a
aInorganic Chemistry Laboratory, Department of Chemistry, University of Oxford, South Parks Road, Oxford, OX1 3QR, UK. E-mail: robert.hoye@chem.ox.ac.uk
bCINBIO, Universidade de Vigo, Materials Chemistry and Physics Group, Department of Physical Chemistry Campus Universitario As Lagoas, Marcosende 36310, Vigo, Spain. E-mail: lakshmi@uvigo.es
cDepartment of Chemistry and Biochemistry, The University of Oklahoma, Norman, Oklahoma 73019, USA
dCentre for Intelligent and Biomimetic Systems, Shenzhen Institutes of Advanced Technology, Chinese Academy of Sciences, Shenzhen, 440305, China
First published on 19th June 2024
Abstract
Colloidal semiconductor nanocrystals enable the realization and exploitation of quantum phenomena in a controlled manner, and can be scaled up for commercial uses. These materials have become important for a wide range of applications, from ultrahigh definition displays, to solar cells, quantum computing, bioimaging, optical communications, and many more. Over the last decade, lead-halide perovskite nanocrystals have rapidly gained prominence as efficient semiconductors. Although the majority of studies have focused on large nanocrystals in the weak- to intermediate-confinement regime, quantum dots (QDs) in the strongly-confined regime (with sizes smaller than the Bohr diameter, which ranges from 4–12 nm for lead-halide perovskites) offer unique opportunities, including polarized light emission and color-pure, stable luminescence in the region that is unattainable by perovskites with single-halide compositions. In this tutorial review, we bring together the latest insights into this emerging and rapidly growing area, focusing on the synthesis, steady-state optical properties (including exciton fine-structure splitting), and transient kinetics (including hot carrier cooling) of strongly-confined perovskite QDs. We also discuss recent advances in their applications, including single photon emission for quantum technologies, as well as light-emitting diodes. We finish with our perspectives on future challenges and opportunities for strongly-confined QDs, particularly around improving the control over monodispersity and stability, important fundamental questions on the photophysics, and paths forward to improve the performance of perovskite QDs in light-emitting diodes.
 Junzhi Ye and Robert Hoye | Junzhi Ye is a Postdoctoral Research Associate in the Hoye Group at the University of Oxford (2023–2024). He completed his Doctor of Philosophy in Physics at the Cavendish Laboratory, Department of Physics at the University of Cambridge (2019–2022). His research focused on utilizing advanced ultrafast spectroscopies to develop novel optoelectronic materials and devices. Robert Hoye is an Associate Professor in the Department of Chemistry at the University of Oxford. There, he also holds a Royal Academy of Engineering Senior Research Fellowship, and is a Fellow of St. John's College. He completed his PhD at the University of Cambridge (2012–2014), before working as a postdoctoral researcher at the Massachusetts Institute of Technology (2015–2016). He subsequently received two College Research Fellowships at Cambridge, firstly at Magdalene College (2016–2019), then at Downing College (2019–2020), before taking up a Lectureship at Imperial College London in 2020. He moved to Oxford in 2022. His research focusses on defect-tolerant semiconductors, and their development into optoelectronic devices. |
 Deepika Gaur, Lakshminarayana Polavarapu and Iago López-Fernández | Deepika Gaur is currently research assistant in Materials Chemistry and Physics group at the University of Vigo, Spain. She received her PhD in 2023 from NorthCap University, India and MSc degree in Physics in 2014 from the J. C. Bose University of Science and Technology University, India. Her research is focused on halide perovskite nanocrystal optoelectronics (Solar cells and LEDs). Iago López-Fernández obtained Master's Degree from the University of Vigo and the University of Santiago. Currently, he is a PhD student in Materials chemistry and Physics group and his research is focused on the synthesis and modulation of doped perovskite nanoparticles for their use in LEDs, solar cells, and infrared detectors. Lakshminarayana Polavarapu is the principal investigator of the Materials chemistry and physics research group at the Centro De Investigaciones Biomédicas (CINBIO), University of Vigo. He obtained an MSc in Chemistry from the University of Hyderabad (India) and PhD from the National University of Singapore. After being a postdoctoral fellow at CIC biomaGUNE and University of Vigo in Spain, he joined the Chair for Photonics and Optoelectronics at the Ludwig-Maximilians-University of Munich (Germany) as an Alexander von Humboldt postdoctoral fellow and later continued as a junior group leader until May 2020. His research interests include shape-controlled synthesis and self-assembly of metal and semiconductor nanocrystals for exploring their optical properties and optoelectronic applications. |
 Chenjia Mi and Yitong Dong | Chenjia Mi is a Postdoctoral Fellow in the Dong Lab in the Department of Chemistry and Biochemistry, studying perovskite quantum dot as single photon emitters. He received his PhD in Chemistry from Michigan State University with Dr Remi Beaulac, studying the photophysics of excited state quantum dots with optical spectroscopy. He then did a postdoctoral appointment with Prof. Tom Hamann in the same university working on solar energy conversion before he moved to Oklahoma. Yitong Dong is an Assistant Professor in the Department of Chemistry and Biochemistry at the University of Oklahoma. He received his PhD at Texas A&M University in 2018, before working as a postdoctoral researcher at the University of Toronto from 2018 to 2021. He moved to Oklahoma in 2021 and started his independent career focusses on synthesis of colloidal nanocrystals and development of single photon emitters. |
 Haitao Zhao and Zijian Chen | Dr Haitao Zhao is a CAS Pioneer Hundred Professor at Shenzhen Institutes of Advanced Technology, Chinese Academy of Sciences (CAS). He completed his doctoral degree in chemical and environmental engineering from the University of Nottingham. Since completing his doctorate, Dr Zhao has conducted research in postdoctoral roles at various institutions, including at Zhejiang University and Massachusetts Institute of Technology. He continued his research at the Chinese Academy of Sciences in 2020. He is conducting interdisciplinary research on development of data-driven energy materials innovation based on data mining, high-throughput DFT calculations, machine learning, robot chemist or in situ characterization emerging techniques for accelerating energy materials discovery and building the functional materials interfaces genome project. The overarching project aims to develop an Industry 4.0 approach, revolutionizing the conventional material R&D method using advanced Human-AI-Robots collaboration technologies, which could unlock the rapid development of novel energy materials. Zijian Chen obtained his BS (2019) from Nanjing Agricultural University. Currently, he continues to pursue his joint PhD degree at the University of Nottingham Ningbo China and Shenzhen Institute of Advanced Technology, Chinese Academy of Sciences. His research focuses on data-driven perovskite materials synthesis and application. |
Key learning points1. Size- and shape-controlled synthesis, from 3D nanocrystals to 0D quantum dots, including traditional batch-based methods, and emerging data-driven high-throughput approaches.2. Fundamental optical properties of strongly-confined 0D quantum dots, as compared to bulk-like 3D halide perovskite nanocrystals, including polarized light emission and exciton fine structure splitting. 3. Size-dependent exciton relaxation/recombination properties of quantum dots in terms of dark and bright excitons. 4. Single-particle optical properties of quantum dots in terms of spectral line widths, photoluminescence blinking and single-photon emission. 5. Development of perovskite quantum dot LEDs, and strategies to improve efficiency and stability. |
1. Introduction
Colloidal nanocrystals (NCs) have played a key role in the emergence and commercial applications of nanoscience and nanotechnology.1,2 Using accessible wet-chemistry methods, with similarities to organometallic synthesis, these inorganic compounds with an organic shell can be made with precisely controlled size, shape, and composition.2–4 By reducing the size of these nanocrystals below a critical value (Bohr diameter), the density of electronic states changes from continuous (as for a bulk material) to discrete (Fig. 1(a)), with electrons and holes more strongly confined spatially, changing free carriers or weakly-bound excitons into strongly-bound excitons.5,6 As such, nanocrystals have been described as ‘artificial atoms’,2 and offer a facile way to realize the effects seen in quantum mechanics (e.g., ‘electron in a box’, or quantum confinement) in practice. But the implications go well beyond fundamental studies. Quantum confinement in colloidal nanocrystals enables high photoluminescence quantum yields (PLQYs), along with size-dependent tuning of the emission energy and exciton binding energy.7 Colloidal nanocrystals are therefore widely used in optoelectronics, for example, as the downconverter in ultrahigh definition displays, and in light-emitting diodes (LEDs), lasers, photocatalysis, photovoltaics (PVs) and photodetectors (PDs).8 Colloidal nanocrystals emitting in the short wavelength infrared range (SWIR, 1000–2000 nm) can be made with high quantum yields, making them suited for biomedical applications.9 Furthermore, colloidal nanocrystals can be deposited onto flexible polymer substrates by low temperature solution processing, which is appealing for thin film transistors10 and flexible radiation detectors for wearable medical imaging devices.11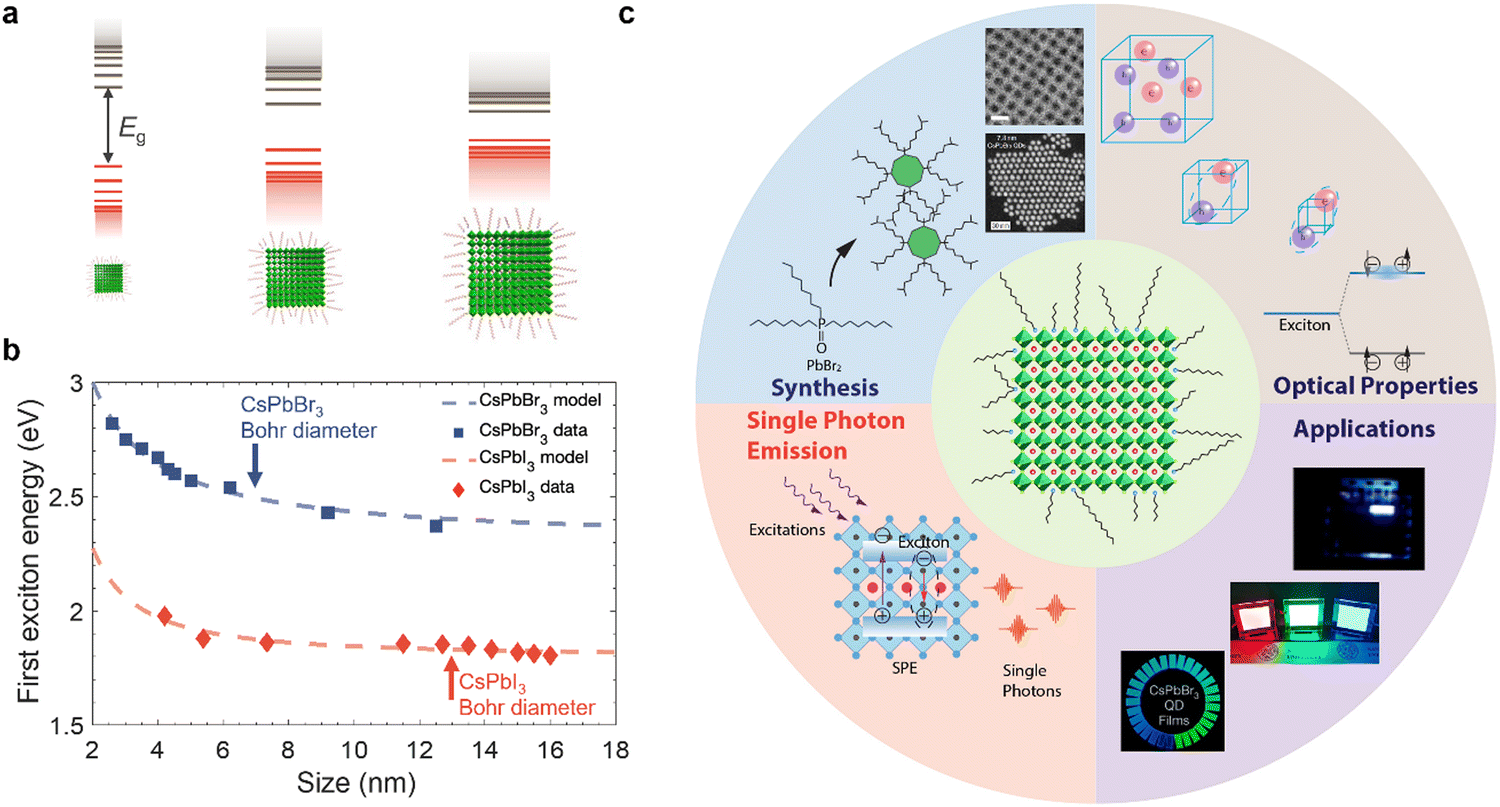 | ||
| Fig. 1 (a) Illustration of how the band structure of materials changes as quantum confinement increases due to reductions in nanocrystal size below the Bohr diameter. Image of nanocrystals obtained from ref. 12. Copyright 2020, Elsevier. (b) Variation in the energy between the ground state and first excited state with the size of CsPbX3 (X = Br, I) nanocrystals. Data obtained from ref. 13–18. Model fit is based on an empirical effective mass approximation model.19 The Bohr diameters (i.e., twice the Bohr radii, a0) of CsPbBr3 and CsPbI3 are indicated.19–21 (c) Scope of this tutorial review, covering size-controlled synthesis, optical properties (steady-state and kinetics), single photon emission and applications of strongly-confined lead-halide perovskite quantum dots. The figures used inset are reproduced with permission from ref. 22–24. Copyright 2022, The American Association for the Advancement of Science. Copyright 2022, The Author(s), under exclusive license to Springer Nature Limited. Copyright 2018, American Chemical Society. | ||
Historically, colloidal NC research has focused on chalcogenides, oxides, III–V semiconductors, as well as metals.4,25 In the optoelectronics community, lead-halide perovskites (LHPs) are a recent addition, but have rapidly risen to prominence owing to their exceptional performance.26,27 LHPs have the general formula APbX3, in which Pb2+ cations are octahedrally coordinated with X species (halide anions: Cl−, Br− or I−). These PbX6 octahedra share corners to form a 3D symmetric unit cell (cubic, tetragonal or orthorhombic), provided that an A-site monovalent cation of the right size (e.g., methylammonium) fits into the cuboctahedral hole. Although the work on LHPs began as early as the 1800s,28 these materials were only demonstrated for solar cells and reported in 2009,29 and their potential for achieving efficient PVs was not appreciated until a couple of years later.30,31 These early works on PVs focused on LHPs in thin film form, and thin film perovskites were also used in the first demonstration of light-emitting diodes (LEDs) operating at room temperature in 2014.32 It was not until 2014/2015 that the first reports of highly luminescent LHP colloidal NCs were made.19,33 Since these early demonstrations, there have been an exponentially growing number of reports on the size- and shape-controlled synthesis of LHPs of a variety of compositions, along with investigations into their charge-carrier kinetics, and applications in optoelectronics. There have been many reviews covering LHP nanocrystals, some of which are ref. 7, 27 and 34–36. However, the majority of research papers and reviews thus far have focused on LHP nanocrystals in the weak- to intermediate-confinement regime, where the size is above the Bohr diameter. Many more exciting properties and opportunities can be accessed if we reduce the size below the Bohr diameter, i.e., in the strong confinement regime.
The Bohr diameter is twice the Bohr radius (a0), which is defined as the distance between the electron and the hole in ground state excitons.37 For LHPs, the Bohr diameter is typically estimated by theoretical calculations using the effective mass model (eqn (1)):
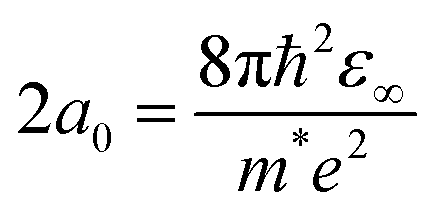 | (1) |
In eqn (1), ε∞ is the electronic dielectric constant, and m* is the reduced carrier (electron and hole) effective mass. For example, the Bohr diameter is in the range of 5–12 nm for CsPbX3 (where X = Cl−, Br− or I−) and 4–10 nm for MAPbX3 (X = I−, Br−).19–21 When the size (edge length or diameter) of the LHP is smaller than the Bohr diameter, the nanocrystals are considered to be strongly confined and are often referred to as zero-dimensional (0D) quantum dots (QDs). The exciton Bohr diameter can be determined experimentally by observing how the absorption or photoluminescence spectra of the QDs change with size. When the size of the QD exceeds its exciton Bohr diameter, there will be negligible changes to the photoluminescence peak center.38 This is an effective and simple experimental method to determine the exciton Bohr diameter of the materials. Furthermore, by reducing the size of the inorganic nanocrystals, but still using the same long-chain organic ligands, the electric field lines of the charges extend into the organic shell. The significantly lower dielectric constant of the organic layer than the inorganic core results in reduced screening. This results in stronger electrostatic attraction between the electrons and holes, leading to further increases in the exciton binding energy.39 This is known as dielectric confinement.
Strongly-confined perovskite QDs have many important applications in next-generation ultra-high definition displays, optical communications, bioimaging, quantum computing, and more.40–44 This is because of the many important and intriguing phenomena that are opened up through strong quantum and dielectric confinement, which enable properties that are not obtained in the weak-to-intermediate confinement regime. A common phenomenon is the increase in the energy splitting between the ground state and the first excited state of the exciton. The ability to blue-shift the emission of LHPs (Fig. 1(b)) by simply reducing the size enables the realization of nanocrystals emitting in the UV, blue, or orange/red wavelength ranges without having to use mixed anion/cation compositions that would phase-separate under light illumination or with an electric field, and this is important for display and lighting applications.45,46 Strongly-confined perovskite QDs can also enable greater color saturation, which can lead to displays that cover a wider color gamut than weakly-confined emitters.40,47–51 Strong confinement also leads to enhanced splitting of the dark singlet and bright triplet excitons, which, if coupled with an anisotropic structure, can lead to polarized light emission, which is important for optical communications, bioimaging, and 3D displays.52 Furthermore, size confinement enhances exciton–exciton annihilation, which increases the likelihood of achieving single photon emission and could lead to the application of these materials in quantum computing. Over the past two years in particular,53 there have been many advances in the development, synthesis, and applications of strongly-confined perovskite QDs, and it is important to capture the progress, challenges, and future opportunities of this growing area, especially recent efforts to realize applications that go beyond what could be achieved with weakly-confined NCs.
In this tutorial review, we will discuss the latest insights into the challenges of reliably achieving ultrasmall perovskite QDs with high monodispersity, and the advances in synthesis methods realized to overcome these challenges, along with their optical properties and applications to LEDs (overview in Fig. 1(c)). This includes colloidal synthesis as well as our perspectives on how machine learning and high-throughput methods (including flow synthesis) could be used to accelerate the optimization of QD synthesis. Next, we discuss how changing the confinement regime of the nanocrystals influences the steady-state optical properties and the kinetics of both hot carriers and cold band-edge charge-carriers. We follow this with a discussion of the latest advances in applying these strongly-confined QDs in single-photon emitters and LEDs. Finally, we discuss the key challenges in this growing field, and how they could be addressed.
2. Size-controlled synthesis of colloidal metal-halide perovskites from bulk-like or weakly-confined nanocrystals (NCs) to strongly-confined QDs
A key cornerstone in the development of colloidal NCs is realizing their synthesis using facile methods,3 bringing together inorganic materials synthesis with organometallic chemistry. A wide variety of colloidal synthesis methods have been developed, which were also adapted for LHP NC synthesis over the past decade. The vast majority of these approaches are batch synthesis methods, namely ligand-assisted reprecipitation (LARP; Fig. 2(a)), or hot injection (HI; Fig. 2(b)). This section discusses how these synthesis methods have been adapted to reliably obtain strongly-confined LHP QDs, as well as the potential to apply continuous flow synthesis methods and data-driven approaches to accelerate their development.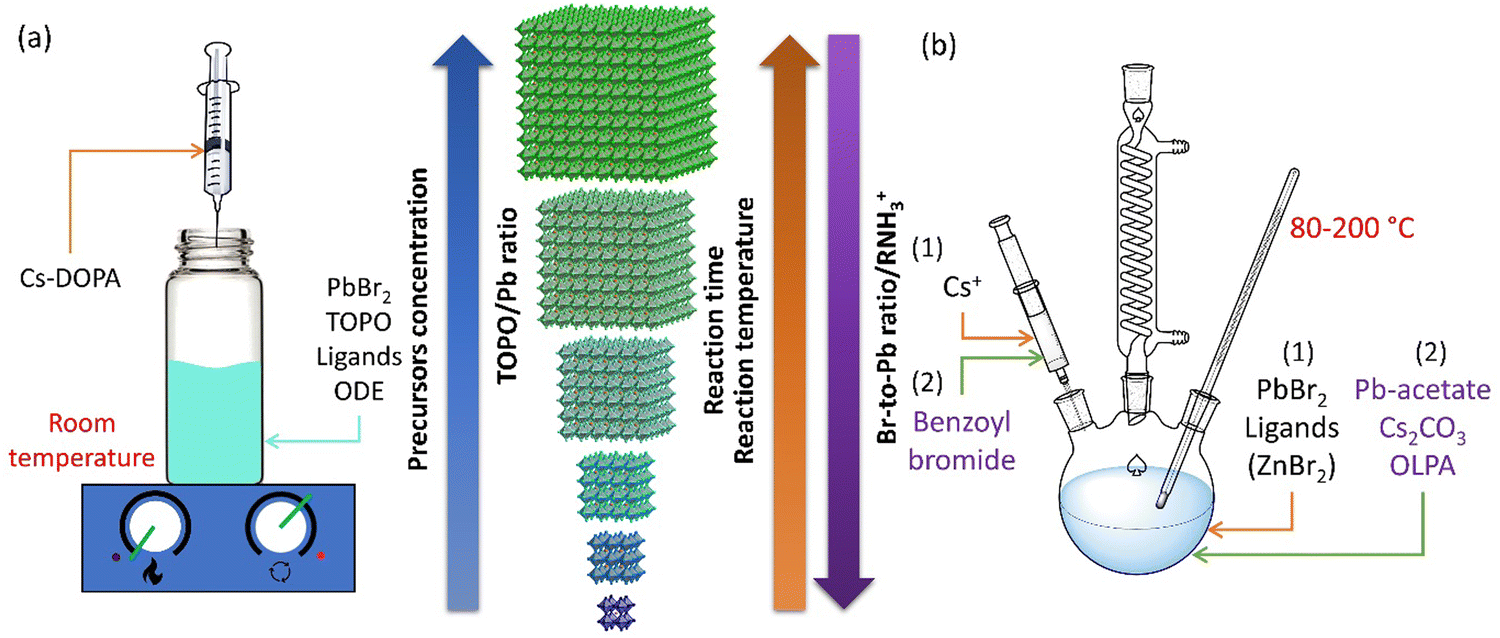 | ||
| Fig. 2 Size-controlled synthesis of APbX3 QDs (A = Cl, Br, I; A = MA, FA, Cs) by (a) room temperature crystallization,23 where the size of the QDs decreases with a decrease in the concentration of the precursors (e.g., Cs-DOPA and PbBr2) or ligands (e.g., TOPO), and (b) hot injection synthesis, where the size of the QDs decrease with increasing halide/Pb ratio,24,54 increasing alkylammonium halide concentration,55 decreasing reaction time,17 or decreasing reaction temperature.19,56,57 Cs-DOPA: cesium-diisooctylphosphinate; TOPO: trioctylphosphine oxide; ODE: octadecene; OLPA: oleylphosphonic acid. | ||
2.1. Tuning reaction parameters in batch synthesis to control the size-dependent properties of perovskite QDs
Over the years, a wide range of synthetic methods have been developed for colloidal halide perovskite NCs of different morphologies and compositions. For more details, interested readers are referred to previous reviews.27,34,53,58–63 Among all synthesis methods, HI and LARP have been the most widely used in the size- and shape-controlled synthesis of halide perovskite NCs. In particular, HI synthesis offers better shape control and size distribution of LHP NCs compared to LARP.27,34 The HI method was initially used for the synthesis of monodisperse colloidal CdE (E = sulfur, selenium, tellurium) QDs in 1993 by Bawendi and co-workers.3 This involved the rapid mixing of precursors in air- and moisture-free conditions to induce supersaturation and the formation of NCs at a controlled temperature, before terminating the growth in all directions by using long-chain organic ligands.3 Later, this synthesis approach was extended to a variety of other colloidal nanocrystals including lead chalcogenides, gold, silver, etc.,3,64,65 and recently to LHP NCs as well.14,19,34 Using this approach, Protesescu et al.19 first demonstrated the synthesis of monodisperse CsPbX3 (X = Cl, Br or I) NCs with size tunability in the range of 4–15 nm. But instead of varying the growth time (as generally used for metal chalcogenide QDs), the reaction temperature was varied in the range of 140–200 °C.3,4,66 Later, this approach was also applied to the synthesis of FAPbBr3 NCs in the size range of 5–12 nm.57,67 As the reaction temperature decreases, the size of the CsPbX3 NCs decreases, and thus the emission spectra blue shifts, and this enables the exploration of quantum size effects in CsPbX3 NCs.19 For instance, as the size of CsPbBr3 NCs approaches its exciton Bohr diameter (∼7 nm), the bandgap slightly increases (emission peak blue shifts) in comparison with its bulk counterpart, and increases nonlinearly as the size further decreases below its Bohr diameter due to strong quantum confinement of excitons (Fig. 1(b)).19 In addition, the exciton peaks of the NCs gets sharper as their size decreases down to the strong confinement regime, which is similar to the behavior of II–VI and III–V colloidal QDs. However, tuning the size of APbX3 NCs in the strong confinement regime without affecting the morphology is extremely challenging because HI synthesis often results in the formation of 2D nanoplatelets at reduced temperatures.56,59,68 For instance, Bekenstein et al.68 found that the morphology changes from cubic to nanoplatelets as the temperature in the HI synthesis reduced from 150 to 130 °C. The thickness of the nanoplatelets is tuneable down to one unit cell thickness by further decreasing the reaction temperature. Thus, HI synthesis yields either 0D nanocubes or 2D nanoplatelets at relatively low temperature, however, their precise selectivity (2D vs. 0D QDs) is yet to be fully understood.27,34,59 A recent report by Otero-Martínez et al.56 demonstrated that the morphology of CsPbBr3 initially changes from bulk-like 3D nanocubes to strongly-confined 0D nanocubes by decreasing the reaction temperature from ∼175 to 100 °C, while the reaction yields 2D nanoplatelets at temperatures below 100 °C. On the other hand, the size of FAPbBr3 is precisely tunable in the size range of 14–3 nm (exciton Bohr diameter of FAPbBr3 is ∼7 nm69) by decreasing the reaction temperature in between 200–50 °C, whereas nanoplatelets were observed in room temperature synthesis.56 It should be noted that HI synthesis at intermediate temperatures often results in the formation of a mixture of 0D nanocubes and nanoplatelets and their separation requires further purification steps. In contrast to typical HI synthesis, all the precursors can also be mixed in octadecene and heated to 143 °C to obtain strongly-confined ∼3 nm CsPbBr3 QDs emitting at ∼460 nm wavelength with a PLQY of 68%. However, size control was not demonstrated by this approach.70To achieve better size control in the quantum confinement regime of LHP NCs, HI synthesis has been altered by reagents and ligands to have better control over nucleation and growth, which is critical in determining the final morphology. In this regard, Dong et al.24 reported a robust approach for preparing strongly-confined 0D CsPbBr3 QDs with excellent control over their size and ensemble uniformity based on the thermodynamic equilibrium of Br rather than reaction kinetics. This is one of the most widely used methods in the literature for the preparation of strongly-confined CsPbBr3 QDs.16,54,71,72 The thermodynamic equilibrium between the Br in the QD lattice and the reaction medium can be controlled by varying the ratio of Br/Pb (for fixed concentrations of Cs and Pb) with the addition of ZnBr2, and through the reaction temperature (Fig. 2(b)). A negative correlation between the bromide concentration [Br−] in the reactant mixture vs. QD size was observed (Fig. 3(a)–(e)). This is consistent with the relative increase of Br− concentration on the surface with a decrease in the size of the NCs, as they possess PbBr4 surface composition.73 The size of the NCs decreased also as the reaction temperature was reduced. Thus, to obtain strongly-confined QDs, the increase of Br− concentration should be accompanied by a lowering of the reaction temperature.
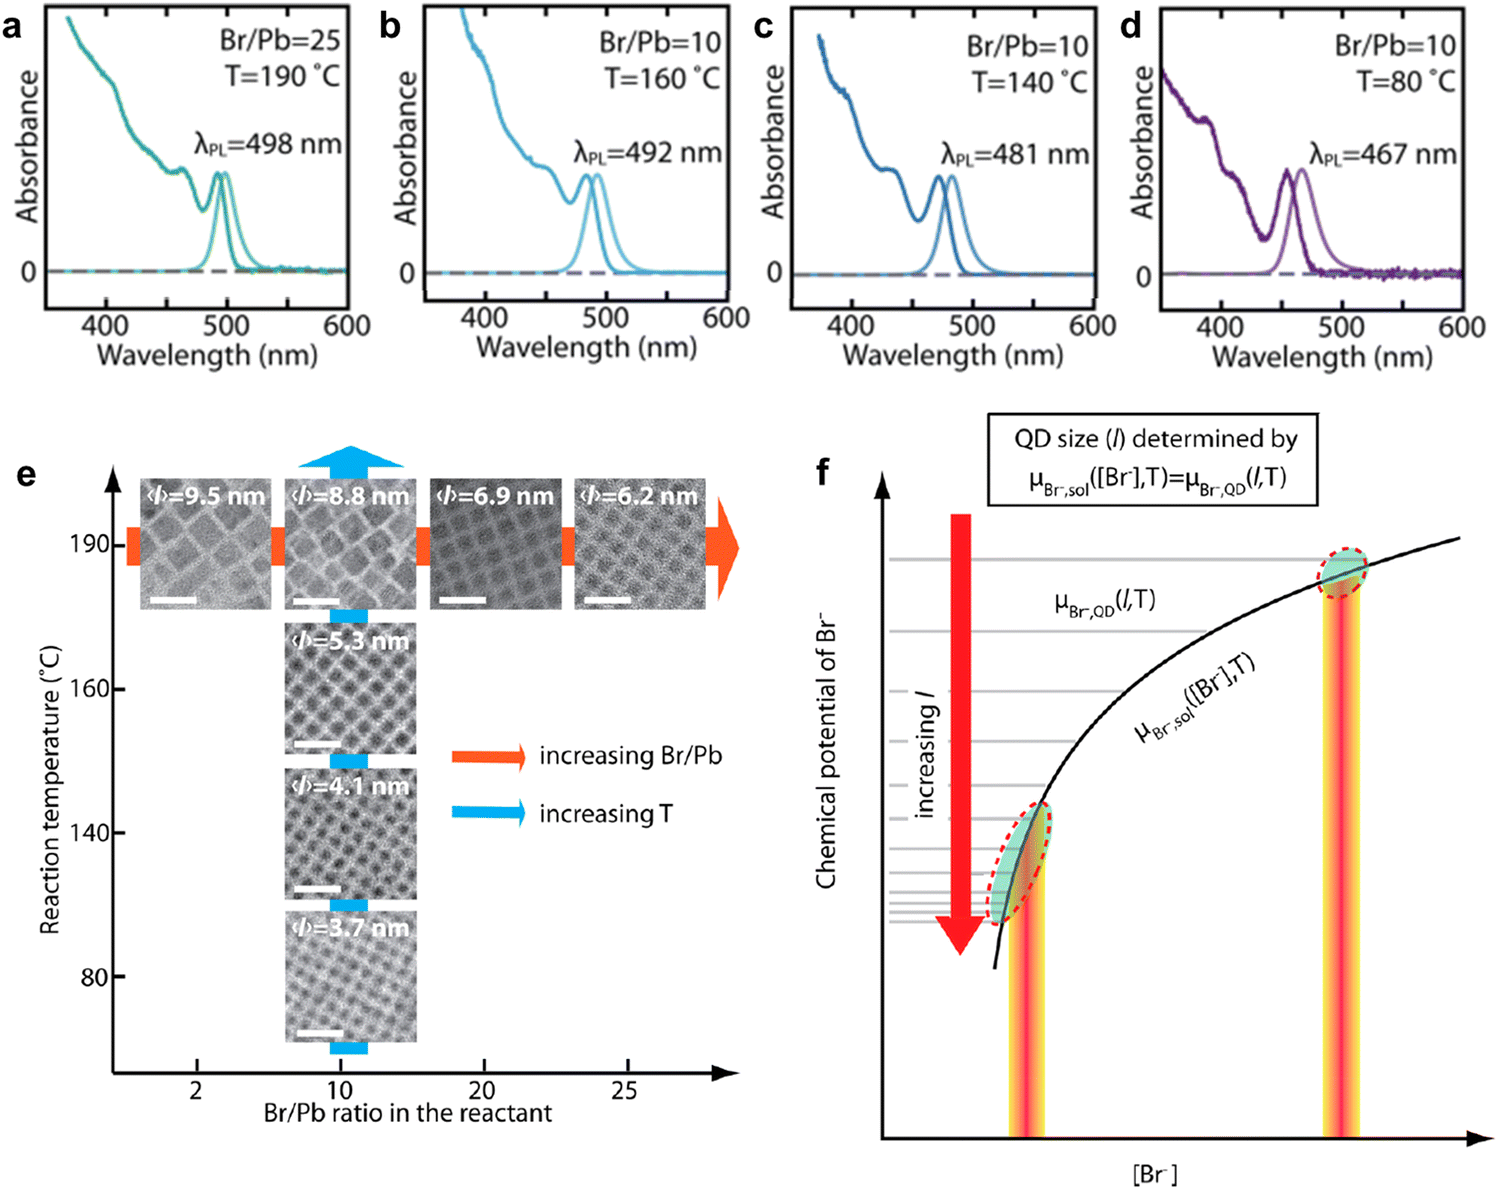 | ||
| Fig. 3 (a)–(d) Absorption and PL spectra of CsPbBr3 QDs obtained at different ratios of Br/Pb and at different reaction temperatures. The PL spectra blueshifts due to a decrease in QD size, and therefore stronger confinement. The combination of high Br/Pb ratio and low reaction temperature results in strongly-confined QDs. (e) The evolution of colloidal NCs from bulk-like 3D nanocrystals to strongly-confined QDs with Br/Pb ratio and reaction temperature. The average sizes of the QDs are provided on the TEM images. (f) A theoretical model illustration based on the equilibrium of Br− concentration [Br−] between the QD lattice and solution medium for the determination of the QD size (l) for a given ([Br−]) and temperature (T), where the chemical potentials of Br− in the QD (μBr−, QD, horizontal lines for different l) and in the reaction medium (μBr−, sol, black curve) are equal. Reproduced from ref. 24. Copyright 2018, American Chemical Society. | ||
Thus, CsPbBr3 QDs with a size range of 6.2–3.7 nm can be synthesized by varying [Br−] and reaction temperature (Fig. 3(a)–(e)). It should be noted that the QD size increases with increasing reaction temperature for a fixed Br/Pb ratio (Fig. 3(a)–(e)). In addition, the uniformity of the QDs increases as the size decreases with an increase in [Br−]. Furthermore, it was found that the 0D QDs exhibited XRD patterns that were nearly identical to those of 3D NCs prepared without ZnBr2, apart from the expected broadening of the peaks for small QDs.24 The size control of the QDs was attributed to the thermodynamic equilibrium between the [Br−] in the reaction medium and QD lattice. Time-dependent PL measurements revealed that in the presence of excess [Br−], the redshift of PL with reaction time saturates much faster as compared to the case without ZnBr2 (1 s vs. 25 s). The emission wavelength remains unaltered when the Br− equilibrium controls the terminal QD size. However, the PL intensity keeps increasing with the reaction time until the reaction is quenched. This suggests that the particle size is independent of growth time and that the number of particles of the same size increased over time. Based on these experimental results, a theoretical model was proposed based on the [Br−] equilibrium (in terms of chemical potentials, μBr−) between the QD lattice and reaction medium to determine the size of the QDs, which is illustrated in Fig. 3(f). According to this model, the control of QD size (l) with the [Br−] satisfies the chemical potential equilibrium equation provided in Fig. 3(f). The theory is consistent with the negative correlation between [Br−] and QD size, and is consistent with the higher uniformity in QD size when there is excess [Br−] (see the circled area in Fig. 3(f)).24
Besides, a few other approaches have been found to be effective in controlling the size of strongly-confined CsPbBr3 QDs.27,55,74–76 In particular, alkylammonium bromide-assisted size tuning enabled the synthesis of CsPbBr3 NCs in the size range of ∼17.5–3.8 nm with ∼1 nm precision in the size simply by changing the concentration of added alkylammonium bromide without having to adjust the reaction temperature.55 Increasing the concentration of alkylammonium bromide results in a decrease in the size from 17.5 nm 3D NCs to strongly-confined 3.8 nm QDs, and thus the emission of CsPbBr3 NCs is tunable from 510 nm to 465 nm. This approach was further extended to size tuning of CsPbCl3 NCs in the size range of 25–6 nm. However, the mechanism behind this excellent size-tuning is yet to be clearly understood. It was found that the increase of PbBr2 in the reaction medium does not affect the size of the NCs, therefore, the authors of this work proposed that the alkylammonium cations bind strongly to the surfaces by replacing Cs+ atoms and thus restricting the growth to obtain QDs at higher alkylammonium bromide concentrations.55 However, it should be noted that the alkylammonium bromide is also a source of Br, but the effects of an increase in the chemical potential of Br on size-tuning are unclear. In contrast, a report by Almeida et al.75 showed that increasing the concentration of the alkylammonium cation in the HI synthesis of CsPbBr3 NCs results in the formation of strongly-confined NPLs rather than QDs. The concentration of the alkylammonium cation is controllable by the acid–base chemistry of oleylamine (OLm) and oleic acid (OA), leading to the formation of oleylammonium and oleate. Therefore, the concentration of the ammonium cation functional group increases not only with increasing OA concentration but with also a lowering of the reaction temperature. At higher temperatures, the deprotonation of the ammonium cation results in an increase in the concentration of the reactants. Thus, HI synthesis yields NPLs at higher OA concentration and lower temperatures, whereas it yields strongly-confined QDs at lower OA concentration. A size range of 16.4 to 4 nm was achieved for CsPbBr3 NCs by varying the ligand concentration and temperature.75 These studies suggest that the morphology control from NPLs to QDs is very sensitive to reaction parameters, therefore, future studies should be focused on in-depth understanding of the role of ligands in shape control.
Despite significant progress in size-controlled synthesis, the OLm and OA ligands binding to LHP NCs are highly dynamic and detach from the surface during antisolvent-induced purification.45,77,78 Various ligands that strongly bind to LHP NC surfaces have been exploited to obtain stable NCs by in situ synthesis, as well as post-synthetic ligand exchange. For instance, the native OLm–OA ligands of CsPbBr3 QDs synthesized with excess ZnBr2 were replaced with didodecyldimethylammonium bromide (DDAB) by post-synthetic surface treatment, and this is known to be a strong binding ligand.43 The resultant QDs showed excellent monodispersity and were self-assembled into large-area QD superlattices with unusual rhombic packing.43 Stable LHP QDs can also be directly synthesized using ligands that bind strongly to the surfaces. In this regard, oleylphosphonic acid (OLPA) was shown to enable the size-controlled synthesis of CsPbBr3 NCs in the size range of 9.2 to 5 nm with over 80% PLQY.17 The size tunability was achieved through growth time (45 to 600 seconds at 100 °C) rather than reaction temperature or ligand concentration that were used in other methods discussed above. This suggests that the crystal growth is rather slow in the presence of OLPA as compared to the OLm–OA ligand pair. The OLPA-capped QDs are colloidally stable at ambient conditions even at very low concentrations (1 nM). The stability was attributed to the high solubility of OLPA in apolar solvents, and thus it prevents NC aggregation through reversible binding/unbinding to/from the NC surface. Moreover, the OLPA-capped QDs exhibit quasi-spherical polyhedral morphology (truncated octahedron) in contrast to the typical cubic morphology of OLm–OA capped NCs. Interestingly, the OLPA-capped spherical QDs exhibit peaks at higher energy excitonic transition, similar to that of II–VI colloidal QDs.17
Furthermore, a recent study demonstrated control over nucleation and growth of CsPbBr3 perovskite QDs at room temperature using trioctylphosphine oxide ligands that solubilize the PbBr2 and Cs-DOPA (diisooctylphosphinate acid) precursors. The reaction kinetics of both nucleation and growth can be substantially slowed down from <1 s (using OLm–OA ligands) to ∼30 min by varying the equilibrium between the PbBr2 precursor and the Cs[PbBr3] in the reaction medium (Fig. 4(a)). This enables the spectral evolution of CsPbBr3 NCs to be monitored as they grow from 3.1 nm QDs to 13 nm bulk NCs (Fig. 4(b)–(d)). Thus, monodisperse CsPbBr3 NCs can be isolated from different times during synthesis, and the parent ligands can be exchanged with lecithin to obtain stable colloidal QDs with spherical-like morphology similar to that of OLPA-capped QDs. The size of the CsPbBr3 NCs is tunable either by dilution (concentration of Cs-DOPA) or TOPO as they control the rate of reaction and terminal size. These results reveal that the size of NCs decreases and reaction speed increases upon dilution, whereas decreasing the TOPO concentration results in a decrease in the size of the NCs, but the reaction rate remains unchanged. This approach is also applicable to hybrid perovskite QDs (Fig. 4(e) and (f)). The 0D QDs prepared using trioctylphosphine oxide ligands exhibit several higher-order excitonic transitions in their linear absorption spectra, which are similar to that of classical chalcogenide QDs. Such clear higher energy optical transitions were not observed in strongly-confined cubic shape QDs. This was attributed to the perturbation that coupled the spherical states of different angular momenta in cubic symmetry.23 This leads to splitting of the higher-order absorption states, which result in flat absorption spectra at higher energy.
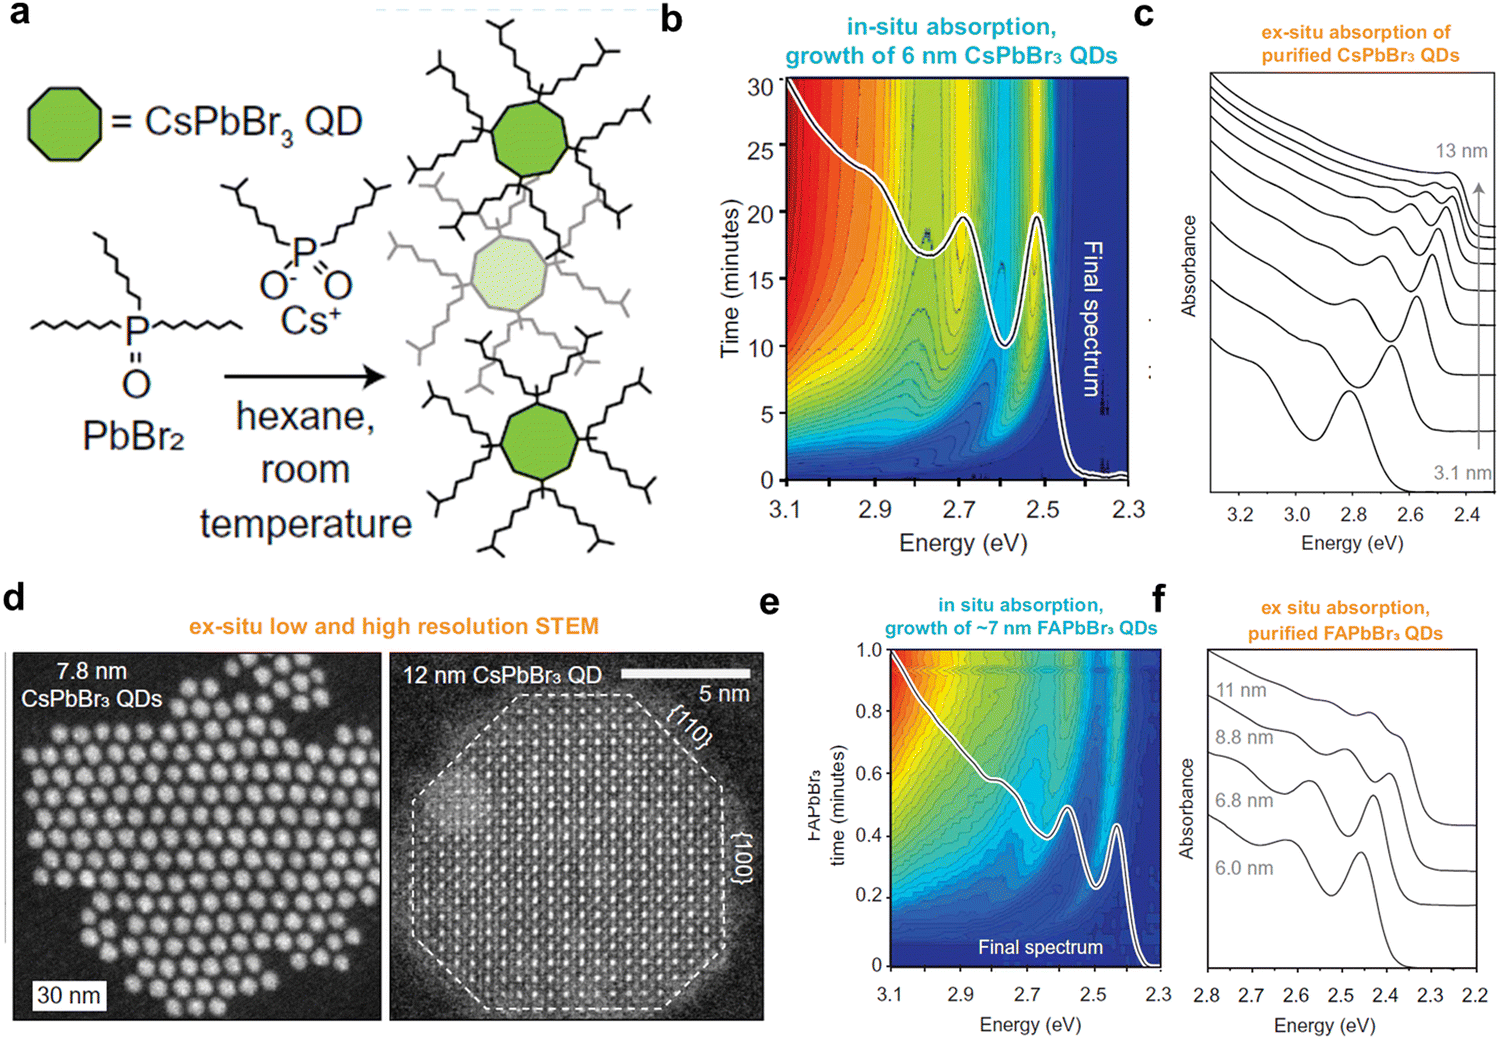 | ||
| Fig. 4 (a) Reaction scheme for the synthesis of spherical perovskite QDs at room temperature using trioctylphosphine oxide ligands. (b) In situ absorption spectra of 6 nm CsPbBr3 QDs for 30-min reaction; the solid spectrum is the final absorption spectrum with clear and sharp first and higher-order excitonic peaks. (c) Ex situ absorption spectra of a series of purified CsPbBr3 QDs with sizes ranging from ∼3–13 nm. (d) HAAD STEM images of 7.8 nm QDs and 12 nm CsPbBr3 NCs. (e) In situ absorption spectra of FAPbBr3 QDs and (f) ex situ absorption spectra of purified FAPbBr3 QDs of size ranging from 6–11 nm. Reproduced from ref. 23. Copyright 2022, AAAS. | ||
2.2. High-throughput synthesis using robotic workstations and microfluidic platforms
As discussed in the batch synthesis section above, there are many parameters that can influence the final shape and quality of the QDs. The experiments to optimize these interrelated synthesis conditions, including reaction time, temperature and precursor types and ratios, as well as discovering new ligands, can be very intuitive and slow. At the moment, there is growing interest in the wider perovskite community in applying artificial intelligence (AI) to high-throughput materials synthesis and characterization.79–85 AI-assisted high-throughput synthesis generally follows the following four steps: (1) data mining to identify the synthesis parameters that need to be optimized (Fig. 5(a)); (2) conducting high-throughput synthesis using either automated robotic-arm platforms (high-throughput batch synthesis) or automated microfluidic platforms (high-throughput flow synthesis) (Fig. 5(b)); (3) examining the quality of the synthesized QDs via in situ characterization to provide feedback data to optimize the synthesis conditions (Fig. 5(c)); (4) achieving inverse design so that the AI platform can synthesize desirable QDs automatically when entering the QD parameters that needed to be synthesized, such as their PL wavelength, sizes and shapes (Fig. 5(d)). These approaches have gradually been applied to optimize the synthesis of weakly-confined NCs,81,82,84 but has not yet been widely explored for strongly-confined perovskite QDs, and so we here discuss the potential advantages, as well as some of the challenges that may need to be overcome in the near future.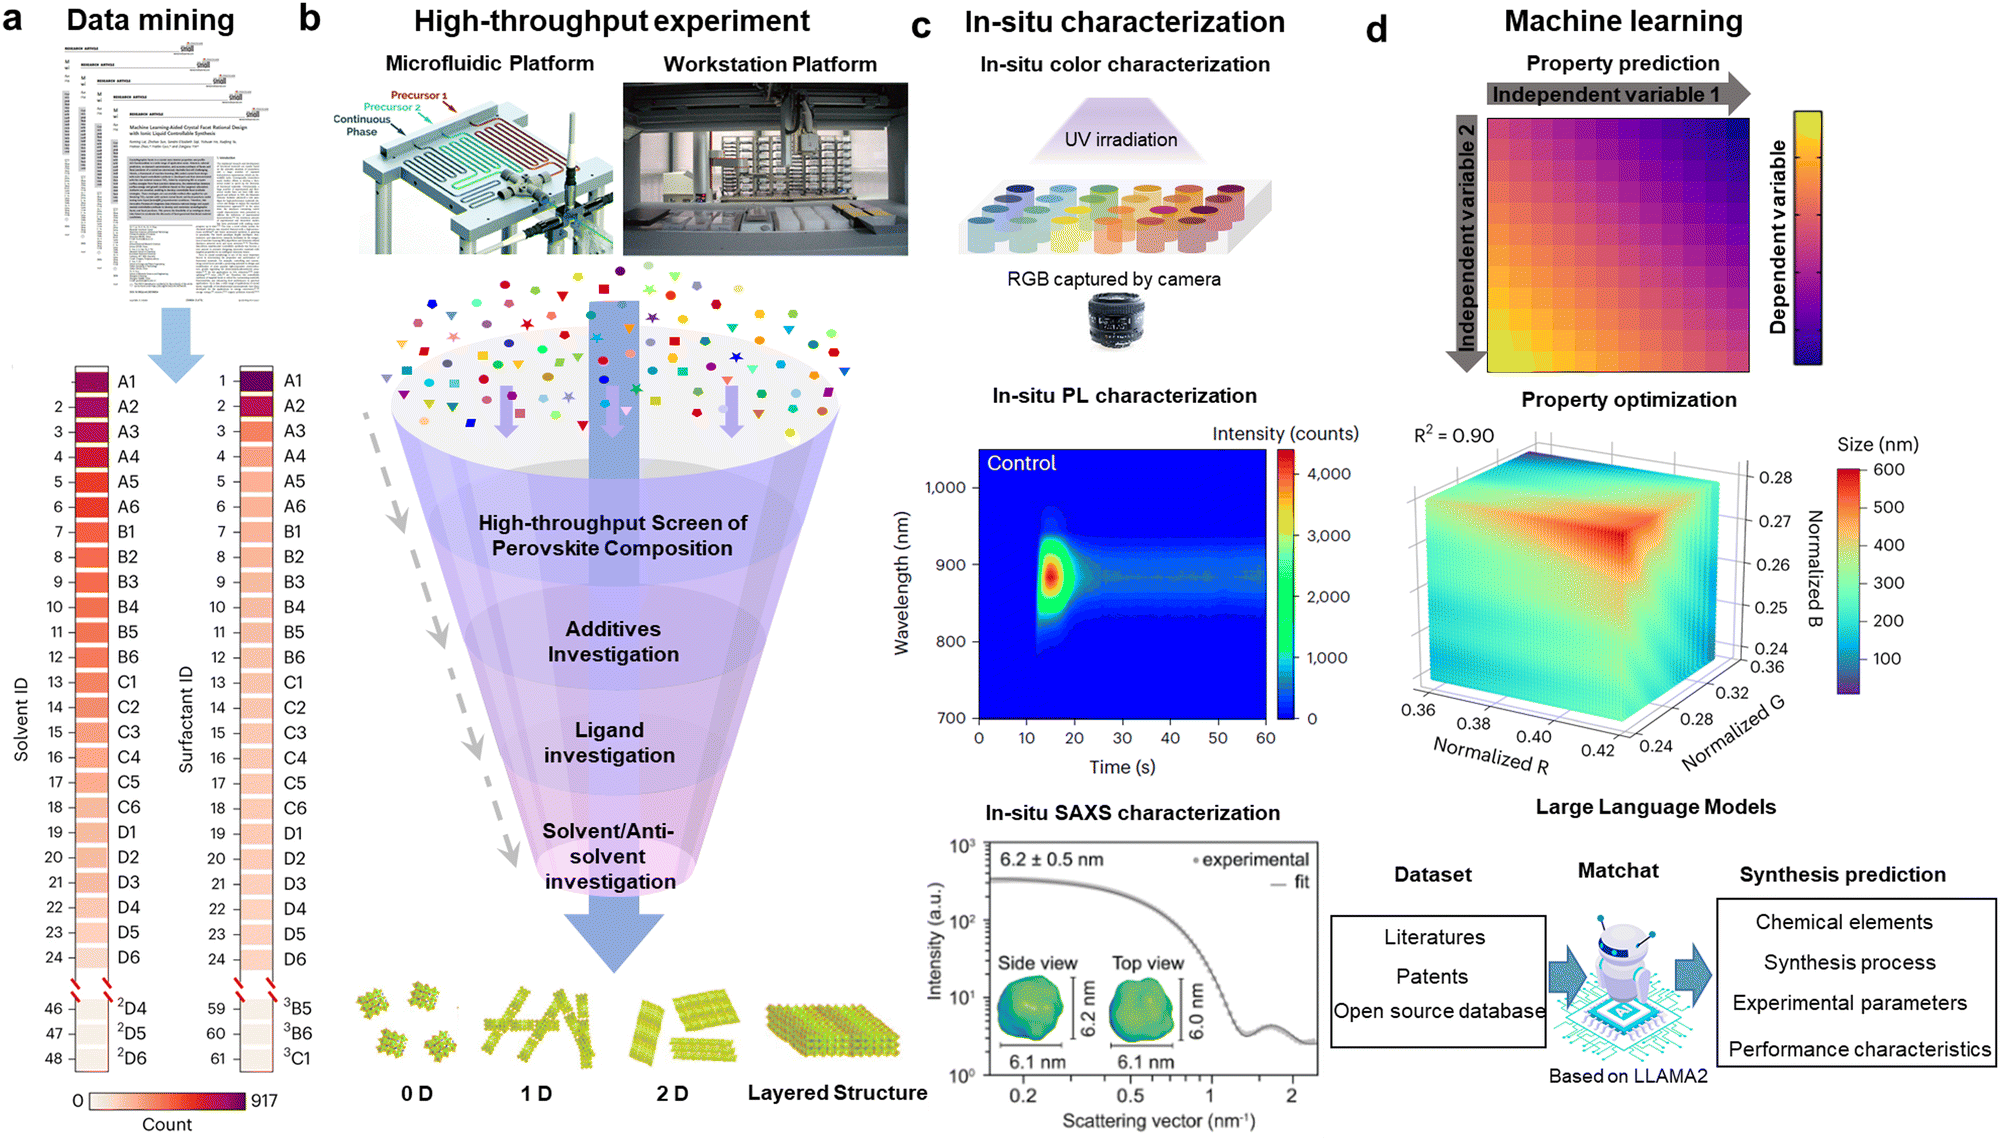 | ||
| Fig. 5 Data-driven perovskite materials innovation (a) Data mining of key synthesis parameters for double-perovskite NCs. (2D4 is the well in column 4 and row D in the 2nd plate shown in the tables). Reproduced under the terms of the CC-BY license from ref. 82. Copyright 2023, The Authors. (b) Illustration of high-throughput experimental platform and screening process for perovskites with different structures. (b1) Schematic illustration of the automated and modular microfluidic platform with the three-port translational flow cell.84 (b2) Schematic illustration of the automated workstation platform with pipetting robot.82 (b3) Common screening contents in high-throughput perovskite synthesis experiments, leading to different dimensions.86 (c) In situ characterization of perovskite materials, such as color (c1),86 absorption (c2) and SAXS (c3), etc. Reproduced with permission from ref. 23. Copyright 2022, The American Association for the Advancement of Science. (d) Inverse design facilitated by machine learning models. (d1) illustrates a general 2D model to represent how variable 1 and 2 can influence in the dependent variable. (d2) demonstrates a general 3D model to show how normalized factor R, B and G can alter the size of the products. (d3) describes the general process of the inverse design, the obtained dataset from literatures, patents and other open-source database can be fed into a language model to inversely design the products with desirable properties by selecting appropriate experimental conditions. | ||
On the other hand, microfluidic platforms, namely flow reactors, are comprised of narrow channels that liquid precursors are mixed into, where nucleation and growth take place. By providing greater control over the volumes mixed together, the degree of mixing (mixing index), and type of flow during synthesis (laminar, turbulent or mixed, while avoiding dead zones), flow reactors could enable greater reproducibility over batch reactors. Importantly, this high level of control can be maintained when the reactor is scaled up for industrial nanocrystal synthesis, whereas batch reactors would have significantly different mixing profiles when the size is changed.84,85,94 Flow synthesis has been investigated for perovskite nanocrystal synthesis,84,95–97 but has not yet been thoroughly investigated for the synthesis of strongly-confined perovskite QDs. Recently, Zhang et al. achieved the synthesis of strongly-confined CsPbBr3 perovskite nanoplatelets through flow synthesis, emitting at 472 nm, with a thickness of 2.2 ± 0.3 nm,98 which is a promising step towards the ultimate goal of making small, strongly-confined LHP QDs. Achieving fine control over the thickness of the nanoplatelets required tuning the degree and nature of mixing during the nucleation and growth stages, and this in turn required in situ characterization to enable the real-time observation of the reaction process. An important advantage of microfluidic systems is that they can easily be integrated with optical cells for in situ absorption and PL measurements.84,99 Synthesizing strongly-confined (<7 nm diameter) LHP QDs with narrow size distribution will be more challenging, and will require the in-depth mechanistic insights gained from in situ measurements to optimize the parameters (e.g., channel diameter, length and shape) in a flow reactor.
In situ characterization has also become a critical component of data-driven optimization in the batch synthesis of perovskite nanocrystals. For instance, as shown in Fig. 5(c), Zhao et al.82,86 utilized measurements of rapid optical changes, such as PL wavelength, to monitor the evolution of perovskite crystals in real time with a time resolution of a few seconds. Min et al.100 applied in situ spectroscopy to reveal that the rapid aggregation of grains during the initial growth stage (10 s) of perovskite thin films is the main reason for the formation of defect states. Akkerman et al.23 probed the size dispersion (8.1%) and isotropic spheroidal particle shape by in situ synchrotron small-angle X-ray scattering (SAXS) measurements, which provide valuable insights into reaction kinetics, crystal growth, and phase transitions. However, the reaction time window for perovskite NCs is typically much shorter than this, with the nucleation step typically complete well within 1 s. A detector with short time resolution is therefore needed. The detectors need to be able to be integrated with automation control, but also small enough or flexible enough to be able to put into an inert atmosphere, such as inside a glovebox. Another approach would be to slow down the reactions for small QD synthesis using either robotic workstation or microfluidic reactors in an interconnection closed system for in situ synthesis and characterization, so that the current time resolution of commonly-used detectors is able to capture the reaction kinetics.23
3. Optical properties and charge-carrier kinetics
Having discussed how to synthesize LHP QDs with fine control over the size, this section covers the effect of size reduction on the charge-carrier dynamics of perovskite nanocrystals, including the influence on steady-state absorption properties (Fig. 6, process 2), relaxation processes (thermalization and hot carrier cooling, Fig. 6, processes 3 and 4) and recombination processes (radiative and non-radiative recombination, Fig. 6, process 5).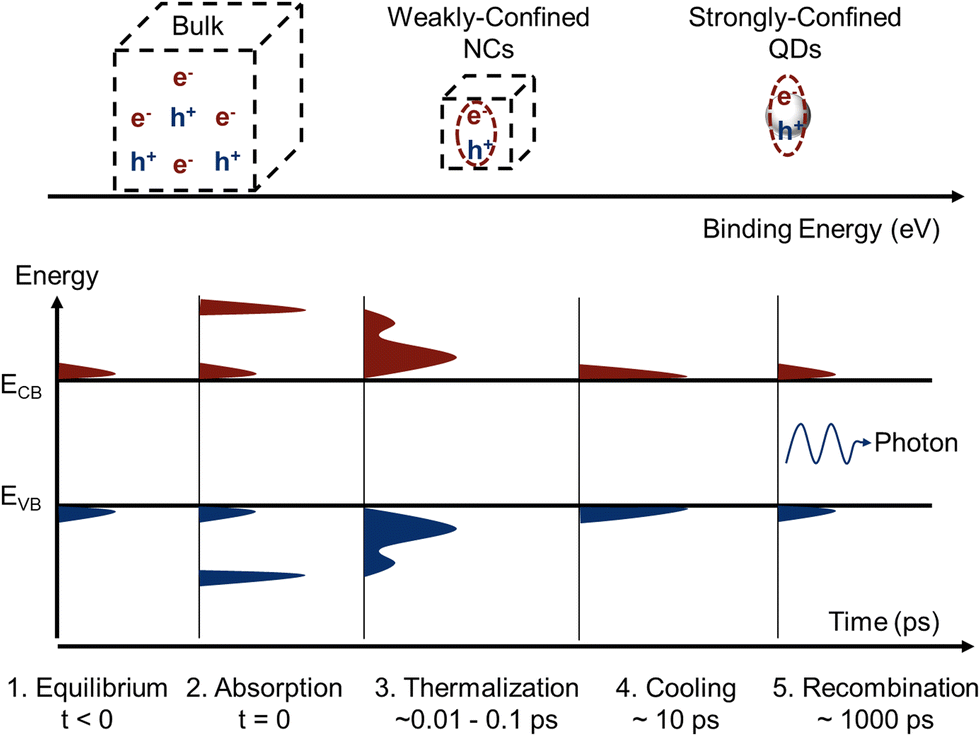 | ||
| Fig. 6 Top panel, illustration of the effect of size on the exciton binding energy. Bottom panel, schematic of the charge carrier distribution in the valence (VB) and conduction band (CB) of an arbitrary semiconductor with a narrow band gap. Bottom panel: When in equilibrium (1), charge carriers are excited into the bands and have the same temperature as the lattice. Photoexcitation upon absorption promotes an excess number of electrons into the CB and holes into the VB (2). Ultrafast elastic carrier-carrier scattering will set in (3) and transform the non-equilibrium carrier distribution to a thermal distribution of hot carriers in the CB/VB (3). Carrier cooling (4) will equilibrate the temperatures before eventual carrier recombination (5). Produced with inspiration from ref. 106. | ||
3.1. Light absorption
Quantum size effects in III–V and II–VI semiconductor QDs have been extensively studied over the past three decades, and these findings have been instrumental in understanding size effects in LHP QDs.4 LHP NCs exhibit either bulk-like or strongly excitonic properties, depending on their size.53 When the characteristic diameter of a LHP NC is comparable to its exciton Bohr diameter (e.g., ∼7 nm for CsPbBr3 and FAPbBr3, ∼12 nm for CsPbI3, ∼10 nm for FAPbI3), the material enters into the regime of quantum confinement, in which the electronic wavefunction is confined within the particle's geometry. The material then exhibits very different linear and nonlinear optical properties compared to their bulk counterparts. The strength of quantum confinement depends on the size of the NCs with respect to the exciton Bohr diameter of the material. In this size regime, the energy of the electrons and thus the bandgap changes according to the nanocrystal size (Fig. 7(a) and (b)). As the size decreases, the HOMO–LUMO gap increases, and thus the emission wavelength decreases. For instance, the emission color of Br-based perovskites changes from green to violet via blue with decreasing particle size. Similarly, the emission of I-based perovskites changes from near-IR to green via red, orange, and yellow with increasing quantum confinement. Table 1 summarizes the size-dependent emission wavelengths for CsPbBr3, CsPbI3, and FAPbBr3 NCs.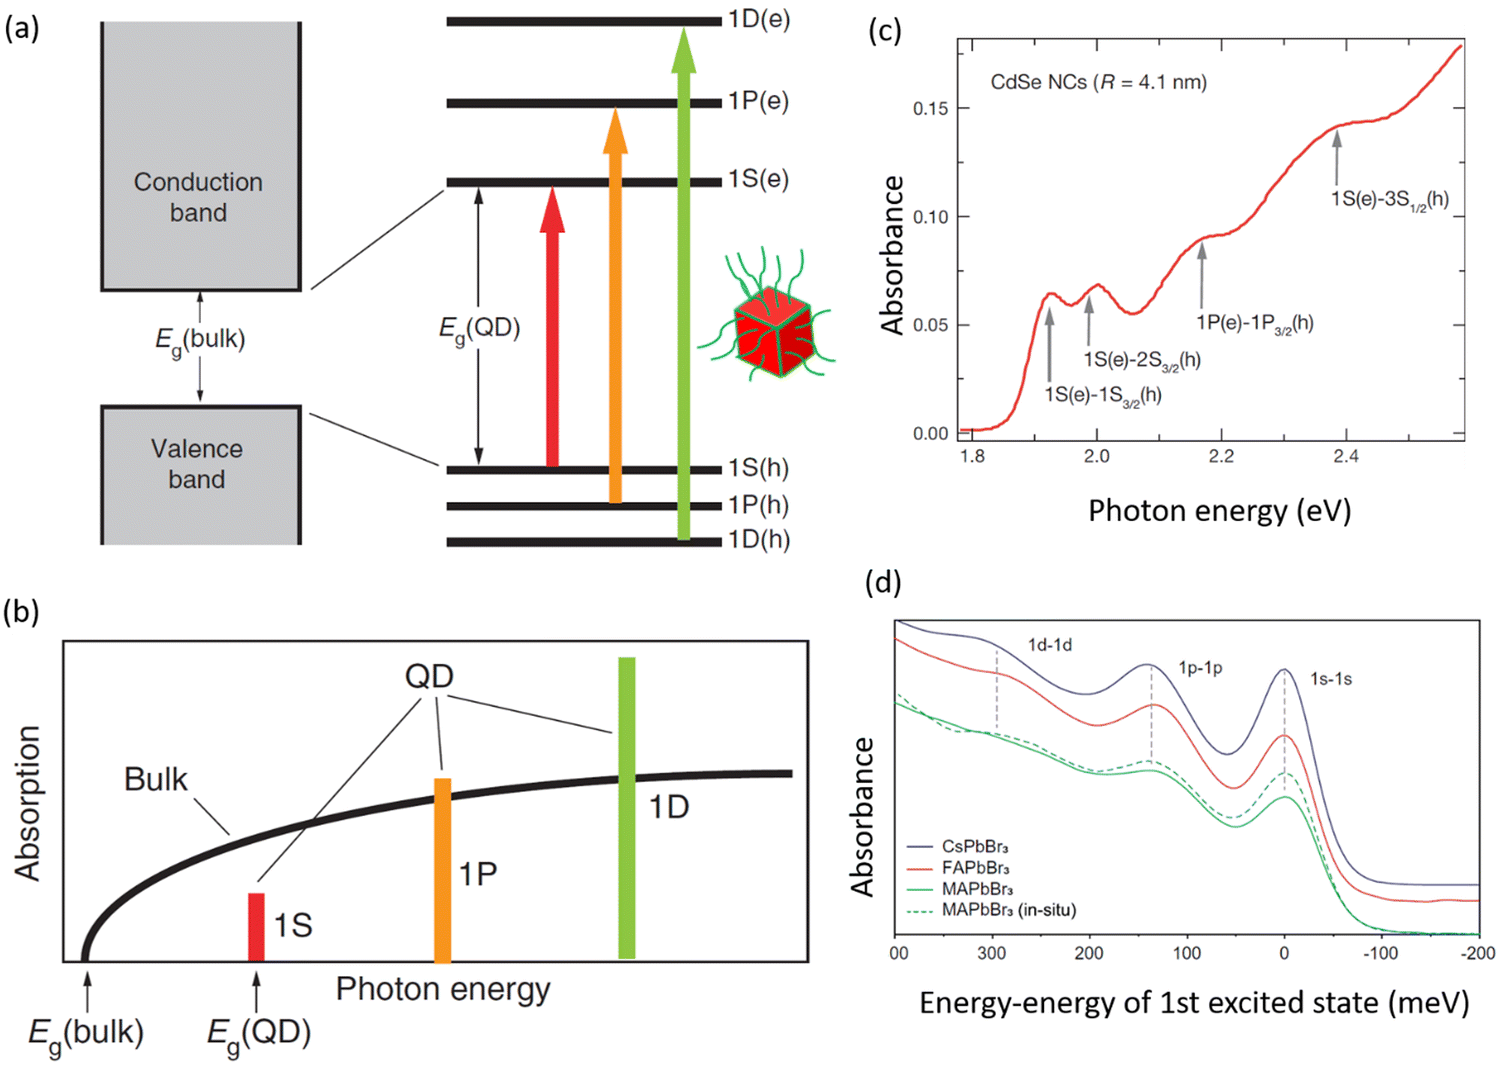 | ||
| Fig. 7 (a) Energy band diagram of a bulk semiconductor vs. QD. The bulk semiconductor has continuous valence and conduction energy bands separated by an energy gap ‘Eg (bulk)’. The energy gap is an intrinsic quantity of a material. Normally, all of the states in the valence band are filled with electrons whereas the conduction band states are empty. On the other hand, the QD has discrete atomic-like states, where the energies of these states depend on the QD diameter. The discrete energy states of QDs can be labeled with atomic-like notations, such as 1S, 1P, and 1D. The electronic transitions related to these energy states can be seen in absorption spectra. (b) Schematic illustration of the continuous absorption spectrum of a bulk semiconductor and the discrete absorption spectrum of a QD that has several higher order transitions. Figures a & b are reproduced in the terms of the CC-BY license from ref. 107. Copyright 2003, The Author. (c) A linear absorption spectrum of CdSe NCs with a mean size of 4.1 nm. Arrows indicate the positions of four well-resolved higher order electronic transitions. Reproduced with permission from ref. 108. Copyright 2000, American Chemical Society (d) Linear absorption spectra of CsPbBr3, FAPbBr3, and MAPbBr3 QDs with a size of ∼7-nm, where the X-axis is the absorption energy–energy of the first excited state (obtained by matching 1s–1s transition energy). Reproduced with permission from ref. 23. Copyright 2022, The American Association for the Advancement of Science. | ||
Another important feature of QDs is their discrete energy levels which have a profound effect on the optical absorption spectra (Fig. 7). The quantum confinement effects result in a change in the continuous density of states of bulk materials into discrete atomic-like quantized energy states that can be classified with two quantum numbers: L (angular momentum quantum number (symmetry), with a letter S for L = 0, P for L = 1, D for L = 2, and so on) and N, the number of the state in the series of states of a given symmetry, i.e., 1 refers to the lowest-energy state (Fig. 7(a) and (b)).108,111 As shown in Fig. 7(a) and (b), the lowest energy states (both in valence and conduction bands) in order of increasing energy are 1S, 1P, and 1D. Thus, the absorption spectra of spherical QDs exhibit several discrete higher energy absorption bands (1P(e)–1P(h), 1D(e)–1D(h), and so on) in addition to band edge absorption (1S(e)–1S(h)), whereas bulk semiconductors (or 3D NCs) exhibit continuous absorption spectra (Fig. 7(b)–(d)). However, in the case of band mixing, the multi-subband character of the valence band is typical for many semiconductors, including CdSe. In this case, the valence band energy levels can be classified with the total angular momentum quantum number F, where F is the Bloch-function angular momentum (J) + angular momentum quantum number (L).108,111 Accordingly, the valence band energy levels can be labelled as nLF, and thus the three lowest energy levels (hole states) calculated for CdSe QDs are 1S3/2, 1P3/2, and 2S3/2.112 The optical transitions related to these states were well-resolved in the linear absorption spectra of high-quality colloidal CdSe QDs (Fig. 7(c)). Similarly, for LHP QDs, the shape of the absorption spectra (especially, higher order absorption bands) strongly depends on their shape, where the spherical-like QDs exhibit well-resolved higher energy excitonic transitions as compared to those in cuboidal QDs (Fig. 7(d)).23 However, further in-depth experimental and theoretical studies are needed to better understand the absorption spectra of LHP QDs.
3.2. Charge-carrier relaxation
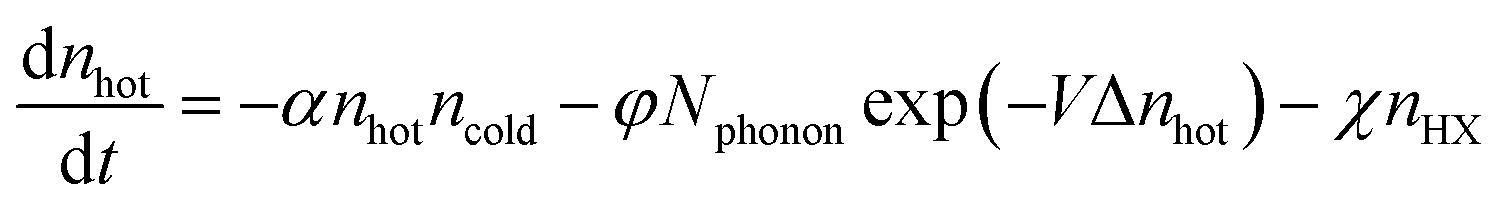
The mechanism of hot carrier relaxation in LHP materials includes two processes, thermalization and cooling. First, the free electrons and holes with a non-equilibrium distribution of excess energies generated from photo-excitation undergo thermalization through rapid (0.01–0.1![[thin space (1/6-em)]](https://www.rsc.org/images/entities/char_2009.gif) ps) carrier–carrier scattering events to establish an equilibrium distribution characterized by an effective hot carrier temperature. Subsequently, the thermalized hot carriers exchange energy with the lattice on a 0.1–1 ps timescale via carrier–phonon interactions, and eventually cool down to the lattice temperature. Herein, the relaxation time constant refers to the change of hot carrier density over time when the hot carriers interact with surrounding species, including charge-carriers and phonons. Due to the polar nature of LHP semiconductors, the dominant pathway for relaxation is considered to be the Fröhlich interaction between hot carriers and longitudinal optical (LO) phonons, which ceases once the excess energy of the hot carriers falls below that of the LO phonon energy gap. Thereafter, the emitted LO phonons decay into sub-level longitudinal acoustic phonon branches (Klemens decay), which leads to the thermal energy of charge-carriers being spread across the thin film macroscopically. Based on these two relaxation processes (Fröhlich coupling and Klemens decay), there are two possible ways in which size affects the hot carrier relaxation kinetics. First of all, the discrete electronic structure that results from quantum confinement (Fig. 7(a) and 8(a)) leads to slower hot carrier relaxation, i.e., intrinsic phonon bottleneck, which is usually explained as the large reduction of the relaxation rate due to the inefficient phonon scattering in quantum dots with discrete electronic energy states. Secondly, smaller QDs are more strongly affected by the surface chemistry, potentially resulting in a higher trap density per unit volume due to the higher surface area to volume ratio. A higher trap density could increase the rate of hot carrier relaxation. The overall relaxation constant can be influenced by three key factors (Fig. 8(b)): (1) the intrinsic materials properties, which are affected by the QD size (as explained above) and composition, which determine their electronic structures and carrier–phonon coupling strength, (2) the measurement conditions, including pump energy and fluence, and (3) the surface conditions of the QDs, particularly the trap density.
ps) carrier–carrier scattering events to establish an equilibrium distribution characterized by an effective hot carrier temperature. Subsequently, the thermalized hot carriers exchange energy with the lattice on a 0.1–1 ps timescale via carrier–phonon interactions, and eventually cool down to the lattice temperature. Herein, the relaxation time constant refers to the change of hot carrier density over time when the hot carriers interact with surrounding species, including charge-carriers and phonons. Due to the polar nature of LHP semiconductors, the dominant pathway for relaxation is considered to be the Fröhlich interaction between hot carriers and longitudinal optical (LO) phonons, which ceases once the excess energy of the hot carriers falls below that of the LO phonon energy gap. Thereafter, the emitted LO phonons decay into sub-level longitudinal acoustic phonon branches (Klemens decay), which leads to the thermal energy of charge-carriers being spread across the thin film macroscopically. Based on these two relaxation processes (Fröhlich coupling and Klemens decay), there are two possible ways in which size affects the hot carrier relaxation kinetics. First of all, the discrete electronic structure that results from quantum confinement (Fig. 7(a) and 8(a)) leads to slower hot carrier relaxation, i.e., intrinsic phonon bottleneck, which is usually explained as the large reduction of the relaxation rate due to the inefficient phonon scattering in quantum dots with discrete electronic energy states. Secondly, smaller QDs are more strongly affected by the surface chemistry, potentially resulting in a higher trap density per unit volume due to the higher surface area to volume ratio. A higher trap density could increase the rate of hot carrier relaxation. The overall relaxation constant can be influenced by three key factors (Fig. 8(b)): (1) the intrinsic materials properties, which are affected by the QD size (as explained above) and composition, which determine their electronic structures and carrier–phonon coupling strength, (2) the measurement conditions, including pump energy and fluence, and (3) the surface conditions of the QDs, particularly the trap density.
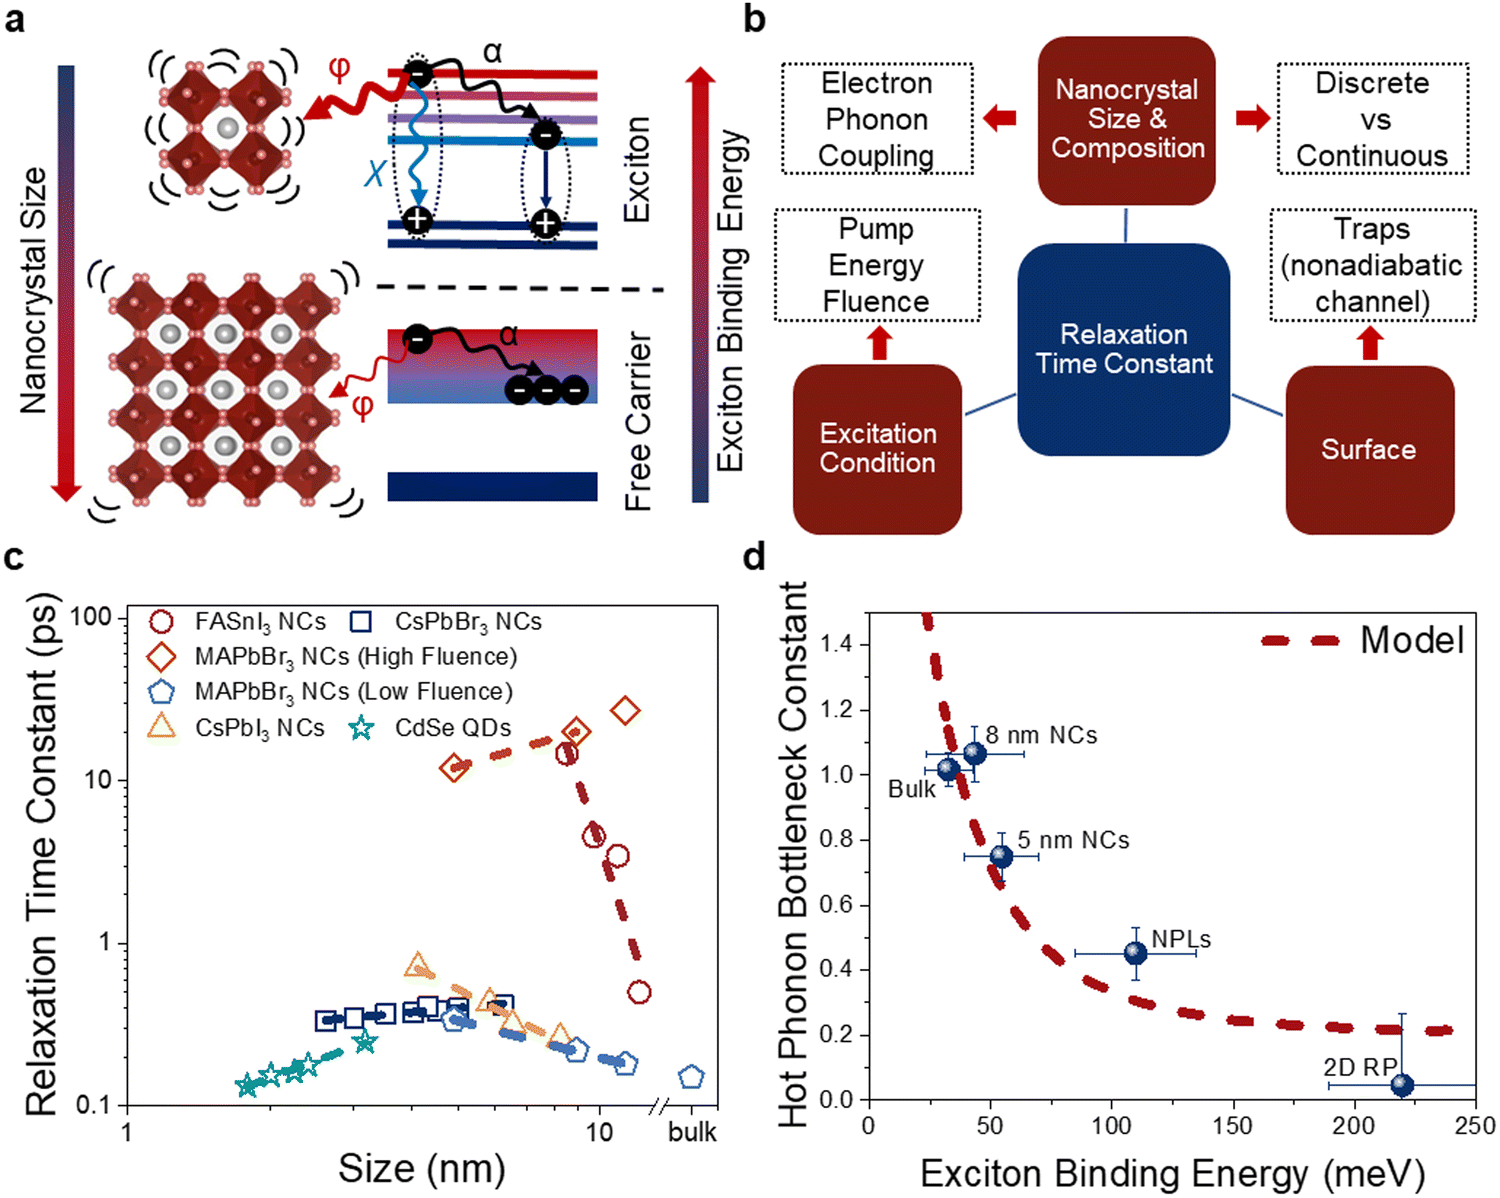 | ||
| Fig. 8 Effect of perovskite nanocrystal size on the relaxation kinetics. (a) Schematic diagram to illustrate the relaxation pathway in a strongly-confined (excitonic) system vs. in a weakly-confined (free-carriers) system. The α, φ, and χ are the hot–cold carrier, carrier–phonon, and hot exciton cooling coefficients, respectively. (b) Scheme of the factors that could influence the final relaxation time constant, i.e., the time it takes for the hot carriers to relax to the band edge with the carrier temperature matching the surrounding lattice temperature. (c) Comparison of reports showing the influence of QD size on the relaxation time constant. The data included in panel c is from ref. 16 (CsPbBr3 NCs), 114 (FASnI3 NCs), 115 and 116 (MAPbBr3 NCs), 117 (CsPbI3 NCs), and 118 (CdSe QDs). (d) Hot phonon bottleneck parameters (β) for all CsPbBr3 systems with different sizes and exciton binding energies, compared to a 2D (PEA)2PbI4 thin film. A larger β value implies a more pronounced hot phonon bottleneck and slow hot carrier relaxation. Error bars correspond to a 99% confidence interval. The black dotted curve is the hot phonon bottleneck behavior as a function of Eb predicted by the kinetic model described in the main text. Panels a and b are inspired by ref. 113. | ||
Given the interplay between multiple factors on the relaxation constant of hot carriers, there have been many different, and sometimes apparently contradictory, trends in the relaxation constant with QD size (Fig. 8(c)). For example, Dai et al. observed an increase in the relaxation time constant with a reduction in FASnI3 NC size.114 Similar trends were reported by Li et al.115 for MAPbBr3 NCs at low measurement fluences116 and Yu et al. for CsPbI3 NCs.117 This can be explained by the intrinsic photon bottleneck of the materials as the electronic structure becomes more discrete with increasing quantum confinement.114,116 For example, Dai et al. performed density functional theory (DFT) calculations on 12.1 nm and 8.5 nm FASnI3 NCs, and showed that more energy states (and therefore more loss channels for hot carriers) are available above the first excited excitonic state in the larger NCs than in the smaller NCs. The relaxation lifetime for hot carriers from the second to first excited state increased from <0.5 ps for 12.1 nm NCs to 15 ps for 8.5 nm NCs, and this led to the first observation of a phonon bottleneck effect in strongly-confined QDs, with the measured relaxation time 15 ps.114
It is worth noting that the relaxation time constant is very fluence-dependent for strongly-confined systems. Increasing the pump fluence will reduce the relaxation time constant due to increasing multiexciton generation, leading to increased annihilation between excitons, which results in a loss in energy as heat. This contrasts to the behavior of bulk or weakly-confined NCs, where an increase in pump fluence usually leads to reduced relaxation time constants due to the hot phonon bottleneck effect, phonon reabsorption (at carrier densities ∼1018 cm−3), or Auger reheating effects (at carrier density above 1019 cm−3). For example, Li et al. showed that the relaxation time of MAPbBr3 NCs increased as the size decreased at low fluences (carrier density ∼1017 cm−3), but obtained the opposite trend at high fluences (carrier density ∼1019 cm−3).116 This phenomenon has also been reported for CsPbBr3 NCs16 and CdSe QDs.118
Carwithen et al. studied the effect of confinement, or the size of the exciton binding energy, on hot carrier relaxation, especially on the hot phonon bottleneck effect at high excitation fluence.113 They described the relaxation time using the following equations (eqn (2) and (3)):
 | (2) |
 | (3) |
3.3. Charge-carrier recombination
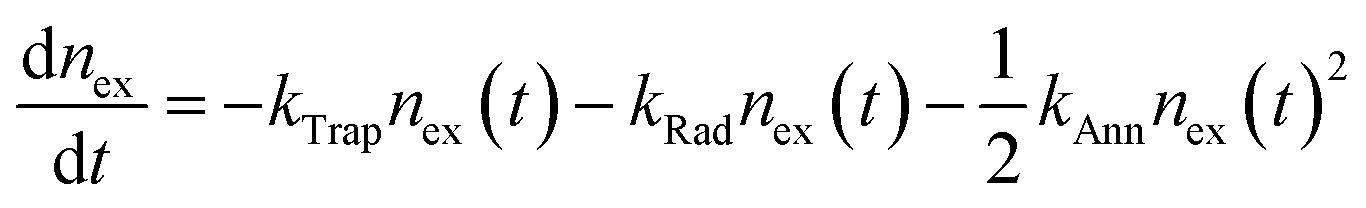
As alluded to in Section 3.2, hot or cold carriers can release or lose energy when the electron and hole, created through photoexcitation, come back together (i.e., recombination). For a free-carrier system (i.e., bulk or weakly-confined NCs), the energy can be released as a photon (k2, bi-molecular radiative recombination), heat through phonon emission (k1, mono-molecular defect-assisted non-radiative recombination), or as kinetic energy to anther free carrier (k3, tri-molecular non-radiative Auger Recombination) (Fig. 9(a)). In contrast, in exciton-dominated systems (i.e., strongly-confined QDs), recombination can be in the form of monomolecular trap-assisted non-radiative recombination (kTrap) or monomolecular radiative recombination (kRad). The bimolecular process is non-radiative exciton–exciton annihilation (kAnn), as shown in Fig. 9(b). The recombination rate equations for free-carrier- and exciton-dominated systems are given in eqn (4) and (5), respectively, where n is the population of photogenerated free carriers and nex is the population of excitons.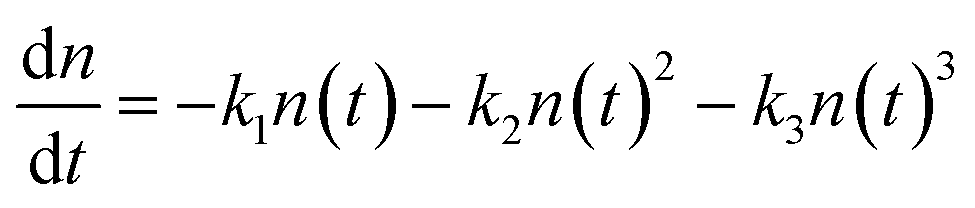 | (4) |
 | (5) |
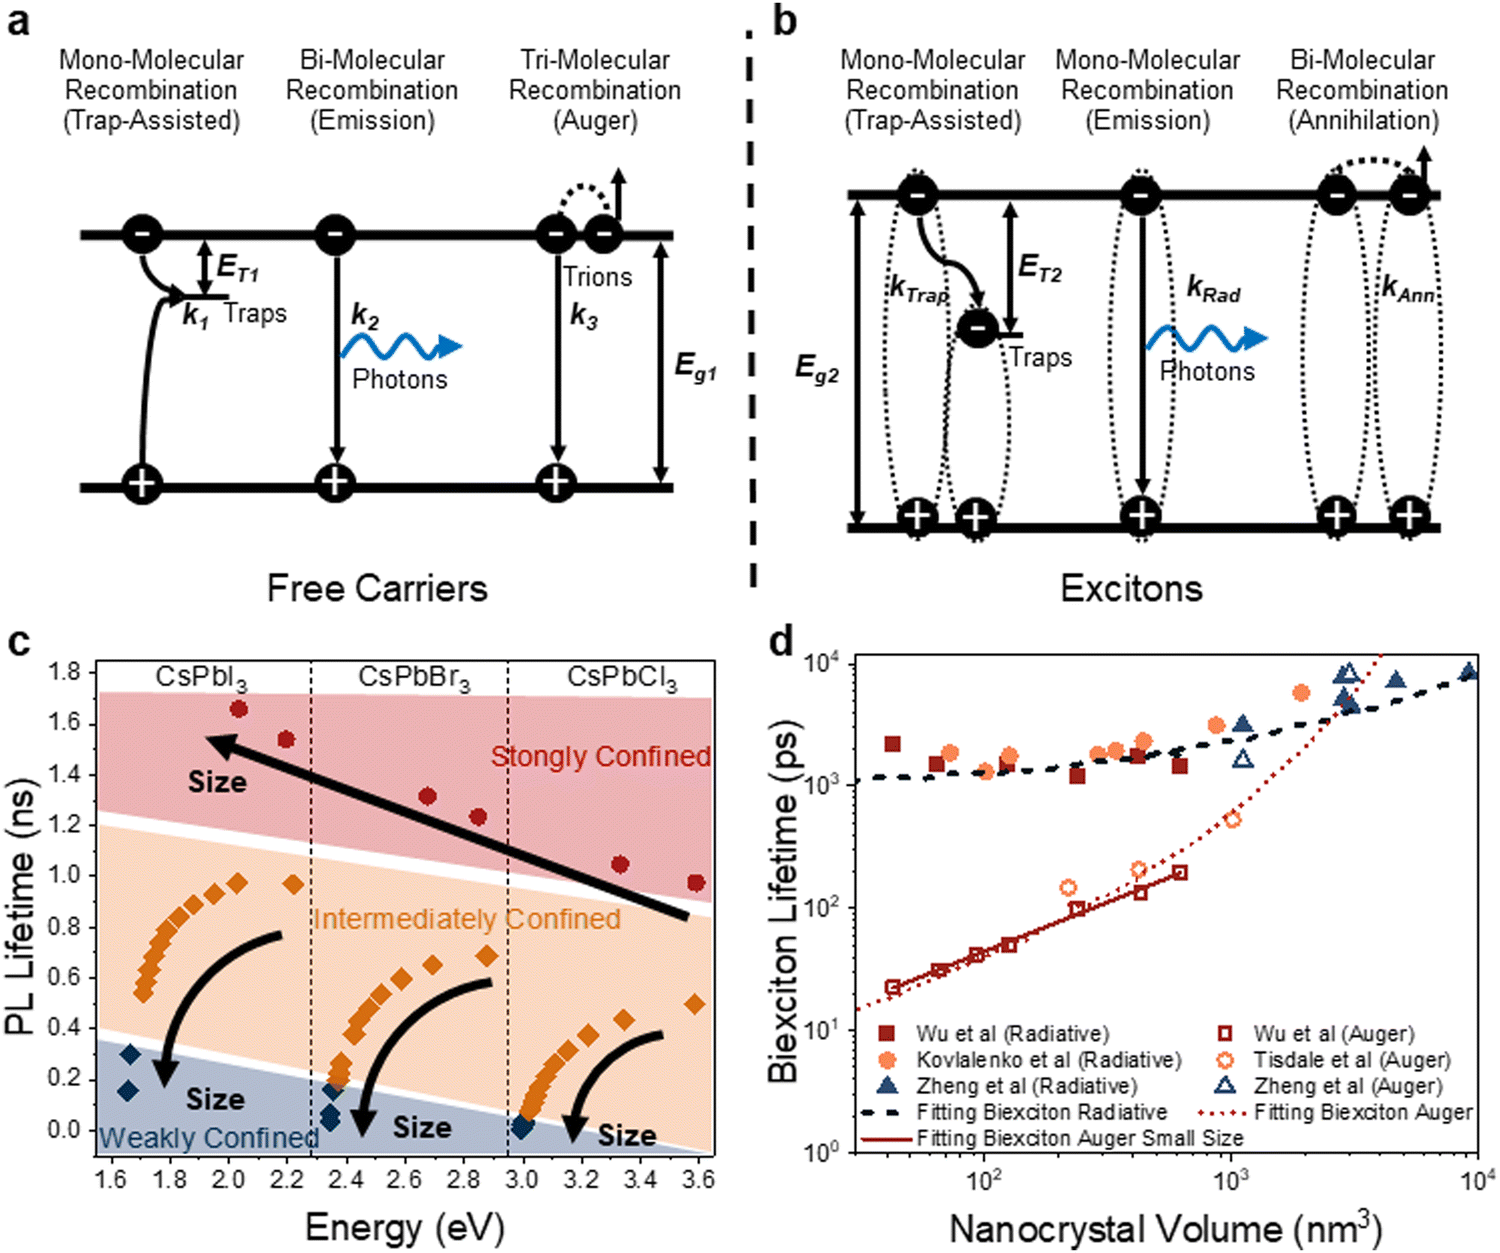 | ||
| Fig. 9 The effect of size on the recombination kinetics LHP NCs. (a) Recombination process for bulk and weakly-confined free carrier systems. (b) Recombination process for strongly-confined excitonic systems. (c) Photoluminescence lifetime for NCs with different compositions and degrees of confinement. Figure made with inspiration from ref. 122. (d) Biexciton radiative and Auger lifetimes, with data obtained from ref. 123–126. | ||
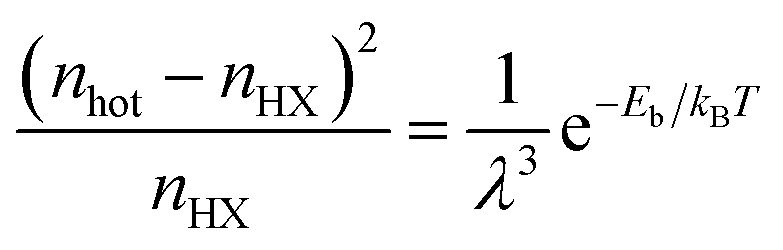
The effect of size on recombination mainly arises from the relative ratio of free carriers and excitons that contribute to the recombination process. Again, the Saha equation can be used, but this time, we can write it in the form shown in eqn (6) to focus more on carriers that undergo recombination process.
 | (6) |
The PL lifetime increases with a decrease in size for NCs in the weak- to intermediate-confinement regimes (Fig. 9(c); black and orange diamonds). In these regimes, free carriers dominate, and the low exciton binding energy results in a low chance of collision between electrons and holes, hence a slow process for bimolecular recombination. As a result, larger NCs usually have longer PL lifetimes as the free carrier radiative recombination process is usually less efficient than excitonic systems. As the NCs become exciton-dominated, the PL lifetimes instead decreases as the size decreases because exciton recombination makes the radiative process much more efficient, as shown in the strongly-confined regime in Fig. 9(c). For example, Naghadeh et al. observed that when the size of the CsPbBr3 NCs decreased from 9.3 nm to 5.7 nm to 3.1 nm, the PL lifetime decreased from 19 ns to 7.5 ns to 4.7 ns,127 as the radiative process is more efficient for excitonic systems in small NCs. The shorter PL lifetime for smaller NCs here was not due to the presence of more defect states as the PLQY increased from 54% to 91% and 76%. Similar trends were reported in MAPbBr3 systems.128 Again, we would like to emphasize that it could be deceiving to only judge the recombination process based on the trends in PL lifetime, since the role of defects also needs to be factored in. More precise understanding of the mechanism of recombination requires fluence-dependent measurements and fitting the rate equations given in eqn (4) and (5).52,129
Biexciton emission and Auger (annihilation) recombination are also important processes for strongly-confined QDs at high excitation fluence, and the reported values for these processes in LHP NCs are compared in Fig. 9(d).123–126 The biexciton state is a single state composed of two electrons and two holes, where additional interactions make it energetically favorable to form than two single excitons. The biexciton radiative lifetime (τbiex,rad) can be modelled by eqn (7) (dashed black line in Fig. 9(d)):
| τbiex,rad = τ0 + aVα | (7) |
 | (8) |
Apart from the effect of size on the relaxation and recombination processes in LHP NCs, there are other important ways in which the NC size influences charge-carrier dynamics. For example, Wu et al. studied the effect of size on the spin flip lifetime, which is the time of an electron either spin up or spin down changes to an opposite spin due to strong spin orbital coupling, for CsPbI3 (4.2–8.3 nm) and CsPbBr3 QDs (3.5–7.5 nm).54 In all cases, the spin flip lifetime decreases with the size.54
4. Single-particle spectroscopic properties of perovskite QDs
In this section, we will discuss the spectroscopic properties of single perovskite QDs and their application as single photon emitters (SPEs). SPEs are essential elements for photonic networks that can potentially enable quantum communication, quantum simulation and photonic quantum computing. Unlike conventional light emitting diodes that emit photons in a stochastic pattern, SPEs deliver photons in a clocked manner, with each emission event containing exactly one photon that is indistinguishable from other photons in the stream (Fig. 10(a)). For a material to emit single photons, individual emission centers with discrete energy levels are always required. For example, cold ions, or crystal defects that act like atoms, have been demonstrated to emit single photons. However, it is very difficult to trap or locate individual atoms, or a defect in a crystal. Additionally, photoexcitation of these materials is inefficient due to their small absorption cross sections, greatly limiting the brightness of these SPEs. | ||
| Fig. 10 (a) Schematic illustration of a perovskite QD based single photon emitter. When the QD is photoexcited, an exciton will be created. When the exciton recombines radiatively, a single photon will be emitted. Repeating this process will generate a stream of coherent single photons. (b) Illustration of how quantum confinement by reducing the size of the QD increases the strength of the electron–hole interaction, causing a larger fine structure splitting and extending the PL lifetime. (c) Schematic illustration of the exciton fine structure of perovskite QDs, where the bright triplet state is further split into three sublevels due to orthorhombic distortion and shape anisotropy. Due to the Rashba effect, the energy levels between bright and dark states are inverted. (d) PL decay traces of perovskite QDs at 4 K, showing emission lifetimes of 200–300 ps. Reproduced from ref. 130. Reprinted with permission from AAAS. (e) Single perovskite QD PL spectra at 4 K showing three emission lines with orthogonal polarization, originating from the triplet bright states. Reproduced from ref. 131. Copyright 2018, Springer Nature. All rights reserved. | ||
Although QDs can be considered to be artificial atoms, with discrete energy levels, the size of the QD, is much larger (by ∼ a few thousand times) than an atom, making QDs stronger light absorbers. Importantly, when multiple excitons are created in a QD, they can undergo a very fast Auger-type non-radiative recombination process, since the multi-exciton interaction is greatly enhanced by strong quantum confinement in QDs. Auger recombination annihilates multi-excitons, ensuring single photon emission. These properties combined make individual QDs natural SPEs. Among all different kinds of QDs, perovskite QDs are uniquely suitable for SPEs for many unique properties such as fast emission and high single photon purity. We will discuss the properties and advances made in single perovskite QD studies in this section.
4.1. Band-edge exciton fine structure of lead halide perovskite QDs
The brightness of an SPE is limited by the exciton emission rate under saturated excitation rates. In QDs, the intrinsic exciton emission rate is determined by its fine structure, which can be affected by the degree of quantum confinement. Size-dependent optical effects were firstly theorized by Efros et al.132 In their model, the optical transition probability of the exciton is affected by the wavefunctions of both the electron at the conduction band edge and the hole at the valence band edge. Both the energy and the recombination rate of these two charge carriers depends on their spin configurations (Fig. 10(b)). In molecules and most traditional semiconductor materials, the ground excitonic state has a triplet spin configuration. Therefore, radiative electron–hole recombination requires the spin of one carrier to flip to satisfy the Pauli exclusion principle. Such spin-forbidden processes are generally slow, and the triplet excitons are therefore “dark” (emission rate is very low). On the contrary, singlet excitons will emit photons rapidly and are therefore “bright”. In QDs, although the strong spin–orbit coupling makes it only necessary for the total angular momentum (spin and orbital angular momentum) to stay conserved during exciton recombination, the fine structure of the exciton is also found to split into triplet and singlet states due to electron–hole exchange interactions.133 In conventional QDs, the ground excitonic state is a triplet dark state, while the singlet bright state(s) are of higher energy (Fig. 10(c)).134The energy gap between the optically bright and dark states (also known as the fine structure splitting) is only a few meV in QDs. At room temperature (where thermal energy is ∼26 meV), all of these states are populated, and the observed exciton radiative recombination rate is a weighted average from both bright and dark excitons. At low temperature, the dark ground state is preferred, and PL emission slows down. In CdSe QDs, PL lifetime can be a few μs at 4 K, much longer than that at room temperature (tens of ns).134,135 However, in perovskite NCs (14 nm sized), the PL lifetime shortens with decreases in temperature, reaching 200–300 ps at 4 K (Fig. 10(d)).130 This is approximately 10000 times faster than the PL lifetime of CdSe QDs. Efros et al. suggested that the low-lying triplet excitons in perovskite QDs are actually bright, due to the unique band structure of lead halide perovskites and Rashba effect (Fig. 10(c)).131 This is the first luminescent material in which the ground state is found to be an optically bright state. In cubic shaped perovskite QDs, the triplet bright state is further split by the orthorhombic distortion in perovskite QDs136 into three sublevels due to their specific Goldschmidt tolerance factors.137 These sublevels have been directly observed by measuring the polarization dependent single QD PL spectra: up to three excitonic PL emission lines with orthogonal polarizations were observed (Fig. 10(e)).131 Although an alternative picture of the fine structure with a singlet dark exciton being the ground state has been discovered in FAPbBr3 perovskite QDs138 (9.2 nm, the exciton Bohr diameter in FAPbBr3 is estimated to be 7 nm139), it is generally accepted that the inaccessibility of the dark state leads to the unusually high emission rate in perovskite QDs.131,138,140,141 The high PL emission rate in perovskite QDs makes it possible for excitons to emit a photon before interacting with lattice vibrations and losing photo-coherence. As a result, the coherence of single photon emissions from weakly-confined perovskite QDs are promoted,130,142 which makes perovskite QDs particularly interesting for coherent single photon source materials.
In smaller QDs with strong quantum confinement, electron–hole interaction is enhanced. Theoretical works have predicted that the exciton fine structure splitting in perovskite QDs is size-dependent.52,133,143 Han et al. showed experimentally that the exciton fine structure splitting can be increased by decreasing the QD size for the CsPbI3 QD system.143 When the QD size is sufficiently small (e.g., smaller than the 7 nm Bohr diameter of excitons in CsPbBr319), the electron–hole interaction can overcome the Rashba effect, resulting in the crossover of the bright and dark states, and a dark ground excitonic state is predicted.133 However, the temperature-dependent emission rate and exciton fine structure of perovskite QDs with sizes <6 nm have rarely been studied at the single-particle level, presumably due to the insufficient sample quality and stability. Future studies on single strongly-confined perovskite QDs are still required to understand the exciton fine structure under the influence of strong quantum confinement.
4.2. Spectral linewidth of single perovskite QDs
Although low-temperature single QD studies have demonstrated fascinating optical properties of perovskite QDs, room-temperature SPEs are still critical for scalable quantum communication technologies. Ideally, SPEs should emit coherent single photons, which have identical energy/wavelength, i.e., a narrow emission linewidth is essential.144 Realistically, emitted photons have energy dispersions, which are usually quantified by the full width half maximum (FWHM) of the emission peak. The intrinsic emission peak broadening of perovskite QDs is mainly a result of electron–phonon coupling (Fig. 11(a)). It is important that the intrinsic FWHM should be determined with single particle spectroscopy to avoid the spectral broadening induced by ensemble size dispersions (Fig. 11(a)). | ||
| Fig. 11 (a) Illustration of PL spectral line broadening at room temperature. The Fourier-limited natural PL linewidth of perovskite QDs is broadened through exciton–phonon coupling, resulting in a Lorentzian shape. In the ensemble, this Lorentzian peak is further broadened by size/shape inhomogeneity, resulting in a Gaussian line shape. (b) Ensemble (top) and single (bottom) QD spectra of ∼ 4 nm (blue) and ∼11 nm (red) CdPbBr3 perovskite QDs, showing PL line broadening with reduced size and with ensemble inhomogeneity. (c) Single QD (∼16 nm) spectra of representative perovskite QDs before (blue) and after (red) surface conditioning. Reproduced with permission under Creative Commons CC BY license from ref. 144. Copyright 2022, The Author(s). | ||
Studying the optical properties of single QDs often requires spatially separated and immobilized individual QDs. To prepare single QD samples, colloidal QDs are diluted and suspended into polymer solutions followed by drying. However, the ionic perovskite QDs can lose surface ligands and ions during dilution and drying processes, changing their optical properties. Due to the limited chemical stability of perovskite QDs, an earlier study has adopted a solution-based photon-correlation method to study single perovskite QDs in the colloidal phase.145 In this measurement, single QDs are not surveyed one at a time. Instead, QDs are allowed to freely diffuse through a focused laser beam. The photons emitted by the diffusing NCs are parsed into pairs of photons originating from the same and different NCs. The coherent length of these photon pairs can be then reconstructed to obtain the emission spectral linewidth from a single NC in solution.146
Recently, large perovskite QDs with different ligands that can suppress surface ligand loss enabled spectral linewidth studies using conventionally prepared perovskite QDs dispersed in polymer films.145 The resulting single perovskite QDs (∼16 nm) shows a FHWM of ∼90 meV. When perovskite QDs becomes smaller, it was found that the PL emission linewidth increases, due to the increased coupling between the quantum confined exciton and low-energy surface phonons (Fig. 11(b)). After changing the chemical composition of the surface, the FWHM of single perovskite QD is reported to be reduced to ∼35 meV (Fig. 11(c)). This suggests that the natural linewidth of perovskite QDs may be very narrow if decoupled with surface phonons. However, to date, systematic studies on the size-dependent linewidth in single perovskite QDs with strong quantum confinement is still curtailed by their poor stability. Future works focusing on improving the chemical and photostability of individual perovskite QDs at room temperatures are highly expected.
4.3. Biexciton emission in single perovskite QDs
Other than photon emission rate and coherence, one of the most important characteristics of a SPE is its single photon purity – the probability that the photon source emit only one photon at a time. When a QD is photo-excited, there is a probability that two or more excitons can be generated simultaneously and undergo a multi-photon cascade emission,147 compromising its single photon purity. Fortunately, the size confinement in QDs can enhance the coulombic interaction between multiple excitons and in turn accelerate the nonradiative exciton–exciton Auger recombination to annihilate the multi-photon emissions.148 In a biexciton Auger recombination process, one exciton recombines non-radiatively and give its energy to any charge carriers in the other exciton (Fig. 12(a)). The size-dependent rates of the biexciton Auger recombination in CsPbX3 (X = Cl, Br, I) perovskite QDs were found to be 10–100 times faster than that of traditional CdSe QDs.149,150 Consequently, strongly-confined perovskite QDs can possibly achieve high single photon purities at saturated excitation rates for bright single photon sources. | ||
| Fig. 12 (a) Schematic illustration of Auger recombination annihilating biexcitons. When a biexciton is created in QDs, one electron–hole pair will recombine and pass its energy to a third charge carrier (can be either an electron or a hole). This energy is then dissipated through thermal relaxation, resulting in a single exciton. (b) Schematic illustration of an HBT configuration and a g(2) interferogram generated under pulsed excitation. The peak near zero delay time represents the events of multi-exciton emission, while the side peaks represent the events of subsequent single photons with intervals of repetition time. (c) g(2) of a single CsPbI3 QD (∼10 nm) showing ∼98% single photon purity. Reproduced from ref. 151. Copyright 2021, American Chemical Society (d) Confinement-dependent g(2)(0) of weakly-confined (∼10 nm) and strongly-confined (∼ 6.6 nm) CsPbI3 QDs. Reproduced under CC-BY-NC-ND 4.0 license from ref. 152. Copyright 2022, The Authors. Published by the American Chemical Society. (e) g(2) of a strongly-confined CsPbBr3 perovskite QD (∼ 5 nm) showing ∼73% single photon purity. Reproduced under CC-BY-NC-ND 4.0 license from ref. 43. Copyright 2023, The Authors. Published by the American Chemical Society. (f) g(2) of a strongly-confined CsPbBr3 perovskite QD embedded in phenethylammonium bromide matrix, showing ∼95% single photon purity. Reproduced with permission from ref. 41. Copyright 2023, American Chemical Society. | ||
The single photon purity of a single QD is evaluated using second-order photon correlation (g(2)) measurements. The g(2) measurements are typically performed using a Hanbury Brown and Twiss (HBT) configuration: photon stream emitted from a single QD is split by a 50/50 beam splitter and sent into two single photon detectors (Fig. 12(b)).153 The detection events from both detectors are time-tagged and correlated to generate a g(2) interferogram (Fig. 12(b)). A single photon can only trigger one of the two detectors. When two photons are emitted, there is a certain chance that both detectors are triggered simultaneously. That is to say, the only events that can contribute to the g(2) interferogram near zero delay time are the two photon (or multi-photon) emissions. Mathematically, the second order correlation function is defined and constructed as in eqn (9):
 | (9) |
 | (10) |
| g(2)(τ) = 1 − [1 − g(2)(0)]exp(−krτ) | (11) |
Many earlier works have used CsPbI3 QDs for single QD spectroscopic studies since they can better tolerate surface defects.153 Additionally, their larger exciton Bohr diameter compared to CsPbBr3 or CsPbCl3 makes quantum confinement more accessible.152 At moderate excitation rates, quantum-confined single CsPbI3 (∼10 nm) QDs show less than 3% biexciton QY, which is equivalent to 97% of single purity.154 Two recent works also demonstrated that smaller (5 nm and 9.8 nm) single CsPbI3 QDs can achieve a g(2)(0) value as low as 2% (Fig. 12(c)).151,152 The higher single photon purity of smaller QDs is attributed to the faster nonradiative Auger recombination rate promoted by stronger confinement. For example, the average g(2)(0) of single CsPbI3 QDs decrease from 18% (over 16 QDs) to 9.6% (over 77 QDs), when their average size reduced from 10 nm to 6.6 nm (Fig. 12(d)).152
Compared with CsPbI3 QDs, their bromide counterpart is more susceptible to degradation during single QD sample preparation and spectroscopic measurements. Pioneer works on weakly-confined single CsPbBr3 QDs at cryogenic temperature exhibits high biexciton emission probabilities from ∼20% to 100%.130,142,155,156 Given the lack of quantum confinement, low single photon emission purity is expected. Strongly-confined CsPbBr3 QDs usually cannot survive intense laser illuminations.152 As a result, few studies focused on strongly-confined CsPbBr3 QDs with particle size smaller than 7 nm (the exciton Bohr diameter in CsPbBr3) have been reported. Advances on surface ligand exchange and polymer matrix have been made to improve the surface passivation and photostability of small CsPbBr3 QDs. For example, 5 nm CsPbBr3 QDs can remain photostable when passivated by DDAB.43 However, the QD showed a high biexciton emission probability of 27% (Fig. 12(e)), close to the value obtained from weakly-confined CsPbBr3 QDs.152 Most recently, single CsPbBr3 QDs with size of 4 nm was successfully stabilized by a molecular crystal matrix made of phenethylammonium bromide (PEABr) and showed a promising single photon purity of >95% (Fig. 12(f)).41 The large variance of experimentally measured biexciton QY in perovskite QDs suggest that the exciton and biexciton recombination dynamics can be strongly related to the surface structure and quality of the single QD sample. Understanding the fundamental origins of such an inconsistency will require future efforts.
4.4. PL blinking in single perovskite QDs
Single QDs are usually subject to PL stochastic intermittencies (often referred to as “blinking”): the PL intensity switching between a high intensity PL “ON” state and a low intensity PL “OFF” state.157 This is only observable in single QD studies and will be averaged out in ensembles. For single QD based SPEs, blinking compromises the single photon emission brightness and stability.It is generally believed that the PL of a QD will be turned “OFF” when it is charged. Like biexcitons, charged excitons (usually referred to as trions) can also undergo fast Auger-type non-radiative recombination. When the charge is removed, the QD will be turned “ON” again.158 Such a blinking mechanism is called Auger blinking (Fig. 13(a)) and is arguably the most generic blinking mechanism in QDs. Additionally, trap states can also be photo-activated and add non-radiative recombination channels to the band-edge carriers. Such non-radiative process is usually slower than Auger recombination. As a result, the PL intensity will be attenuated but not completely turn “OFF”, which is reflected as a “gray” state in blinking measurements.159 This kind of blinking is often referred to as band-edge carrier (BC) blinking (Fig. 13(a)).159 Other blinking models such as hot carrier trapping and charge transfer have also been proposed.158 Generally speaking, these blinking models are all related to the surface of QDs. Thus, exploring the blinking behavior is crucial for understanding the surface status and exciton recombination dynamics on single QD level for developing QD based SPEs.
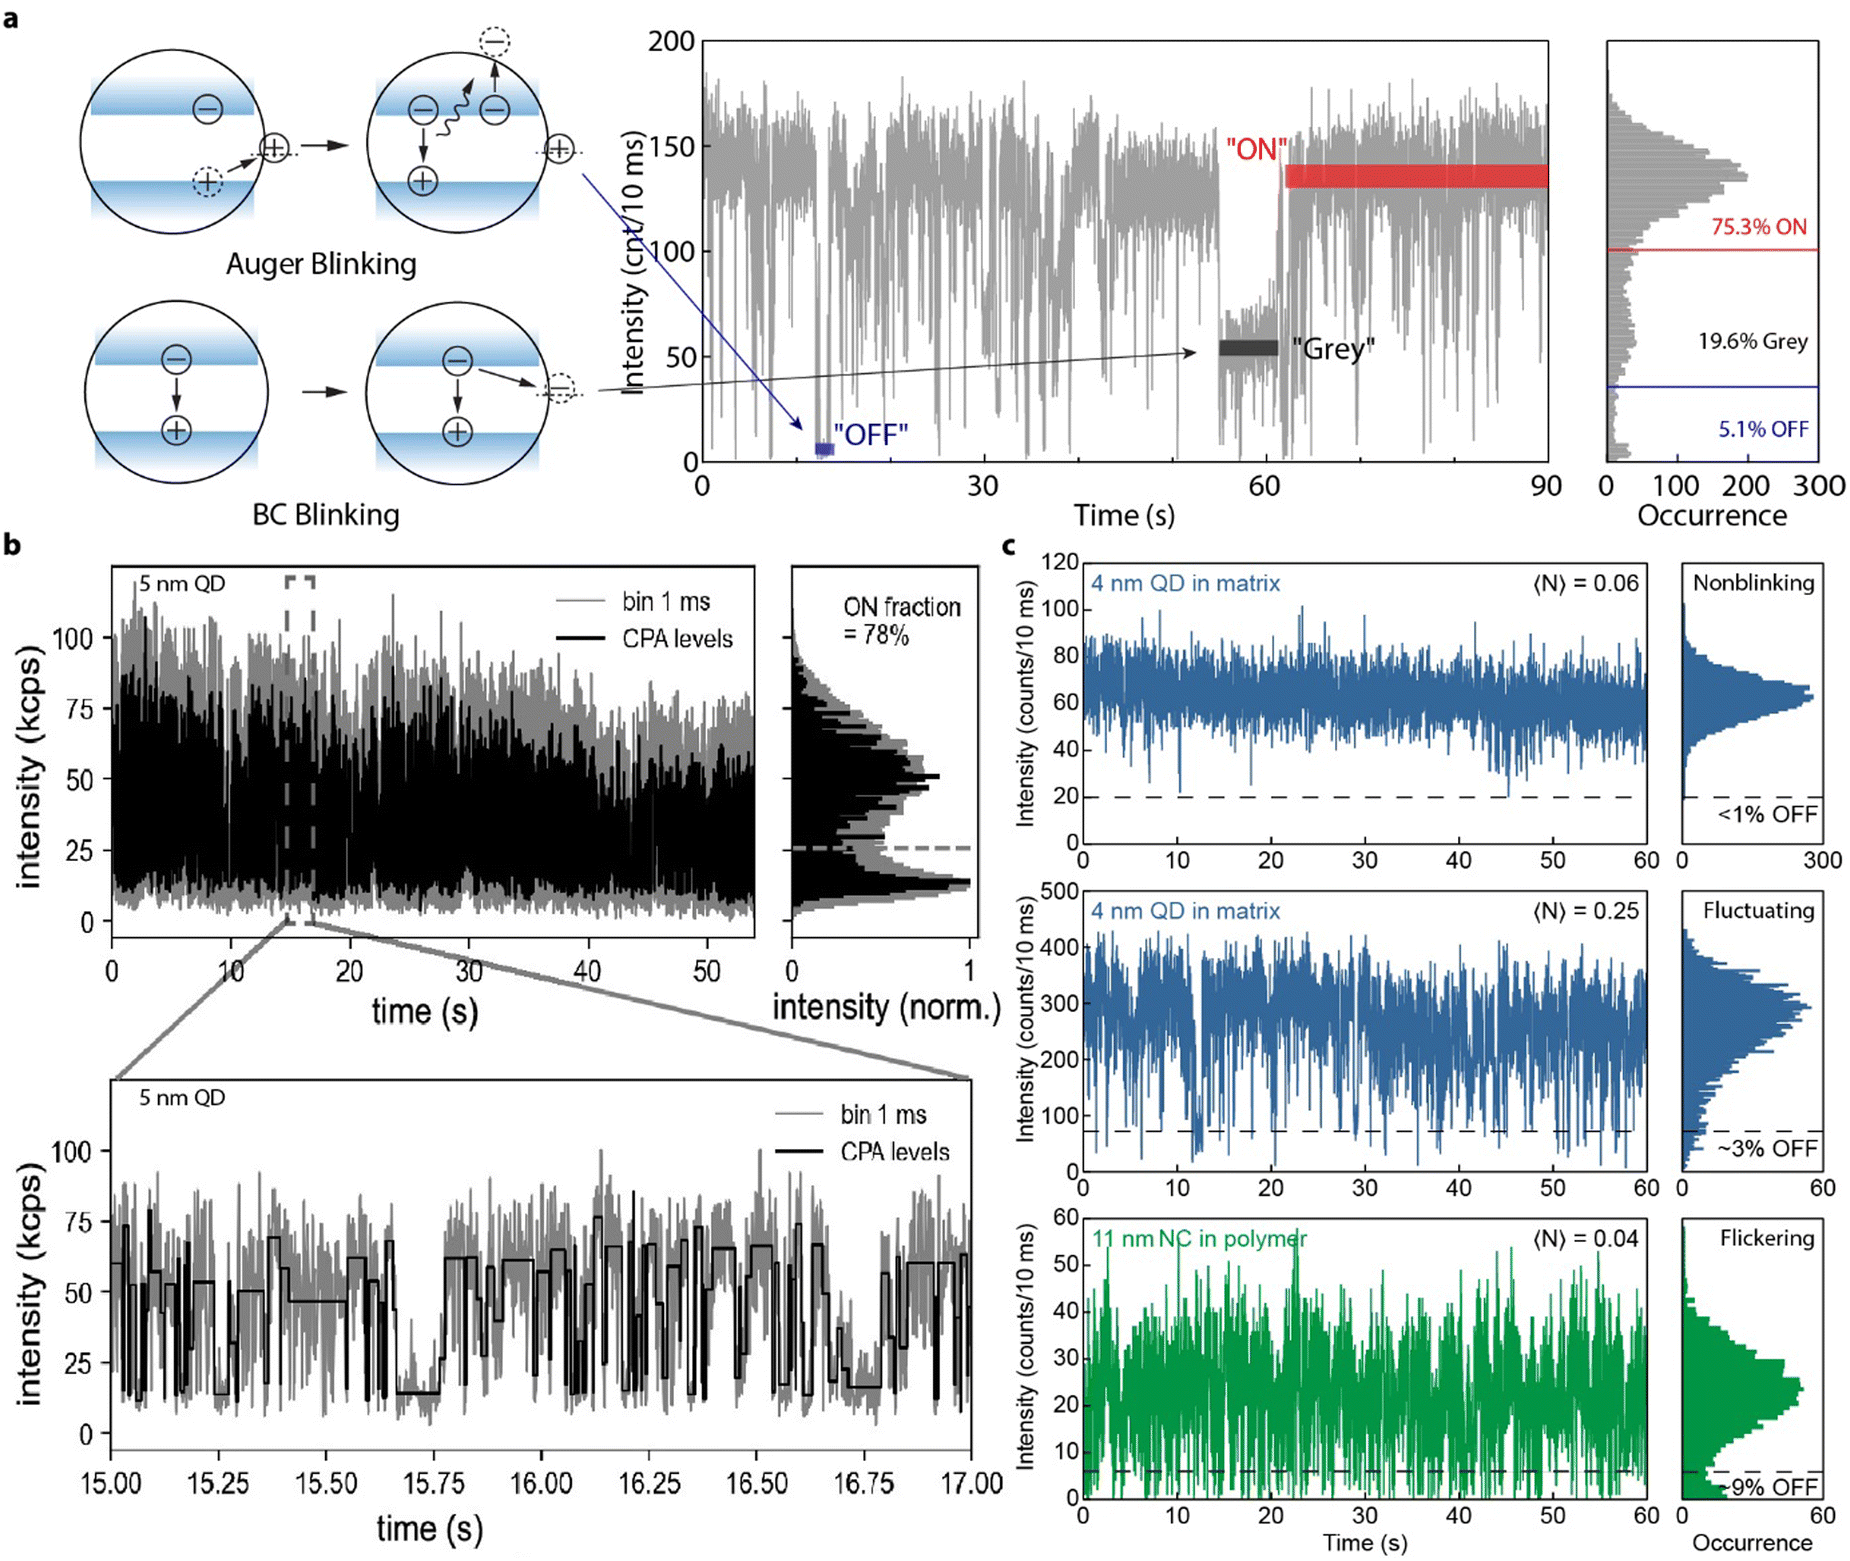 | ||
| Fig. 13 (a) Schematic illustrations (left) and a representative blinking trace (right) of Auger and BC blinking mechanisms. In Auger blinking, when a charge-carrier from an exciton is trapped at the surface, the remaining charge-carrier forms a trion with subsequently generated excitons, leading to efficient Auger recombination to turn the QD “OFF” (blue strip on the blinking trace). In BC blinking, photo-activation of a nonradiative channel will compete with exciton radiative recombination, reducing the PLQY of the QDs, and leading to a “grey” state (black strip on the blinking trace). Thresholds can be drawn on the blinking occurrence histogram to give a fraction of each state. (b) A Blinking trace of a strongly-confined CsPbBr3 perovskite QD (∼5 nm) showing fast alternation between “ON” and “OFF” states. When plotted with a smaller bin time (bottom), the blinking trace exhibits binary behavior. Reproduced from ref. 43. (c) Blinking trace of a strongly-confined CsPbBr3 perovskite QD (∼ 4 nm) embedded in an organic bromide salt matrix, showing nearly nonblinking behavior at a low excitation rate (top, blue). The PL intensity starts fluctuating well above the “OFF” threshold when the excitation rate increases (middle, blue). A similar PL intensity fluctuation is observed at a low excitation rate from a weakly-confined CsPbBr3 NC (∼11 nm) dispersed in a polymer matrix (bottom, green). Reproduced from ref. 41. Copyright 2023, American Chemical Society. | ||
Lead halide perovskite QDs often experience more severe blinking than core–shell CdSe QDs. Due to the unknown nature of the surface (defect identity and density) of single perovskite QDs, their PL intensity often show fast alternation between “ON” and “OFF” states (also referred to as “flickering”, Fig. 13(c)).41,158,160 Significant efforts have been made to understand the exciton dynamics in perovskite QDs. For weakly-confined CsPbI3 perovskite QDs, Auger blinking was mainly observed. In FAPbBr3 and CsPbBr3 perovskite QDs, both Auger and BC blinking were observed.161–164 Efforts have also been made to reduce PL blinking of perovskite QDs. For example, charged excitons154,161 in perovskite QDs can be suppressed by surface treatments using NaBF4, which can passivate the halide vacancies and in turn reduce blinking of CsPbBr3 QDs.165 Nevertheless, these studies are limited to weakly-confined perovskite QDs.
The blinking mechanism of strongly-confined QDs is rarely studied due to their insufficient stability. 6.6 nm CsPbI3 QDs show frequent “OFF” states and PL intensity fluctuations at intensity levels between “ON” and “OFF” states.152 CsPbBr3 with size of 5 nm also shows severe PL intensity flickering even with improve surface ligand coverage (Fig. 13(b)).43 A recent work41 found that when CsPbBr3 QDs (4 nm) are embedded in an organic salt matrix, their photostability is significantly improved and their PL blinking can be almost completely suppressed at low excitation rates. However, when the excitation rates are higher, the PL intensity starts to fluctuate well above the off state. In comparison, weakly-confined CsPbBr3 perovskite NCs dispersed in polymer matrices (which is a typical sample preparation method for single QD studies) exhibit similar PL intensity fluctuations as the strongly-confined QDs, even at a low excitation rate (Fig. 13(c)). This newly observed blinking behavior is attributed to a slow Auger recombination in a biexciton-like state that consists of an exciton and a trapped exciton.41 These studies suggest that tuning the surface condition of single perovskite QDs, especially when they are strongly-confined, is crucial to improving their photostability and controlling their exciton dynamics for single photon source developments.
In summary, perovskite QDs are promising quantum light source materials for their fast PL remission rate and increased coherent photon emissions with narrow spectral linewidth. To develop perovskite QD based quantum light sources with simultaneous high brightness and single photon emission purity, strongly quantum confined perovskite QDs are needed. While the single photon emission purity of perovskite QD can be enhanced by reducing its size, the excitonic fine structure, PL linewidth, and photostability are also affected. Studies on single perovskite QDs with strong quantum confinement are challenging, and in particular are limited still curtailed by the insufficient chemical and photo stability of individual perovskite QDs. There are many possibilities that remain to be explored on understanding single perovskite QD surface chemistry, and in fabricating single photon emission devices based on perovskite QDs.
5. Progress in perovskite quantum dot LEDs
Perovskite light-emitting diodes (PeLEDs) based on nanocrystals have gained tremendous attention over the past decade. Despite the success in developing green, and near-infrared PeLEDs, deep-blue (∼465 nm) and pure-red (∼630 nm) PeLEDs still suffer from spectral instability at high operating voltages due to ion migration in mixed-halide systems.45 Single-halide perovskites with strong quantum confinement provides an alternative solution for fabricating highly efficient and spectrally-stable blue devices (Fig. 14(a)–(c)). In this section, we will discuss the recent progress in strongly-confined QD PeLEDs, and provide future guidelines for further improving the device efficiency and stability (Table 2). | ||
| Fig. 14 Strongly-confined perovskite QDs for LEDs. (a)–(c) 1931 Commission Internationale d’Éclairage (CIE) diagram for bulk thin films, weakly-confined NCs and strongly-confined QDs in perovskite LEDs, respectively.22,49 The white triangle represent the color gamut for the REC.2020 standard for ultrahigh definition displays, and the black triangle represents the color gamut obtained for different combinations of perovskite emitters. In all three cases shown, we take the green point to be the green color coordinate of the REC.2020 standard,166 and focus our comparison on red and blue emitters, which benefit from the effects of strong confinement. (d) Development in the EQE of perovskite LEDs based on strongly-confined QDs. A comparison with the state-of-the-art performance from LEDs based on weakly-confined perovskite NCs (diamonds) and bulk thin films (open squares) are provided. EQE vs. current density plots for bulk, weakly-confined NCs and strongly-confined QDs for (e) blue LEDs and (f) red LEDs. The red QD LED data are from ref. 47–50 while the blue QD LED data are from ref. 22, 30 and 51. The weakly-confined NC LED data are from ref. 167 and 168 and the thin film LED data are from ref. 169 and 170. | ||
| Materials | EL peak centre (nm) | EQE (%) | Size (nm) | Year/Ref. |
|---|---|---|---|---|
| a On substrate quantum-dot synthesis. | ||||
| Red emitter | ||||
| CsPbI3 QDs | 678 | 5.92 | 5.38 | 201913 |
| CsPbI3 QDs | 630 | 6.4 | 5 | 202147 |
| CsPbI3 QDs | 634 | 7.1 | 6.5 | 202248 |
| CsPbI3 QDs | 650 | 18 | 5 | 202249 |
| CsPbI3a QDs | 679 | 20.8 | 6.5 | 202222 |
| CsPbI3 QDs | 644 | 28.5 | 5.4 | 202450 |
| CsPbI3 NPL | 634 | 5.3 | 2.6 (thickness) | 2023171 |
| CsPbI3 NPL | 609 | 2.7 | 2.5 (thickness) | 202452 |
| MAPb(BrxI1−x)3 NC | 620 | 20.3 | 12 | 2021168 |
| ((PEA)NMA)2CsPb2I7 film | 680 | 25.8 | Quasi-2D | 2022170 |
| Blue emitter | ||||
| CsPbBr3 QDs | 470 | 12.3 | 4.2 | 2020172 |
| CsPbBr3 QDs | 470 | 4.7 | 4 | 202151 |
| CsPbBr3a QDs | 465 | 10.3 | 3.5 | 202222 |
| CsPbBr3a QDs | 480 | 17.9 | 4.2 | 202222 |
| CsPbBr3 NPL | 455 | 4.15 | 2 (thickness) | 2023173 |
| CsPb(BrxCl1−x)3 NC | 470 | 6.3 | 9.2 | 2020167 |
| CsPb(BrxCl1−x)3 bulk film | 483 | 18.65 | Bulk | 2023169 |
Fig. 14(a)–(c) shows that the strongly-confined QD PeLEDs (red and blue LEDs) can cover a larger part of the color gamut than bulk or weakly-confined NC PeLEDs.22–47,51,52,167–170,173,174 The white triangle represents the REC.2020 standard for achieving ultrahigh definition displays. Fig. 14(a) compares the bulk film PeLED with the REC.2020 standard, where it can be seen that PeLEDs based on bulk films cannot fully cover the entire color gamut. This is improved when switching to weakly-confined NC emitters, and is improved further when replacing the blue and red emitters with strongly-confined QDs (Fig. 14(b) and (c)). Importantly, strongly-confined QDs can emit at similar energies as mixed halide perovskite NCs or bulk films, and therefore does not suffer from halide segregation issues during operation. For example, Yuan et al. fabricated blue-emitting CsPbBr3 and red-emitting CsPbI3 PeLEDs using the synthesis-on-substrate method, in which the PbX2 and CsX precursors are mixed with modified ligands and spin-coated onto the substrates. Isolated and monodispersed QDs are formed by changing the concentration of the ligands, the functional group of the ligands used, and the reaction time after initializing the crystallization process using antisolvent dripping. As a result, they achieved stable electroluminescence (EL) from 4 V to 6 V with record EQE for red and blue QD PeLEDs (refer to Table 2).22 Despite the advantage of strongly-confined QDs for PeLEDs in terms of color purity and spectral stability, the larger weakly-confined NCs have the advantages of better operational stability than smaller QDs because of a smaller surface area for potential surface defect formation. For example, Yang et al. reported the operational half-life of large (18 nm) CsPbBr3 NC LEDs to be 5-fold that of LEDs made from smaller (13 nm) perovskite NCs.175 But this operational stability challenge in small QDs can also be addressed by affective nanosurface reconstruction of the QDs to reduce the concentration of surface defects.30,50 For example, Ye and co-workers prepared 5.7 nm diameter CsPbI3 QDs with diisooctylphosphinic acid to reduce the surface defect density, thereby increasing the operational half-life of the red perovskite LEDs from 5.4 min for the pristine QDs to 30 h.50
We and others have shown that the origin of the spectral instability and halide segregation in colloidal systems is the formation of surface defects, which, for example, can result from ligands and surface halide detachment during the purification process.45,78 These challenges with labile ligands are still present in strongly-confined QDs. The ligands (e.g., OLm and OA) are weakly bound to the NC surface, and can be removed easily at high centrifugation speed or in a polar environment. Therefore, it is desirable to use more tightly bound ligands to improve the surface chemical stability and PLQY of the strongly-confined QDs. For example, Chen et al. used amino acids, such as cysteine or glycine, to replace OA and OLm as the X-type ligands during the post-synthetic surface treatment process.49 Resurfacing has also been used for blue QDs with organic-halide salts, such as i-propylammonium bromide (IPABr) and inorganic salts such as NaBr.30 The post-synthetic surface treatment not only allows the passivation of dangling bonds, but also replaces the residual long-chain OA/OLm ligands with short-chain ligands, which is beneficial for improving charge injection and overall device efficiency.
Apart from solution-phase ligand exchange, doping is another commonly used method to improve the device operational stability of strongly-confined QD LEDs. For example, Mn and Sr elements can be used to stabilize CsPbI3 QDs,49,176–178 and Zn and Rb elements can be used to improve CsPbBr3 QDs.30,179 The operating half-lifetime (T50) can be increased from a few minutes to more than 10 h for doped red QD LEDs, and to approximately 1 h for doped blue QDs. The progress made in these efforts to push the external quantum efficiency (EQE) of the strongly-confined QD PeLEDs to approach the EQEs of their weakly-confined NC and thin-film PeLED counterparts is shown in Fig. 14(d). Fig. 14(e) and (f) compares the EQE vs. current density curves for strongly-confined QDs, weakly-confined NCs and thin film PeLEDs. Both NCs and thin film PeLEDs can reach current densities higher than 100 mA cm−2, but QD PeLEDs suffer from roll-off at relatively low injection current densities. This implies that the presence of exciton–exciton annihilation and poor heat management in these strongly-confined QDs as limiting factors. Future studies are necessary to overcome this early roll-off issue because the high current density is needed for high brightness LEDs and lasing applications. Key factors include effective surface reconstruction, appropriate doping strategies, and fine-tuning the thickness of the injection layers to achieve charge balance.
6. Conclusion and perspectives
Halide perovskite nanocrystals exhibit either bulk-like optical properties or quantum size effects, depending on their size and shape relative to their exciton Bohr diameter. This tutorial provides the fundamentals of 0D quantum-confined halide perovskite quantum dots, discussing recent advances in their synthesis, linear optical properties (size-dependent absorption and emission), charge-carrier relaxation and recombination, single-photon emission, and application to LEDs. Generally, the size of the classical QD is tunable by growth kinetics. However, applying this approach to halide perovskites is extremely challenging due to their fast nucleation and growth. In contrast, the size of halide perovskite NCs is controllable by reaction parameters, such as temperature, precursor, or ligand concentration (long-chain alkylammonium bromide), the chemical potential of halides in solution, and by controlling the depletion of precursors using specific ligands (e.g., trioctylphosphine oxide). Despite the recent advances in controlling the size from weakly- to strongly-confined NCs, the level of size control achieved is still far from what has been realized for metal chalcogenide QDs. Moreover, the size-controlled synthesis of halide perovskite NCs has been achieved only for a limited set of compositions, mainly inorganic halide perovskite NCs, while future efforts should also be devoted to realizing strongly-confined hybrid perovskite QDs. In addition, one of the outstanding challenges that remains to be addressed is the synthesis of strongly-confined lead-free perovskite QDs. Although there are a limited number of reports demonstrating the synthesis of CsSnX3 NCs, the level of size-control achieved for these NCs is far behind in comparison to that of CsPbX3 NCs.180 Another major challenge in the synthesis of halide perovskite QDs is their selectivity against the formation of quantum-confined nanoplatelets under similar reaction conditions. For instance, the lowering of the reaction temperature or precursor ratios, or the increase of the concentration of alkylammonium halide ligands can result in the formation of both QDs and 2D nanoplatelets with slight changes in other reaction parameters. Therefore, improved synthesis methods need to be developed for quantum-confined NCs with one specific morphology and size. In addition, the mechanism of size control is still not well understood for halide perovskites. Although recent studies have demonstrated slow nucleation and growth, it is still challenging to achieve size control through size-selective precipitation methods that were previously successfully realized for metal chalcogenide QDs. We believe that the exploration of different ligands that could control the depletion of precursors, thereby decreasing the reaction speed, could help to isolate halide perovskite QDs of specific size by growth time. High-throughput synthesis, including methods like flow synthesis or data-driven robotic platforms, are emerging interdisciplinary approaches that have the potential to speed up the exploration of new synthesis methods, new types of precursors, and ligands for strongly-confined systems. However, we emphasize that these approaches require in situ characterization to understand how the synthetic method should be improved, which may ultimately lead to inverse design approaches.The improvement in synthetic methods to achieve monodisperse strongly-confined perovskite QDs has enabled more in-depth investigations into the photophysics, but there is still much that needs to be uncovered. Important areas of future research include understanding how the hot carrier relaxation process is influenced by changes in the electronic structure (from continuous to discrete as the size of the QD reduces) and coupling with phonons. Furthermore, the effects of surface traps and ligands, as well as quantum and dielectric confinement, on hot carrier cooling kinetics are not well understood. Other interesting areas in the photophysics of strongly-confined QDs may include their spin lifetime and the charge transfer lifetime in the exciton fine structures.
Importantly, approaches to obtain individual perovskite QDs and improve their stability will be critical to push these materials further for single photon emission. Strongly-confined QDs benefit from having stronger absorption than atoms, but still discrete energy states and high exciton–exciton annihilation that enable single photon emission. However, the properties of individual QDs are strongly affected by ligand removal and defect introduction, and these QDs have limited stability under an excitation laser source. It will therefore be very important to develop improved isolation approaches and ligands, for example by incorporating QDs into a polymer matrix. This advance will allow important fundamental investigations to be made, such as how the size, composition and surface passivation influence the linewidth of emission (through coupling with surface phonons), and the coherence lifetime of non-degenerate triplet states. Ultimately, these could enable improvements in single photon emission purity, and the development of perovskite single photon emitter devices.
Although the excitonic properties in perovskite NCs in both the weak and intermediate confinement regimes have been studied both computationally and experimentally, accurate determination of these properties in strongly-confined perovskite QDs is still limited by their poor photostability. Efforts should be made to improve the surface passivation and structural integrity of strongly-confined QDs. In the strongly confined regime, excitons in perovskite QDs can be largely affected by the surface structure, which can show different chemical identities depending on the exposed surface facets. Synthetic efforts on precisely controlling the surface facets, and spectroscopic studies on the corresponding excitonic properties for strongly-confined perovskites, will benefit the development of perovskite QD single photon emitters.
Finally, for device applications, strongly-confined perovskite LEDs currently lag behind in terms of EQE compared to their bulk thin film and weakly-confined NC PeLED counterparts. Methods to realize reliable ligand exchange and improve the thermal management in devices will be critical to overcome the EQE roll-off, and improve the EQE and brightness of these devices.
There is therefore ‘plenty of room at the bottom’, with recent advances paving the way for greater activity in the strong-confined regime for perovskite nanocrystals, from new synthetic approaches, to fundamental investigations into the photophysics, through to efforts to improve their performance in advanced light emission devices.
Author contributions
J. Y., L. P. and R. L. Z. H. conceived of the topic of this tutorial review. All authors wrote the review together.Conflicts of interest
The authors declare no financial or non-financial conflicts of interest.Acknowledgements
J. Y. and R. L. Z. H. acknowledge funding from UK Research and Innovation (UKRI) for a Frontier Grant (no. EP/X022900/1), awarded through the 2021 European Research Council Starting Grant scheme. R. L. Z. H. thanks the Royal Academy of Engineering for support through the Research Fellowships scheme (no. RF\201718\17101). L. P. acknowledges the support from the Spanish Ministerio de Ciencia e Innovación through the Ramón y Cajal grant (no. RYC2018-026103-I) and the Spanish State Research Agency (no. PID2020-117371RA-I00; TED2021-131628A-I00), as well as the grant from the Xunta de Galicia (no. ED431F2021/05). C. M. and Y. D. acknowledge the support from the U.S. Department of Energy, Office of Science, Office of Basic Energy Sciences, under Award Number DE-SC0024441. H. Z. thanks the National Natural Science Foundation of China (no. 52173234). I. L.-F. acknowledges the grant from Xunta de Galicia (ED481A 2022/441).References
- H. Linke Scientific Background to the Nobel Prize in Chemistry 2023: QUANTUM DOTS – SEEDS of NANOSCIENCE, 2023. https://www.nobelprize.org/uploads/2023/10/advanced-chemistryprize2023-3.pdf.
- Y. Yin and A. P. Alivisatos, Nature, 2005, 437, 664–670 CrossRef CAS.
- C. B. Murray, D. J. Norris and M. G. Bawendi, J. Am. Chem. Soc., 1993, 115, 8706–8715 CrossRef CAS.
- A. L. Efros and L. E. Brus, ACS Nano, 2021, 15, 6192–6210 CrossRef CAS.
- L. E. Brus, J. Chem. Phys., 1983, 79, 5566–5571 CrossRef CAS.
- L. E. Brus, J. Chem. Phys., 1984, 80, 4403–4409 CrossRef CAS.
- Q. A. Akkerman, G. Rainò, M. V. Kovalenko and L. Manna, Nat. Mater., 2018, 17, 394–405 CrossRef CAS.
- J. Kim, J. Roh, M. Park and C. Lee, Adv. Mater., 2024, 36, 2212220 CrossRef CAS.
- O. T. Bruns, T. S. Bischof, D. K. Harris, D. Franke, Y. Shi, L. Riedemann, A. Bartelt, F. B. Jaworski, J. A. Carr, C. J. Rowlands, M. W. B. Wilson, O. Chen, H. Wei, G. W. Hwang, D. M. Montana, I. Coropceanu, O. B. Achorn, J. Kloepper, J. Heeren, P. T. C. So, D. Fukumura, K. F. Jensen, R. K. Jain and M. G. Bawendi, Nat. Biomed. Eng., 2017, 1, 0056 CrossRef CAS.
- D. Zhitomirsky, O. Voznyy, L. Levina, S. Hoogland, K. W. Kemp, A. H. Ip, S. M. Thon and E. H. Sargent, Nat. Commun., 2014, 5, 3803 CrossRef CAS.
- J. Liu, B. Shabbir, C. Wang, T. Wan, Q. Ou, P. Yu, A. Tadich, X. Jiao, D. Chu, D. Qi, D. Li, R. Kan, Y. Huang, Y. Dong, J. Jasieniak, Y. Zhang and Q. Bao, Adv. Mater., 2019, 31, 1901644 CrossRef.
- J. Park, H. M. Jang, S. Kim, S. H. Jo and T.-W. Lee, Trends Chem., 2020, 2, 837–849 CrossRef CAS.
- J.-S. Yao, J. Ge, K.-H. Wang, G. Zhang, B.-S. Zhu, C. Chen, Q. Zhang, Y. Luo, S.-H. Yu and H.-B. Yao, J. Am. Chem. Soc., 2019, 141, 2069–2079 CrossRef CAS.
- F. Liu, Y. Zhang, C. Ding, S. Kobayashi, T. Izuishi, N. Nakazawa, T. Toyoda, T. Ohta, S. Hayase, T. Minemoto, K. Yoshino, S. Dai and Q. Shen, ACS Nano, 2017, 11, 10373–10383 CrossRef CAS.
- C. Wang, W. Meng, Y. Li, G. Xu, M. Peng, S. Nie and Z. Deng, Nanoscale, 2023, 15, 1661–1668 RSC.
- Y. Li, R. Lai, X. Luo, X. Liu, T. Ding, X. Lu and K. Wu, Chem. Sci., 2019, 10, 5983–5989 RSC.
- B. Zhang, L. Goldoni, C. Lambruschini, L. Moni, M. Imran, A. Pianetti, V. Pinchetti, S. Brovelli, L. De Trizio and L. Manna, Nano Lett., 2020, 20, 8847–8853 CrossRef CAS.
- A. Manzi, Y. Tong, J. Feucht, E.-P. Yao, L. Polavarapu, A. S. Urban and J. Feldmann, Nat. Commun., 2018, 9, 1518 CrossRef.
- L. Protesescu, S. Yakunin, M. I. Bodnarchuk, F. Krieg, R. Caputo, C. H. Hendon, R. X. Yang, A. Walsh and M. V. Kovalenko, Nano Lett., 2015, 15, 3692–3696 CrossRef CAS.
- M. Baranowski and P. Plochocka, Adv. Energy Mater., 2020, 10, 1903659 CrossRef CAS.
- K. Tanaka, T. Takahashi, T. Ban, T. Kondo, K. Uchida and N. Miura, Solid State Commun., 2003, 127, 619–623 CrossRef CAS.
- Y. Jiang, C. Sun, J. Xu, S. Li, M. Cui, X. Fu, Y. Liu, Y. Liu, H. Wan, K. Wei, T. Zhou, W. Zhang, Y. Yang, J. Yang, C. Qin, S. Gao, J. Pan, Y. Liu, S. Hoogland, E. H. Sargent, J. Chen and M. Yuan, Nature, 2022, 612, 679–684 CrossRef CAS.
- Q. A. Akkerman, T. P. T. Nguyen, S. C. Boehme, F. Montanarella, D. N. Dirin, P. Wechsler, F. Beiglböck, G. Rainò, R. Erni, C. Katan, J. Even and M. V. Kovalenko, Science, 2022, 377, 1406–1412 CrossRef CAS.
- Y. Dong, T. Qiao, D. Kim, D. Parobek, D. Rossi and D. H. Son, Nano Lett., 2018, 18, 3716–3722 CrossRef CAS.
- R. Kubo, J. Phys. Soc. Jpn., 1962, 17, 975–986 CrossRef CAS.
- L. Gao, L. N. Quan, F. P. García de Arquer, Y. Zhao, R. Munir, A. Proppe, R. Quintero-Bermudez, C. Zou, Z. Yang, M. I. Saidaminov, O. Voznyy, S. Kinge, Z. Lu, S. O. Kelley, A. Amassian, J. Tang and E. H. Sargent, Nat. Photonics, 2020, 14, 227–233 CrossRef CAS.
- A. Dey, J. Ye, A. De, E. Debroye, S. K. Ha, E. Bladt, A. S. Kshirsagar, Z. Wang, J. Yin, Y. Wang, L. N. Quan, F. Yan, M. Gao, X. Li, J. Shamsi, T. Debnath, M. Cao, M. A. Scheel, S. Kumar, J. A. Steele, M. Gerhard, L. Chouhan, K. Xu, X.-G. Wu, Y. Li, Y. Zhang, A. Dutta, C. Han, I. Vincon, A. L. Rogach, A. Nag, A. Samanta, B. A. Korgel, C.-J. Shih, D. R. Gamelin, D. H. Son, H. Zeng, H. Zhong, H. Sun, H. V. Demir, I. G. Scheblykin, I. Mora-Seró, J. K. Stolarczyk, J. Z. Zhang, J. Feldmann, J. Hofkens, J. M. Luther, J. Pérez-Prieto, L. Li, L. Manna, M. I. Bodnarchuk, M. V. Kovalenko, M. B. J. Roeffaers, N. Pradhan, O. F. Mohammed, O. M. Bakr, P. Yang, P. Müller-Buschbaum, P. V. Kamat, Q. Bao, Q. Zhang, R. Krahne, R. E. Galian, S. D. Stranks, S. Bals, V. Biju, W. A. Tisdale, Y. Yan, R. L. Z. Hoye and L. Polavarapu, ACS Nano, 2021, 15, 10775–10981 CrossRef CAS.
- H. L. Wells, Z. Anorg. Chem., 1893, 3, 195–210 CrossRef.
- A. Kojima, K. Teshima, Y. Shirai and T. Miyasaka, J. Am. Chem. Soc., 2009, 131, 6050–6051 CrossRef CAS.
- H.-S. Kim, C.-R. Lee, J.-H. Im, K.-B. Lee, T. Moehl, A. Marchioro, S.-J. Moon, R. Humphry-Baker, J.-H. Yum, J. E. Moser, M. Grätzel and N.-G. Park, Sci. Rep., 2012, 2, 591 CrossRef.
- M. M. Lee, J. Teuscher, T. Miyasaka, T. N. Murakami and H. J. Snaith, Science, 2012, 338, 643–647 CrossRef CAS.
- Z. K. Tan, R. S. Moghaddam, M. L. Lai, P. Docampo, R. Higler, F. Deschler, M. Price, A. Sadhanala, L. M. Pazos, D. Credgington, F. Hanusch, T. Bein, H. J. Snaith and R. H. Friend, Nat. Nanotechnol., 2014, 9, 687–692 CrossRef CAS.
- L. C. Schmidt, A. Pertegás, S. González-Carrero, O. Malinkiewicz, S. Agouram, G. Mínguez Espallargas, H. J. Bolink, R. E. Galian and J. Pérez-Prieto, J. Am. Chem. Soc., 2014, 136, 850–853 CrossRef CAS.
- J. Shamsi, A. S. Urban, M. Imran, L. De Trizio and L. Manna, Chem. Rev., 2019, 119, 3296–3348 CrossRef CAS.
- M. V. Kovalenko, L. Protesescu and M. I. Bodnarchuk, Science, 2017, 358, 745–750 CrossRef CAS.
- S. Wang, A. A. Yousefi Amin, L. Wu, M. Cao, Q. Zhang and T. Ameri, Small Struct., 2021, 2, 2000124 CrossRef CAS.
- R. S. Knox, in Collective Excitations in Solids, ed. B. Di Bartolo, Springer, US, Boston, MA, 1983, pp. 183–245 DOI:10.1007/978-1-4684-8878-4_5.
- Y. Zhang, Y. Liu, C. Li, X. Chen and Q. Wang, J. Phys. Chem. C, 2014, 118, 4918–4923 CrossRef CAS.
- V. A. Hintermayr, L. Polavarapu, A. S. Urban and J. Feldmann, ACS Nano, 2018, 12, 10151–10158 CrossRef CAS.
- Y. Dong, Y.-K. Wang, F. Yuan, A. Johnston, Y. Liu, D. Ma, M.-J. Choi, B. Chen, M. Chekini, S.-W. Baek, L. K. Sagar, J. Fan, Y. Hou, M. Wu, S. Lee, B. Sun, S. Hoogland, R. Quintero-Bermudez, H. Ebe, P. Todorovic, F. Dinic, P. Li, H. T. Kung, M. I. Saidaminov, E. Kumacheva, E. Spiecker, L.-S. Liao, O. Voznyy, Z.-H. Lu and E. H. Sargent, Nat. Nanotechnol., 2020, 15, 668–674 CrossRef CAS.
- C. Mi, M. L. Atteberry, V. Mapara, L. Hidayatova, G. C. Gee, M. Furis, W. T. Yip, B. Weng and Y. Dong, J. Phys. Chem. Lett., 2023, 14, 5466–5474 CrossRef CAS.
- C.-Y. Kang, C.-H. Lin, C.-H. Lin, T.-Y. Li, S.-W. Huang Chen, C.-L. Tsai, C.-W. Sher, T.-Z. Wu, P.-T. Lee, X. Xu, M. Zhang, C.-H. Ho, J.-H. He and H.-C. Kuo, Adv. Sci., 2019, 6, 1902230 CrossRef CAS.
- S. C. Boehme, M. I. Bodnarchuk, M. Burian, F. Bertolotti, I. Cherniukh, C. Bernasconi, C. Zhu, R. Erni, H. Amenitsch, D. Naumenko, H. Andrusiv, N. Semkiv, R. A. John, A. Baldwin, K. Galkowski, N. Masciocchi, S. D. Stranks, G. Rainò, A. Guagliardi and M. V. Kovalenko, ACS Nano, 2023, 17, 2089–2100 CrossRef CAS.
- L. G. Feld, Y. Shynkarenko, F. Krieg, G. Rainò and M. V. Kovalenko, Adv. Opt. Mater., 2021, 9, 2100620 CrossRef CAS.
- J. Ye, Z. Li, D. J. Kubicki, Y. Zhang, L. Dai, C. Otero-Martínez, M. A. Reus, R. Arul, K. R. Dudipala, Z. Andaji-Garmaroudi, Y.-T. Huang, Z. Li, Z. Chen, P. Müller-Buschbaum, H.-L. Yip, S. D. Stranks, C. P. Grey, J. J. Baumberg, N. C. Greenham, L. Polavarapu, A. Rao and R. L. Z. Hoye, J. Am. Chem. Soc., 2022, 144, 12102–12115 CrossRef CAS.
- E. T. Hoke, D. J. Slotcavage, E. R. Dohner, A. R. Bowring, H. I. Karunadasa and M. D. McGehee, Chem. Sci., 2015, 6, 613–617 RSC.
- Y.-F. Lan, J.-S. Yao, J.-N. Yang, Y.-H. Song, X.-C. Ru, Q. Zhang, L.-Z. Feng, T. Chen, K.-H. Song and H.-B. Yao, Nano Lett., 2021, 21, 8756–8763 CrossRef CAS.
- W. J. Mir, A. Alamoudi, J. Yin, K. E. Yorov, P. Maity, R. Naphade, B. Shao, J. Wang, M. N. Lintangpradipto, S. Nematulloev, A.-H. Emwas and A. Genovese, O. F. Mohammed and O. M. Bakr, J. Am. Chem. Soc., 2022, 144, 13302–13310 CrossRef CAS.
- D. Chen, P. K. Ko, C. H. A. Li, B. Zou, P. Geng, L. Guo and J. E. Halpert, ACS Energy Lett., 2023, 8, 410–416 CrossRef CAS.
- H. Li, Y. Feng, M. Zhu, Y. Gao, C. Fan, Q. Cui, Q. Cai, K. Yang, H. He, X. Dai, J. Huang and Z. Ye, Nat. Nanotechnol., 2024, 19, 638–645 CrossRef CAS.
- C. Bi, Z. Yao, X. Sun, X. Wei, J. Wang and J. Tian, Adv. Mater., 2021, 33, 2006722 CrossRef CAS.
- J. Ye, A. Ren, L. Dai, T. K. Baikie, R. Guo, D. Pal, S. Gorgon, J. E. Heger, J. Huang, Y. Sun, R. Arul, G. Grimaldi, K. Zhang, J. Shamsi, Y.-T. Huang, H. Wang, J. Wu, A. F. Koenderink, L. Torrente Murciano, M. Schwartzkopf, S. V. Roth, P. Müller-Buschbaum, J. J. Baumberg, S. D. Stranks, N. C. Greenham, L. Polavarapu, W. Zhang, A. Rao and R. L. Z. Hoye, Nat. Photonics, 2024, 18, 586–594 CrossRef CAS.
- T. Qiao and D. H. Son, Acc. Chem. Res., 2021, 54, 1399–1408 CrossRef CAS.
- Y. Li, X. Luo, Y. Liu, X. Lu and K. Wu, ACS Energy Lett., 2020, 5, 1701–1708 CrossRef CAS.
- A. Dutta, S. K. Dutta, S. Das Adhikari and N. Pradhan, ACS Energy Lett., 2018, 3, 329–334 CrossRef CAS.
- C. Otero-Martínez, D. García-Lojo, I. Pastoriza-Santos, J. Pérez-Juste and L. Polavarapu, Angew. Chem., Int. Ed., 2021, 60, 26677–26684 CrossRef.
- L. Protesescu, S. Yakunin, M. I. Bodnarchuk, F. Bertolotti, N. Masciocchi, A. Guagliardi and M. V. Kovalenko, J. Am. Chem. Soc., 2016, 138, 14202–14205 CrossRef CAS.
- H. Huang, L. Polavarapu, J. A. Sichert, A. S. Susha, A. S. Urban and A. L. Rogach, NPG Asia Mater., 2016, 8, e328–e328 CrossRef CAS.
- C. Otero-Martínez, J. Ye, J. Sung, I. Pastoriza-Santos, J. Pérez-Juste, Z. Xia, A. Rao, R. L. Z. Hoye and L. Polavarapu, Adv. Mater., 2022, 34, 2107105 CrossRef.
- Z.-R. Zhou, Z.-H. Liao and F. Wang, J. Mater. Chem. C, 2023, 11, 3409–3427 RSC.
- N. Pradhan, ACS Phys. Chem. Au, 2022, 2, 268–276 CrossRef CAS.
- Q. Zhang and Y. Yin, ACS Cent. Sci., 2018, 4, 668–679 CrossRef CAS.
- C.-Y. Huang, H. Li, Y. Wu, C.-H. Lin, X. Guan, L. Hu, J. Kim, X. Zhu, H. Zeng and T. Wu, Nano-Micro Lett., 2022, 15, 16 CrossRef.
- H. Hiramatsu and F. E. Osterloh, Chem. Mater., 2004, 16, 2509–2511 CrossRef CAS.
- M. Yarema, O. Yarema, W. M. M. Lin, S. Volk, N. Yazdani, D. Bozyigit and V. Wood, Chem. Mater., 2017, 29, 796–803 CrossRef CAS.
- X. Peng, J. Wickham and A. P. Alivisatos, J. Am. Chem. Soc., 1998, 120, 5343–5344 CrossRef CAS.
- X. Tang, M. Khurana, D. Rossi, L. Luo, A. V. Akimov and D. H. Son, J. Phys. Chem. C, 2022, 126, 18366–18373 CrossRef CAS.
- Y. Bekenstein, B. A. Koscher, S. W. Eaton, P. Yang and A. P. Alivisatos, J. Am. Chem. Soc., 2015, 137, 16008–16011 CrossRef CAS.
- I. Levchuk, A. Osvet, X. Tang, M. Brandl, J. D. Perea, F. Hoegl, G. J. Matt, R. Hock, M. Batentschuk and C. J. Brabec, Nano Lett., 2017, 17, 2765–2770 CrossRef CAS.
- J. Li, L. Gan, Z. Fang, H. He and Z. Ye, J. Phys. Chem. Lett., 2017, 8, 6002–6008 CrossRef CAS.
- X. Luo, R. Lai, Y. Li, Y. Han, G. Liang, X. Liu, T. Ding, J. Wang and K. Wu, J. Am. Chem. Soc., 2019, 141, 4186–4190 CrossRef CAS.
- C. Bi, Z. Yao, J. Hu, X. Wang, M. Zhang, S. Tian, A. Liu, Y. Lu, N. H. de Leeuw, M. Sui and J. Tian, ACS Energy Lett., 2023, 8, 731–739 CrossRef CAS.
- M. C. Weidman, M. Seitz, S. D. Stranks and W. A. Tisdale, ACS Nano, 2016, 10, 7830–7839 CrossRef CAS.
- C. Sun, Y. Jiang, L. Zhang, K. Wei and M. Yuan, ACS Nano, 2023, 17, 17600–17609 CrossRef CAS.
- G. Almeida, L. Goldoni, Q. Akkerman, Z. Dang, A. H. Khan, S. Marras, I. Moreels and L. Manna, ACS Nano, 2018, 12, 1704–1711 CrossRef CAS.
- Z. Liang, S. Zhao, Z. Xu, B. Qiao, P. Song, D. Gao and X. Xu, ACS Appl. Mater. Interfaces, 2016, 8, 28824–28830 CrossRef CAS.
- N. Fiuza-Maneiro, K. Sun, I. López-Fernández, S. Gómez-Graña, P. Müller-Buschbaum and L. Polavarapu, ACS Energy Lett., 2023, 8, 1152–1191 CrossRef CAS.
- J. Ye, M. M. Byranvand, C. O. Martínez, R. L. Z. Hoye, M. Saliba and L. Polavarapu, Angew. Chem., Int. Ed., 2021, 60, 21636–21660 CrossRef CAS.
- J. Xu, H. Chen, L. Grater, C. Liu, Y. Yang, S. Teale, A. Maxwell, S. Mahesh, H. Wan, Y. Chang, B. Chen, B. Rehl, S. M. Park, M. G. Kanatzidis and E. H. Sargent, Nat. Mater., 2023, 22, 1507–1514 CrossRef CAS.
- K. Ji, W. Lin, Y. Sun, L.-S. Cui, J. Shamsi, Y.-H. Chiang, J. Chen, E. M. Tennyson, L. Dai, Q. Li, K. Frohna, M. Anaya, N. C. Greenham and S. D. Stranks, Nat. Mach. Intell., 2023, 5, 1225–1235 CrossRef.
- S. L. Sanchez, Y. Tang, B. Hu, J. Yang and M. Ahmadi, Matter, 2023, 6, 2900–2918 CrossRef CAS.
- H. Zhao, W. Chen, H. Huang, Z. Sun, Z. Chen, L. Wu, B. Zhang, F. Lai, Z. Wang, M. L. Adam, C. H. Pang, P. K. Chu, Y. Lu, T. Wu, J. Jiang, Z. Yin and X.-F. Yu, Nat. Synth., 2023, 2, 505–514 CrossRef.
- M. P. Arciniegas and L. Manna, Device, 2023, 1, 100185 CrossRef.
- R. W. Epps, K. C. Felton, C. W. Coley and M. Abolhasani, Lab Chip, 2017, 17, 4040–4047 RSC.
- G. Chen, X. Zhu, C. Xing, Y. Wang, X. Xu, J. Bao, J. Huang, Y. Zhao, X. Wang, X. Zhou, X. Du and X. Wang, Adv. Photonics Res., 2023, 4, 2200230 CrossRef CAS.
- L. Wu, Z. Chen, Z. Yuan, B. Wu, S. Liu, Z. Wang, J. P. Mailoa, C. Duan, H. Huang, C.-Y. Hsieh, X.-F. Yu and H. Zhao, Adv. Opt. Mater., 2023, 2301245 Search PubMed.
- A. C. Vaucher, F. Zipoli, J. Geluykens, V. H. Nair, P. Schwaller and T. Laino, Nat. Commun., 2020, 11, 3601 CrossRef.
- A. C. Vaucher, P. Schwaller, J. Geluykens, V. H. Nair, A. Iuliano and T. Laino, Nat. Commun., 2021, 12, 2573 CrossRef CAS.
- N. J. Szymanski, B. Rendy, Y. Fei, R. E. Kumar, T. He, D. Milsted, M. J. McDermott, M. Gallant, E. D. Cubuk, A. Merchant, H. Kim, A. Jain, C. J. Bartel, K. Persson, Y. Zeng and G. Ceder, Nature, 2023, 624, 86–91 CrossRef CAS.
- J. Leeman, Y. Liu, J. Stiles, S. B. Lee, P. Bhatt, L. M. Schoop and R. G. Palgrave, PRX Energy, 2024, 3, 011002 CrossRef.
- K. Higgins, S. M. Valleti, M. Ziatdinov, S. V. Kalinin and M. Ahmadi, ACS Energy Lett., 2020, 5, 3426–3436 CrossRef CAS.
- S. Chen, L. Zhang, Y. Liu, Z. Zhang, Y. Li, W. Cai, H. Lv, Y. Qin and Q. Liao, and B. J. J. o. M. C. A. Zhou, J. Mater. Chem., 2021, 9, 25502–25512 RSC.
- K. Higgins, M. Ziatdinov, S. V. Kalinin and M. Ahmadi, J. Am. Chem. Soc., 2021, 143, 19945–19955 CrossRef CAS.
- J. Nette, P. D. Howes and A. J. deMello, Adv. Mater. Technol., 2020, 5, 2000060 CrossRef CAS.
- L. Bezinge, R. M. Maceiczyk, I. Lignos, M. V. Kovalenko and A. J. deMello, ACS Appl. Mater. Interfaces, 2018, 10, 18869–18878 CrossRef CAS.
- R. M. Maceiczyk, K. Dümbgen, I. Lignos, L. Protesescu, M. V. Kovalenko and A. J. deMello, Chem. Mater., 2017, 29, 8433–8439 CrossRef CAS.
- K. Antami, F. Bateni, M. Ramezani, C. E. Hauke, F. N. Castellano and M. Abolhasani, Adv. Funct. Mater., 2022, 32, 2108687 CrossRef CAS.
- K. Zhang, Y. Gao, B. Pinho, R. L. Z. Hoye, S. D. Stranks and L. Torrente-Murciano, Chem. Eng. J., 2023, 451, 138752 CrossRef CAS.
- R. W. Epps, M. S. Bowen, A. A. Volk, K. Abdel-Latif, S. Han, K. G. Reyes, A. Amassian and M. Abolhasani, Adv. Mater., 2020, 32, 2001626 CrossRef CAS.
- H. Min, J. Chang, Y. Tong, J. Wang, F. Zhang, Z. Feng, X. Bi, N. Chen, Z. Kuang, S. Wang, L. Yuan, H. Shi, N. Zhao, D. Qian, S. Xu, L. Zhu, N. Wang, W. Huang and J. Wang, Nat. Photonics, 2023, 17, 755–760 CrossRef CAS.
- P. V. Balachandran, B. Kowalski, A. Sehirlioglu and T. Lookman, Nat. Commun., 2018, 9, 1688 CrossRef.
- Y. Zhao, J. Zhang, Z. Xu, S. Sun, S. Langner, N. T. P. Hartono, T. Heumueller, Y. Hou, J. Elia, N. Li, G. J. Matt, X. Du, W. Meng, A. Osvet, K. Zhang, T. Stubhan, Y. Feng, J. Hauch, E. H. Sargent, T. Buonassisi and C. J. Brabec, Nat. Commun., 2021, 12, 2191 CrossRef CAS.
- Z. Zheng, O. Zhang, C. Borgs, J. T. Chayes and O. M. Yaghi, J. Am. Chem. Soc., 2023, 145, 18048–18062 CrossRef CAS.
- D. A. Boiko, R. MacKnight, B. Kline and G. Gomes, Nature, 2023, 624, 570–578 CrossRef CAS.
- Z.-Y. Chen, F.-K. Xie, M. Wan, Y. Yuan, M. Liu, Z.-G. Wang, S. Meng and Y.-G. Wang, Chin. Phys. B, 2023, 32, 118104 CrossRef.
- S. Kahmann and M. A. Loi, J. Mater. Chem. C, 2019, 7, 2471–2486 RSC.
- V. I. Klimov, Los Alamos Sci., 2003, 28, 214–220 CAS.
- V. I. Klimov, J. Phys. Chem. B, 2000, 104, 6112–6123 CrossRef CAS.
- Y. Li, T. Ding, X. Luo, Y. Tian, X. Lu and K. Wu, Chem. Mater., 2020, 32, 549–556 CrossRef CAS.
- A. Patra, S. Bera, D. Nasipuri, S. K. Dutta and N. Pradhan, ACS Energy Lett., 2021, 6, 2682–2689 CrossRef CAS.
- J. M. Pietryga, Y.-S. Park, J. Lim, A. F. Fidler, W. K. Bae, S. Brovelli and V. I. Klimov, Chem. Rev., 2016, 116, 10513–10622 CrossRef CAS.
- A. I. Ekimov, F. Hache, M. C. Schanne-Klein, D. Ricard, C. Flytzanis, I. A. Kudryavtsev, T. V. Yazeva, A. V. Rodina and A. L. Efros, J. Opt. Soc. Am. B, 1993, 10, 100–107 CrossRef CAS.
- B. P. Carwithen, T. R. Hopper, Z. Ge, N. Mondal, T. Wang, R. Mazlumian, X. Zheng, F. Krieg, F. Montanarella, G. Nedelcu, M. Kroll, M. A. Siguan, J. M. Frost, K. Leo, Y. Vaynzof, M. I. Bodnarchuk, M. V. Kovalenko and A. A. Bakulin, ACS Nano, 2023, 17, 6638–6648 CrossRef CAS.
- L. Dai, Z. Deng, F. Auras, H. Goodwin, Z. Zhang, J. C. Walmsley, P. D. Bristowe, F. Deschler and N. C. Greenham, Nat. Photonics, 2021, 15, 696–702 CrossRef CAS.
- M. Li, S. Bhaumik, T. W. Goh, M. S. Kumar, N. Yantara, M. Grätzel, S. Mhaisalkar, N. Mathews and T. C. Sum, Nat. Commun., 2017, 8, 15299 CrossRef CAS.
- M. Li, S. Bhaumik, T. W. Goh, M. S. Kumar, N. Yantara, M. Grätzel, S. Mhaisalkar, N. Mathews and T. C. Sum, Nat. Commun., 2017, 8, 14350 CrossRef CAS.
- B. Yu, L. Chen, Z. Qu, C. Zhang, Z. Qin, X. Wang and M. Xiao, J. Phys. Chem. Lett., 2021, 12, 238–244 CrossRef CAS.
- R. R. Cooney, S. L. Sewall, E. A. Dias, D. M. Sagar, K. E. H. Anderson and P. Kambhampati, Phys. Rev. B, 2007, 75, 245311 CrossRef.
- M. Righetto, S. S. Lim, D. Giovanni, J. W. M. Lim, Q. Zhang, S. Ramesh, Y. K. E. Tay and T. C. Sum, Nat. Commun., 2020, 11, 2712 CrossRef CAS.
- L. Dai, J. Ye and N. C. Greenham, Light: Sci. Appl., 2023, 12, 208 CrossRef CAS.
- D. P. Nenon, K. Pressler, J. Kang, B. A. Koscher, J. H. Olshansky, W. T. Osowiecki, M. A. Koc, L.-W. Wang and A. P. Alivisatos, J. Am. Chem. Soc., 2018, 140, 17760–17772 CrossRef CAS.
- P. Kambhampati, J. Phys. Chem. Lett., 2021, 12, 4769–4779 CrossRef CAS.
- P. Huang, S. Sun, H. Lei, Y. Zhang, H. Qin and H. Zhong, eLight, 2023, 3, 10 CrossRef.
- Y. Li, T. Ding, X. Luo, Z. Chen, X. Liu, X. Lu and K. Wu, Nano Res., 2019, 12, 619–623 CrossRef CAS.
- F. Krieg, P. C. Sercel, M. Burian, H. Andrusiv, M. I. Bodnarchuk, T. Stöferle, R. F. Mahrt, D. Naumenko, H. Amenitsch, G. Rainò and M. V. Kovalenko, ACS Cent. Sci., 2021, 7, 135–144 CrossRef CAS.
- M. N. Ashner, K. E. Shulenberger, F. Krieg, E. R. Powers, M. V. Kovalenko, M. G. Bawendi and W. A. Tisdale, ACS Energy Lett., 2019, 4, 2639–2645 CrossRef CAS.
- S. B. Naghadeh, B. Luo, Y.-C. Pu, Z. Schwartz, W. R. Hollingsworth, S. A. Lindley, A. S. Brewer, A. L. Ayzner and J. Z. Zhang, J. Phys. Chem. C, 2019, 123, 4610–4619 CrossRef CAS.
- R. Godin, X. Ma, S. González-Carrero, T. Du, X. Li, C.-T. Lin, M. A. McLachlan, R. E. Galian, J. Pérez-Prieto and J. R. Durrant, Adv. Opt. Mater., 2018, 6, 1701203 CrossRef.
- A. Ren, H. Wang, L. Dai, J. Xia, X. Bai, E. Butler-Caddle, J. A. Smith, H. Lai, J. Ye, X. Li, S. Zhan, C. Yao, Z. Li, M. Tang, X. Liu, J. Bi, B. Li, S. Kai, R. Chen, H. Yan, J. Hong, L. Yuan, I. P. Marko, A. Wonfor, F. Fu, S. A. Hindmarsh, A. M. Sanchez, J. Lloyd-Hughes, S. J. Sweeney, A. Rao, N. C. Greenham, J. Wu, Y. Li, Q. Cheng, R. H. Friend, R. V. Penty, I. H. White, H. J. Snaith and W. Zhang, Nat. Photonics, 2023, 17, 798–805 CrossRef CAS.
- H. Utzat, W. W. Sun, A. E. K. Kaplan, F. Krieg, M. Ginterseder, B. Spokoyny, N. D. Klein, K. E. Shulenberger, C. F. Perkinson, M. V. Kovalenko and M. G. Bawendi, Science, 2019, 363, 1068–1072 CrossRef CAS.
- M. A. Becker, R. Vaxenburg, G. Nedelcu, P. C. Sercel, A. Shabaev, M. J. Mehl, J. G. Michopoulos, S. G. Lambrakos, N. Bernstein, J. L. Lyons, T. Stöferle, R. F. Mahrt, M. V. Kovalenko, D. J. Norris, G. Rainò and A. L. Efros, Nature, 2018, 553, 189–193 CrossRef CAS.
- A. L. Efros and A. L. Efros, Sov. Phys. Semicond., 1982, 16, 772–775 Search PubMed.
- P. C. Sercel, J. L. Lyons, D. Wickramaratne, R. Vaxenburg, N. Bernstein and A. L. Efros, Nano Lett., 2019, 19, 4068–4077 CrossRef CAS.
- V. I. Klimov, Nanocrystal Quantum Dots, CRC Press, 2nd edn, 2010 Search PubMed.
- O. Labeau, P. Tamarat and B. Lounis, Phys. Rev. Lett., 2003, 90, 257404 CrossRef.
- C. C. Stoumpos, C. D. Malliakas, J. A. Peters, Z. F. Liu, M. Sebastian, J. Im, T. C. Chasapis, A. C. Wibowo, D. Y. Chung, A. J. Freeman, B. W. Wessels and M. G. Kanatzidis, Cryst. Growth Des., 2013, 13, 2722–2727 CrossRef CAS.
- V. M. Goldschmidt, Naturwissenschaften, 1926, 14, 477–485 CrossRef CAS.
- P. Tamarat, M. I. Bodnarchuk, J.-B. Trebbia, R. Erni, M. V. Kovalenko, J. Even and B. Lounis, Nat. Mater., 2019, 18, 717–724 CrossRef CAS.
- I. Levchuk, A. Osvet, X. F. Tang, M. Brandl, J. D. Perea, F. Hoegl, G. J. Matt, R. Hock, M. Batentschuk and C. J. Brabec, Nano Lett., 2017, 17, 2765–2770 CrossRef CAS.
- K. Cho, T. Yamada, H. Tahara, T. Tadano, H. Suzuura, M. Saruyama, R. Sato, T. Teranishi and Y. Kanemitsu, Nano Lett., 2021, 21, 7206–7212 CrossRef CAS.
- P. Tamarat, L. Hou, J. B. Trebbia, A. Swarnkar, L. Biadala, Y. Louyer, M. I. Bodnarchuk, M. V. Kovalenko, J. Even and B. Lounis, Nat. Commun., 2020, 11, 6001 CrossRef CAS.
- A. E. K. Kaplan, C. J. Krajewska, A. H. Proppe, W. W. Sun, T. Sverko, D. B. Berkinsky, H. Utzat and M. G. Bawendi, Nat. Photonics, 2023, 17, 775 CrossRef CAS.
- Y. Han, W. Liang, X. Lin, Y. Li, F. Sun, F. Zhang, P. C. Sercel and K. Wu, Nat. Mater., 2022, 21, 1282–1289 CrossRef CAS.
- G. Rainò, N. Yazdani, S. C. Boehme, M. Kober-Czerny, C. L. Zhu, F. Krieg, M. D. Rossell, R. Erni, V. Wood, I. Infante and M. V. Kovalenko, Nat. Commun., 2022, 13, 2587 CrossRef.
- H. Utzat, K. E. Shulenberger, O. B. Achorn, M. Nasilowski, T. S. Sinclair and M. G. Bawendi, Nano Lett., 2017, 17, 6838–6846 CrossRef CAS.
- J. Cui, A. P. Beyler, L. F. Marshall, O. Chen, D. K. Harris, D. D. Wanger, X. Brokmann and M. G. Bawendi, Nat. Chem., 2013, 5, 602–606 CrossRef CAS.
- N. Hiroshige, T. Ihara and Y. Kanemitsu, Phys. Rev. B, 2017, 95, 245307 CrossRef.
- I. Robel, R. Gresback, U. Kortshagen, R. D. Schaller and V. I. Klimov, Phys. Rev. Lett., 2009, 102, 177404 CrossRef.
- Y. S. Park, W. K. Bae, J. M. Pietryga and V. I. Klimov, ACS Nano, 2014, 8, 7288–7296 CrossRef CAS.
- R. Vaxenburg, A. Rodina, E. Lifshitz and A. L. Efros, Nano Lett., 2016, 16, 2503–2511 CrossRef CAS.
- B. W. Hsu, Y. T. Chuang, C. Y. Cheng, C. Y. Chen, Y. J. Chen, A. Brumberg, L. Yang, Y. S. Huang, R. D. Schaller, L. J. Chen, C. S. Chuu and H. W. Lin, ACS Nano, 2021, 15, 11358–11368 CrossRef CAS.
- C. L. Zhu, M. Marczak, L. Feld, S. C. Boehme, C. Bernasconi, A. Moskalenko, I. Cherniukh, D. Dirin, M. I. Bodnarchuk, M. V. Kovalenko and G. Rainò, Nano Lett., 2022, 22, 3751–3760 CrossRef CAS.
- G. Nair, J. Zhao and M. G. Bawendi, Nano Lett., 2011, 11, 1136–1140 CrossRef CAS.
- Y. S. Park, S. J. Guo, N. S. Makarov and V. I. Klimov, ACS Nano, 2015, 9, 10386–10393 CrossRef CAS.
- G. Rainò, G. Nedelcu, L. Protesescu, M. I. Bodnarchuk, M. V. Kovalenko, R. F. Mahrt and T. Stöferle, ACS Nano, 2016, 10, 2485–2490 CrossRef.
- F. Krieg, Q. K. Ong, M. Burian, G. Rainò, D. Naumenko, H. Amenitsch, A. Süess, M. J. Grotevent, F. Krumeich, M. I. Bodnarchuk, I. Shorubalko, F. Stellacci and M. V. Kovalenko, J. Am. Chem. Soc., 2019, 141, 19839–19849 CrossRef CAS.
- M. Nirmal, B. O. Dabbousi, M. G. Bawendi, J. J. Macklin, J. K. Trautman, T. D. Harris and L. E. Brus, Nature, 1996, 383, 802–804 CrossRef CAS.
- C. Galland, Y. Ghosh, A. Steinbrück, M. Sykora, J. A. Hollingsworth, V. I. Klimov and H. Htoon, Nature, 2011, 479, 203–275 CrossRef CAS.
- G. C. Yuan, D. E. Gómez, N. Kirkwood, K. Boldt and P. Mulvaney, ACS Nano, 2018, 12, 3397–3405 CrossRef CAS.
- S. Seth, T. Ahmed and A. Samanta, J. Phys. Chem. Lett., 2018, 9, 7007–7014 CrossRef CAS.
- N. Yarita, T. Aharen, H. Tahara, M. Saruyama, T. Kawawaki, R. Sato, T. Teranishi and Y. Kanemitsu, Phys. Rev. Mater., 2018, 2, 116003 CrossRef CAS.
- T. Kim, S. Jung, S. Ham, H. Chung and D. Kim, Small, 2019, 15, 1900355 CrossRef.
- C. T. Trinh, D. N. Minh, K. J. Ahn, Y. Kang and K. G. Lee, ACS Photonics, 2018, 5, 4937–4943 CrossRef CAS.
- C. T. Trinh, D. N. Minh, V. L. Nguyen, K. J. Ahn, Y. Kang and K. G. Lee, APL Mater., 2020, 8, 031102 CrossRef CAS.
- T. Ahmed, S. Seth and A. Samanta, ACS Nano, 2019, 13, 13537–13544 CrossRef CAS.
- International Telecommunications Unit, The present state of ultra-high definition television (Report, ITU-R, BT.2246-7), 2020.
- X. Zheng, S. Yuan, J. Liu, J. Yin, F. Yuan, W.-S. Shen, K. Yao, M. Wei, C. Zhou, K. Song, B.-B. Zhang, Y. Lin, M. N. Hedhili, N. Wehbe, Y. Han, H.-T. Sun, Z.-H. Lu, T. D. Anthopoulos, O. F. Mohammed, E. H. Sargent, L.-S. Liao and O. M. Bakr, ACS Energy Lett., 2020, 5, 793–798 CrossRef CAS.
- Y. Hassan, J. H. Park, M. L. Crawford, A. Sadhanala, J. Lee, J. C. Sadighian, E. Mosconi, R. Shivanna, E. Radicchi, M. Jeong, C. Yang, H. Choi, S. H. Park, M. H. Song, F. De Angelis, C. Y. Wong, R. H. Friend, B. R. Lee and H. J. Snaith, Nature, 2021, 591, 72–77 CrossRef CAS.
- W. Zhou, Y. Shen, L.-X. Cao, Y. Lu, Y.-Y. Tang, K. Zhang, H. Ren, F.-M. Xie, Y.-Q. Li and J.-X. Tang, Adv. Funct. Mater., 2023, 33, 2301425 CrossRef CAS.
- J. Jiang, Z. Chu, Z. Yin, J. Li, Y. Yang, J. Chen, J. Wu, J. You and X. Zhang, Adv. Mater., 2022, 34, 2204460 CrossRef CAS.
- M. Chen, T. Zhang, A. Elsukova, Z. Hu, R. Zhang, Y. Wang, X. Liu, X. Liu and F. Gao, Small, 2024, 20, 2306360 CrossRef CAS.
- Y. Dong, Y.-K. Wang, F. Yuan, A. Johnston, Y. Liu, D. Ma, M.-J. Choi, B. Chen, M. Chekini, S.-W. Baek, L. K. Sagar, J. Fan, Y. Hou, M. Wu, S. Lee, B. Sun, S. Hoogland, R. Quintero-Bermudez, H. Ebe, P. Todorovic, F. Dinic, P. Li, H. T. Kung, M. I. Saidaminov, E. Kumacheva, E. Spiecker, L.-S. Liao, O. Voznyy, Z.-H. Lu and E. H. Sargent, Nat. Nanotechnol., 2020, 15, 668–674 CrossRef CAS.
- H. Liu, T. B. Shonde, O. J. Olasupo, M. S. Islam, T. F. Manny, M. Woodhouse, X. Lin, J. S. R. Vellore Winfred, K. S. Mao, E. Lochner, I. Fatima, K. Hanson and B. Ma, ACS Energy Lett., 2023, 8, 4259–4266 CrossRef CAS.
- W. Bai, T. Xuan, H. Zhao, H. Dong, X. Cheng, L. Wang and R.-J. Xie, Adv. Mater., 2023, 35, 2302283 CrossRef CAS.
- J.-N. Yang, T. Chen, J. Ge, J.-J. Wang, Y.-C. Yin, Y.-F. Lan, X.-C. Ru, Z.-Y. Ma, Q. Zhang and H.-B. Yao, J. Am. Chem. Soc., 2021, 143, 19928–19937 CrossRef CAS.
- Y.-K. Wang, F. Yuan, Y. Dong, J.-Y. Li, A. Johnston, B. Chen, M. I. Saidaminov, C. Zhou, X. Zheng, Y. Hou, K. Bertens, H. Ebe, D. Ma, Z. Deng, S. Yuan, R. Chen, L. K. Sagar, J. Liu, J. Fan, P. Li, X. Li, Y. Gao, M.-K. Fung, Z.-H. Lu, O. M. Bakr, L.-S. Liao and E. H. Sargent, Angew. Chem., Int. Ed., 2021, 60, 16164–16170 CrossRef CAS.
- Y. Liu, Y. Dong, T. Zhu, D. Ma, A. Proppe, B. Chen, C. Zheng, Y. Hou, S. Lee, B. Sun, E. H. Jung, F. Yuan, Y.-K. Wang, L. K. Sagar, S. Hoogland, F. P. García de Arquer, M.-J. Choi, K. Singh, S. O. Kelley, O. Voznyy, Z.-H. Lu and E. H. Sargent, J. Am. Chem. Soc., 2021, 143, 15606–15615 CrossRef CAS.
- Y. Xu, Q. Wang, L. Zhang, M. Lyu, H. Lu, T. Bai, F. Liu, M. Wang and J. Zhu, Sol. RRL, 2021, 5, 2100669 CrossRef CAS.
- P. Todorović, D. Ma, B. Chen, R. Quintero-Bermudez, M. I. Saidaminov, Y. Dong, Z.-H. Lu and E. H. Sargent, Adv. Opt. Mater., 2019, 7, 1901440 CrossRef.
- I. López-Fernández, D. Valli, C.-Y. Wang, S. Samanta, T. Okamoto, Y.-T. Huang, K. Sun, Y. Liu, V. S. Chirvony, A. Patra, J. Zito, L. De Trizio, D. Gaur, H.-T. Sun, Z. Xia, X. Li, H. Zeng, I. Mora-Seró, N. Pradhan, J. P. Martínez-Pastor, P. Müller-Buschbaum, V. Biju, T. Debnath, M. Saliba, E. Debroye, R. L. Z. Hoye, I. Infante, L. Manna and L. Polavarapu, Adv. Funct. Mater., 2024, 34, 2307896 CrossRef.
| This journal is © The Royal Society of Chemistry 2024 |