
 Open Access Article
 This Open Access Article is licensed under a Creative Commons Attribution-Non Commercial 3.0 Unported Licence
Advanced 1D heterostructures based on nanotube templates and molecules†
Charlotte
Allard
a,
Laurent
Alvarez
 b,
Jean-Louis
Bantignies
b,
Nedjma
Bendiab
c,
Sofie
Cambré
d,
Stephane
Campidelli
e,
Jeffrey A.
Fagan
f,
Emmanuel
Flahaut
g,
Benjamin
Flavel
h,
Frédéric
Fossard
i,
Etienne
Gaufrès
*j,
Sebastian
Heeg
k,
Jean-Sebastien
Lauret
l,
Annick
Loiseau
i,
Jean-Baptiste
Marceau
j,
Richard
Martel
m,
Laëtitia
Marty
c,
Thomas
Pichler
n,
Christophe
Voisin
o,
Stephanie
Reich
p,
Antonio
Setaro
pq,
Lei
Shi
r and
Wim
Wenseleers
d
b,
Jean-Louis
Bantignies
b,
Nedjma
Bendiab
c,
Sofie
Cambré
d,
Stephane
Campidelli
e,
Jeffrey A.
Fagan
f,
Emmanuel
Flahaut
g,
Benjamin
Flavel
h,
Frédéric
Fossard
i,
Etienne
Gaufrès
*j,
Sebastian
Heeg
k,
Jean-Sebastien
Lauret
l,
Annick
Loiseau
i,
Jean-Baptiste
Marceau
j,
Richard
Martel
m,
Laëtitia
Marty
c,
Thomas
Pichler
n,
Christophe
Voisin
o,
Stephanie
Reich
p,
Antonio
Setaro
pq,
Lei
Shi
r and
Wim
Wenseleers
d
aEcole Polytechnique, Montreal, Canada
bLaboratoire Charles Coulomb, CNRS-Université de Montpellier, France
cCNRS-Université de Grenoble, France
dUniversity of Antwerp, Belgium
eCEA-Saclay, France
fNational Institute of Standards and Technology (NIST), USA
gCIRIMAT, Université Toulouse 3 Paul Sabatier, Toulouse INP, CNRS, Université de Toulouse, 118 Route de Narbonne, 31062 Toulouse, cedex 9, France
hKarlsruhe Institute of Technology (KIT), Germany
iLaboratoire d’Étude des Microstructures, CNRS-Onera, Chatillon, France
jLaboratoire Photonique, Numérique et Nanosciences, CNRS-Université de Bordeaux-IOGS, Talence, France. E-mail: etienne.gaufres@cnrs.fr
kHumboldt-Universität zu Berlin, Germany
lLUMIN, Université Paris Saclay, ENS Paris Saclay, Centrale Supelec, CNRS, Orsay, France
mUniversity of Montreal, Canada
nUniversity of Vienna, Austria
oUniversité de Paris, Ecole Normale Paris, CNRS, PSL, France
pFree University of Berlin, Germany
qFaculty of Engineering and Informatics, Pegaso University, Naples, Italy
rState Key Laboratory of Optoelectronic Materials and Technologies, Guangdong Basic Research Center of Excellence for Functional Molecular Engineering, Nanotechnology and Research Center, School of Materials Science and Engineering, Sun Yat-sen University, Guangzhou, 510275, China
First published on 22nd July 2024
Abstract
Recent advancements in materials science have shed light on the potential of exploring hierarchical assemblies of molecules on surfaces, driven by both fundamental and applicative challenges. This field encompasses diverse areas including molecular storage, drug delivery, catalysis, and nanoscale chemical reactions. In this context, the utilization of nanotube templates (NTs) has emerged as promising platforms for achieving advanced one-dimensional (1D) molecular assemblies. NTs offer cylindrical, crystalline structures with high aspect ratios, capable of hosting molecules both externally and internally (Mol@NT). Furthermore, NTs possess a wide array of available diameters, providing tunability for tailored assembly. This review underscores recent breakthroughs in the field of Mol@NT. The first part focuses on the diverse panorama of structural properties in Mol@NT synthesized in the last decade. The advances in understanding encapsulation, adsorption, and ordering mechanisms are detailed. In a second part, the review highlights the physical interactions and photophysics properties of Mol@NT obtained by the confinement of molecules and nanotubes in the van der Waals distance regime. The last part of the review describes potential applicative fields of these 1D heterostructures, providing specific examples in photovoltaics, luminescent materials, and bio-imaging. A conclusion gathers current challenges and perspectives of the field to foster discussion in related communities.
1 Introduction
“Synthesized from different growth processes, SWCNTs are now produced commercially in large quantities with narrow distributions of diameters, each defining a quasi-1D surface perimeter space with a central pore sized between 0.2 nm to more than few nm.”Driven by practical challenges and potential technologies, the topic of hierarchical assemblies of molecules on complex surfaces has attracted significant interest in material science. This field has branched out over the years into different topics, such as molecular storage, drug delivery, molecular organization and aggregation, catalysis and chemical reactions at the nanoscale, to name just a few. In the context of advanced nanostructures, complex micro/nanoporous systems, such as zeolites and metal organic frameworks (MOFs), have been thoroughly studied as media to template molecules into well-defined shapes and architectures.1,2 Depending on their composition, these hosts have the advantage of giving rather homogeneous distributions of pore sizes, which is key for guiding or engineering molecular adsorption into more complex 2D and 3D architectures. Because of the directionality of the molecular dipole, the formation of molecular chains of molecules forming head-to-tail assemblies, similar to the wagons on a train, are of particular interest. Their intrinsic anisotropy and the specific intermolecular couplings of such molecules are at the origin of various and intriguing photophysical phenomena. Due to a lack of the high anisotropy needed to restrict directions, it has been difficult to driving or templating the assembly into such one-dimensional (1D) shapes using known 3D crystalline templates. Although interesting strategies leading to the self-assembly of molecules into 1D shapes can be found,3,4 the natural tendency of molecules to rather favour compact 2D and 3D structures makes these schemes complex to generalize by simple assembly and very hard to implement using top-down approaches such as lithography and mechanical means. A universal scheme to drive assemble in truly 1D shapes remains nowadays elusive. This review focus on recent advances on the use of nanotubes to drive hierarchical assemblies of molecules into 1D heterostructures of different shapes and compositions. Using nanotube-based templates, and in particular single-wall carbon nanotubes (SWCNTs), researchers have derived a plethora of 1D assemblies of molecules spanning lengths from micrometres down to the nano scale and exhibiting different architectures. These works have highlighted some of the most exciting and surprising hybrid structures and exposed their optical properties. This review intends to cover some of the most significant studies of the recent years as reviewed by the authors during a meeting in Paris.
Since the widespread report of their discovery in the 90's,5 single wall carbon nanotubes (SWCNTs) have been used as a 1D template for assembling molecules and inorganic compounds into well-defined shapes, thanks to their hollow, crystalline and cylindrical architectures. The SWCNTs present high aspect ratios and can induce weak or strong molecular attachment on the outside (exohedral) and the inside (endohedral) of their constitutive wall. In both cases, the molecular adsorption produces unique 1D-like assemblies that are distinct from that obtained with other templates. These assemblies are interesting in large part due to the unique structures of various sources of nanotubes available commercially. Synthetized from different growth processes, SWCNTs are nowadays produced in large quantity with a narrow distribution of diameters, which define a perimeter space of the quasi-1D surface and the central pore having sizes between 0.2 nm and few nm. Early works have shown that the nanotube template can encapsulate other nanotubes, giving the so-called double-walled nanotube for example, and other structures such as fullerene, graphene nanoribbons and linear carbon chains. As discussed in a recent review, these 1D heterostructures have interesting properties derived from the specific arrangement of the periodic inner structures.6 There is in addition a long list of organic and inorganic materials that were successfully encapsulated into SWCNTs (see Fig. 1c). These includes gases (H2, CH4), water, inorganic compounds, such as uranyl nitrate, and various kinds of organic molecules, including dyes and drugs, etc.
 | ||
| Fig. 1 Nanotubes as an ad hoc template for molecular adsorption. (a) Nomenclature description of the SWCNT (n,m) chiralities from a rolled graphene sheet with indicative values of the nanotube diameter. The grey scale represents the common SWCNT chiralities available from the different synthesis techniques such as CoMoCat, HiPCo, plasma torch etc. The chiralities highlighted in blue and in green represent the one available after common post-synthesis sorting processing with a purity higher than 99%. (b) Schematic representation of a Mol@NT system, composed by a chain of quaterthiophene encapsulated inside a semiconducting (10,2) nanotube with a Cu-phtalocyanine molecule adsorbed on the outside. (c) Examples of encapsulated compounds inside carbon nanotubes as a function of their molecular weight and characteristic size. | ||
The advantage of the carbon nanotubes as a 1D host comes from the combined richness and specificity of the diameters available, which are linked to the chiral angle of its crystalline lattice (see Fig. 1a).
Indeed, more than 160 possible (n,m) structures of SWCNTs of ≤2 nm diameter can be derived from the lattice, giving a plethora of structures to choose from for tailored assembly. When addressed individually, two different chiralities can provide extremely small differences of available space for molecular confinement and this level of control on the assembly is probably unmatched compared to other templates. That is, the cavity is highly tunable depending on the nanotube species; diameter increments of about 0.01 nm between adjacent chiralities are accessible for studies. This richness of nanotube chiralities gives an impressive set of available templates for 1D assemblies, but the sources of nanotubes generally contain statistical mixtures of chiralities. The structural heterogeneity within a batch of nanotubes is therefore a hurdle. This complexity is further enhanced because the chiral mixtures contain nanotube species that can be either semiconducting or metallic.7 The outstanding challenge of sorting nanotubes with selected chirality has, however, been significantly advanced, with impressive progress made via nanotube processing.8,9 Scientists now have access to samples of SWCNTs with narrow chiral distributions or uniform properties. Such recent breakthroughs in the synthesis, characterization, and purification of SWCNTs by diameter and chirality, as recently reviewed in ref. 10 (see Fig. 1b) have further refined the material available for making nanotube templates for molecular adsorption. The situation is such that the main obstacles of using nanotube templates for 1D assemblies have been lowered significantly. This review highlights in this context the recent progress on fabricating the molecular hybrids with SWCNTs (Mol@SWCNT) and discusses their properties as well as the new horizons that pursuable using this 1D templating approach.
2. Confinement and ordering of molecules assisted by a nanotube template
2.1. Molecular ordering inside SWCNT and encapsulation mechanisms
 | ||
| Fig. 2 High resolution transmission electron microscopy (HRTEM) images and illustrations of different stacking geometries of organic molecules encapsulated inside carbon nanotubes. (a) C60 fullerenes inside SWCNT. Scale bar shows 1 nm. Adapted with permission from ref. 17 and 18 first published in 1998 in ref. 19. (b) Kr@C60@SWCNT, adapted with permission from Cardillo-Zallo, ACS Nano 2024, 18, 4, 2958–2971, Copyright 2024 American Chemical Society, ref. 18 and 20. (c) Double chain of alpha-sexithiophene inside SWCNT. Adapted from Adv. Mater. 2010, 22, 1635–1639. Copyright 2010 Wiley-VCH.14 (d) Single and double rows of quaterrylene molecules aligned along the SWCNT axis. Adapted with permission from J. Phys. Chem. C 2014, 118, 37, 21671–21681.12 Copyright 2014 American Chemical Society. (e) Identification of single quaterthiophene inside a SWCNT. Adapted with permission from J. Phys. Chem. C 2014, 118, 33, 19462–19468. Copyright 2014 American Chemical Society.13 (f) Graphene nanoribbons inside a SWCNT (GNR@SWCNT) from Talysin et al., Nano Lett. 2011, 11, 10, 4352–4356, Copyright 2011 American Chemical Society.21 (g) Coaxial stacking of coronene molecules perpendicular to the SWCNT axis, adapted with permission from Angew. Chem., Int. Ed. 2011, 50(21), 4853–4857, and Small 2015, 11, No. 5, 622–629. Copyright 2011 Wiley-VCH.15,16 | ||
Elongated molecules stack into single or multiple columns depending on the nanotube geometry and the encapsulation conditions (Fig. 2c–e). Probing such configurations beyond microscopy methods, multiple research groups use Raman spectroscopy of the molecules to acquire evidence of encapsulation and to better understand the stacking trends in Mol@SWCNTs. For example, the amplitude of the shift of the radial breathing modes (RBM) in the Raman scattering spectra of SWCNTs was found to trend with the number of molecules stacked inside the nanotube as a function of the diameter (see Fig. 3a). In the case of 4T@SWCNTs, two different plateaus are observed between 0.8–1.1 nm and between 1.45–1.65 nm, which are attributed to the formation of a single aggregate or pair aggregates into the hollow core of the nanotubes. This assumption is consistent with TEM experiments.13
 | ||
| Fig. 3 (a) Radial breathing mode (RBM) relative up-shifts after encapsulation of 4T molecules inside nanotubes (NT) of different diameters. (b) Variation in intensity of two Raman peaks (at 1590 cm−1 and 1440 cm−1 for the semiconducting SWNT and 6T modes, respectively) of an individual 6T@s-SWNT versus laser polarization angle (Ω) at λ = 532 nm. The inset is an atomic force microscopy image of the SWNT and a description of the polarization angle. Adapted from Gaufrès et al., Nature Photon 2014 8, 72–78, copyright 2013 Springer Nature.22 (c) Diffraction pattern of pristine and functionalized nanotubes with a diameter distribution centered around 1.7 nm, together with the α MPc phase. The 10 peak of the nanotube bundles is located at 4.57°. These positions correspond to an inter reticular distance of 19.3 Å. | ||
On aligned or single nanotube samples, polarized Raman spectroscopy, taking advantage of the highly polarized resonant Raman signal of SWCNTs, has also been used as an internal reference for probing the transition dipole alignment of elongated molecules. For example, polarized micro Raman spectroscopy performed on individual SWCNTs filled with sexithiophene molecules (6T) (see Fig. 3b) showed that the intensities of the 6T molecular mode at 1450 cm−1 and of the SWCNT longitudinal mode at 1590 cm−1 have the same polarization-dependency. This result provides strong evidence that the transition dipole moments of the molecules are strongly aligned along the nanotube axis.23
The 1D character of the molecular organization was also probed by X-ray diffraction measurements on phthalocyanine molecules (MPc) encapsulated inside larger diameter SWCNTs (1.4 nm < d < 2.1 nm). The evidences are summarized in the Fig. 3c.24 Two main features are observed after the encapsulation: the MPc molecules are: the disappearance of the contributions associated to empty SWCNTs and the appearance of a new broad peak at around 6.9°. This value coincides with the diffraction peak of the MPc molecules’ α phase, which corresponds to the distance between molecules in the [200] direction. Thus, this additional peak suggests the 1D stacking of the MPc molecules encapsulated inside the carbon nanotubes.
The results presented in Fig. 2 and 3 highlights the complexity of the interactions between molecules and between molecules and the nanotube sidewall. To shine a light on these interactions, ab initio methods have been used to identify and understand many specific observed behaviors. In this perspective, several groups have calculated the binding energy for π-conjugated systems encapsulated inside SWCNT. For example, it was reported that the optimal distance between a 6T chain and the nanotube wall is roughly 4 Å and that, depending on the diameter, the more favourable configuration is a single or double pair of parallel 6T, with a preferential adsorption of the 6T on the nanotube sidewall.14 It was also showed that depending on the diameter, the more favourable configuration is a single or double pair of parallel 6T, with a preferential adsorption of the 6T on the nanotube sidewall. This explains the observation of a narrow distribution of the molecule-wall distance that is well centered at 3–4 Å and a wide distribution of the adjacent distances for molecule-molecule spacing, in the range between 4 and 8 Å. Similarly, for terthiophene that the host–guest interactions dominates in large diameter nanotubes compared to the molecules size, and leading to the adsorption of the molecules on the wall.25 Within a smaller-diameter nanotube, host–guest interactions were hypothesized to compete with the guest–guest interactions and promote a final stacking that is strongly dependent on the diameter. It was also shown that the host–guest interactions are sufficient to deform the encapsulated π-conjugated oligomers molecular structure.26
In a separate study, using dispersion-corrected density functional theory (DFT), Yumura et al. calculated the potential energy surfaces of the formation of a second row of asymmetric and polarized p-(dimethylamino)-p′-nitrostilbene (DANS) molecules inside a SWCNT.27 The study shows that the insertion of DANS into a nanotube with a diameter of approximately 1.0 nm spontaneously proceeds through attractive host–guest interactions. Various metastable states and a global optimization structure appear to evolve from one end to the middle of a tube. Additional potential energy surface calculations on the insertion of another DANS molecule into the nanotube already containing one row of molecules show the significant roles of intermolecular interactions, which can lead to high energy barriers with values that strongly depends on the relative distribution of the polarized charge inside the nanotubes, i.e. the charge repartition along the nanotube axis.
The behavior of short molecules inside SWCNTs has also been studied by DFT. For example, Almadori et al. have reported DFT calculations of phtalocyanine molecules inside SWCNTs, which indicate that the minimum of the bonding energy was obtained for an angle of 32° between the molecular ring and the nanotubes axis. This represents an intermediate case between polythiophene@SWCNTs (0°) and coronene@SWCNT (90°).
Capitalizing on the very strong, “giant”, Raman scattering of aligned sexithiophene molecules (6T) inside SWCNT (6T@SWCNTs),23 the filling fraction of 6T in a SWCNT (R6T) was quantitatively estimated by measuring the Raman ratio R6T = I6T/IG, (where I6T is the Raman 6T-band intensity at 1450 cm−1 and IG is the G-band intensity at 1590 cm−1 of the carbon nanotubes) from a statistical assembly of individualized SWCNTs.30 (see Fig. 4a). By varying the conditions of the encapsulation process (temperature and 6T concentrations) the encapsulation isotherms of this system in liquid phase were obtained (see Fig. 4b). Below a specific 6T concentration (C1 = 2.10−7 M), R6T follows the same evolution for the two temperatures studied, which indicates a direct (spontaneous) encapsulation mechanism in these conditions. This is consistent with previous simulations of large molecules encapsulation inside carbon nanotubes.26,31 Above the concentration threshold C1, a second step is revealing of another process, which appears to be thermally activated and associated to the formation of a pair-aggregate (Fig. 4c).
 | ||
| Fig. 4 (a) Schematics of a single pair-aggregate and a typical Raman spectrum of 6T@SWCNTs at an excitation wavelength of 532 nm. The intensity is normalized with the signal of the G-band of the SWCNTs. (b) Raman ratio R6T at 532 nm of 6T molecules encapsulated inside SWCNTs as a function of the concentration of 6T in toluene at 30 °C (blue) and 115 °C (red). (c) Encapsulation scenario for single and paired aggregates of 6T into SWCNTs. The two sequential processes are controlled by the equilibrium constant Ksingle and Kpair. Adapted with permission from ACS Nano 2016, 10, 11, 10220–10226. Copyright 2016 American Chemical Society.30 | ||
By modelling the results in Fig. 4c using a modified Langmuir isotherm, the formation enthalpy for the insertion of a second row of molecules inside the SWCNTs (having a diameter distribution centered at 1.35 nm) was determined to be ΔHpair = 260 ± 20 meV. The formation of pair aggregates also occurs homogeneously in SWCNTs to up to 140 microns in length, evidencing easy diffusion of the molecules along the inside of the nanotubes. These preliminary works are appealing for further experiments on the dynamic aspect of the encapsulation and the understanding of the entangled regimes of molecular diffusion and adsorption equilibrium in complex 1D heterostructures.
2.2. Adsorption of (porphyrin) molecules on the outside of carbon nanotube sidewalls
The SWCNT exterior can also template the coupling of the nanotube with molecules. This configuration lifts the constraint of the size of the molecule of interest. For instance, molecules such as porphyrins are too large to be encapsulated in commonly utilized diameter SWCNT. However, they can stack on the outside of the nanotube. In this part, we will focus on one specific way to reach the grafting of molecules on the nanotube sidewall: the functionalization of nanotubes in micellar suspensions.The use of ultrasonication and surfactants to individualize and stabilize a SWCNT in a micelle is now widely used since their first report in 2002.32 In 2008, Ziegler and co-workers also showed that the incorporation of water-immiscible organic solvents inside the micelles containing SWNTs was possible.33 The presence of a small amount of organic solvent in the vicinity of the nanotubes can be evidenced by fluorescence spectroscopy, causing a shift of the nanotubes fluorescence lines due to a solvatochromic effect (see Fig. 5a).
 | ||
| Fig. 5 (a) Swelling of the hydrophobic core of the micelle surrounding a SWCNT (up) NIR fluorescence spectra of an sodium dodecylbenzene sulfonate (SDBS)-coated SWCNT suspension after addition of o-dichlorobenzene (ODCB) (bottom), adapted with permission from J. Am. Chem. Soc. 2008, 130(48), 16330–16337, Copyright 2008 American Chemical Society.33 (b) Schematic representation of the micelle wrapped and functionalized compounds, side and 3D views. | ||
Swelling the micelle using an organic solvent opens the way to use it as a vector to bring molecules of interest in the vicinity of the nanotube sidewall. For example, the functionalization of CoMoCat carbon nanotubes with tetraphenyl porphyrin (TPP) using a micelle swelling approach based on sodium cholate and dichloromethane was reported.34 The presence of the TPP stacked on the wall of the SWCNTs resulted in a clear red-shift of the TPP absorption features (420 to 440 nm) and a concurrent shift as well to the nanotube transitions (Fig. 6).
 | ||
Fig. 6 (a) Optical absorption spectra of SWNT/TPP complexes for different concentrations of porphyrin with a DCM/water volume ratio of 34% 0.04 μmol, 0.07 μmol, 0.14 μmol and 0.27 μmol (from dark blue to light blue), within a DCM/water solution of volume ratio of 2![[thin space (1/6-em)]](https://www.rsc.org/images/entities/char_2009.gif) :1. The curves are vertically translated to match at 490 nm (background correction). Inset: Amplitude of the band at 420 nm (dashed line) and at 438 nm (black line) as a function of the quantity of porphyrin; shift of the S11 band (grey line) as a function of the quantity of porphyrin. Adapted with permission from ChemPhysChem 2010, 11, 1667–1672, Copyright 2010 Wiley-VCH.34 (b) Reaction constant (log scale) for several (n,m) nanotube species as a function of the diameter of the species. Reproduced from ref. 35 with the permission of Royal Society of Chemistry. :1. The curves are vertically translated to match at 490 nm (background correction). Inset: Amplitude of the band at 420 nm (dashed line) and at 438 nm (black line) as a function of the quantity of porphyrin; shift of the S11 band (grey line) as a function of the quantity of porphyrin. Adapted with permission from ChemPhysChem 2010, 11, 1667–1672, Copyright 2010 Wiley-VCH.34 (b) Reaction constant (log scale) for several (n,m) nanotube species as a function of the diameter of the species. Reproduced from ref. 35 with the permission of Royal Society of Chemistry. | ||
In this micelle swelling process, the microscopic mechanism is related to the exchange of the surfactant molecules and the chromophore with specific kinetic parameters; the bigger is the diameter the easier it is to stack the molecules on the sidewall of the nanotube35 (Fig. 6b). The kinetics of the reaction can be controlled by playing with the relative proportions of surfactants in co-surfactant suspensions.36 For example, the surfactant exchange timescale in these hybrid micellar system could be tuned from a multiple days timescale to as brief as a minute. Interestingly, porphyrin molecules self-organize with their Ox direction along the nanotube axis,37 underlining that, even if the 1D stacking outside the nanotube is weaker compared to inside the nanotube, a specific templating of molecules can be achieved simply by an exohedral stacking on the nanotube sidewall.
The micelle swelling method has also been extended to enable more complex chemical functionalizations, using the micelle core as a nano platform to perform organic chemistry reactions. Through the realization of polymerization processes inside the micelle core itself.38 The dimerization of thiol groups from thiol functionalized porphyrins, put into contact with nanotubes through the micelle swelling method, form a cross-linked network of porphyrin on the nanotube surface (Fig. 7). The functionalized nanotubes can then be dispersed in solvents without loss of the organic shell allowing an easy manipulation of the objects. This strategy has been extended to other types of molecules. Examples include putting thermoresponsive acrylamide polymers or polystyrene around nanotubes, allowing the fabrication of core–shell structures where the active core is the nanotube and the polymer shell protects the nanotube from its local environment.39,40
 | ||
| Fig. 7 Schematic representation of the different steps of functionalization: (A) the nanotubes are dispersed and individualized in micelles; (B) the porphyrins in an organic solvent are introduced on the nanotube surfaces; (C) after solvent evaporation, the reaction to cross-link the porphyrin is performed leading to a stable organic shell around the nanotubes; and (D) the nanotube derivatives are purified via filtration and extensive washing to remove the surfactants, reagents, and unbound porphyrins. Adapted with permission from Chem. Mater. 2013, 25, 13, 2700–2707. Copyright 2013 American Chemical Society.38 | ||
These porphyrin/nanotubes hybrids form a class of systems with complex intermolecular coupling leading to specific optical processes such as energy transfer. These excitonic effects are presented in Section 4.2.
2.3. Water & solvent phases in CNTs
“The access to chirality-controlled sources of SWCNTs with closed or open ended termination is a key point to study the 1D confinement of small molecules inside SWCNTs such as water.”As discussed previously in this review, the endohedral environment of SWCNT samples can be empty or filled with various molecules having a size-scale similar to the nanotube cavity pore size, such as polythiophene, phtalocyanine or beta-carotene. In this subsection we focus on the confinement of small molecules compared to the nanotube hollow core, e.g. solvent-like organic molecules and water molecules. We address the particular importance of closed-ended, empty SWCNTs for comparison to filled SWCNTs, and the reported effects of filling both on the confined molecules and the SWCNTs properties.
As early as 2000,41 molecular dynamics simulations predicted that water would enter into the SWCNTs endohedral cavity despite the assumed hydrophobic nature of their interior, and that confinement inside a SWCNT would invoke unusual behavior of the encapsulated water molecules such as ultra-fast diffusion42–44 or atypical phase diagrams.45–48 A comprehensive review on the molecular modelling of confined water molecules can be found in ref. 49. Building excitement in this research direction, ultrafast transport through a nanotube was experimentally demonstrated in 2006 in DWCNTs;50 shortly thereafter the potential of water-filled CNTs for use as nanovalves to control gas flow was also validated.51 Since then, much research effort has been devoted to water-filled CNTs and their applications, with a focus on understanding and engineering efficient (or selective) ion transport through the filled SWCNTs pores.52,53 By probing the encapsulation-induced changes in water directly by nuclear magnetic resonance (NMR),54–56 XRD,57–59 IR spectroscopy60,61 and neutron scattering,62,63 the effect of the confinement on the water molecules could be investigated. Such studies revealed phenomena such as multi-ring stacked water structures inside broader diameter SWCNTs,60 a step-wise filling of CNTs depending on the surrounding water vapor pressure,59 and the formation of n-gonal ice structures at lower temperature.47 However, each of the techniques used in these early contributions were not able to differentiate the effects of any SWCNT specific chiral structure surrounding the encapsulated molecules in the absence of chirality separated SWCNT samples. Additionally, most of these techniques also could not provide quantitative information on other parameters of interest for filled SWCNTs, e.g., the percentage of filling inside the SWCNTs. Broadly, this question about quantifying the fractions of closed/opened SWCNTs in a given sample, i.e. the fraction of filled/unfilled SWCNTs, is crucial to quantitatively understand the impact of the filling on the SWCNT properties. Indeed, it is consistently observed that water filling of SWCNTs occurs spontaneously and quickly given any opening in the SWCNT carbon lattice. Literature can be found on how to realize solutions with open or closed SWCNTs by combining surfactant wrapping and density-gradient ultra-centrifugation of SWCNTs.64–69 To estimate the ratio of opened/closed SWCNT populations, calibrated optical spectroscopy such as the Raman scattering can be used to monitor the radial breathing mode (RBM) of the SWCNTs.64,70
Having purely empty and purely water-filled samples available,68 it became possible to investigate the influence of encapsulated water on the electronic properties of the SWCNTs in more details. In comparison to the optical properties of empty SWCNTs, water-filling clearly results in severe broadening and a red-shifting of the electronic transitions, as well as a strong quenching of the photoluminescence emission of the semiconducting SWCNTs (Fig. 8). These differences are observed both at the bulk dispersion level, and at the level of a single nanotubes.70 The same effects were observed on the vibrational and electronic transitions of long (≈7 to 10 μm) suspended individual SWCNTs after opening the individually suspended SWCNTs by laser heating and controlling the water vapor pressure in the chamber.71 The shift of the RBM of the SWCNTs due to water filling, for a wide range of individual SWCNT chiralities, was found to depend on the SWCNT diameter in the large-diameter regime.72 In addition, water-filling can also strengthen the SWCNTs and make them more robust with respect to radial compression.73
 | ||
| Fig. 8 (a) Experimental PLE maps of empty (left), water-filled (middle) and triacontane-filled (right) SWCNT samples, normalized over absorption so that the actual PL intensity can be directly compared (note the 5× difference in color scale of the water-filled sample). (b) Integrated PL intensities of empty, water-filled and triacontane-filled SWCNTs over the excitation range of 850–1100 nm, both demonstrating the drastic quenching and broadening of the PL form the water-filled SWCNTs in comparison to the empty SWCNTs, and the approaching similar intensity of alkane-filled SWCNTs to empty SWCNTs. (c) Peak positions of empty, water-filled and triacontane-filled SWCNTs obtained by fitting the above PLE maps, showing the electronic shift of the peak positions upon water-filling. Figure obtained with permission from a combination of Carbon 2015, 95, 442–451 and ACS Nano 2021, 15(2), 2301–2317, Copyright 2021 American Chemical Society.73,74 | ||
One interesting aspects that were predicted theoretically is for water molecules behave quite differently under confinement, templating new forms of ice structures to occur with precise structure and phase transition temperature depending strongly on the diameter of the surrounding SWCNTs44–48 Such new phase transitions, were first experimentally observed in large diameter SWCNTs (1.6–2.4 nm) by XRD and NMR.75 However, the diameter dependence (or chirality-dependence) could not be revealed due to the broad diameter distributions considered. However, reversible freezing-thawing transitions of encapsulated water in different diameter nanotubes were observed for a few individualized large-diameters SWCNTs, resulting in shifts of the RBM vibration by 2 to 5 cm−1.76 These larger shifts were attributed to variations in the compressibility due to the phase change. Independently, and through the alternate strategy of utilizing separated populations, A quasi-phase transition within a one-dimensional chain of water molecules in (6,5) SWCNTs was also observed; at low temperature, the water dipole moments were ferro-electrically oriented with all dipoles pointing along the axis of the SWCNTs.77 Such phase transitions could also be observed at distinct temperatures for larger diameter SWCNTs.78Fig. 9 summarizes these findings in a diameter-dependent temperature plot showing the complexity of the diameter-dependence of these phase transitions.
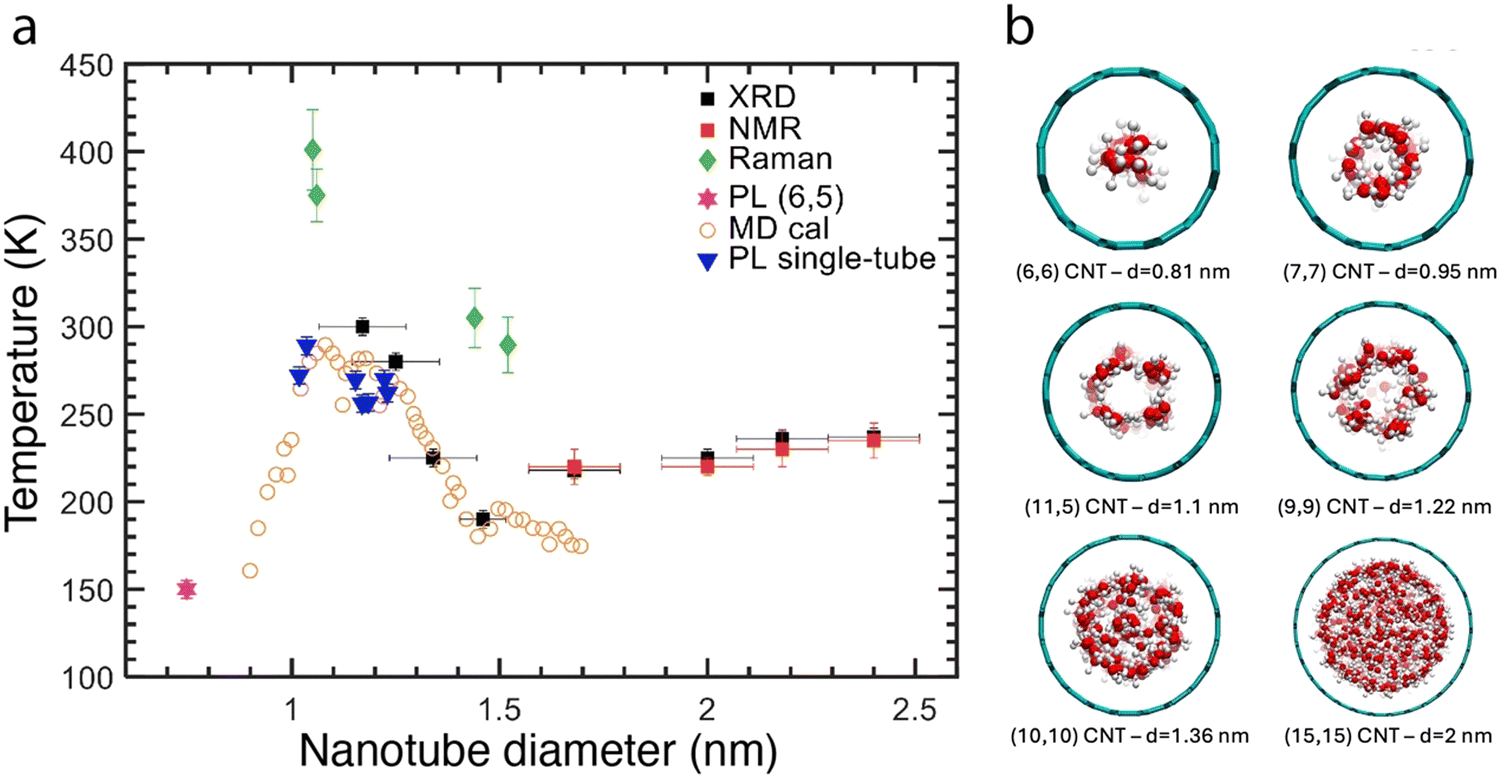 | ||
| Fig. 9 (a) Experimental and theoretical solid–liquid phase transition temperatures of water confined inside SWCNTs as a function of the SWCNT diameter. Behavior extractable from macroscopic parameters, asymptoting to the bulk value of T = 273.15 K at 1 atm pressure in an unconfined system, is expected for pore diameters >4 nm.48 Disruption to the molecular ordering of water due to confinement below this length scale is predicted to result in complex, pore diameter-dependent phase transition temperatures. Reported values from calculations and experiments include extreme deviations, both positive and negative, from the bulk melting point. Data is collected from different references: MD calculations (orange open circles) are from ref. 47, XRD (black squares) and NMR (red squares) experimental data points are obtained on SWCNT samples with a broad diameter distribution in ref. 75. Green diamonds are obtained from Raman spectra of the RBMs of individual SWCNTs.76 Blue triangles are obtained from PL experiments on individual SWCNTs78 and the magenta star is a data point obtained by microscopic PL experiments on a sorted (6,5) SWCNT sample.79 Note that the latter is not assigned as a real liquid–solid phase transition, but as a quasi-phase transition in the orientation of the molecular dipole moments of the water molecules as this diameter only allows for a single chain of water molecules to be encapsulated. Similar complexity in melting point temperatures can also be expected for other confined molecules. (b) Illustration of different water states in SWCNT as a function of diameter, adapted from ref. 80. | ||
Although water-filling of CNTs is scientifically interesting due to its analogy with biological membranes and new physics of confinement, it is often a strong hurdle for other studies or when preparing SWCNT dispersions for use in applications. A main factor in this is from its detrimental impact on the optical properties of the SWCNTs, which as noted above are red-shifted and reduced in fluorescence emission efficiency. While the use of empty SWCNTs is an obvious route to avoid these effects, they are simply not present in sufficient fractional quantity in most SWCNT soots for many applications.
One idea to overcome these hurdles is to instead controllably fill open-ended SWCNTs with an inert molecule that will be stably contained inside the SWCNT cavity prior to dispersion. Such an approach was first purposely attempted by Campo et al.,81 for the formation of alkane-filled SWCNTs, although solvent molecules and other organic molecules desired for their active material properties had been inserted into SWCNTs as early as the late 1990s.
Excitingly, these alkane@SWCNT (and similar compounds) display optical absorbance spectra that are generally blue-shifted, with narrowed linewidths, compared to water-filled SWCNTs, although still red-shifted compared to the peak transition wavelengths of empty SWCNTs (Fig. 10). For the fluorescence, a substantial enhancement relative to water-filled SWCNTs was observed, approaching but not quite equalling that of empty nanotubes for the longest length alkane samples (Fig. 8c).74
 | ||
| Fig. 10 (a) Absorbance spectra of arc-discharge SWCNTs dispersed in aqueous sodium deoxycholate (DOC) solutions with different endohedral fillings (vertical offset 1 unit/spectra). From top: empty core, dodecane-filled, hexadecane-filled, docosane-filled, tetracontane-filled, cis-decalin-filled, perhydropyrene-filled, and water-filled. The optical transition peaks exhibited by the alkane-filled nanotubes are similar to each other, while intermediate in position and breadth to the empty and water-filled nanotubes. (b) Absorbance spectra of empty (black), docosane-filled (green) and water-filled (red) nanotubes from panel (a), without vertical offset. Narrower optical transition linewidths concentrate the optical intensity of the SWCNT peak features. (c) Absorbance spectra of aqueous two-phase extraction isolated metallic (blue) and semiconducting (red) SWCNT populations of octadecane-filled SWCNTs (black). All spectra are normalized at their 810 nm valley. Reproduced with permission from ref. 81. | ||
Nearly unique to the Campo et al. effort, however, was the further dispersion of the linear alkane and similar saturated hydrocarbon molecule filled SWCNTs using bile salt surfactants in aqueous solution, and the application of dispersion-based SWCNT purification processes such as rate-zonal ultracentrifugation and aqueous two polymer phase extraction (ATPE).82 Later, this effort was extended by separately filling of two different diameter range SWCNT populations with molecules of different bulk dielectric constant.74 The dispersion and separation of semiconducting species and the effects of the internal dielectric constant on the observed solvatochromism and fluorescence intensity of the SWCNTs were also reported.74,83,84
As an additional complexity, the insertion of alkane molecules into particularly small diameter nanotubes induces radial expansion strain-based shifts in the SWCNT optical spectra, adding further complications to analysis.84,85 Similar to water encapsulation, computational modelling of a linear alkane insertion into a (6,5) found the process to occur spontaneously at room temperature for a fully open SWCNT end, with the alkane molecule adopting an extended configuration within its energetically sampled distribution to fit into the cavity space.84 While not yet experimentally reported for individual (n,m)s, calculations for the packing of a linear alkane (paraffin) have been reported for larger diameter (n,m) SWCNT structures,86 and report reduced melting points for the alkanes due to the confinement. Efforts to study confinement effects both on the arrangement and density of filler molecules inside the nanotube, and on the nanotubes themselves, are obvious next progressions characterization in these non-water molecule@SWCNT systems.
2.4. Inorganic compounds inside CNTs
Despite the discussion above of inserting organic molecules into SWCNTs, inorganic compounds were the first class of materials to be inserted intentionally within nanotubes, and especially carbon nanotubes. This research field of inserting inorganic compounds is indeed as old as the research on carbon nanotubes themselves, with pioneering works from Ajayan87 and others as recently reviewed, by the Green's group.88 There are multiple possible routes for filling nanotubes,89,90 but in the specific case of inorganic materials, the main ones are the capillary filling by immersion into either a concentrated solution or the molten compound itself. Because many inorganic compounds can withstand the required thermal treatment, as opposed to most organic compounds (thermal degradation), direct filling using a molten salt is particularly common. Moreover, opening and filling generally occur simultaneously in such cases, albeit depending on the chemical reactivity between the nanotube and the filling material at high temperature.87,91 Finally, filling may also be obtained incidentally during the synthesis of the nanotubes; however, such approaches usually lead to the formation of rather defective multiwalled CNTs with a large diameter distribution and low filling rates.92–94 After briefly reviewing the main results described in the literature, we focus here on the interplay between the inner channel of the nanotube and the filling material and its impact on the structural modifications of the latter (compared to the bulk) and conclude with some examples of possible applications of nanotubes filled with inorganic compounds.:6 to 4:4.
Although the confinement effect of the nanocrystals is easily understood and accepted, another situation may occur where not only the encapsulated material is distorted, but the container as well. This may occur a priori only in the case of SWCNTs.111 One of the best illustrations is that, for similar inner diameters, filling is observed for the SWCNTs and not for the DWCNTs112 because the distortion is not possible for two walls at the same time.
3. 1D nanoreactor: in situ transformation inside CNTs
The extreme confinement formed by “tight” crystalline walls and the high 1D aspect ratio make carbon nanotubes an attractive “nanoreactor” system for inducing and controlling chemical reactions on the nanoscale. Examples include the quasi-1D polymerization of phosphorus, sulfur, and polythiophene compounds,125–128 and the synthesis of carbon nanoribons from precursors such as fullerenes.129–131 In this section, we focus our review on the very special 1D carbon chains known as carbynes and the in-tube synthesis of nanotubes and graphene nanoribbons.132,1333.1. Confined carbyne chain synthesized inside CNTs
Studies on fullerenes (0D), CNTs (1D), graphene and other newly-discovered low-dimensional materials (2D) have evolved the investigation of nanomaterials toward lower dimensions. Even though CNTs behave as 1D materials, the ultimate goal in 1D would be true atomic chains. As an example of true 1D atomic chains, synthesis and Raman spectra of confined carbyne (CCs) are briefly discussed in the following.LCCs can be synthesized mainly by two methods: arc-discharge and heat treatment. The first LCCs were obtained during the synthesis of multi-walled carbon nanotubes (MWCNTs) by arc-discharge. Normally, the arc-discharge between a graphite anode and a graphite cathode, in a chamber filled with inert gas, results in the obtention of highly-crystallized MWCNTs with ultra-thin inner tubes.136 By introducing a specific ratio of hydrogen gas into the reaction chamber, LCCs were synthesized inside the innermost tubes, forming a hybrid structure of LCCs@MWCNTs137 (Fig. 11). The carbon chains can be terminated with the hemisphere of the nanotube or the wall of the surrounding nanotube when the innermost tube is too large. Later on, the optimization of the synthesis of the LCCs@MWCNTs relied on various gases and current between the electrodes to control the temperature and the temperature gradient around the electrodes. For example, the preparation of LCCs@MWCNTs by the arc-discharge method has been tried in different inert gases or mixed with hydrogen, or even in liquid nitrogen.138–140 Cooling and magnetic fields can be used to change the temperature gradient around the electrodes, thus improving the synthesis of LCCs@MWCNTs.141
 | ||
| Fig. 11 (a) Illustration of a linear carbon chain inside a double walled carbon nanotube. Adpated from Zhang et al.142 HRTEM images of (b) a LCC inside a MWCNTs and (c) a CC inside a DWCNTs (scale bar 2 nm). The figures are adapted from the ref. 135 and 137. Raman spectra of (d) DWCNTs (green), polyyne (blue), and LCCs (red); (e) DWCNTs (blue) and LCCs@DWCNTs (red). (f) Raman intensity as a function of laser energy for the CCs at different Raman frequencies. (g) Optical energy gap as a function of Raman frequency for the polyynes and CCs in different environments. The figures are adapted from the ref. 143 and 144. | ||
Heat treatment is commonly used for the purification of the CNTs, and it was found that short LCCs consisting of several carbon atoms could be formed between the inner and outer walls of DWCNTs after annealing the sample in inert gas.145 At first, it was believed that CCs were synthesized inside DWCNTs during their annealing at 1550 °C, but this hypothesis was disputable due to a lack of, direct observations.146,147 Recently, CCs have been prepared by annealing in high vacuum using DWCNTs made from chemical vapor deposition.135 The annealing in high vacuum of DWCNTs made from chemical vapor deposition resulted in a much-improved CCs yield, rendering it possible to observe CCs directly using HRTEM, undoubtedly confirming the hybrid structure of CC@DWCNT (Fig. 11c). Compared to the Raman spectrum of the bulk sample, the coincided Raman spectrum from an individual CC@DWCNT also rules out the possibility of the carbon chains between the walls of the DWCNTs. Therefore, the status of the CCs has been finally solved. In addition, other than annealing above 1400 °C, heat treatment of filled polyynes inside DWCNTs at lower temperature below 1000 °C can combine the polyynes into long LCCs.143
The heat treatment can also be realized by methods other than furnace-based heating, for example, laser heating or field emission. Recently, CCs and also inner carbon nanotubes can be grown inside SWCNTs under laser annealing in vacuum by using lasers with power of tens of mW.148,149 In addition, CCs were formed during the testing of field emission when using SWCNTs as a cathode material.150
Although the synthesis of CCs has been successfully performed, precisely controlling the length of the CCs is still a big challenge. Furthermore, the yield should be further improved, especially for long chains.151,152 An interesting perspective is the synthesis of isotopically-labelled confined carbyne through the encapsulation of a isotopically-labelled liquid precursor. As shown in Fig. 11d–f, isotope CCs with around 11.9% of 13C labelling were achieved using 13C-methanol as precursor, enabling the possibility to engineer the properties of the encapsulated CCs. Later, 13C labelling ratio was increased to be 28.8% by using 13C–C60 as precursor.153
As demonstrated in Fig. 11f, the resonance Raman profiles of the CCs at different frequencies reveal the energy gap of the CCs. The energy gaps of polyynes in gas phase and in solvents, as well as the energy gaps of confined CCs inside DWCNTs, obtained by absorption or resonance Raman spectroscopies, are summarized in Fig. 11g. In general, the longer the chain, the lower the band gap, until true carbyne is reached. The energy gap is also closely related to the environment and shift linearly with Raman frequency, because both the energy gap and the Raman frequency of CCs depend on the bond length alternation between C–C single and triple bonds. Thus, the energy gap of any types of LCCs can be estimated quite accurately by the frequency of the Raman mode.144 When investigating the resonance Raman profile beyond the energy gap of the CCs, as shown in Fig. 12a–c, the resonance Raman profile each time shows resonances corresponding to two electronic transitions and two vibronic series of the second optical transition.157 A resonant Raman study of an individual confined CC revealed an excited sate lifetime of around 5 fs,158 whereas time-resolved resonance Raman scattering revealed that the exciton relaxation dynamics of the CCs occurred on a hundred of picoseconds timescale.159
 | ||
| Fig. 12 (a) Resonance Raman intensity map (red being the most intense color) of CC@DWCNTs in the range of the G-band of the CNTs (1600 cm−1) and the Raman modes of the encapsulated CCs (1700–1900 cm−1), adapted from ref. 157. (b) Raman spectra (black) and corresponding fits (red) zoomed in on the CC modes as a function of laser excitation energy, adapted from ref. 157. (c) Optical energy gap (black filled circles) and additional resonances (blue, green and red) of the CCs as a function of Raman frequency and corresponding best linear fits through the data points (red lines). Figures are adapted from ref. 157. Additional data points (black open circles) are obtained from ref. 144. (d) The Scheme of the isotopic labelling of CC. The Raman spectra and peak analysis of annealed pristine, 12C methanol, and 13C-labelled methanol filled SWCNTs excited by (e) 568 and (f) 633 nm lasers. The figures are adapted from the ref. 152 and 157. | ||
3.2. Nanotubes and endohedral nanoribbons
Different from the gapless graphene, graphene nanoribbons (GNRs), as another 1D carbon nanomaterials, get a tunable band gap due to the quantum confinement in the lateral direction. Such band gap is closely related to the edge structure and the width of the GNRs.160 Especially, GNRs with an arm-chair structure of their edges (AGNRs) present a band gap inversely proportional to the width of the GNRs, as shown in Fig. 13b, which can be classified into n = 3p + 1, 3p, and 3p − 1 species in order of reduced band gap, where n is the number of dimer lines across the ribbon width as defined in Fig. 13a and p is an integer.Several methods including cutting the graphite/graphene, unzipping the CNTs, and chemical vapor deposition have been developed to obtain GNRs with sufficiently narrow widths.161–163 However, up to now only on-surface synthesis (polymerizing the precursor molecules) and confined synthesis (reacting the molecules inside CNTs) result in both width and edge controlled GNRs.164,165 Although the on-surface synthesis can prepare the GNRs with various edge structure and width, it is still limited by complexities regarding the design of the precursor molecule and most importantly the mass production. In contrast, confined synthesis not only enables the same polymerization inside CNTs as the on-surface synthesis but also allows to decompose and react the filled molecules into GNRs with their width limited by the diameter of the CNTs.166,167
Confined synthesis of GNRs can be realized by polymerizing the polyaromatic hydrocarbons similar to the on-surface synthesis. As illustrating in Fig. 13c, coronene or perylene were used as precursor molecules, which were polymerized into GNRs via annealing. However, from the Raman spectra taken on the annealed samples (Fig. 13d), it is clear to see that other types of GNRs exist in the sample except the expected ones. In principle, more selectively-precise synthesis could be achieved by applying those specifically designed brominated molecules, which are also used in the on-surface synthesis. Sulfur-terminated GNRs were also prepared by using functionalized fullerenes as precursors,168,169 but control over the edge structure could not be obtained (Fig. 13e). By contrast, Ferrocene molecules used as precursors were shown to lead to GNRs with determined width and edge structure,170 (Fig. 13e). Also pre-filling CNTs with the solvent trichlorobenzene and subsequent thermal conversion resulted in the formation of specifically 6-AGNRs, which can only be explained by the CNT diameter controlling the formation of such GNRs.171 More recently, similar thermal conversions of trichlorobenzene inside BNNTs resulting in the formation AGNRs in BNNTs.172 As shown in Fig. 13f, Raman features when excited with a laser wavelength of 633 nm belong to the n = 6 arm-chair GNRs. while when excited by a laser with wavelength of 568 nm, n = 7 arm-chair GNRs were observed in the sample.173 In addition, the high intensity of the Raman modes of the GNRs compared to that of the CNTs points out the high the high yield of the grown AGNRs. Indeed, wavelength-dependent Raman studies of similarly synthesized AGNRs could correlate the electronic resonances with the Raman vibrational frequencies of 5-AGNR, 6-AGNR and 7-AGNRs synthesized within the CNTs.165,170 Although progresses have been made, the precise synthesis via confinement in CNTs still needs further investigations, especially for the other nonexplored GNRs, e.g., n = 4 arm-chair GNRs, zigzag GNRs, as well as heterodoped and isotopic GNRs. There is plenty of room in the future for both synthesis and property studies with application in electronic transport or photonics, for example.174
 | ||
| Fig. 13 (a) Schematic of a n = 11 armchair GNR with width of wa and 1D unit cell distance of da passivated by hydrogen atoms (empty circles). (b) The band gaps of n = Na armchair GNRs as a function of width (wa) obtained from first-principles calculations. (a) and (b) adapted with permission from Son et al., Phys. Rev. Lett. 2006, 97(21), 216803, Copyright 2006 American Physical Society.160 (c) Suggested structures of GNRs formed using coronene or perylene precursors. (d) Raman spectra of oligomer obtained by annealing the coronene power and the GNRs@CNTs transformed from the coronene and perylene encapsulated CNTs. (c) and (d) adapted with permission from Chamberlain et al., ACS Nano 2012, 6(5), 3943–3953, Copyright 2012 American Chemical Society.168 (e) Schematics of ferrocene molecules filled inside CNTs and transformed into GNRs with different widths inside CNTs with various diameters. (f) Raman spectra of the 6-AGNRs inside CNTs with marked diameters (the numbers after the alphabets e or H). The insets show the model of a n = 6 armchair GNR and the relative intensity of the C–H in-plane-bending mode to the G-mode in different samples. The figures are adapted from the references. Adapted with permission from ref. 170. | ||
3.3. Inorganic compounds transformation inside CNTs
Inorganic compounds may not be possible to insert directly within nanotubes due to their incompatibility with the different filling routes available in the literature.89 This incompatibility may be due a poor solubility of the compound in solution or a too high melting point. Other limitations may occur in case of a limited thermal stability (decomposition before melting), or a possible direct chemical reaction between the nanotube itself and the filling material: this may be the case for example while filling CNT with oxides (carboreduction reaction).91The best strategy is to identify a suitable precursor that can first be placed inside the nanotubes before being transformed into the final desired compound. This transformation is usually performed by heat treatment, because this can easily be applied to a bulk sample and does not require any chemical to be able to get inside the nanotubes – which is challenging for nanotubes with a narrow inner channel (less than 1–2 nm). The chosen heating atmosphere depends on both the stability of the nanotubes (CNT are generally air-sensitive above 250 °C, while boron nitride nanotubes are more stable in air). For example, air (or oxygen diluted in an inert gas such as N2 or Ar) is used to generate oxides while hydrogen is used to reduce compounds to the metallic state. Many other kinds of transformations (thermal degradation or decomposition) may occur while heating in inert atmosphere, depending on the chemistry of the compound of interest. We review here examples of such in situ transformations and discuss the limitations of this strategy.
Among the first examples of in situ transformations after filling are from the Green's group, when they initially filled CNT with different nitrates (Fe, Co, Ni, U and Cu/Au, CoFe2O4, Re) before annealing in He atmosphere to generate the corresponding oxide and then in H2 atmosphere to reduce oxides to the corresponding metals.96,99,108,175–177 The temperature reduction ranges usually between 200° to 600° depending on the filled compound.
Reduction may also be performed using chemicals such as alcohols (methanol) or glycols (ethylene glycol, propylene glycol) as proposed by the group of Rao.178 The question of the completion of such reactions was not discussed for a long time, people usually assuming a total transformation. This is the case especially for the reduction with H2 gas, which is very small and assumed to easily diffuse into most matrices To prepare nanomagnets confined inside double-wall CNT, different iodides of magnetic metals (Fe, Co, Ni) were reduced. However, the reduction of these iodides by hydrogen was found to not be as fast as expected. This of course depends on the temperature of the heat treatment and a compromise must be found between heating at a lower temperature for a longer time or at a higher temperature for a shorter time. If the temperature is too high, the reduced metal may be released from the nanotube due to its poor wettability of the CNT inner channel, leading to metal nanoparticles decorating the outer walls instead of the desired metal nanoparticles/nanowires inside the nanotubes. The reduced filling material may also be pushed out the nanotubes in case of gas release during the reaction (for example water vapour during the reduction of an oxide). Heating in hydrogen often leads to only partial transformation of the precursor when the inner diameter is very narrow, with a gradient of composition between the fully reduced metal to the initial metal iodide, progressing from the opening by which H2 gas gets into the nanotube towards the inside the nanotube.109 The thermal degradation of Nickel iodide, in particular, could be used to fill nanotubes with Iodine adopting different structures depending on the inner diameter of the host nanotube.
Although organometallics are a popular source of precursors for the direct synthesis of metal-filled nanotubes, there are few examples in the literature of filling with such molecules and further transformation into other compounds (metal oxides, metals). In particular, acetylacetonates have been used to fill CNTs with Nickel after thermal decomposition above 500 °C.179
Solvothermal treatments have also been proposed to fill CNTs with CdS nanoparticles. In this case, the CNT were first filled with Cadmium acetate before heating in an autoclave at 180 °C in DMSO (to provide sulphur). This strategy is interesting because the high pressure available in the autoclave must favour the capillary filling of the nanotubes and probably increases the filling rate.101
Finally, it is important to mention the possible incidental in situ rearrangement or decomposition of precursors within the TEM during the characterization of filled CNT. Among the first examples were the in situ rearrangement of SnO nanocrystals encapsulated within CNTs180 and the decomposition of ZrCl4-filled CNT to form ZrClx clusters. The decomposition of metal iodides and subsequent release of iodine was also observed in similar conditions.109
4. Tuning CNT optical properties using molecular assemblies
The proximity of the electronic surface of the nanotubes and the molecules, often in the range of the van der Waals distance, creates a favorable soil to physical interactions and coupling. A parallel can be done with 2D heterostructures based on nanomaterials such as graphene and other semiconducting layered materials. Among the large panorama of possible interactions between 0D/1D and 1D/1D nanobjects, this section focuses on charge and energy transfers to tune the nanotubes’ host properties. Dye molecules confinement into SWCNTs is a non-covalent functionalization that leads to new hybrid nano-systems with a new electronic structures that must be properly understood.4.1. Charge transfers and doping
The confinement of organic molecules, which are then in close proximity with the inner wall of the host CNT, enables different physical interactions such as π⋯π or CH⋯π interactions, charge transfer, or hybridization. For instance, the encapsulation of molecules that have either a high electron affinity or a small ionization energy can lead to a charge transfer (CT) in between the two sub-systems.Here, we review how to probe such phenomena in acceptor/donor molecules inside SWCNT using Raman and photoluminescence spectroscopies. For example, the Raman spectra of quaterthiophene molecules (4T) encapsulated in semiconducting (0.9 nm diameter) and metallic (1.4 nm diameter) SWCNTs both exhibit the G− and G+ bands of the SWCNTs (between 1500 and 1595 cm−1)181–186 and the C![[double bond, length as m-dash]](https://www.rsc.org/images/entities/char_e001.gif) C stretching vibrations of the confined 4T molecules at 1440–1530 cm−1 (Fig. 14a and b). However, a clear shift of a few cm−1 of the G-band is observed for the semiconducting SWCNTs. By comparing the relative G+ band shifts of the encapsulated SWCNT with respect to non-encapsulated semiconducting SWCNT as a function of the excitation wavelengths for the two distinctive SWCNT diameters, a noteworthy and wavelength dependent downshift of the G-band frequency for the 0.9 nm diameter SWCNT is observed (Fig. 14c).
C stretching vibrations of the confined 4T molecules at 1440–1530 cm−1 (Fig. 14a and b). However, a clear shift of a few cm−1 of the G-band is observed for the semiconducting SWCNTs. By comparing the relative G+ band shifts of the encapsulated SWCNT with respect to non-encapsulated semiconducting SWCNT as a function of the excitation wavelengths for the two distinctive SWCNT diameters, a noteworthy and wavelength dependent downshift of the G-band frequency for the 0.9 nm diameter SWCNT is observed (Fig. 14c).
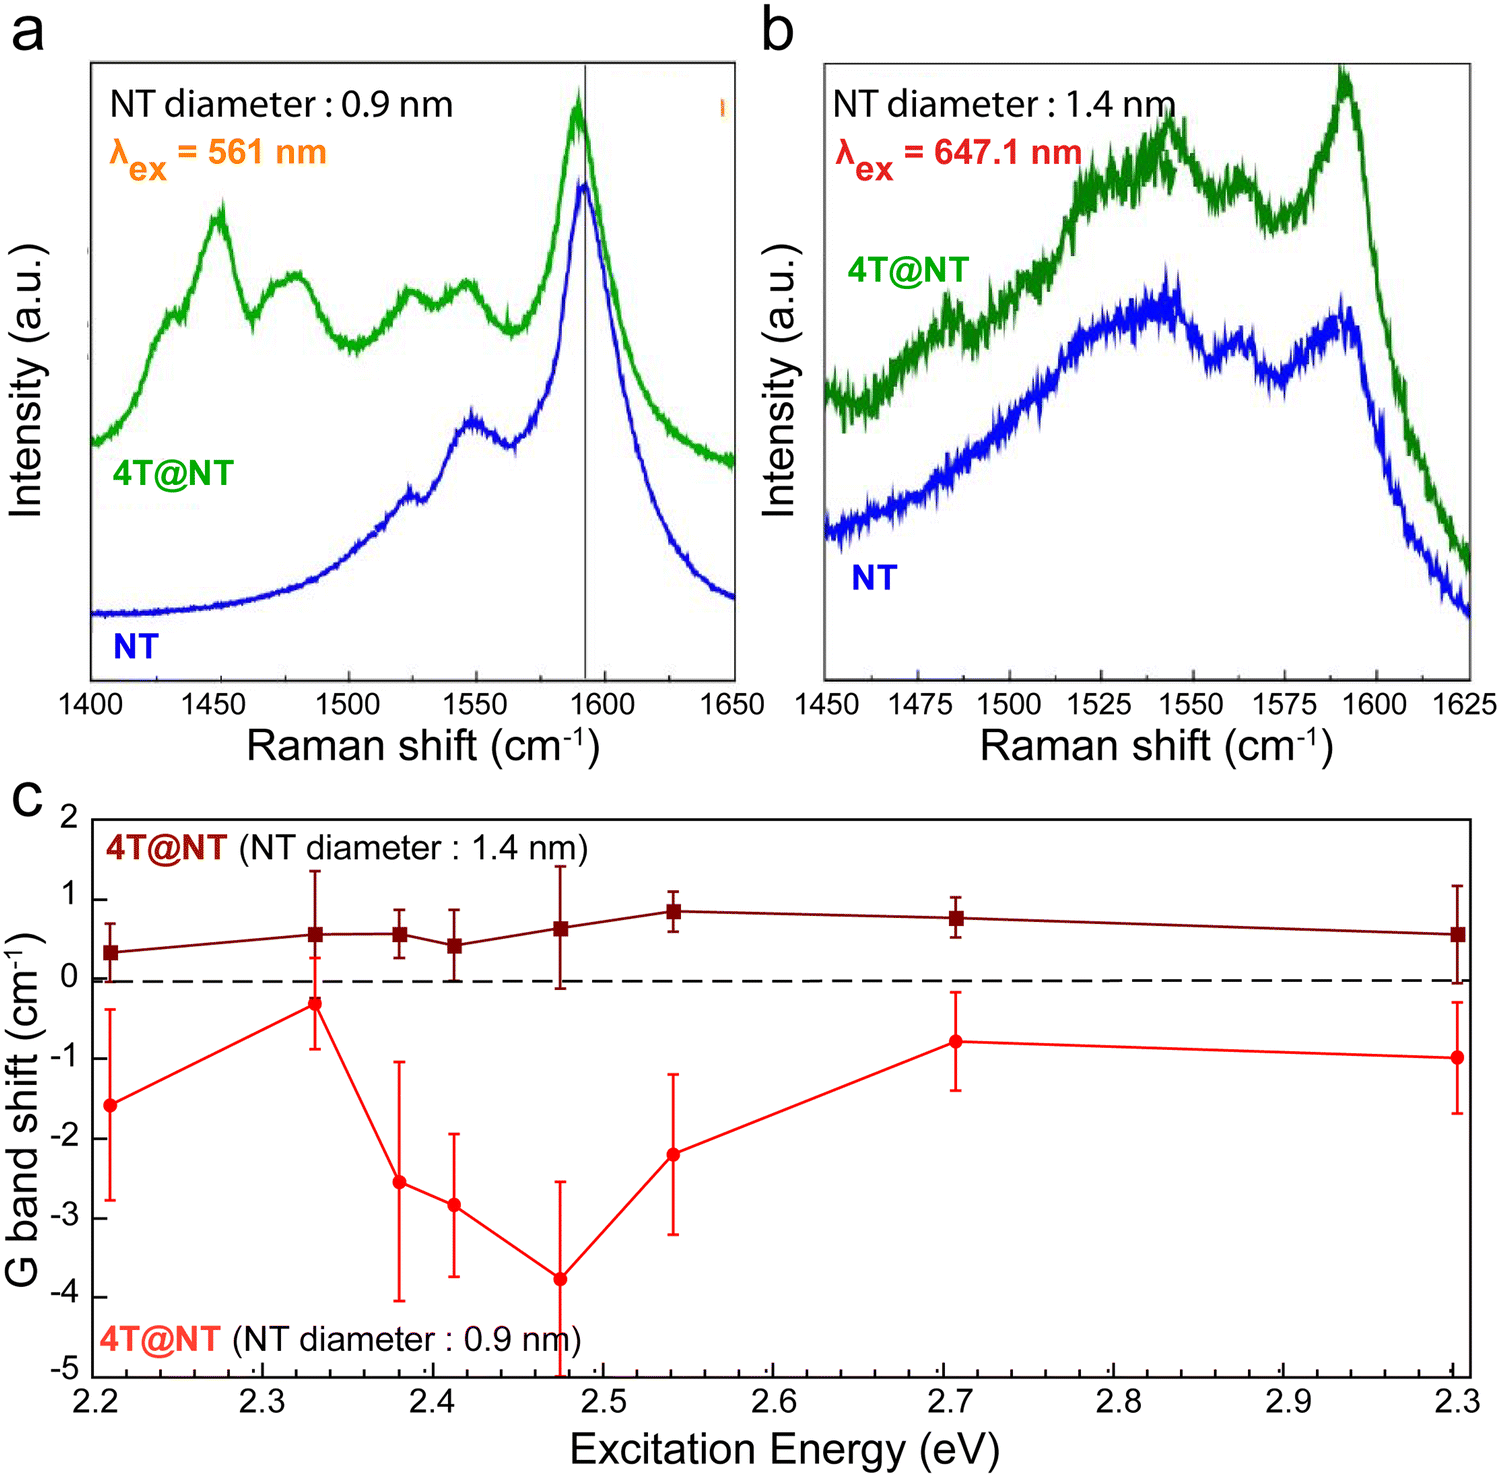 | ||
| Fig. 14 Raman spectra of pristine (black curve) and hybrid (blue curve) nanotubes having a diameter of 0.9 nm (a) or 1.4 nm (b) and excited close to their resonance excitation wavelengths, 561 nm and 647.1 nm, respectively. Hybrid spectra are offset for clarity. (c) Raman G+-band shifts of semiconducting NT after 4T confinement as a function of the excitation wavelength for 4T@NT with small diameters (ϕ = 0.9 nm, red circle and curve) and 4T@NT (ϕ = 1.4 nm, wine square and curve). Adapted with permission from ref. 187. | ||
Because semiconducting nanotubes having smaller diameters do not undergo electron–phonon coupling,188 the G+ band downshift comes from a weakening of the force constant, due to electron transfer from the confined molecules to the NT walls. The magnitude of this shift can be derived from the following relationship adapted from ref. 189 or 190:
| Δωstatic (cm−1) = −804 × ρc − 5126 × ρc2 − 176790 × ρc3 − 1657 × ρc3/2 | (1) |
According to eqn (1), shifts in the range from −0.28 cm−1 to −1.6 cm−1 would correspond to ρc ∼ (1.1 ± 0.7) × 10−3.
Considering that the 4T molecule is around 2 nm in length and calculating the number of carbon atoms in a NT of the same length with a diameter of 9 Å, we then calculate that ρ4T, the number of electron withdrawn from one 4T molecule, is equal to 0.25 ± 0.15, assuming that only one 4T molecule row is inserted.13 Finally, adapting the equation below from ref. 191 the Fermi level shift can be estimated by the following equation:
ΔEF(eV) = 51.77 × ρc × d![[thin space (1/6-em)]](https://www.rsc.org/images/entities/i_char_2009.gif) (nm) (nm) | (2) |
Furthermore, an important amplification of the downshift for excitation energies around 2.5 eV is evidenced. As the resonance profile of the confined 4T molecules overlaps this energy range, we can reasonably assume an extra photo-induced charge transfer, leading to an additional contribution in the G-band downshift (from −2.2 cm−1 to −3.7 cm−1), corresponding to ρc ∼ (3.2 ± 0.8) × 10−3 and ρ4T = 0.73 ± 0.17. Here, ΔEF = 0.15 ± 0.04 eV for 4T@NT09 at the resonance.187
For larger diameter tubes (d = 1.4 nm), the persistent upshift indicates that dynamic effects (electron–phonon coupling) govern the G-band behaviour. Using calculations on graphene,189 on individual semiconducting carbon nanotubes188 or observations realized on an ensemble of carbon nanotubes,182 the amplitude of the upshifts observed on Fig. 14c, around +0.5 cm−1, can be induced by a charge transfer of ρc ∼ (0.45 ± 0.15) × 10−3 and ρ4T = 0.05 ± 0.005 (assuming that three columns of 4T molecules can stack in the SWCNT section of such a diameter13). The Fermi level shift is then estimated as ΔEF = 0.035 ± 0.005 eV in this case.
The shifts of Fermi level and charge transfer values presented here are consistent with the measurements performed on an ensemble of SWCNTs.182 Furthermore a decrease by a factor of 2 of the coupling parameter −1/q, coupled to Fermi level shift ΔEF ∼ 0.2 eV, a has been already observed on individual SWCNT of comparable diameter.
Charge transfers and Fermi level shift in mol@SWCNTs also may strongly impact the excitonic processes and resonance profile and hence, modulate the light emission properties of the overall nanohybrids.
The photoluminescence excitation (PLE) maps of unfilled SWCNTs and of SWCNTs filled with donor quaterthiophene molecules (4T@SWCNT) are shown in Fig. 15a and b. The reference PLE map (Fig. 15a) indicates the presence of (6,5) and (9,4) SWCNTs with diameters of 0.75 nm and 0.9 nm, respectively. The 4T molecules do not fit in the (6,5) SWCNTs while there is enough space in the (9,4) SWCNTs to form one row of encapsulated 4T molecules. Interestingly, the (6,5) subpopulation shows an PL intensity ratio (R = Ifilled-SWCNT/Iunfilled-SWCNT) close to unity, while a R ∼ 5.5 is observed for the (9,4) SWCNTs.
 | ||
| Fig. 15 PLE map: PL signal intensity versus emission (x-axis) and excitation (y-axis) of NT09 (a), 4T@NT09 (b) NT09 (c) and TCNQ@NT09 (d), Note that here the intensities have been normalized by adjusting the absorption intensity on the E22 transitions of both samples. | ||
This PL increase indicates that the encapsulation of 4T molecules provide a way to modulate the emission properties of the smaller diameter (9,4) SWCNTs, which has also been seen for ferrocene or alkane encapsulation.81,192 Such enhancement of the intensity could be attributed to the weak electron transfer from the encapsulated molecules to the SWCNT, which compensate the intrinsic p-type doping of pristine nanotubes, induced, for example by curvature193 or defects.194 Thus, the charge transfer moves back the Fermi level closer to its expected position for “defect free” tubes,192 increasing PL efficiency as the volume available for molecules in the SWCNT increases.
In contrast, encapsulating an electron acceptor chromophore such as TCNQ leads to a very important decrease of the PL intensity (Fig. 15c and d). This behavior is consistent with the above assumption but, in this case, the Fermi Level is even more downshifted, which allows new de-excitation processes and thus reduces the PL efficiency. These assumptions were confirmed by optical studies on individual hybrids with confined electron donor (4T, TMPD) and acceptor (TCNQ, F4TCNQ) molecules.195
4.2. Energy transfers, sensitization and quenching
As will be described in more detail in Part 6, the endo- and exohedral functionalisation of SWCNTs with chromophores is essential to enhance or extend the light absorption of SWCNTs in other wavelength ranges and improve the photovoltaic device performance, for example.196,197 To achieve this photo-sensitization through energy transfers engineering (Fig. 16), which is distinct from charge transfer, several approaches can be found in the literature and can be classified into 3 main strategies: (i) covalent functionalisation and non-covalent (ii) endo- and (iii) exohedral functionalisation. | ||
| Fig. 16 Scheme use to show possible energy transfer mechanisms (a) in an electronic description through double electron transfer, (b) in an excitonic description. | ||
The covalent functionalisation of SWCNTs can be achieved through a variety of different chemical reaction pathways and choice of molecules. Covalent functionalisation leads to long-term bonding, which is advantageous for many applications. However, the attachment of functional groups using standard covalent strategies results in the conversion of the underlying sp2 carbon atom into its sp3 state, lowering the conjugation and, hence, disturbing the long-range transport properties. Moreover, it is essential to design suitable linkers to ensure the optimization of the distance and orientation of the chromophore with respect to the SWCNTs for efficient energy transfers.198,199 To limit the number of added defects to the SWCNT walls, DNA wrapping was used as a protective coating to then selectively attach CdSe/ZnS core shell quantum dots (QDs) to the carboxylic end-defects of SWCNTs, by using an amidation reaction.200 The steady-state PL intensity of the quantum dots was quenched by a factor of 2 upon their attachment to the SWCNTs, indicating electronic coupling between the two. This electronic coupling was further evidenced by single-QD-SWCNT emission studies, where QDs-SWCNTs displayed reduced blinking with respect to non-functionalised QDs. A different covalent strategy that preserves the π-conjugation of the SWCNT walls was also developed, allowing for high-density functionalisation (up to 1 out of 25 carbon atoms),201,202 and showing great promise for the design of stable and efficient energy-transfer nanohybrids. In this approach, a highly reactive azidodichloro-triazine species is created in situ to bridge onto two nearby-lying carbon atoms of the nanotubes. This strategy results in the regeneration of the π-conjugation of the whole system and the full electronic integration of the triazine group into the conjugated network, without creating trap/scattering centers for the nanotubes’ excitons. Because the chlorine atoms in the azidodichloro-triazine molecule can be easily substituted, this molecule is an ideal building block for further non-perturbative attachment. For example, the replacement of the chlorine atoms with thiol derivatives ensured the covalent attachment of gold nanoparticles onto the nanotube sidewall, enhancing their photoluminescence emission.201,202 Such plasmon-assisted emission enhancement of CNTs could previously only be observed in non-covalent systems.203,204
The non-covalent functionalisation of SWCNTs by either π-stacking on the outer walls or by encapsulating chromophores inside the SWCNTs, has the advantage of not perturbing the π-conjugated structure of the SWCNTs while still providing a very close interaction between the chromophores and SWCNTs (of the order of the van der Waals radius). Although the encapsulation of chromophores for energy-transfer nanohybrids is beneficial since the SWCNT wall protects the photochemical and thermodynamic stability of the dyes in comparison to external interfacial adsorption,205 the typical size of the chromophores prevents the use of small SWCNT diameters.82 Nevertheless, endohedral functionalisation, providing a very close interaction between the encapsulated molecules and the SWCNTs, has been shown to provide almost always close to 100% energy transfer efficiencies.12,14,23,205–211 Similar near unity EET yield have been reported for exohedral functionalization when the dye is directly π-stacked onto the nanotube side-wall, for example in the case of tetraphenyl porphyrin.212 However, this is not always the case for exohedral approaches. Depending on the manner of the exohedral functionalisation, either through direct π-stacking with the SWCNT walls,36,213–217 by using intermittent anchor molecules such as e.g. pyrene218,219 or perylene220 that provide the strong π-stacking with the SWCNT walls, or by attaching the chromophores to a polymer that wraps around the SWCNTs,221 very different energy transfer efficiencies can be observed. In addition, a morphological mismatch between the relative orientation of the chromophore and the CNT leads to altered energy-transfer efficiency, even if their relative separation is within the Förster radius.222,223 One novel strategy is to first coat the SWCNTs with porphyrin molecules through π-stacking, and subsequently polymerising of these porphyrin molecules to stabilize the exohedral functionalisation.38
The attachment configuration strongly affects not only the strength and origin of the interaction between molecules and the nanotubes but also the chemo-physical nature of the building units themselves. For example, the molecular photochromic switch spiropyran profoundly changes its chemical behaviour and optical response depending on how it is complexated with carbon nanotubes. In its isolated, pristine form, when excited with ultraviolet light, the colourless spiropyran undergoes a conformational change, turning into merocyanine.224 The merocyanine emission is not quenched by the presence of the nanotubes if non-covalently attached onto the tubes with a relative separation of ca. 1 nm.225,226 However, it is completely quenched when π-stacked onto the nanotube sidewalls.227 When spiropyran gets covalently attached onto the nanotubes via the triazine-based covalent approach,201,202 the uninterrupted conjugation between the molecule and the nanotubes drastically changes the response of the system upon UV light illumination: the π-electron released upon spiropyran-to-merocyanine isomerization is not confined into the merocyanine anymore and is released onto the nanotubes. Instead of emitting, then, the molecule yields light-triggered doping of the carbon nanotubes, affecting the position of their Raman G-band and the efficiency of the photoluminescence emission.201,202 The emission of the carbon nanotube is completely quenched at the single nanotube level. This light-triggered, reversible modulation of the nanotube's emission can be exploited to achieve super-resolution microscopy in the near-infrared, where biological tissues are transparent.228
Different experimental techniques can be employed to investigate the mechanism and efficiency of the energy transfer between chromophores and SWCNTs. Typically, a combination of different spectroscopic techniques is employed to distinguish energy- from charge-transfer, unveil the physical mechanism of the energy transfer and, most importantly, measure the efficiency of the transfer.
Raman spectroscopy is known as an efficient way to probe charge transfer combined with energy transfer in hybrid systems;195,201,202,229 yet, the main technique to evidence energy transfer however is the wavelength-dependent fluorescence-excitation (PLE) spectroscopy, in which the emission of SWCNTs is probed as a function of their higher-order excitation bands. When energy transfer is occurring, the encapsulated or adsorbed molecules absorb the excitation light (at wavelengths that the SWCNTs do not preferentially absorb) and subsequently transfer their energy to the SWCNTs that then afterwards emit light, resulting in an additional band that can be observed in such PLE maps. This additional band occurs at the same emission wavelength of the SWCNTs but at the excitation wavelength of the dyes.209,211,230,231 Representative PLE maps of such nanohybrids, in comparison with the non-functionalised starting materials, are presented in Fig. 17. Excitation energy transfer (EET) peaks in the PLE maps can be clearly distinguished, either for externally adsorbed porphyrins on (6,5) SWCNTs212 (Fig. 17a and b) or for encapsulated squarylium molecules inside a broad-diameter SWCNT sample209 (Fig. 17c and d).
 | ||
| Fig. 17 Excitation Energy transfer observed through PLE spectroscopy of functionalised SWCNTs ((b) and (d)) by comparing the PLE maps with non-functionalised SWCNTs ((a) and (c)). Additional bands can be clearly observed, corresponding to specific absorption of the adsorbed (b) and encapsulated (d) dye molecules and emission from the SWCNTs. Adapted with permission from ref. 212 and 209. | ||
To determine the energy transfer efficiency, a rough estimation can be obtained by comparing the PL counts of the excitation energy band with that of the SWCNTs. However, several unknown parameters are needed to make this estimation inaccurate, such as the absorption cross-section of the SWCNTs, the absorption cross-section of the dyes (that can be altered due to the stacking on or encapsulation inside the SWCNTs), and their relative concentrations.
Besides providing a direct evidence for EET between the dye and the nanotubes, a remarkable outcome of these PLE maps in the case of exohedral functionalization with porphyrins has been to provide an original means to benchmark the absorption cross-section of the different nanotube chiral species to the absorption cross-section of the porphyrin on their Soret band. Indeed, the ratio in intensity of the EET peaks and the intrinsic SWCNT emission peak can yield direct information on the absolute absorption cross-section of the SWCNTs, when the number of adsorbed porphyrin molecules and the energy transfer yield are known:230
In addition, when measuring the EET peaks for encapsulated molecules, a minimal encapsulation diameter can be estimated from the onset of the observation of this energy transfer in the PLE maps; for smaller diameters SWCNTs, no EET peaks are observed while they are observed for larger diameters SWCNTs.209,210
Nevertheless, it is readily seen in Fig. 17d that for the squarylium dye (SQ) encapsulated inside SWCNTs, the EET peaks corresponding to different SWCNT diameters (with different emission wavelengths) have their maximum resonance at different excitation wavelengths.209 This peculiar behaviour was attributed to a different molecular stacking of the dye molecules inside SWCNTs of different diameters. This became even more clear after subsequent sorting of the SWCNT samples into single- or few-chirality distributions, allowing to directly access the change of the dye absorption after encapsulation in different chiralities (Fig. 18).232 The diameter-dependence of the excitation energy of the encapsulated dye molecules can be understood by taking into account the geometric freedom available for the dye molecules within SWCNTs with different diameters [see also Part 2.1 on dyes aggregation inside nanotubes]. In small diameters, the molecules can only stack in a single-file arrangement, hence resulting in the formation of J-like aggregates and yielding a large red-shift with respect to the dye molecules freely suspended in solution. For larger diameters, the dyes can take a staggered or multi-file arrangement, yielding smaller or even larger red-shifts depending on the exact geometric arrangement of the dyes.209
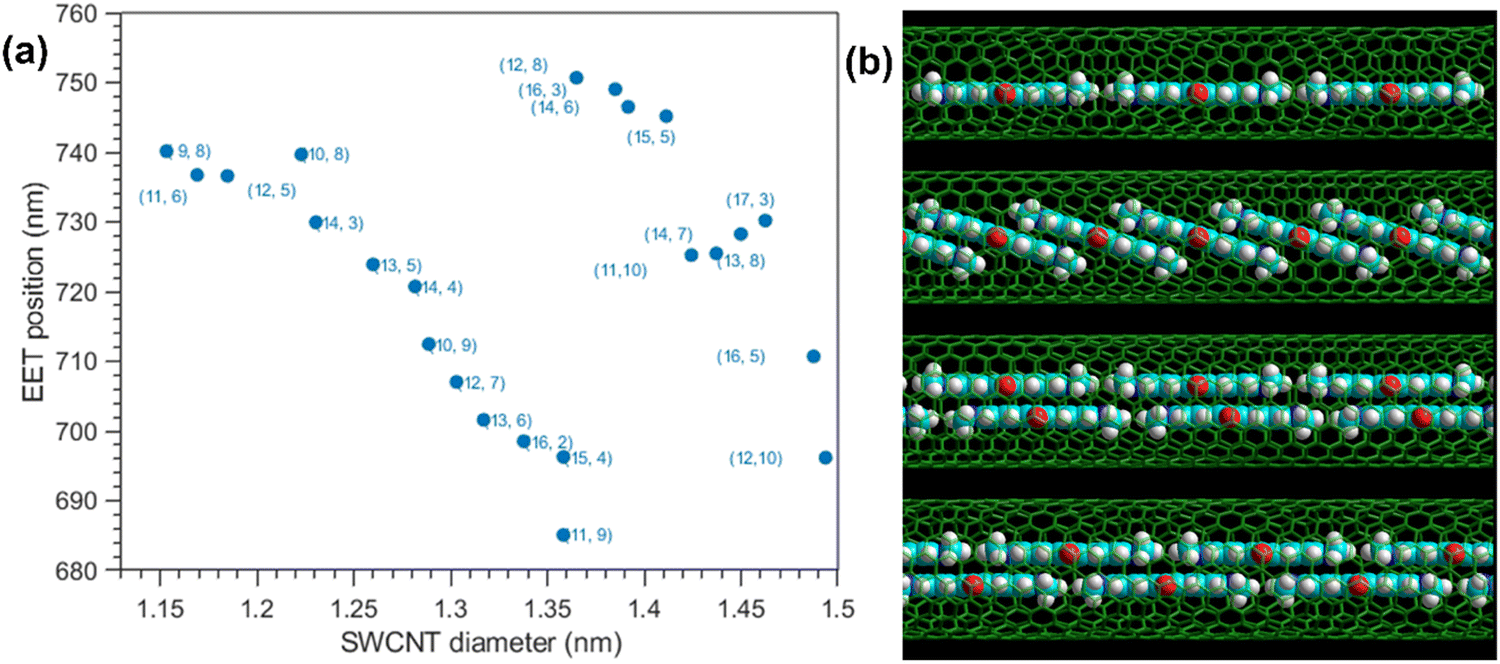 | ||
| Fig. 18 (a) Position of the EET peak extracted from 2D spectral analysis of the PLE maps of different squarylium-filled and chirality-sorted SWCNT samples. The pink shaded area represents the minimal encapsulation diameter range while the purple area represents the diameter range after which a more complex behaviour is found due to multiple possible arrangement in larger diameter SWCNTs. (b) Qualitative models for possible stacking geometries of squarylium molecules resulting in different EET peak positions. Composed from ref. 209 and 232. | ||
If energy transfer takes place, the molecules’ fluorescence will be reduced. Thus, if no other non-radiative decay pathways are created due to the interaction with the SWCNTs, the fluorescence quenching of the adsorbed/encapsulated molecules can give information on the energy transfer efficiency. Recent works have demonstrated a near-to-complete quenching of the PL efficiency of encapsulated/adsorbed molecules, with values ranging from 99.9%210 up to 99.999%23,209,212 It is now generally accepted that lower reported PL quenching values for encapsulated species,12,14 originate from trace amounts of non-encapsulated molecules still present in the suspension, highlighting the importance of sample purification after encapsulation, as described in detail in the ESI† File. Indeed, even for SWCNTs encapsulated inside SWCNTs, (such as in DWCNTs), the PL is drastically quenched by several orders of magnitudes (PL quantum yield to be 10−6),233 and energy transfer was observed from inner to outer SWCNTs as a cause of this PL quenching.234 By contrast, as discussed in Part 5.1, molecules encapsulated within boron-nitride nanotubes display preserved and tunable luminescence.
For exohedrally non-covalently adsorbed molecules, it is inherently more difficult to determine the PL quenching factors because non-adsorbed molecules in the suspension are hard to avoid. Thereby, only a lower limit for the PL quenching factor can be estimated. For SWCNTs functionalized with porphyrins and subsequently solubilized in surfactant, the lower limit of the PL quenching of the porphyrins was determined to be from 99.5% to 99.9% depending on the trace amounts of non-interacting (thus luminescent) porphyrins in surfactant micelles212,217,235,236 (Fig. 19a).
 | ||
| Fig. 19 (a) Quenching of the PL of porphyrins/SWCNT hybrids (red line) with respect to the non-interacting porphyrins (blue line) yielding a quenching factor of the order of 1000.212 (b) Transient absorption measurements on the Soret transition of the porphyrin showing an extremely fast energy transfer from the porphyrins to the SWCNTs (red line together with exponential fit (doted line)); for comparison the decay of the porphyrin reference sample is shown in blue. (c) Polarized photoluminescence excitation spectrum. The blue line represents the luminescence spectrum for an excitation polarization parallel to that of the emission, whereas the red line corresponds to a cross polarization. The data show a splitted Soret band at 2.8 eV and 2.9 eV, which is interpreted in the framework of Davydov splitting for a layer of self-organized porphyrin molecules on the nanotube outer wall. (d) Schematic of an array of porphyrins at the surface of a carbon nanotube, with their hx dipoles aligned to the nanotube axis; (e) evolution of the low energy ħωx and the high energy ħωy bands as a function of the number of porphyrin monomers in the aggregate. Adapted with permission from Delport et al., Nano Lett. 2017, 17(11), 6778–6782 Copyright 2017 American Chemical Society (ref. 37), and from ref. 212. | ||
More detailed information on the efficiency, kinetics and mechanism of the energy transfer comes from time-resolved absorption experiments, as PL quenching alone cannot distinguish between energy transfer or other non-radiative decay pathways.
For non-covalently-attached tetraphenyl porphyrins, an extremely fast energy transfer to the SWCNTs is observed, experimentally determined to be below 100fs (the detection limit), from transient absorption measurements (Fig. 19b). An enhanced bleaching of the nanotube excitonic transition when the hybrid is excited on the porphyrin transition is also observed simultaneously.237,238 This bleaching behaviour shows that the nanotubes are photo-sensitized by the porphyrin and that the accelerated decay of the porphyrin is due to EET rather than to non-radiative quenching. This ultrafast energy transfer is understood in the framework of a Förster mechanism between a point donor and a one-dimensional acceptor separated by a distance of a few ångstroms only. Förster energy transfer is usually a resonant mechanism. Here, however, the significant coupling means that the TPP molecules can transfer their energy through their Q bands to the weak band-to-band absorption of the SWCNTs in between the excitonic transitions.176 Another interesting feature of this large coupling between the dyes and the SWCNT is the strong absorption anisotropy that the hybrids inherit from the nanotube due to the self-organization of the TPP array on the nanotube wall.37,239 This absorption anisotropy results in peculiar polarized PLE spectra (Fig. 19c–e) and opens interesting perspective for the self-organization of non-covalently-attached molecules using carbon nanotubes as a template. In addition, the molecule/molecule interaction can be studied in a configuration partially controlled by the nanotube geometry.
Extremely fast and efficient energy transfer has also been observed for encapsulated molecules. For quaterrylene-encapsulated SWCNT hybrids, the EET time constants were found to depend on the specific nanotube diameter range of the samples in which the quaterrylene molecules were encapsulated. This difference was then interpreted to arise from different molecule-wall distances for different molecular arrangements.12 For squarylium dyes encapsulated inside SWCNTs, transient absorption experiments (where the dye was pumped and the SWCNT absorption was probed) showed an instantaneous decrease of the SWCNT absorption of 15%, evidencing that EET took place within the 190fs time resolution of the experimental setup.231,237 This estimation is however difficult to do in a multi-chirality sample, due to the strongly overlapping absorption peaks of SWCNTs. More recently, transient absorption experiments were performed on SWCNT samples with a narrow diameter distribution, so that both the dynamics of the encapsulated dyes and the SWCNTs could be characterized209 (Fig. 20a). A clear ground-state bleach of the dye absorption and an enhanced bleaching of the SWCNT absorption in the S11 and S22 optical transitions of the SWCNTs was observed for the dye-filled sample in comparison to the reference sample. Probing the exciton creation and decay dynamics of the (10,8) SWCNT, this increase in intensity appears to be instantaneously on a time scale similar or shorter than the instrumental response (∼200 fs, see ref. 209). By probing the kinetics of the encapsulated molecule (Fig. 20b and c) reveals that the encapsulated dye molecules show a multicomponent decay with a short component (205 fs) and different longer components. At early times, the ground-state bleach peaks at 748 nm and the excited-state absorption peaks at 720 nm, which can be associated to the EET itself (as it is occurring on the same timescale). Later, however, the transient spectrum turns into a derivative-like spectrum with a crossing point at ∼750 nm, that lasts for several tens of ps, denoting a shifted absorption spectrum of the dye.209
 | ||
| Fig. 20 Transient absorption spectroscopy of diameter-sorted squarylium-filled SWCNTs pumped at 748 nm (in the Squarylium dye absorption band). (a) Peak transient absorption spectra at early times (solid lines) and steady-state absorption spectra (dashed lines) of dye-filled SWCNTs (red traces) and the reference sample filled with DCM (black traces). (b) Kinetic slices of the Squarylium dye (SQ) dissolved in toluene (blue) or encapsulated inside the SWCNTs (red) and the instrument response function (IRF). (e) Selection of transient absorption spectra for short (sub-ps), medium (ps) and long (tens of ps) time scales. Figures reproduced from ref. 209. | ||
From the transient absorption experiments, which unlike PL quenching studies track the entire excited-state population, the changes in the rate coefficients can also be used measure the energy transfer efficiency.36,209,212 In addition, the enhanced transient absorption intensities observed for dye-filled SWCNTs indicate the number of additionally added excitons on the SWCNTs from the dye absorption, therefore providing a complementary measure for the energy-transfer efficiency.209,231 Each of these methods have their advantages and disadvantages and therefore a combination of these techniques is required to properly estimate the energy transfer efficiency in these nanohybrid samples.
5. Tuning molecules properties using nanotubes as host-templates
5.1. Carbon versus boron nitride as nanotube host-template
It was demonstrated in the previous sections that the typical larger bandgap of the encapsulated dyes in the visible range (2–3 eV) compared to that of the semiconducting nanotubes in the NIR leads to effective energy transfers that both readily quench the dyes fluorescence and sensitize the nanotube host. This quenching enabled the study of the Raman fingerprint of the encapsulated dyes that is usually embedded in the huge fluorescence background. For example, the encapsulation mechanism of dyes inside SWCNTs has been studied by capitalizing on the quantitative and polarized properties of the Raman scattering of the confined dyes (see Part 2.1).30,240 Nevertheless, the nearly quantitative quenching of the dyes fluorescence drastically limits fundamental studies and applications based on confined 1D aggregates of fluorescent dyes for photonics. In this context, boron nitride nanotubes (BNNT) have been identified as a promising host template for dyes because of their dielectric nature. Indeed, the slight ionicity of the B–N bond leads to an asymmetric charge distribution and π-bond localization, as opposed to the delocalized structure attributed to SWCNTs. This opens up the band gap, leaving BNNTs as insulators or wide-gap semiconductors of ∼5.5 eV, that is mainly independent of diameter and chirality.241 (Fig. 21) Because of this different electronic behaviour, dye fluorescence is not expected to be quenched in BNNTs, opening the way for the design of fluorescent nano-hybrids. | ||
| Fig. 21 Illustration of double row of sexithiophene encapsulated inside a SWCNT (left) and in a double walled boron nitride nanotube (right). The energy band gap (average) of semiconducting SWCNT and BNNT are compared to the HOMO–LUMO band of common dyes in the visible range. | ||
In 2016, Niskanen et al. demonstrated that large diameter BNNTs (∼50 nm) can be used as delivery vectors for fluorescent dyes and drugs in cells,242 experimentally confirming the conservation of the dye fluorescence upon encapsulation. In 2019, Allard et al. demonstrated that small diameter BNNTs (∼3 nm) can act as smart dye templates for both preserving and stabilizing the fluorescence of dyes and driving specific aggregation states through 1D confinement.243 The encapsulation is done in a supersaturated solution in an appropriate solvent, in which the BNNTs and encapsulating solution are refluxed at a specific temperature for a given time. This procedure is similar to the liquid-phase method used to encapsulate SWCNTs.22 The success of the encapsulation was assessed using TEM (Fig. 22). Nano electron energy loss spectroscopy (EELS) data confirmed the chemical nature of the encapsulated material, 6T dye molecules in this case, the core loss signal at 165 eV evidencing the sulfur atoms that are present in 6T, and the threshold at 2.7 eV in the low loss range confirming the dielectric fingerprint of 6T molecules.
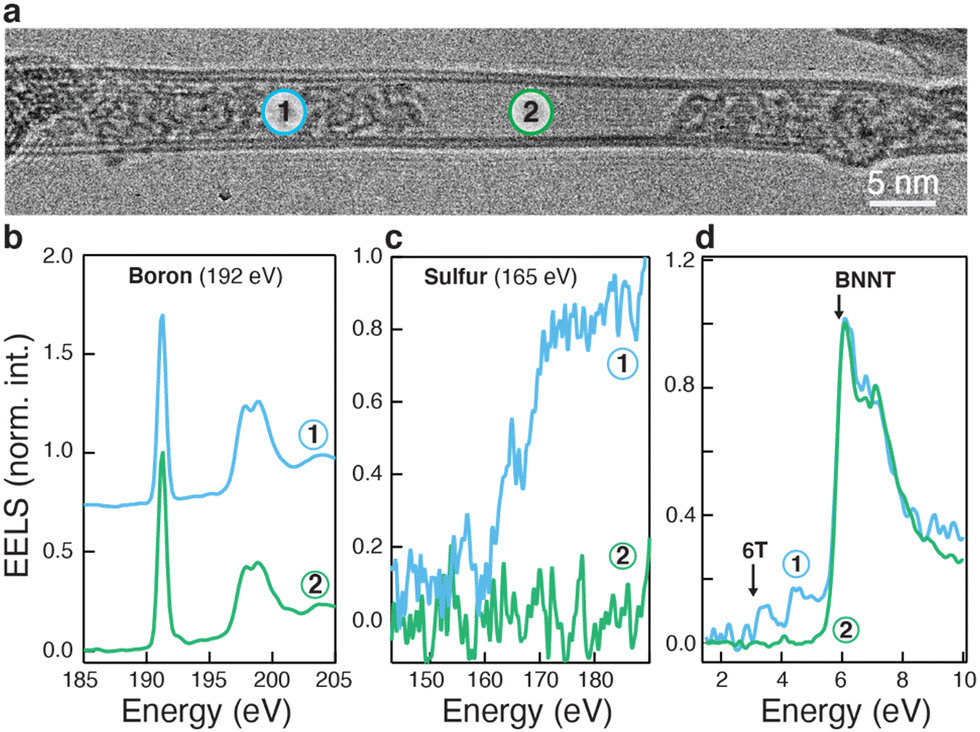 | ||
| Fig. 22 (a) HRTEM image of a partially filled 6T@BNNT suspended on a Molybdenum-SiO2 TEM grid. (b) and (c) Chemical analysis of selected areas (1) and (2) in (b) using core-loss STEM-EELS at the boron K-edge (192 eV) and sulfur L2,3-edge (165 eV). (d) Measurements of the energy levels in the same two areas by STEM-EELS in the 1–10 eV energy range. Data reproduced with permission from Allard et al., Adv. Mater. 2020, 32(29), 2001429, Copyright 2020 Wiley.243 | ||
Dye molecules in BNNTs exhibit different conformation and aggregation states as a function of the inner diameter of the template (Fig. 23a). The fluorescence spectra, (Fig. 23b) of the dyes@BNNTs hybrids are, with respect to the monomer spectra, broadened, red-shifted and depend on the excitation energy. This characteristic PL signature is most likely indicative of the presence of a broad population of emitters, in which each dye/BNNT combo has a distinctive emission behaviour depending on the diameter of the BNNT and the aggregation state of the dye. It was already shown that SWCNTs templates structure of the assembly of dyes for which specific transition dipole moments alignments, such as J-aggregation are observed.23 However, the relative narrowness of the diameter distribution of SWCNTs inhibits the formation of more complex, mixed H-like, J-like and HJ-states.244 Coupled with the aforementioned energy transfer phenomena between SWCNTs and dyes, this impedes on exploiting and studying the richness of the molecular photophysical processes involved in confined 1D systems. Dyes@BNNTs hybrids are, in this context, an ideal model system still under investigation.
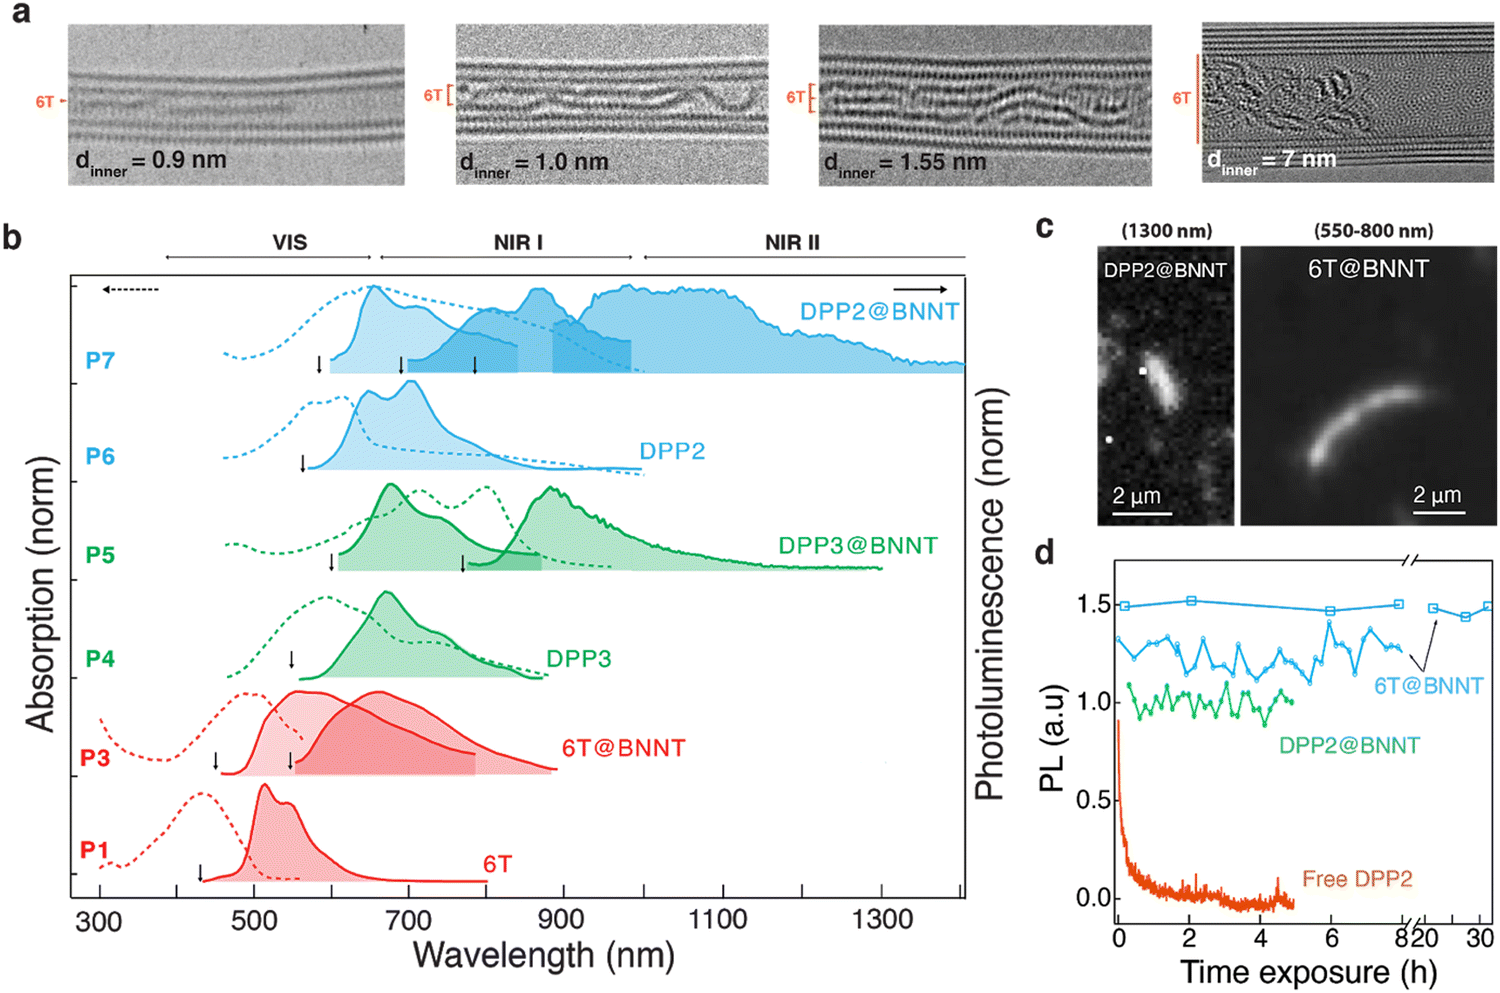 | ||
| Fig. 23 (a) HRTEM images of 6T molecules inside BNNTs of different diameters. The HRTEM and STEM-EELS data are recorded at 80 kV (b) Absorption (dashed) and fluorescence (continuous) spectra at room temperature of various dyes and corresponding Dyes@BNNTs in solution. The excitation wavelength used for each PL spectrum is indicated by a vertical black arrow. (c) Left panel: Fluorescence image recorded at 1300 nm (1 nm of spectral interval) from a DPP2@BNNT deposited on a Si/SiO2 substrate (λex = 800 nm). The acquisition time is 10 s at a fluence of 1.0 μW μm−2. Right panel: Integrated luminescence imaging of a typical microbundle of a 6T@BNNT deposited on a Si/SiO2 substrate (λex = 532 nm). The time acquisition is 0.2 sec and the laser fluence is 1.2 μW μm−2. (b) Time evolution of the integrated PL of isolated bundles of 6T@BNNTs (blue) and DPP2@BNNTs (green) on a Si/SiO2 surface, compared to free DPP2 (orange) photoexcited under a fluence of 1.2 μW μm−2 at λex = 532 nm (long pass filter at 533 nm). Data reproduced with permission from Allard et al., Adv. Mater. 2020, 32(29), 2001429, Copyright 2020 Wiley.243 | ||
Similar to SWCNTs,23,205 BNNTs sidewalls act as barriers protecting the dyes from external chemical reactions and oxidizing environment, leading to increased photo-stability (Fig. 23d). This conserved fluorescence allows the design of non-fading fluorescent hybrids, complementary to the SWNTs-based Raman hybrids described above, in which the signal can be tailored by the choice of the dye and the diameter of the BNNT.243,245
5.2. Non-linear optics from encapsulated dyes
“The 1D confinement of molecules in CNTs can lead to supramolecular arrangements not achievable in traditional bulk materials. Such original ordering of polarizability tensors can be particularly useful in second order nonlinear optics (NLO)”.Second order nonlinear optics (NLO) are widely used in effects such as second harmonic generation and other parametric wavelength conversion, as well as in electro-optics used in optical data communications. Hence, vast research efforts have been focused at developing more efficient NLO materials based on organic compounds.246–251 Typically, push–pull chromophores, consisting of a conjugated chain with a donor and acceptor group at either end (which have both a large hyperpolarizability β and a large dipole moment) are used. One of the key problems in the design of organic NLO materials is that this large dipole moment also results in dipole–dipole interactions favoring a pairwise antiparallel stacking of the molecules when incorporated in a macroscopic material (Fig. 24a), thus cancelling the NLO response at the macroscopic scale (the vast majority of push–pull dyes crystallizes centrosymmetrically). Traditionally (among other approaches252), the main strategy to overcome this is to orient the dipolar molecules by electric field poling in a polymer matrix while heated above its glass transition temperature.250,253 However, this approach intrinsically results in a thermodynamically unstable state, and long term degradation of the obtained alignment remains difficult to avoid.
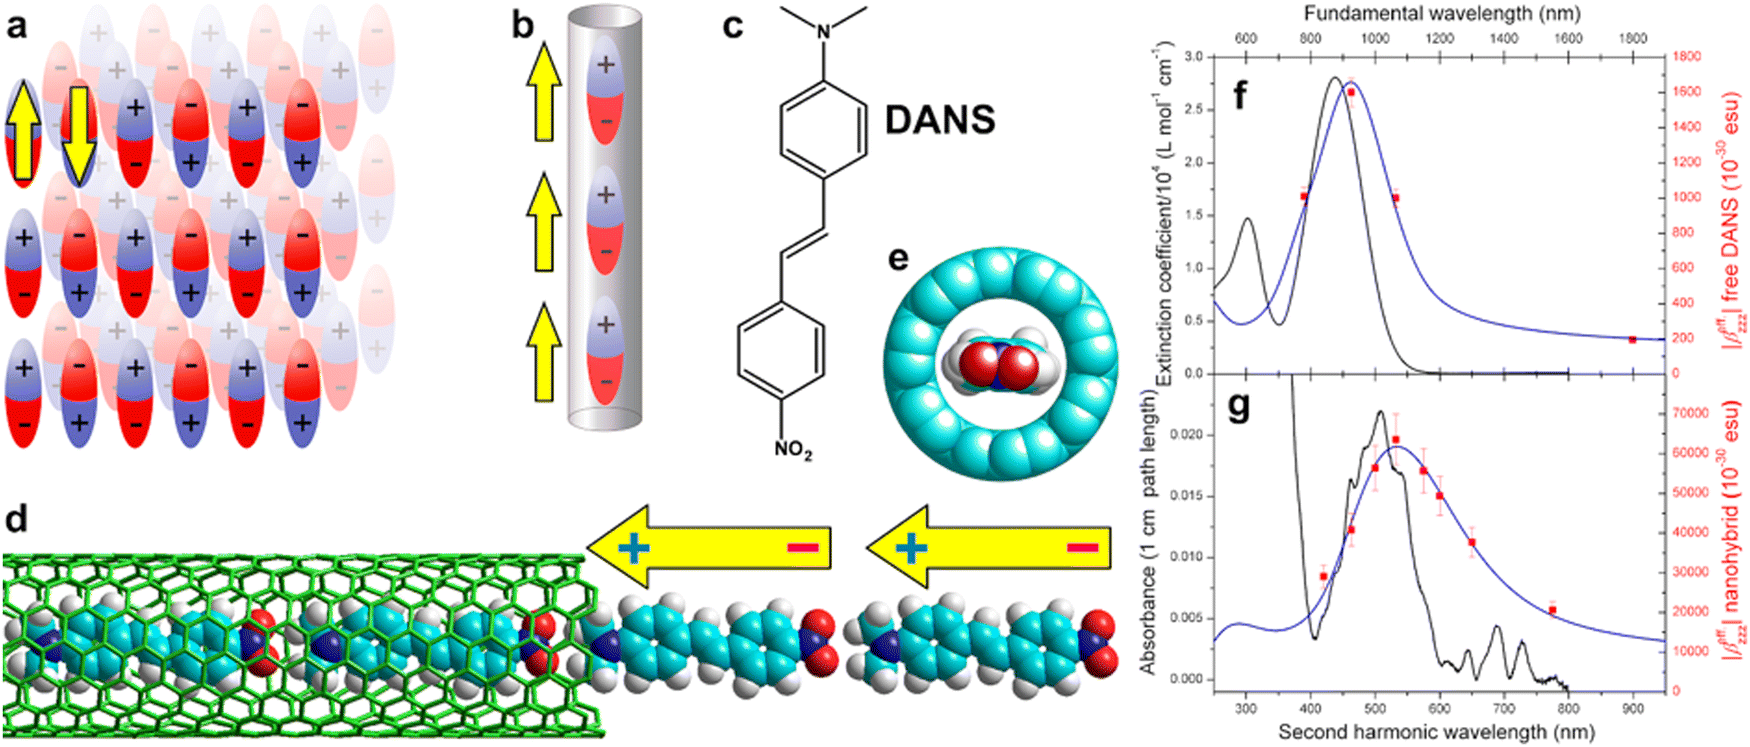 | ||
| Fig. 24 Stacking of dipolar molecules in different dimensions. (a) In two or three-dimensional bulk materials, Coulomb interactions tend to favor a pairwise antiparallel ordering, thus cancelling asymmetric properties such as the NLO response. (b) In one-dimensional confinement, a polar head-to-tail order is naturally favored, as oppositely charged ‘heads’ and ‘tails’ attract each other, leading to a constructive addition of the molecular NLO responses (and dipole moments). (c) Chemical structure of p,p′-dimethylaminonitrostilbene (DANS), a prototypical NLO molecule. (d) Theoretical model of these NLO molecules in a (9,7) single-walled carbon nanotube (diameter, 1.09 nm), showing that the internal channel just fits a single file of molecules. (e) Axial view of the same structure, with all atoms represented with their van der Waals radii, showing more clearly the relative size of DANS molecules and the SWCNT internal channel. (f) Wavelength dependent NLO response of the free dye and (g) of the dye@SWCNT nanohybrids. Adapted with permission from Cambré et al., Nat. Nanotechnol. 2015, 10(3), 248–252, Copyright © 2015, Springer Nature Limited.210 | ||
An elegant way to solve this central problem is to encapsulate the molecules in a nanoscopic channel just the right size to force the elongated molecules into a 1D array. In that case, the Coulomb interaction naturally favors the ideal head-to-tail alignment of the dipolar NLO molecules (Fig. 24b), resulting in a constructive, coherent addition of the molecular NLO responses. This principle has previously been pursued by encapsulating organic NLO dyes in zeolites,254–256 but drawbacks include the low filling fractions achieved, the limited processability, and the fact that dye arrays in different channels are not necessarily aligned in the same way (this relies on additional forces such as surface charges).
These remaining issues could be solved by using SWCNTs rather than zeolites.210 The advantage of this approach is that the aligned molecular arrays are obtained individually as dye@SWCNT hybrids, which form from chemically inert yet solution processible building blocks. Note that because of their high symmetry, non-filled CNTs exhibit only relatively modest second order NLO responses (albeit nonzero, and sizeable, due to their chiral hence non-centrosymmetric nature)257 but have very large third order nonlinearity.258–262
In an initial study,210 a well-known NLO dye (p,p′-dimethylaminonitrostilbene), DANS263 (Fig. 24c–e) was inserted in SWCNTs from solution using a reflux method (see also ESI† File). Optical absorption measurements, when compared with reference samples made using closed SWCNTs, gave the first clue of the presence of the dye inside the SWCNTs, although far more detailed, chirality dependent information was obtained from PLE and multi-wavelength Raman spectroscopy. A critical SWCNT diameter for NLO dye filling of ∼1.02–1.08 nm was demonstrated (Fig. 25), in line with molecular models. This critical diameter was inferred through shifts of the E11 and E22 transitions and diameter-dependent energy transfer in the PLE map, as well as through shifts of the RBMs in the Raman spectra.
 | ||
| Fig. 25 Raman and PLE shifts and energy transfer, all showing the critical diameter for encapsulation of the NLO molecule DANS. (a) PLE peak positions from 2D fits, showing that for small diameters, no difference is observed between the solvent-filled and DANS-filled SWCNTs. The inset presents the electronic shifts, with a clear onset starting at 1.02 nm. The intermediate region, i.e. partial filling, is indicated by the red band. (b) and (c): Raman spectra of empty (black), DANS-filled (red) and solvent-filled (blue) SWCNTs excited at two different wavelengths. (b) clearly shows that for the slightly thinner (12,1) and (11,3) tubes, no difference is observed between the DANS@oSWNT and solvent@oSWNT samples, while for the (9,7) tube a clear shift can be observed, as well as for larger diameter tubes excited at 514.5 nm (c). Vertical lines indicate peak positions of DANS-filled SWNTs. For the intermediate diameter range, only partial filling is observed ((10,5) in (b)). (d) Results of Raman fits (to data using multiple wavelengths) presenting the vibrational shifts also showing the onset of encapsulation at ∼1.02–1.08 nm. (e) Difference PLE map (intensity of DANS@SWCNT – D2O@SWCNT) showing an energy transfer band at excitation wavelengths corresponding to the dye absorption (around 500 nm), which shows a clear onset at SWCNT emission wavelengths of ∼1350 nm, corresponding to a critical diameter for filling of ∼1.08–1.10 nm. Adapted with permission from Cambré et al., Nat. Nanotechnol. 2015, 10(3), 248–252, Copyright © 2015, Springer Nature Limited.210 | ||
Nonlinear optical characterization by hyper-Rayleigh scattering (i.e. incoherent second harmonic light scattering, HRS) allowed the demonstration and the quantification of the head-to-tail alignment. Resonant, wavelength-dependent HRS characterization helped in attributing the NLO response to the encapsulated dye, as opposed to the SWCNTs themselves (Fig. 24f and g). For randomly-oriented molecules in liquid solution, HRS is a fully incoherent process and its intensity is proportional to N〈β2〉 where N is the number of molecules and 〈β2〉 is an orientational average of the appropriate β components. If n dye molecules are aligned in a configuration with head-to-tail stacking (with unchanged β of each molecule), the second-harmonic field amplitudes of dyes in the aggregate add up coherently and the intensity rises quadratically with n. However, the intensities from different aggregates (randomly oriented in the solution) still add up incoherently. Hence the overall intensity is proportional to  , which is n times larger intensity than if the molecules were randomly oriented. Thus, the average domain size (n) of perfectly head-to-tail aligned molecules can be determined by comparing the HRS intensity of a dispersion of the dye@SWCNT hybrids to that of a solution of the free dye. Arrays with total hyperpolarizabilities and dipole moments that are ∼55–70 times those of the free molecules were observed, translating to domain sizes of ∼55–70 molecules. In addition, as the intensity is proportional to β2, the second harmonic light intensity per array was ∼5000 times superior than that of the free molecules. These domain sizes were in line with expectations from a simple model for dipole–dipole interactions, but were also believed to be limited by the length of the (relatively short) SWCNTs used in that initial study. Further improvements can be envisaged by using more gentle tube opening procedures to obtain longer open SWCNTs. The highest enhancements were obtained when using SWCNTs with a smaller average diameter, in line with the idea that only in the thinner tubes just fitting a single file of molecules the ideal head-to-tail alignment is obtained. For larger diameters very diverse stacking arrangements are possible,264 leading to either constructive or destructive interference of NLO responses. The diversity of possible stackings and resulting inter-molecular coupling has also been demonstrated for different dyes such as symmetric squaraine derivative (see also Part 4.2).27,30,209 It should be noted that in ref. 210 the main enhancement in intensity was obtained from the coherent addition of molecular NLO responses as discussed above, but that a small additional enhancement through the improvement of the molecular hyperpolarizability itself, due to intermolecular interactions in the J-aggregate-like assembly, was also noted. Theoretical work265,266 has modelled the cooperative NLO enhancement in these molecular arrays, and while the calculations in ref. 266 overestimate the enhancement effect of intermolecular coupling compared to the experimental results in ref. 210, they do indicate the potential for further improvement in appropriate conditions. Future work should also focus on implementing these nanohybrids in macroscopically aligned NLO materials. Their huge total dipole moment promises easy and good alignment in electric fields, and their size will ensure that the obtained alignment will be extremely stable.
5.3. Near-field nano-optics on encapsulated molecules
Because the dimensions of molecules and the diameters of SWCTs (on the order of 1 nm) are smaller than the characteristic length scale of visible light (500 nm), far-field studies of molecular-CNT hybrids are restricted to the detection of entire hybrids and measurements on bulk samples containing many tubes. Electromagnetic near fields overcome this restriction in resolution,267,268 enabling optical studies with a resolution reaching one nm and less.269,270 This section reviews the study of molecular-CNT hybrids in optical near fields.Metal nanostructures support strong electromagnetic resonances that originate from the collective oscillations of free electrons in the metal. These excitations are called localized surface plasmon resonances or simply plasmons for short.267,268 About half of the plasmon energy is stored in the energy of the excited electrons, and the other half in the electromagnetic near field close to the metal surface. This field is tailored and further focused in nanoparticle agglomerates or so-called plasmonic oligomers, which are controlled arrangements of nanoscale metallic building blocks. In the void between two or more particles, the electromagnetic near fields are orders of magnitudes stronger than the far field that was used to excite the plasmon. The enhanced field increases the cross section of optical processes like light scattering and emission as well as non-linear processes like second-harmonic generation. Particularly strong, however, is the plasmonic enhancement for Raman scattering,271,272 for which enhancements of up to 108–1010 were observed.273,274 For historical reasons, this effect is known as surface-enhanced Raman scattering (SERS).275,276
Nanotubes that are filled with molecules are excellent probes to study the fundamentals of SERS and plasmonic enhancement, Fig. 26.23,208,277–279 The nanotube's walls prevent direct interaction between the molecules and the metal, which may otherwise change the molecules’ properties.280 Aligning of the molecules inside the tubes, in addition, allows the control of the orientation and placement of the molecular probe in the near field of the plasmonic nanostructure.23,208 Alpha-sexithiophene (6T) molecules in single-walled carbon nanotubes were used to study plasmonic enhancement by a gold nanodimer (Fig. 26a).208 The tubes were deposited in the dimer void by dielectrophoresis thereby carrying the molecules into the plasmonic hotspot.281,282 The plasmonic enhancement is manifested impressively in the polarization dependence of the Raman effect277 (Fig. 26a and b). Whereas in standard Raman scattering the light is polarized along the nanotube axis, SERS is strongest for polarization along the nanodimer.208,277,279,281,282 Dyes@CNTs are superior probes for such studies, because of the well-known symmetries of the molecular vibrations. A similar polarization dependence in unfilled CNTs led to speculations on the activation of non-totally symmetric and symmetry-forbidden Raman modes,283 although this idea was invalidated in a thorough study of polarized SERS enhancement.279
 | ||
| Fig. 26 SERS enhancement of 6T@CNT in a plasmonic gold nanodimer. (a) Comparison of the SERS (red) and Raman (black) intensity measured at 638 nm yielding an experimental SERS enhanced of 8 × 10⁴. (b) AFM images of 6T@CNT in a nanodimer (SERS) and the reference 6T@CNT without plasmonic enhancement (Raman). Right: Polarization dependence of the SERS (red) and Raman (black) intensity. θ measures the polarization of the incoming and outgoing light (they were kept parallel) with respect to the vertical axis in the AFM images. (c) Simulated SERS enhancement factors for 638 nm excitation and the nanodimer geometry of the device used in panel (a) as obtained through AFM and SEM images. The total calculated enhancement factor is 800. Adapted from ref. 277. | ||
6T@CNTs were also used to quantify SERS enhancement factors compared to conventional Raman scattering, showing that plasmonic enhancement is intrinsically stronger than predicted by near-field theory.208 Remarkably, the increase in the 6T cross section (105–106) was two orders of magnitude larger than predicted from the electromagnetic enhancement by the plasmonic nanostructure (103–104).208 Similar discrepancies were also observed in SERS of molecules without nanotube encapsulation, but typically reasoned to arise from chemical interaction between the molecule and the gold.273,284,285 Possible explanations are collective effects like coherent scattering in SERS and strong light–matter interaction between the dye and the plasmonic cavity.285 Strong light–matter interaction may also explain a remarkable narrowing of the SERS resonance (70 meV) when compared to resonant elastic scattering by the plasmonic excitation (290 meV) and even to the 6T Raman resonance in the reference sample (130 meV).
By exploiting plasmonic enhancement was used to study encapsulated species in CNTs were studied with high spatial resolution using tip-enhanced Raman scattering (TERS)135,156,158,286 where a sharp metal tip acts as an optical antenna that converts propagating lights fields into localized near fields and vice versa.268,287,288 The spatial resolution of TERS as a vibrational optical scanning probe microscopy technique is determined by the extension of the near field, i.e., 10–20 nm for a metallic tip on a semiconducting substrate and down to 1 nm for a metallic tip some Angstrom above a metallic substrate (STM configuration).269,288 Because of its superior resolution, TERS can be used to characterize confined molecules, the nanotube host, and their mutual interaction by Raman spectroscopy. This feature is particularly useful for dyes@CNTs with filling factors below one, where filled and empty CNT segments alternate over length scales below the diffraction limit, and for molecular compounds with length-dependent properties such as confined carbyne (see also Part 3.1).
Confined carbynes have one Raman active phonon, a fully symmetric vibration along the chain axis termed C-mode,289 which is well separated from the Raman modes of the host CNTs. The frequency of the C-mode informs on the atomic configuration of the carbyne chain (termed bond-length alteration), which is determined by the length of the chain and the interaction with the nanotube host (for example through van-der-Waals interaction and charge transfer). Initial observations of a spatially continuous TERS signal of carbyne inside isolated DWCNTs (Fig. 27c) suggested that confined carbyne chains may reach lengths up to several hundreds of nanometers.135,286 However, the relative contributions of chain length and nanotube host to the chain's atomic configuration remained unclear. The correlation between the C-mode frequency and the RBM of the host nanotube was also demonstrated (Fig. 27e).156 The C-mode frequency was independent of the chain length measured by TERS for chains longer that 30 nm (more than 230 atoms). The C-mode frequency between 1770 and 1835 cm−1 was explained entirely by the interaction of the chain with the host nanotube. Using TERS to measure the length of individual carbynes chains in combination with resonant Raman spectroscopy revealed that carbyne confined inside carbon nanotubes have a Raman scattering cross section of 10−22 cm2 sr−1 per atom, making it the strongest Raman scatterer ever reported.290 This high Raman scattering cross section makes carbynes promising candidates for nanoscale thermometry via Stokes/anti-Stokes Raman spectroscopy.291
 | ||
| Fig. 27 (a) TERS on carbyne@CNTs (b) Sketch of carbyne chain confined inside a double-walled carbon nanotube. (c) AFM image of a small bundle of DWCNTs overlaid with a TERS image of encapsulated carbyne chains. TERS reveals several carbyne chains with different lengths. (d) Raman spectra of carbyne chains and the nanotube host at three different locations indicated by symbols in (c). (e) TERS spectra of DWCNTs and encapsulated carbyne chains reveal a clear correlation between the RBM of the inner carbon nanotube and the C-mode frequency of the encapsulated carbyne chain. (a), (b) and (e) adapted with permission from Heeg et al. Nano Lett. 2018, 18(9), 5426–5431 Copyright 2018 American Chemical Society, ref. 156 and (d) from ref. 286. | ||
Filled nanotubes are excellent probes to study the fundamentals of near-field optical spectroscopy. At the same time, SERS and TERS can both be used to measure weak signals from encapsulated molecules and study the spatial distribution of the guest species. An exciting development to further improve TERS for dye@CNTs is to exploit of resonant Raman scattering in TERS by performing TERS with tunable laser excitation.292 Such a system would allow probing of the optical response of the encapsulated and the host species and thus the study of guest–host interaction in the optical response with nanoscale resolution.
6. Towards applications
6.1. Molecules@NT and their use in bio-imaging and drug delivery
Nanotubes are widely investigated as attractive material for biomedical applications due to their unique properties such as their high aspect ratio, nanometric size, modifiable surface and possible biocompatibility. Notably, their 1D architecture is favourable to tissue and cell diffusion293 when compared to other promising, nano-based biomaterials like quantum dots. Carbon nanotubes possess intrinsic optical properties well-suited for bio-imaging. Their PL emission in the NIR has been well-documented, but the emission intensity is highly dependent on the crystalline quality of the nanotube, which severely limits the extent of available functionalization. Carbon nanotubes also exhibit a strong Raman response exploitable for biological applications. For example, by tailoring C13/C12 carbon isotope compositions and monitoring the associated G-band position, multiplexing of up to five Raman nanoprobes was demonstrated in cancer cells and tissues.294 However, the low specificity of this Raman signature impedes the diversification of the nanoprobes library and decreases the multimodal capabilities.In a complementary manner, the hollowness of the nanotubes inner channel offers interesting perspectives due to the diversity of materials available for encapsulation, while still leaving the surface free for further, unconstrained functionalization. Nanotubes have been filled with various materials such as contrast agents for computed tomography and magnetic resonance imaging,295–301 magnetic materials,302–305 organic dyes and therapeutic compounds, to name a few.
Organic dyes are particularly promising for optical imaging, whether as multiplexed Raman probes in SWNTs, or as stable fluorescence probes in Boron Nitride Nanotubes (BNNTs). Visible fluorescence from dye/SWNTs hybrids is seldom reported, either due to dye/SWNT energy transfer30,209,231 or to the presence of metallic SWNTs providing non-radiative de-excitation pathways. Free from fluorescence background, encapsulated dyes can then be detected by their Raman scattering signature. Raman spectroscopy is a particularly interesting modality due to the narrowness of its emission peaks and the uniqueness of the Raman signature associated with each compound. However, Raman scattering intensity is usually weak with respect to fluorescence which severely limits its sensitivity for biomedical detection. Encapsulating organic molecules, such as sexithiophene (6T), in SWNTs can increase the Raman cross-section of the aggregates over the threshold for single-object detection.22 Furthermore, the large quantity of available dyes enables the creation of a library of different nanohybrids, in which the encapsulated dyes are protected from degradation notably via reaction with reactive oxygen species.205 This, combined with appropriate sidewall modification, allows the design of robust and functionalizable nanoprobes tailored for multiplexed detection.
Dyes@SWCNTs were first demonstrated as Raman tags in Candida Albicans cells. The SWCNTs were subsequently functionalized with PEG-NH2 to allow solubility in physiological saline solutions and Candida Albicans cells were non-specifically tagged following an incubation and washing protocol. Monochromatic Raman images, acquired at a characteristic Raman scattering frequency for βcar, showed the homogeneous localization of the tags on the yeast cells. Further expanding on this topic, multiplexing was then demonstrated using two dyes@SWCNTs on Candida Albicans. Both tags distributed mostly evenly on all cells, with some cells displaying a slight enrichment of one type of tag.306 These studies display the capability of Raman imaging as a multiplexed detection modality for dye@SWCNTs hybrids. The versatility and robustness of the Raman signal was also assessed by targeting specific biological functions. In that case, βcar@SWCNTs probes were functionalized with a biotinylated PEG for the detection of streptavidin, exploiting the strong biotin/streptavidin interaction. Using Raman imaging, it was shown that the probe was selective for the regions where streptavidin was present. Furthermore, good co-localization of the Raman peaks specific to beta-carotene and to SWCNTs demonstrated the reproducibility of the encapsulation process.
Because of the aforementioned advantages, other types of similar nanotubes, such as BNNTs, were investigated as capsules for the encapsulation of organic dyes. However, in the case of BNNTs, the fluorescence of the dye is not quenched, which allows the possibility of photostable fluorescence imaging (see Section 5.1). Large diameter BNNTs (∼50 nm), coated with glycine, were first used as transporters for contrast agents enabling the crossing of cell-permeant and non-cell-permeant dyes, respectively Rhodamine 6G and Lucifer Yellow, beyond the cellular membrane while encapsulated in BNNTs.242 Dyes encapsulated in small diameter BNNTs (∼3 nm) were also used as a digestive tube contrast agent for daphnia pulex.243 Upon the encapsulation of sexithiophene (6T) and diketopyrrolopyrole derivatives DPP2 and DPP3, the three different color probes were used to illuminate the digestive tract of the daphnia, and the signal could be tracked, both in vivo and post-mortem, for over 12 hours without significant decrease in signal intensity (Fig. 28a and b). Presence of the dyes in daphniids was confirmed through their Raman signature, leading to an increased detection specificity (Fig. 28c). Furthermore, daphniids incubated with free dyes died within a few minutes of incubation, whereas daphniids incubated with dyes@BNNTs survived after incubation times ranging from a few minutes to 36 hours. This illustrates the protection effect of the BNNT which is two-fold: on one-hand, the dyes are shielded from undesirable chemical reactions leading to degradation and photobleaching (Part 5.1). On the other hand, bio-organisms are also protected from relative toxic effects from the dyes. Additionally, encapsulation can shift the emission of the dyes to the NIR II and NIR I spectral windows, which is ideal for in vivo biological detection due to decreased tissue scattering, absorption and autofluorescence.307 An example of imaging in the NIR I window with DPP3@BNNT is shown in Fig. 28d, in which the signal from the digestive track of the daphnia is obtained using a long-pass filter with a cutoff at 900 nm. Large red-shift in emission, attributable to J-aggregate formation, have been previously reported for self-assembled nitroazo or cyanine dyes and used for in vivo bio-imaging in the NIR II.308,309 BNNTs of appropriate diameters could act as templates towards the J-aggregation of dyes for which this aggregation state is naturally unfavourable, unlocking their use as NIR bio-imaging tools.
 | ||
| Fig. 28 Dyes@BNNTs as hypermodal nanoprobes illustrated for Vis-NIR bio-imaging of Daphnia Pulex. (a) Z-reconstructed confocal optical image of a Daphnia immobilized in Leica medium (#1). PL images recorded through a fluorescence microscope mounted with a UBG filter and 10X objective lens of living starved Daphnia (top #2) and after incubation in a solution of unfilled BNNTs (bottom #2), 6T@BNNTs (#3), DPP2@BNNTs (#4) and DPP3@BNNTs (#5). (b) Luminescence intensity time-lapses of dyes@BNNTs, (i) in living conditions, (ii) in post-mortem conditions. (c) Raman spectra at λex = 532 nm taken in the region of the digestive tube of Daphnia for #3 and at λex = 633 nm for #4 and #5. (d) PL image of a living Daphnia collected at a wavelength of 900 nm using an excitation at λex = 532 nm. Inset: Optical image of the Daphnia. The scale bar is 200 μm for images #1, #3–#5 and 400 μm for #2. Data reproduced with permission from Allard et al., Adv. Mater. 2020, 32(29), 2001429, Copyright 2020 Wiley.243 | ||
The internalization of PEG-6T@BNNT in human hepatoblastoma cells (HUH6) was also studied by confocal hyperspectral fluorescence microscopy (Fig. 29a) and the stability of the probe against a conventional cellular membrane label (DiA) was assessed by two-photon microscopy. After 30 min of irradiation, the DiA fluorophore used to reveal the cellular membrane faded whereas strong signal could still be observed from the 6T@BNNT hybrid, confirming the enhanced photostability of the nanoprobe (Fig. 29a). This high photostability in cellular environments enables applications such as tracking of individual dyes@BNNT was monitored for up to 30 min (Fig. 29c).
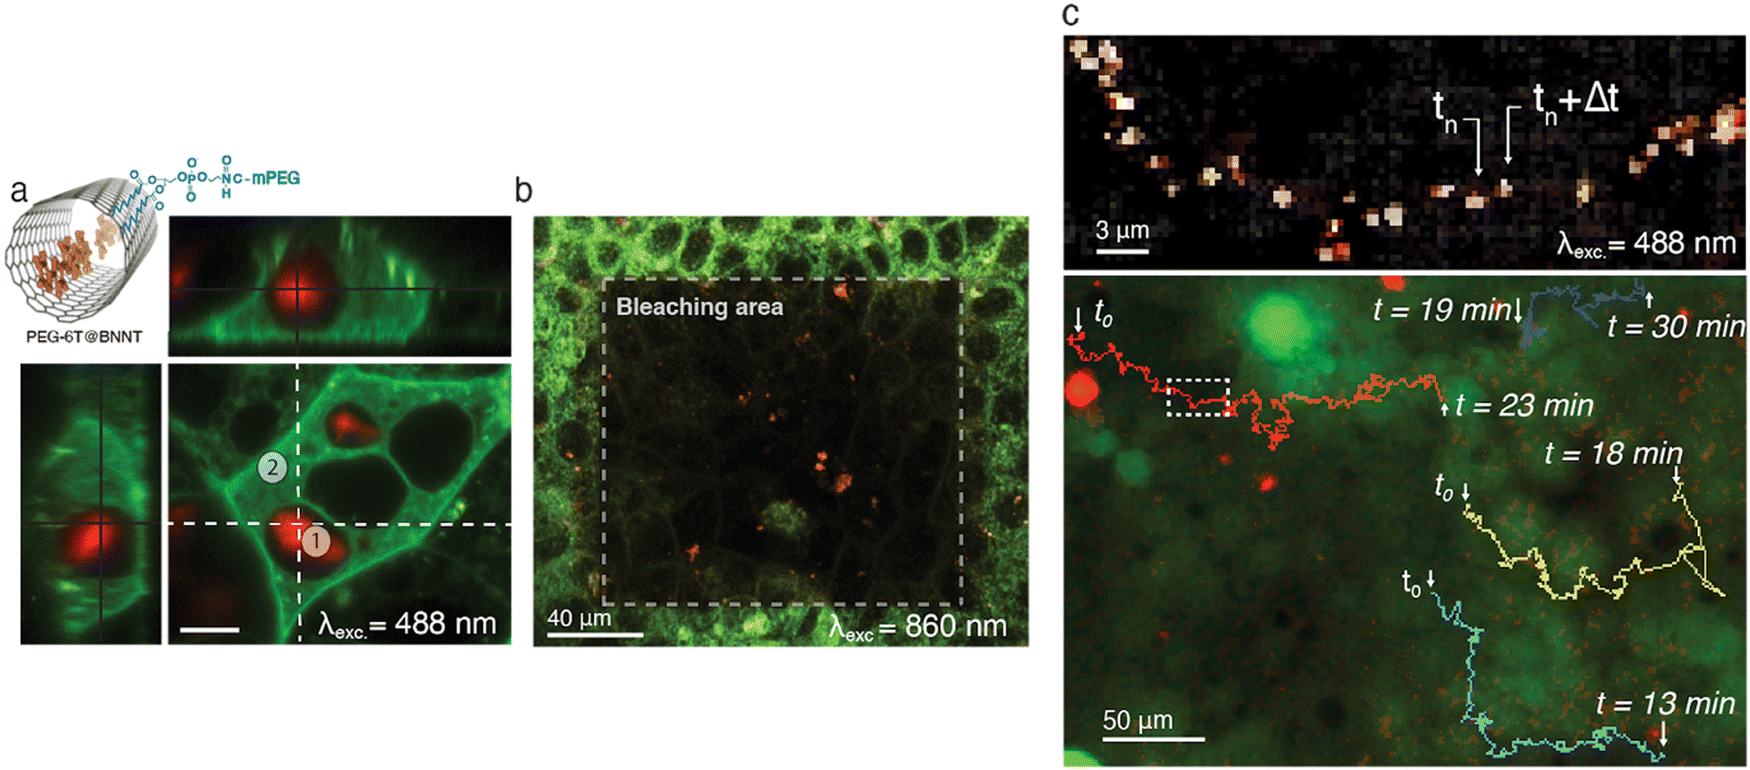 | ||
| Fig. 29 Imaging of Dyes@BNNTs in a HuH6 cells mat. (a) Hyperspectral and confocal fluorescence imaging of liver cells incubated with PEG-6T@BNNT for 24 hours and with DiA for 10 min before imaging. The red and green channels correspond to the integrated intensity from 600 nm to 780 nm and 490 nm to 520 nm, respectively. (b) Hyperspectral two-photon fluorescence image of fixed hepatoblastoma cells previously incubated for 24 hours with PEG-6T@BNNTs. The dashed line highlights a bleaching test area where the DiA and the PEG-6T@BNNTs were illuminated in two-photon imaging conditions at λex = 860 nm for 30 min. The red and green channels correspond to the integrated intensity from 645 nm to 715 nm and from 500 nm to 530 nm, respectively. (c) Top: Tracking of a single PEG-6T@BNNT nanoprobe in confluent HuH6 cells using a superposition of luminescence images extracted every 30 s from a time-lapse datacube (Δt = 650 ms, λex = 488 nm). Bottom: Full trajectory reconstruction using a tracking algorithm of the four PEG-6T@BNNTs detected within the field of view. Data reproduced with permission from Allard et al., Adv. Mater. 2020, 32(29), 2001429, Copyright 2020 Wiley.243 | ||
The hollow interior of nanotubes also provides opportunities for drug loading and targeted delivery. As with dyes, encapsulation allows protection of the molecule from degradation, which, in a drug delivery context, inhibits early inactivation of the therapeutic compound before the attainment of the site of interest. Because of the two-fold protection mentioned previously, encapsulation can also prevent unwanted side effects to the host organism during circulation to the target sites. The surface, then free for modification, can be functionalized with different molecules for increased biocompatibility and targeting specificity.
The potential of carbon nanotubes as loading and delivery systems was investigated theoretically for drugs such as anti-cancer agents,310–314 antibiotics,315 antiretrovirals316,317 and others,318–320 as well as for DNA and other biomolecules.321–324 A number of experimental studies focused on the drug-delivery potential of large, multi-walled CNTs (MWCNTs), in which molecules are typically less stable than in smaller diameter CNTs. MWCNTs filled with the anti-cancer drug carboplatin were effective in inhibiting the growth of bladder cancer cells whereas control, unfilled MWCNTs had barely any effect.325 MWCNTs loaded with another anti-cancer drug, oxaliplatin, and functionalized with PEG-600 showed delayed cytotoxicity in human colon adenocarcinoma cells compared to oxaliplatin alone.326 Diameter-dependent release was also highlighted; for cisplatin (CDDP) in smaller diameter MWCNTs enabled slower, more controlled release.327 As opposed to MWCNTs, SWCNTs have a smaller size and large aspect ratio favoring cell and tissue penetration. As such, efforts have also been deployed for the use of these carriers for drug delivery. Cisplatin (CDDP)-filled ultra-short (US) SWNTs wrapped with pluronic surfactant were found to cause enhanced cytotoxicity to different breast cancer cell lines as compared to both free cisplatin and empty US-SWNTs. In that case, release of CDDP is obtained through sidewall defects and openings as well as through nanotube ends, since the harsh shortening procedure reduces sidewall integrity in US-SWNTs. The addition of the pluronic surfactant hinders the early release of the cisplatin by wrapping over openings in the nanotube.328 A similar approach was employed while exploiting the enhanced permeability and retention (EPR) effect of tumorous tissues in in vivo breast cancer xenografts.329 Whilst encapsulated in US-SWNTs, cisplatin demonstrated longer circulation time compared to free cisplatin, which resulted in an increased accumulation at the tumor site.
Due to predicted improved biocompatibility,330 a number of theoretical studies also investigated the feasibility of encapsulation of various therapeutic compounds in boron nitride nanotubes. For example, it was shown that the encapsulation of caffeine into (14,0) BNNTs is unfavourable due to its rigid molecular structure and to repulsive Coulombic nitrogen–nitrogen interactions between the BNNT and caffeine. However, dopamine is readily encapsulated.331 The most probable physisorption site for carboplatin was calculated to be inside the BNNT cavity, with the surrounding water molecules not affecting the encapsulated carboplatin.332 Similarly, the anti-cancer drug, gemcitabine (GMC) tend to locate inside (18,0) BNNTs. In that particular case, the release of the drug was activated using heterofullerene (C48B12) as a replacing agent. GMC was released from the nanotube upon encapsulation of C48B12 due to stronger van der Waals interactions stabilizing the C48B12/BNNT system.333 The feasibility of drug delivery with large diameter BNNTs were also used to deliver curcumin, which, upon release, decreased the level of inflammatory markers in activated microglia, indicating that the loaded curcumin was protected from degradation and retained its biological activity.242
Encapsulation of organic dyes in small diameter BNNTs can thus template aggregation of organic dyes, unlocking their use as PL contrast agents down to the NIR. Similarly, encapsulation of dyes in SWCNTs produces a complementary optical signature based on Raman scattering, suited for distinct bio-imaging applications. The inner cavity is also attractive for drug loading, allowing delayed, more precise delivery. In all cases, the nanotube provides two-fold protection whilst facilitating chemical processing and functionalization. The obtained nano-hybrids are stable and robust, with easily modulated and diversified prospective applications due to a multitude of molecules and dyes that can be readily encapsulated.
6.2. Thin films with fluorescence anisotropy based on Mol@BNNTs
Due to their intrinsic polarized optical properties, carbon nanotubes have been used since decades for inducing optical anisotropy in nematic liquid or thin films for VIS to THz applications.334–337 Nanotubes host template is also a promising materials for aligning molecules and achieving strong polarization effect at the nanoscale. For example, Gaufrès et al. reported highly polarized Raman scattering pattern of confined molecules inside individual SWCNT has been reported.22 Jakubek et al. has also reported on the fluorescence of polymers, such as rra-P3HT, wrap along the outer wall of BNNTs and showed that the emission is polarized and useful for quality assessment of the BNNT itself.338,339The fluorescence polarization properties of an elongated dye molecule, α-sexithiophene (6T), encapsulated inside a BNNT (6T@BNNT) has also been recently explored.340 Aberration-corrected High Resolution Transmission Electronic Microscopy (ac-HRTEM) and high-resolution fluorescence imaging of many individual 6T@BNNTs show evidence of remarkably well-aligned molecules along the BNNT axis for inner diameter below 3 nm. The optical results also establish that these individual 6T@BNNTs emit highly polarized fluorescence. (Fig. 30).
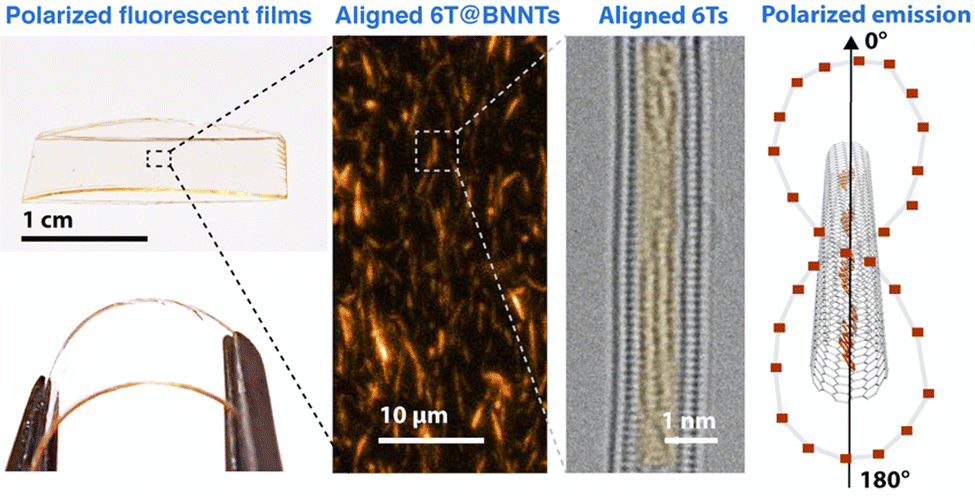 | ||
| Fig. 30 Polarized fluorescent and transparent films based on aligned 6T emitters inside assemblies of aligned boron nitride nanotubes. Reproduced from ref. 340. | ||
At the same time, the BNNT can be easily oriented within a flexible and transparent matrix by stretching. For example, stretched matrix made of PMMA loaded with dispersed and aligned 6T@BNNTs display strong fluorescence anisotropy with an enhanced anisotropy factor ( , where with G, the optical factor correction of the set-up (G = 1.12), (I0–0, I0–90) and the normalized intensity of the fluorescence, parallelly polarized with respect to the incident polarization, respectively) with an anisotropy enhancement factor of 2,7 between the stretched and unstretched film. (Fig. 31). These results clearly evidence that the BNNTs structure acts, because of their ratio aspect, as a powerful 1D template for aligning organic molecules from the nano to the macroscopic scales.
 | ||
| Fig. 31 Polarized fluorescence from transparent thin films based on 6T@BNNT and PMMA. (a) Image of a centimetre wide PMMA films before and after stretching (left and right). (b) Partial rendering of a ‘z-stack’ of a PMMA-6T@BNNT film acquired with confocal fluorescence microscopy, in a 40 μm × 40 μm × 30 μm volume. (c) Z-projection of the stretched and unstretched film datacubes. (d) Normalized fluorescence intensity recorded from the film, when unstretched and stretched, for different parallel, orthogonal and crossed polarization conditions of the excitation and collection, as highlighted by green and orange arrows, respectively. Inset: Anisotropy factor for the unstretched (left) and stretched sample (right) estimated from the data presented in the same panel. (e) Polar representation of the 6T@BNNT percentage as a function of the deviation angle from the direction of stretch (0°). Reproduced from ref. 340. | ||
6.3. Dyes@NT for photovoltaic
For photovoltaics the goal of sensitization with chromophores, be that organic dyes16,211,231,390–392 porphyrins and phtalocyanine derivatives,352,375–377 polyoxometalates393 or azobenzene complexes,391 has always been to improve light absorption and thereby the photocurrent of a device. CNT-based devices are no different. Ideally, photosensitization is performed with a chromophore located in the spectral range where the CNTs have a low extinction coefficient.231 In fact, sensitization is not expected to be beneficial in all cases. For example, in Si:CNT heterojunctions, where an ultrathin nanotube mat is placed in interaction on a silicon substrate, incident solar radiation mostly passes through the nanotube mat and is absorbed by the silicon, creating electron–hole pairs that diffuse to a depletion region set up at the carbon CNT:silicon interface.341,342 In this architecture the CNTs are generally assumed not to contribute to the photocurrent394–396 but rather act as an efficient hole transport layer where a balance between low sheet resistance and high optical transparency is important.397–400 Here, sensitization of the CNT layer would only serve to reduce the amount of light reaching the silicon substrate by reducing the transmittance of the CNT film and introduce scattering sites at the CNT:Si interface. A similar argument can be made for dye sensitized solar cells, where CNTs are also commonly used as transparent conducting electrodes and where exciton dissociation occurs entirely at a dye/TiO2 interface. In a CNT:Si heterojunctions small but measurable photocurrent contribution from the nanotubes was inferred using transient absorption spectroscopy.401 Endohedral sensitization may be a convenient avenue to further study this contribution without degrading the CNT:Si interface. However, because most potential fillers absorb in the visible range, where excitons are already formed efficiently in silicon, any gains to the photocurrent are expected to be modest at best and would need to be balanced against a reduced absorption in the silicon. It is more likely that Si:CNT heterojunctions and dye sensitized solar cells will benefit from endohedral doping of the CNTs with molecules like tetrathiafulvalene (TTF), tetracyanoquinodimethane (TCNQ)402,403 and fullerenes404–406 which afford the opportunity to alter the band gap energies407,408 or carrier concentration402 of the CNTs.409
In chromophore-sensitized SWCNT photovoltaics, the CNT is expected to take one of two roles: as a conductive conduit to improve the transport of charge carriers in existing light harvesting stacks, such that energy, hole or electron transfer from the chromophore is primarily driven by its contact to other organic molecules (Fig. 32a) or as a donor or acceptor in the photoactive layer, contributing to the photocurrent and sensitization is used to spectrally extend the absorption of the SWCNTs (Fig. 32b). In the first case, intimate contact between the chromophore and a third material is necessary, reducing the appropriateness of endohedral vs. exohedral functionalization. However, in the second case, endohedral filling is clearly advantageous because it isolates the sensitizer from the donor/acceptor pair necessary for nanotube exciton dissociation, thereby reducing charge trapping and scattering at the heterojunction interface and ensuring high efficiency. To date, despite the extensive spectroscopic studies discussed previously, the number of photovoltaic devices containing SWCNTs that are modified with chromophores, including devices where the measured photocurrent is the sum of both the nanotube's and the chromophore's absorption and devices containing endohedrally-modified SWCNTs, is limited.
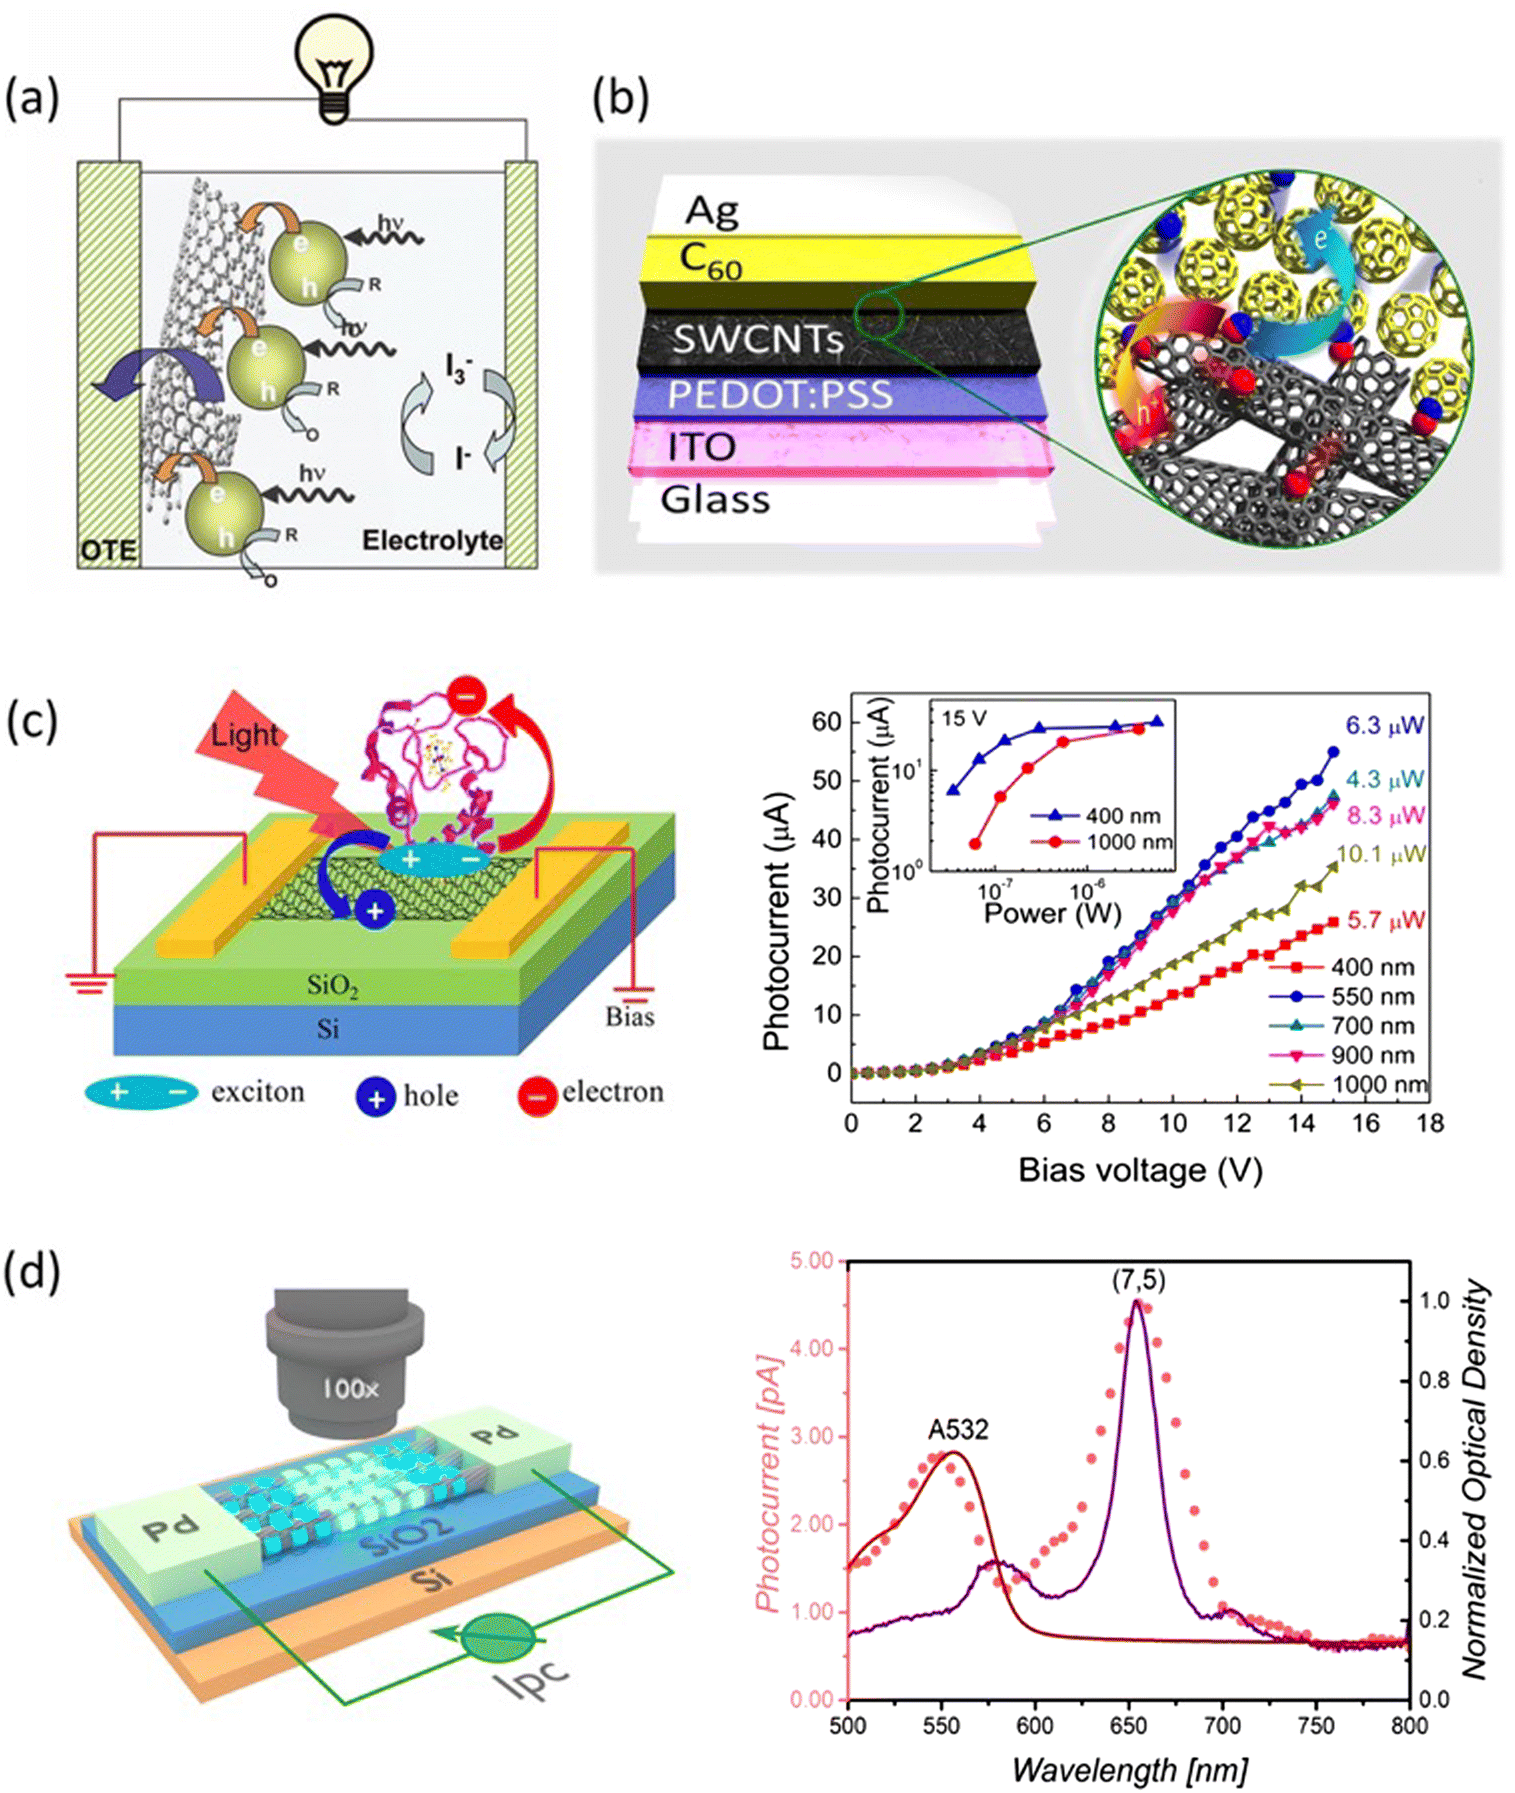 | ||
| Fig. 32 Strategies to employ chromophore modified carbon nanotubes: (a) in a photoelectrochemical cell by excitation of light harvesting assemblies anchored to the nanotubes, panel reproduced with permission from Kamat et al., Nano Today 2006, 1(4), Copyright © 2006 Elsevier, ref. 410 or (b) as a donor or acceptor in the photoactive layer, where dye modification enhances light absorption. Panel reproduced with permission from Pfohl et al. Adv. Energy Mater. 2016, 6(1), 1501345 © 2015 Wiley-VCH, ref. 372 (c) broad band light detection, as shown with permission from Gong et al., Acs Appl. Mater. Interfaces 2017, 9(12), 11016–11024, Copyright 2017 American Chemical Society.411 and (d) the measurement of photocurrent from dye-modified (A532) (7,5) SWCNTs in the work of Alam et al.390 | ||
Early experiments on SWCNT/chromophore hybrids were still performed on as-grown SWCNTs composed of a broad distribution of semiconducting and metallic species.345,377 SWCNTs were dispersed with conjugated diazo dyes such as congo red and trypan blue,350 and pyrene and its derivatives,352,376,377,412 poly(phenyleneethynylene)385 and N-(1-pyrenyl)maleimide.413 At this early stage of development, photoelectrochemical devices were a convenient proof of principle. SWCNTs dispersed by charged pyrenes were particularly attractive because they facilitated the subsequent electrostatic functionalization with charged porphyrins and phthalocyanines.382–384 Usually, photoelectrochemical cells are made in a layer by layer approach on ITO electrodes.414 A single layer of SWCNT/Pyrene+/ZnP8− lead to monochromatic incident photon-to-charge-carrier (IPCE) of 4.2% whereas multilayers reached 8.5%.377,415 Subsequent works have shown the efficiency of nanotube functionalization to improve dramatically the film photocurrents. Py/SWNT films incorporating metal-free (H2Pc) and zinc phthalocyanines (ZnPc) chemically modified with a pyrene linker had stable and reproducible photocurrents with IPCE values as large as 15 and 23%, respectively without and with an applied bias of +0.1 V.352 Likewise, SWCNTs functionalized with 4-(trimethylsilyl)ethynylaniline to which a ZnPc derivative bearing an azide group was attached reached IPCE values of 17.3%, which was 30% larger than for SWCNTs alone.218 In related work, electrodes fabricated from SWCNTs covalently sensitised with commercially available N3 dye ((cis-bis(4,4)-dicarboxyl-2,2-bipyridine) dithiocyanato ruthenium(II)) showed a modest photoresponse.415 In all cases, the carbon nanotubes were assumed not to contribute to the photocurrent but played the role of electron acceptors. Because of the energetic position of the ITO conduction band, a thermodynamically driven electron transfer from the reduced SWCNT is favoured. The redox couple in the electrolyte was responsible for regenerating the oxidized porphyrins or phthalocyanines.
The first single layer organic photovoltaic devices containing CNTs were metal/insulator/metal (MIM) devices and quickly combined with chromophores. In pioneering work, Kymakis et al.363 interfaced SWCNTs with the polymer P3OT in a layer stack consisting of ITO/P3OT/P3OT-SWCNTs/Al. The interaction of the polymer with the CNTs allowed for charge separation of the photogenerated carriers in the polymer and efficient electron transport through the CNTs.
In light of the large exciton binding energies of 0.3–1 eV416–418 for semiconducting SWCNTs, the strong exciton quenching ability of metallic nanotubes,389 and the possibility of bundled SWCNTs to lead to charge trapping between the different bandgap species,388 it is unsurprising that these early devices, which used unsorted CNTs, failed to measure any discernible photocurrent from the nanotubes themselves. However, since then, the efficacy at which CNTs can be processed and sorted according to their structure,419–423 has come a long way.424 Highly selective separation techniques have been developed and it is now possible to fabricate devices from type-selective SWCNTs.197,425–433
Capitalizing on these sorting techniques, SWCNTs wrapped with PFO were mixed with different electron and hole acceptor compounds such as C60, [6,6]-phenyl C61 butyric acid methyl ester (PC61BM) or poly(3-hexylthiophene) (P3HT) to form a type-II heterojunctions with sufficient energetic offset to induce the dissociation of excitons from the nanotubes and generate photocurrent.386 Power conversion efficiencies of 1% with C60 and 3% with PC71BM were achieved based on this approach.374,389 For the first time external quantum efficiency (EQE) measurements irrefutably correlated device photocurrent to the absorption of a nanotube film. Since these first reports the research teams around Strano,388 Bao,434,435 Blackburn,373,436 Flavel,372,387 Hersam389,437 and Brabec438 to name a few, have all worked on improving various aspects of similar devices but to date no-one has presented a chromophore-modified variant.
This lack of devices is mostly related to materials challenges in finding the correct combination of nanotube chirality/diameter, chromophore and acceptor/donor system. In the early work of Bindl et al. the authors also measured the internal quantum efficiency (IQE) of five different nanotubes (7,5), (7,6), (8,6), (8,7) and (9,7) at a SWCNT:C60 interface.196,386 They observed a reduction in IQE of 91% for (7,5), which is the smallest diameter of the five species, to below 30% for (9,7) which has the largest, and suggested that excitons from a CNT with a diameter of 1 nm or larger are no longer efficiently dissociated. This observation is associated with the requirement of a minimum energetic offset between the LUMO of the nanotube and that of its acceptor in order for efficient exciton dissociation to take place. When using C60 as an acceptor, a diameter limit of 0.95 nm, corresponding to the (8,6) SWCNT, was suggested.387 Marcus theory further showed that a LUMO offset of 130 meV is optimal, which is best satisfied for much smaller diameter (∼0.8 nm) species such as (8,3), (6,5) and (9,1) in combination with C60.436 The diameter-dependent bandgap of SWCNTs therefore imposes a specific selection of (n,m) species which match with the fixed LUMO band of the acceptor molecule. Large diameter SWCNTs (Dt ≈ 1.665 nm) can be used in combination with fullerene-based acceptors with high electron affinity.436 However, given that most research groups use commercially available acceptors and polymers to sort the CNTs, which are inherently selective to species below 1 nm, the available endohedral volume is far below that required for usual chromophore encapsulation, (1.4–2 nm).205,231,392 It is also important to consider that even if chromophores could be placed inside CNTs, most absorb light between 200–500 nm, which is a spectral region where C60, PC71BM, etc. already have a high extinction coefficient and thus any gains may be marginal. Furthermore, co-location of a chromophore inside a CNT does not guarantee a measurable photocurrent contribution. In fact, the 1D endohedral arrangement of coronenes resulted in an increase in the exciton binding energy no energy transfer to the CNT was observed.16 The only known example of dye/CNT/fullerene being assembled into an architecture similar to that used for solar cells involved a ferrocenyl dye inside a 1.4 nm diameter CNT, which was subsequently modified with a fullerodendron outside.392 Although the diameters of the CNTs were too large for a photocurrent to be measured from them, electron transfer from the dye to the C60 through an intermediate S22 band of the SWCNT was observed. This sparks interesting questions regarding the transparency of the carbon nanotube wall to charge carriers in combination with other organic layers CNT-FETs have been functionalized with chromophores as light sensors, optically activated switches, memories and to measure photocurrent.229,439–442 In these hybrid systems, photo-generated carriers are separated by either an externally applied gate bias or by internal fields at the Schottky barrier induced at the SWCNT-metal interface.371,390,391,440,442–450
The only known example of a device-integrated nanohybrid to extend the optical property of the CNT is a CNT-FET made exclusively from (7,5) nanotubes to which three different fluorescent dyes, ATTO 532, 565 and 610 were drop cast.390 With the aid of a photocurrent spectroscopy setup and a supercontinuum light source the authors had a much large incident photon flux and were able to show simultaneous photocurrent generation from the nanotube and dyes. Förster energy transfer was found to be responsible for the photocurrent, but the dye was significantly photobleached due to the light intensity used for measurement. Using endohedral functionalization could reduce this effect, leaving significant room for improvement in the future. Complementary review articles focusing on electronic and electro-chemistry application of filled CNTs can be found in ref. 18 and 451.
7. Looking forward
7.1. Perspectives
Strategies that leverage nanotubes as architectural scaffolds have diversified in the last decade to include a large array of 1D molecular assemblies of varied compositions and architectures. As reviewed here, a sizable spectrum of molecular organizations at the nanoscale have been prepared and tested. This field has developed new fascinating ways to engineer physical and chemical interactions between 1D hosts and molecules with potential groundbreaking applications in bio-imaging, light harvesting, photonics, to name a few. This review highlights, however, an impressive landscape of possible interactions between 0D/1D and 1D/1D optically actives nano-objects for nano-optoelectronics. The combination of intermolecular forces and electronic interactions has allowed to unravel, in the van der Waals, new regimes for efficient charge and energy transfer and other thermally activated processes in these 1D heterostructures. This is especially useful to actively tune the physical properties of the host nanotubes and optimize fluorescence quantum yields, charge transfer doping, or Fermi level alignment. On the other hand, the nanotubes provide a crystalline and chemically stable environment, which are effective media to stabilize 1D molecular aggregation that can lead to confinement and high ordering of molecules. The approach has offered examples of bright J-aggregation states and highly ordered dipolar organizations, which are of considerable interest for bio-imaging, none-linear optics, and other photonics applications. Further advances in complex encapsulation processes could provide access to an even wider library of assemblies, which can serve as building blocks for more complex and multifunctional 1D heterostructures. In particular, the possibility of combining semiconductors, metals, and optical emitters together at the nanoscale opens fascinating opportunities for shaping multifunctional materials and metamaterials. Mixed dimensionality heterostructures based on Mol@NT and 2D materials will also bring unprecedented degrees of freedom for designing complex materials build novel functionalities. As a result, technological functions could be improved and further miniaturized with, on the one hand, a smaller quantity of materials and lower costs, on the other hand, improved performance.As a platform for advanced nanochemistry, the nanotube-based 1D heterostructures are built around a nanocontainer that acts as a barrier against reactive chemicals and other environmental factors inducing degradation. Capitalizing on the robustness of the nanotube host, progress in achieving advanced synthesis inside the nanotube reactor shows exciting potential in chemical engineering, such as the formation and stabilization of exotic phases, isolation of unstable compounds and reactive materials that have hitherto been difficult to produce in ambient conditions. In addition, the synergistic properties of 1D heterostructures made solely of naturally abundant compounds, such as carbon, sulfur, and cheap metals (e.g. Fe), can develop into viable alternatives for key technologies where rare earths, precious metals, or toxic elements are still being used nowadays, albeit problematic societal acceptance and negative impact of their use on life and ecosystems.
7.2. Challenges
Effort towards developing more sophisticated 1D heterostructures faces multiple challenges from synthesis strategies to characterization. Indeed, combining nanotubes of different composition, diameters, and wall thickness with molecular species requires one to deal with multiple interactions and complex behaviors. Outer and inner wall functionalization has also to be considered to facilitate processing in batches and scaled-up production for subsequent use in technologies. Access to standardized nanotubes as starting materials is therefore paramount for 1D heterostructures adoption in applications. Despite the continuous progress in sorting of carbon nanotubes by chirality, diameter and length, the access of low cost and standardized quality of single chiralities of nanotubes remains an outstanding issue to be addressed. The supply challenge is exacerbated for the specific case of BNNTs, which come from suppliers as a complex mixture of diameters and wall thicknesses. Compared to the commercially available CNT, only few post-synthesis purification/sorting methods of BNNTs have been reported up to now. The large BNNT bandgap (∼5.5 eV) also makes the optical characterization of material's composition challenging to measure. Developing efficient techniques for sorting BNNTs by length, diameter and number of walls is therefore essential before one could reach better control over the optical properties of the BNNT-based heterostructures.To take full advantage of Mol@NTs capabilities, it will be essential to control the molecular encapsulation process into the nanotubes. (Note that comparative description of encapsulation methods and characterization techniques for Mol@NT systems is available in the ESI.†) Considering the impact on properties, methods that can position and tailor the interaction between similar or different molecules inside and outside the nanotubes are to be searched for. Scheme to drive 1D assemblies along the nanotube axis will also need to be developed in the future. A thorough understanding of the elementary mechanisms behind the encapsulation/adsorption of molecules during encapsulation will help reach a quasi-deterministic control of the entry and diffusion of molecules along the nanotube wall. The specific architecture of the nanotube template represents a strongly anisotropic and complex nanoporous system. The adsorption and diffusion mechanisms of molecules and their aggregates inside/outside the nanotubes are still not fully understood. The impact of the encapsulation intermediates, such as organic solvents and of the presence functional groups naturally grafted at the defective ends of the nanotubes are likely to change significantly the thermodynamic map of the elementary adsorption events. In addition, future work will need to disentangle the roles of phonons, strains, dielectric screening, and aggregation effects on the optoelectronic properties of the 1D heterostructures.
Therefore, a long and exciting way remains before we fully master the synthesis and properties of 1D heterostructures. These challenges call for innovative experiments and theoretical studies to gain further insight into molecular diffusion inside confined spaces and into new opportunities in surface science topics related to 1D templating and high confinement.
Data availability
No primary research results, software or code have been included and no new data were generated or analysed as part of this review.Conflicts of interest
There are no conflicts to declare.References
- K. Egeblad, C. H. Christensen, M. Kustova and C. H. Christensen, Templating Mesoporous Zeolites, Chem. Mater., 2008, 20(3), 946–960, DOI:10.1021/cm702224p.
- R. Haldar and C. Wöll, Hierarchical Assemblies of Molecular Frameworks—MOF-on-MOF Epitaxial Heterostructures, Nano Res., 2021, 14(2), 355–368, DOI:10.1007/s12274-020-2953-z.
- T.-Q. Nguyen, R. Martel, M. Bushey, P. Avouris, A. Carlsen, C. Nuckolls and L. Brus, Self-Assembly of 1-D Organic Semiconductor Nanostructures, Phys. Chem. Chem. Phys., 2007, 9(13), 1515–1532, 10.1039/B609956D.
- L. Jiang, H. Dong and W. Hu, Controlled Growth and Assembly of One-Dimensional Ordered Nanostructures of Organic Functional Materials, Soft Matter, 2011, 7(5), 1615–1630, 10.1039/C0SM00762E.
- S. Iijima, Helical Microtubules of Graphitic Carbon, Nature, 1991, 354(6348), 56–58, DOI:10.1038/354056a0.
- S. Cambré, M. Liu, D. Levshov, K. Otsuka, S. Maruyama and R. Xiang, Nanotube-Based 1D Heterostructures Coupled by van der Waals Forces, Small, 2021, 17(38), 2102585, DOI:10.1002/smll.202102585.
- J. W. G. Wilder, L. C. Venema, A. G. Rinzler, R. E. Smalley and C. Dekker, Electronic Structure of Atomically Resolved Carbon Nanotubes, Nature, 1998, 391(6662), 59–62, DOI:10.1038/34139.
- S. Qiu, K. Wu, B. Gao, L. Li, H. Jin and Q. Li, Solution-Processing of High-Purity Semiconducting Single-Walled Carbon Nanotubes for Electronics Devices, Adv. Mater., 2019, 31(9), 1800750, DOI:10.1002/adma.201800750.
- J. Ko and Y. Joo, Review of Sorted Metallic Single-Walled Carbon Nanotubes, Adv. Mater. Interfaces, 2021, 8(11), 2002106, DOI:10.1002/admi.202002106.
- F. Yang, M. Wang, D. Zhang, J. Yang, M. Zheng and Y. Li, Chirality Pure Carbon Nanotubes: Growth, Sorting, and Characterization, Chem. Rev., 2020, 120(5), 2693–2758, DOI:10.1021/acs.chemrev.9b00835.
- N. Solin, M. Koshino, T. Tanaka, S. Takenaga, H. Kataura, H. Isobe and E. Nakamura, Imaging of Aromatic Amide Molecules in Motion, Chem. Lett., 2007, 36(10), 1208–1209, DOI:10.1246/cl.2007.1208.
- T. Koyama, T. Tsunekawa, T. Saito, K. Asaka, Y. Saito, H. Kishida and A. Nakamura, Synthesis and Photophysics of Quaterrylene Molecules in Single-Walled Carbon Nanotubes: Excitation Energy Transfer between a Nanoscale Cylinder and Encapsulated Molecules, J. Phys. Chem. C, 2014, 118(37), 21671–21681, DOI:10.1021/jp506361b.
- Y. Almadori, L. Alvarez, R. Le Parc, R. Aznar, F. Fossard, A. Loiseau, B. Jousselme, S. Campidelli, P. Hermet, A. Belhboub, A. Rahmani, T. Saito and J.-L. Bantignies, Chromophore Ordering by Confinement into Carbon Nanotubes, J. Phys. Chem. C, 2014, 118(33), 19462–19468, DOI:10.1021/jp505804d.
- M. A. Loi, J. Gao, F. Cordella, P. Blondeau, E. Menna, B. Bártová, C. Hébert, S. Lazar, G. A. Botton, M. Milko and C. Ambrosch-Draxl, Encapsulation of Conjugated Oligomers in Single-Walled Carbon Nanotubes: Towards Nanohybrids for Photonic Devices, Adv. Mater., 2010, 22(14), 1635–1639, DOI:10.1002/adma.200903527.
- T. W. Chamberlain, J. Biskupek, S. T. Skowron, P. A. Bayliss, E. Bichoutskaia, U. Kaiser and A. N. Khlobystov, Isotope Substitution Extends the Lifetime of Organic Molecules in Transmission Electron Microscopy, Small, 2015, 11(5), 622–629, DOI:10.1002/smll.201402081.
- T. Okazaki, Y. Iizumi, S. Okubo, H. Kataura, Z. Liu, K. Suenaga, Y. Tahara, M. Yudasaka, S. Okada and S. Iijima, Coaxially Stacked Coronene Columns inside Single-Walled Carbon Nanotubes, Angew. Chem., Int. Ed., 2011, 50(21), 4853–4857, DOI:10.1002/anie.201007832.
- M. Monthioux, E. Flahaut and J.-P. Cleuziou, Hybrid Carbon Nanotubes: Strategy, Progress, and Perspectives, J. Mater. Res., 2006, 21(11), 2774–2793, DOI:10.1557/jmr.2006.0366.
- J. W. Jordan, W. J. V. Townsend, L. R. Johnson, D. A. Walsh, G. N. Newton and A. N. Khlobystov, Electrochemistry of Redox-Active Molecules Confined within Narrow Carbon Nanotubes, Chem. Soc. Rev., 2021, 50(19), 10895–10916, 10.1039/D1CS00478F.
- M. Smith, C60 Encapsulation inside Carbon Nanotubes, Nature, 1998, 396(6709), 323, DOI:10.1038/24519.
- I. Cardillo-Zallo, J. Biskupek, S. Bloodworth, E. S. Marsden, M. W. Fay, Q. M. Ramasse, G. A. Rance, C. T. Stoppiello, W. J. Cull, B. L. Weare, R. J. Whitby, U. Kaiser, P. D. Brown and A. N. Khlobystov, Atomic-Scale Time-Resolved Imaging of Krypton Dimers, Chains and Transition to a One-Dimensional Gas, ACS Nano, 2024, 18(4), 2958–2971, DOI:10.1021/acsnano.3c07853.
- A. V. Talyzin, I. V. Anoshkin, A. V. Krasheninnikov, R. M. Nieminen, A. G. Nasibulin, H. Jiang and E. I. Kauppinen, Synthesis of Graphene Nanoribbons Encapsulated in Single-Walled Carbon Nanotubes, Nano Lett., 2011, 11(10), 4352–4356, DOI:10.1021/nl2024678.
- E. Gaufrès, N. Y.-W. Tang, F. Lapointe, J. Cabana, M.-A. Nadon, N. Cottenye, F. Raymond, T. Szkopek and R. Martel, Giant Raman Scattering from J-Aggregated Dyes inside Carbon Nanotubes for Multispectral Imaging, Nat. Photonics, 2014, 8(1), 72–78, DOI:10.1038/nphoton.2013.309.
- E. Gaufrès, N. Y. W. Tang, F. Lapointe, J. Cabana, M. A. Nadon, N. Cottenye, F. Raymond, T. Szkopek and R. Martel, Giant Raman Scattering from J-Aggregated Dyes inside Carbon Nanotubes for Multispectral Imaging, Nat. Photonics, 2014, 8(1), 72–78, DOI:10.1038/nphoton.2013.309.
- L. Alvarez, F. Fall, A. Belhboub, R. Le Parc, Y. Almadori, R. Arenal, R. Aznar, P. Dieudonné-George, P. Hermet, A. Rahmani, B. Jousselme, S. Campidelli, J. Cambedouzou, T. Saito and J.-L. Bantignies, One-Dimensional Molecular Crystal of Phthalocyanine Confined into Single-Walled Carbon Nanotubes, J. Phys. Chem. C, 2015, 119(9), 5203–5210, DOI:10.1021/acs.jpcc.5b00168.
- T. Yumura and H. Yamashita, Key Factors in Determining the Arrangement of π-Conjugated Oligomers inside Carbon Nanotubes, Phys. Chem. Chem. Phys., 2015, 17(35), 22668–22677, 10.1039/C5CP03433G.
- H. Yamashita and T. Yumura, The Role of Weak Bonding in Determining the Structure of Thiophene Oligomers inside Carbon Nanotubes, J. Phys. Chem. C, 2012, 116(17), 9681–9690, DOI:10.1021/jp301972e.
- T. Yumura and W. Yamamoto, Kinetic Control in the Alignment of Polar π-Conjugated Molecules inside Carbon Nanotubes, J. Phys. Chem. C, 2018, 122(31), 18151–18160, DOI:10.1021/acs.jpcc.8b05455.
- J. Jiang, S. I. Sandler and B. Smit, Capillary Phase Transitions of n-Alkanes in a Carbon Nanotube, Nano Lett., 2004, 4(2), 241–244, DOI:10.1021/nl034961y.
- Z. J. Jakubek and B. Simard, Two Confined Phases of Argon Adsorbed Inside Open Single Walled Carbon Nanotubes, Langmuir, 2004, 20(14), 5940–5945, DOI:10.1021/la0358872.
- E. Gaufrès, N. Y.-W. Tang, A. Favron, C. Allard, F. Lapointe, V. Jourdain, S. Tahir, C.-N. Brosseau, R. Leonelli and R. Martel, Aggregation Control of α-Sexithiophene via Isothermal Encapsulation Inside Single-Walled Carbon Nanotubes, ACS Nano, 2016, 10(11), 10220–10226, DOI:10.1021/acsnano.6b05660.
- W. Orellana and S. O. Vásquez, Endohedral Terthiophene in Zigzag Carbon Nanotubes: Density Functional Calculations, Phys. Rev. B: Condens. Matter Mater. Phys., 2006, 74(12), 125419, DOI:10.1103/PhysRevB.74.125419.
- M. J. O’Connell, Band Gap Fluorescence from Individual Single-Walled Carbon Nanotubes, Science, 2002, 297(5581), 593–596, DOI:10.1126/science.1072631.
- R. K. Wang, W.-C. Chen, D. K. Campos and K. J. Ziegler, Swelling the Micelle Core Surrounding Single-Walled Carbon Nanotubes with Water-Immiscible Organic Solvents, J. Am. Chem. Soc., 2008, 130(48), 16330–16337, DOI:10.1021/ja806586v.
- C. Roquelet, J.-S. Lauret, V. Alain-Rizzo, C. Voisin, R. Fleurier, M. Delarue, D. Garrot, A. Loiseau, P. Roussignol, J. A. Delaire and E. Deleporte, Π-Stacking Functionalization of Carbon Nanotubes through Micelle Swelling, Chem. Phys. Chem., 2010, 11(8), 1667–1672, DOI:10.1002/cphc.201000067.
- F. Vialla, G. Delport, Y. Chassagneux, P. H. Roussignol, J. S. Lauret and C. Voisin, Diameter-Selective Non-Covalent Functionalization of Carbon Nanotubes with Porphyrin Monomers, Nanoscale, 2016, 8(4), 2326–2332, 10.1039/C5NR08023A.
- G. Delport, L. Orcin-Chaix, S. Campidelli, C. Voisin and J.-S. Lauret, Controlling the Kinetics of the Non-Covalent Functionalization of Carbon Nanotubes Using Sub-Cmc Dilutions in a Co-Surfactant Environment, Nanoscale, 2017, 9(7), 2646–2651, 10.1039/C6NR08942A.
- G. Delport, F. Vialla, C. Roquelet, S. Campidelli, C. Voisin and J.-S. Lauret, Davydov Splitting and Self-Organization in a Porphyrin Layer Noncovalently Attached to Single Wall Carbon Nanotubes, Nano Lett., 2017, 17(11), 6778–6782, DOI:10.1021/acs.nanolett.7b02996.
- G. Clavé, G. Delport, C. Roquelet, J.-S. Lauret, E. Deleporte, F. Vialla, B. Langlois, R. Parret, C. Voisin, P. Roussignol, B. Jousselme, A. Gloter, O. Stephan, A. Filoramo, V. Derycke and S. Campidelli, Functionalization of Carbon Nanotubes through Polymerization in Micelles: A Bridge between the Covalent and Noncovalent Methods, Chem. Mater., 2013, 25(13), 2700–2707, DOI:10.1021/cm401312v.
- R. M. Pallares, X. Su, S. H. Lim and N. T. K. Thanh, Fine-Tuning of Gold Nanorod Dimensions and Plasmonic Properties Using the Hofmeister Effects, J. Mater. Chem. C, 2016, 4(1), 53–61, 10.1039/C5TC02426A.
- Y. Tsutsumi, T. Fujigaya and N. Nakashima, Polymer Synthesis inside a Nanospace of a Surfactant–Micelle on Carbon Nanotubes: Creation of Highly-Stable Individual Nanotubes/Ultrathin Cross-Linked Polymer Hybrids, RSC Adv., 2014, 4(12), 6318, 10.1039/c3ra46841k.
- M. C. Gordillo and J. Martí, Hydrogen Bond Structure of Liquid Water Confined in Nanotubes, Chem. Phys. Lett., 2000, 329(5), 341–345, DOI:10.1016/S0009-2614(00)01032-0.
- G. Hummer, J. C. Rasaiah and J. P. Noworyta, Water Conduction through the Hydrophobic Channel of a Carbon Nanotube, Nature, 2001, 414(6860), 188–190, DOI:10.1038/35102535.
- C. Dellago, M. M. Naor and G. Hummer, Proton Transport through Water-Filled Carbon Nanotubes, Phys. Rev. Lett., 2003, 90(10), 105902, DOI:10.1103/PhysRevLett.90.105902.
- S. Faucher, N. Aluru, M. Z. Bazant, D. Blankschtein, A. H. Brozena, J. Cumings, J. Pedro de Souza, M. Elimelech, R. Epsztein, J. T. Fourkas, A. G. Rajan, H. J. Kulik, A. Levy, A. Majumdar, C. Martin, M. McEldrew, R. P. Misra, A. Noy, T. A. Pham, M. Reed, E. Schwegler, Z. Siwy, Y. Wang and M. Strano, Critical Knowledge Gaps in Mass Transport through Single-Digit Nanopores: A Review and Perspective, J. Phys. Chem. C, 2019, 123(35), 21309–21326, DOI:10.1021/acs.jpcc.9b02178.
- K. Koga, G. T. Gao, H. Tanaka and X. C. Zeng, Formation of Ordered Ice Nanotubes inside Carbon Nanotubes, Nature, 2001, 412(6849), 802–805, DOI:10.1038/35090532.
- J. Wang, Y. Zhu, J. Zhou and X.-H. Lu, Diameter and Helicity Effects on Static Properties of Water Molecules Confined in Carbon Nanotubes, Phys. Chem. Chem. Phys., 2004, 6(4), 829–835, 10.1039/B313307A.
- D. Takaiwa, I. Hatano, K. Koga and H. Tanaka, Phase Diagram of Water in Carbon Nanotubes, Proc. Natl. Acad. Sci., 2008, 105(1), 39–43, DOI:10.1073/pnas.0707917105.
- S. Shimizu, K. V. Agrawal, M. O’Mahony, L. W. Drahushuk, N. Manohar, A. S. Myerson and M. S. Strano, Understanding and Analyzing Freezing-Point Transitions of Confined Fluids within Nanopores, Langmuir, 2015, 31(37), 10113–10118, DOI:10.1021/acs.langmuir.5b02149.
- A. Alexiadis and S. Kassinos, Molecular Simulation of Water in Carbon Nanotubes, Chem. Rev., 2008, 108(12), 5014–5034, DOI:10.1021/cr078140f.
- J. K. Holt, H. G. Park, Y. Wang, M. Stadermann, A. B. Artyukhin, C. P. Grigoropoulos, A. Noy and O. Bakajin, Fast Mass Transport Through Sub-2-Nanometer Carbon Nanotubes, Science, 2006, 312(5776), 1034–1037, DOI:10.1126/science.1126298.
- Y. Maniwa, K. Matsuda, H. Kyakuno, S. Ogasawara, T. Hibi, H. Kadowaki, S. Suzuki, Y. Achiba and H. Kataura, Water-Filled Single-Wall Carbon Nanotubes as Molecular Nanovalves, Nat. Mater., 2007, 6, 135 CrossRef PubMed.
- W. Choi, Z. W. Ulissi, S. F. E. Shimizu, D. O. Bellisario, M. D. Ellison and M. S. Strano, Diameter-Dependent Ion Transport through the Interior of Isolated Single-Walled Carbon Nanotubes, Nat. Commun., 2013, 4, 2397, DOI:10.1038/ncomms3397.
- B. Corry, Water and Ion Transport through Functionalised Carbon Nanotubes: Implications for Desalination Technology, Energy Environ. Sci., 2011, 4, 751–759, 10.1039/c0ee00481b.
- K. Matsuda, T. Hibi, H. Kadowaki, H. Kataura and Y. Maniwa, Water Dynamics inside Single-Wall Carbon Nanotubes: NMR Observations, Phys. Rev. B: Condens. Matter Mater. Phys., 2006, 74(7), 73415, DOI:10.1103/PhysRevB.74.073415.
- W. Sekhaneh, M. Kotecha, U. Dettlaff-Weglikowska and W. S. Veeman, High Resolution NMR of Water Absorbed in Single-Wall Carbon Nanotubes, Chem. Phys. Lett., 2006, 428(1), 143–147, DOI:10.1016/j.cplett.2006.06.105.
- J. Hassan, G. Diamantopoulos, L. Gkoura, M. Karagianni, S. Alhassan, S. V. Kumar, M. S. Katsiotis, T. Karagiannis, M. Fardis, N. Panopoulos, H. J. Kim, M. Beazi-Katsioti and G. Papavassiliou, Ultrafast Stratified Diffusion of Water Inside Carbon Nanotubes; Direct Experimental Evidence with 2D D–T2 NMR Spectroscopy, J. Phys. Chem. C, 2018, 122(19), 10600–10606, DOI:10.1021/acs.jpcc.8b01377.
- Y. Maniwa, H. Kataura, M. Abe, A. Udaka, S. Suzuki, Y. Achiba, H. Kira, K. Matsuda, H. Kadowaki and Y. Okabe, Ordered Water inside Carbon Nanotubes: Formation of Pentagonal to Octagonal Ice-Nanotubes, Chem. Phys. Lett., 2005, 401(4), 534–538, DOI:10.1016/j.cplett.2004.11.112.
- Y. Maniwa, H. Kataura, M. Abe, S. Suzuki, Y. Achiba, H. Kira and K. Matsuda, Phase Transition in Confined Water Inside Carbon Nanotubes, J. Phys. Soc. Jpn., 2002, 71(12), 2863–2866, DOI:10.1143/JPSJ.71.2863.
- E. Paineau, P.-A. Albouy, S. Rouzière, A. Orecchini, S. Rols and P. Launois, X-Ray Scattering Determination of the Structure of Water during Carbon Nanotube Filling, Nano Lett., 2013, 13(4), 1751–1756, DOI:10.1021/nl400331p.
- O. Byl, J.-C. Liu, Y. Wang, W.-L. Yim, J. K. Johnson and J. T. Yates, Unusual Hydrogen Bonding in Water-Filled Carbon Nanotubes, J. Am. Chem. Soc., 2006, 128(37), 12090–12097, DOI:10.1021/ja057856u.
- S. Dalla Bernardina, E. Paineau, J.-B. Brubach, P. Judeinstein, S. Rouzière, P. Launois and P. Roy, Water in Carbon Nanotubes: The Peculiar Hydrogen Bond Network Revealed by Infrared Spectroscopy, J. Am. Chem. Soc., 2016, 138(33), 10437–10443, DOI:10.1021/jacs.6b02635.
- A. I. Kolesnikov, J.-M. Zanotti, C.-K. Loong, P. Thiyagarajan, A. P. Moravsky, R. O. Loutfy and C. J. Burnham, Anomalously Soft Dynamics of Water in a Nanotube: A Revelation of Nanoscale Confinement, Phys. Rev. Lett., 2004, 93(3), 35503, DOI:10.1103/PhysRevLett.93.035503.
- G. Briganti, G. Rogati, A. Parmentier, M. Maccarini and F. De Luca, Neutron Scattering Observation of Quasi-Free Rotations of Water Confined in Carbon Nanotubes, Sci. Rep., 2017, 7, 45021 CrossRef CAS PubMed.
- W. Wenseleers, S. Cambré, J. Čulin, A. Bouwen and E. Goovaerts, Effect of Water Filling on the Electronic and Vibrational Resonances of Carbon Nanotubes: Characterizing Tube Opening by Raman Spectroscopy, Adv. Mater., 2007, 19(17), 2274–2278, DOI:10.1002/adma.200700773.
- M. F. Islam, E. Rojas, D. M. Bergey, A. T. Johnson and A. G. Yodh, High Weight Fraction Surfactant Solubilization of Single-Wall Carbon Nanotubes in Water, Nano Lett., 2003, 3(2), 269–273, DOI:10.1021/nl025924u.
- M. J. O’Connell, S. H. Bachilo, C. B. Huffman, V. C. Moore, M. S. Strano, E. H. Haroz, K. L. Rialon, P. J. Boul, W. H. Noon, C. Kittrell, J. Ma, R. H. Hauge, R. B. Weisman and R. E. Smalley, Band Gap Fluorescence from Individual Single-Walled Carbon Nanotubes, Science, 2002, 297(5581), 593–596, DOI:10.1126/science.1072631.
- W. Wenseleers, I. L. Vlasov, E. Goovaerts, E. D. Obraztsova, A. S. Lobach and A. Bouwen, Efficient Isolation and Solubilization of Pristine Single-Walled Nanotubes in Bile Salt Micelles, Adv. Funct. Mater., 2004, 14(11), 1105–1112, DOI:10.1002/adfm.200400130.
- S. Cambré and W. Wenseleers, Separation and Diameter-Sorting of Empty (End-Capped) and Water-Filled (Open) Carbon Nanotubes by Density Gradient Ultracentrifugation, Angew. Chem., Int. Ed., 2011, 50(12), 2764–2768, DOI:10.1002/anie.201007324.
- J. A. Fagan, J. Y. Huh, J. R. Simpson, J. L. Blackburn, J. M. Holt, B. A. Larsen and A. R. H. Walker, Separation of Empty and Water-Filled Single-Wall Carbon Nanotubes, ACS Nano, 2011, 5(5), 3943–3953, DOI:10.1021/nn200458t.
- S. Cambré, S. M. Santos, W. Wenseleers, A. R. T. Nugraha, R. Saito, L. Cognet and B. Lounis, Luminescence Properties of Individual Empty and Water-Filled Single-Walled Carbon Nanotubes, ACS Nano, 2012, 6(3), 2649–2655, DOI:10.1021/nn300035y.
- S. Chiashi, T. Hanashima, R. Mitobe, K. Nagatsu, T. Yamamoto and Y. Homma, Water Encapsulation Control in Individual Single-Walled Carbon Nanotubes by Laser Irradiation, J. Phys. Chem. Lett., 2014, 5(3), 408–412, DOI:10.1021/jz402540v.
- S. Faucher, M. Kuehne, V. B. Koman, N. Northrup, D. Kozawa, Z. Yuan, S. X. Li, Y. Zeng, T. Ichihara, R. P. Misra, N. Aluru, D. Blankschtein and M. S. Strano, Diameter Dependence of Water Filling in Lithographically Segmented Isolated Carbon Nanotubes, ACS Nano, 2021, 15(2), 2778–2790, DOI:10.1021/acsnano.0c08634.
- A. C. Torres-Dias, S. Cambré, W. Wenseleers, D. Machon and A. San-Miguel, Chirality-Dependent Mechanical Response of Empty and Water-Filled Single-Wall Carbon Nanotubes at High Pressure, Carbon, 2015, 95, 442–451, DOI:10.1016/j.carbon.2015.08.032.
- J. Campo, S. Cambré, B. Botka, J. Obrzut, W. Wenseleers and J. A. Fagan, Optical Property Tuning of Single-Wall Carbon Nanotubes by Endohedral Encapsulation of a Wide Variety of Dielectric Molecules, ACS Nano, 2021, 15(2), 2301–2317, DOI:10.1021/acsnano.0c08352.
- H. Kyakuno, K. Matsuda, H. Yahiro, Y. Inami, T. Fukuoka, Y. Miyata, K. Yanagi, Y. Maniwa, H. Kataura, T. Saito, M. Yumura and S. Iijima, Confined Water inside Single-Walled Carbon Nanotubes: Global Phase Diagram and Effect of Finite Length, J. Chem. Phys., 2011, 134(24), 244501, DOI:10.1063/1.3593064.
- K. V. Agrawal, S. Shimizu, L. W. Drahushuk, D. Kilcoyne and M. S. Strano, Observation of Extreme Phase Transition Temperatures of Water Confined inside Isolated Carbon Nanotubes, Nat. Nanotechnol., 2017, 12, 267–273, DOI:10.1038/nnano.2016.254.
- X. Ma, S. Cambré, W. Wenseleers, S. K. Doorn and H. Htoon, Quasiphase Transition in a Single File of Water Molecules Encapsulated in (6,5) Carbon Nanotubes Observed by Temperature-Dependent Photoluminescence Spectroscopy, Phys. Rev. Lett., 2017, 118, 027402, DOI:10.1103/PhysRevLett.118.027402.
- S. Chiashi, Y. Saito, T. Kato, S. Konabe, S. Okada, T. Yamamoto and Y. Homma, Confinement Effect of Sub-Nanometer Difference on Melting Point of Ice-Nanotubes Measured by Photoluminescence Spectroscopy, ACS Nano, 2019, 13(2), 1177–1182, DOI:10.1021/acsnano.8b06041.
- S. Cambré, B. Schoeters, S. Luyckx, E. Goovaerts and W. Wenseleers, Experimental Observation of Single-File Water Filling of Thin Single-Wall Carbon Nanotubes down to Chiral Index (5,3, Phys. Rev. Lett., 2010, 104, 207401, DOI:10.1103/PhysRevLett.104.207401.
- M. K. Borg, D. A. Lockerby, K. Ritos and J. M. Reese, Multiscale Simulation of Water Flow through Laboratory-Scale Nanotube Membranes, J. Membr. Sci., 2018, 567, 115–126, DOI:10.1016/j.memsci.2018.08.049.
- J. Campo, Y. Piao, S. Lam, C. M. Stafford, J. K. Streit, J. R. Simpson, A. R. H. Walker and J. A. Fagan, Enhancing Single-Wall Carbon Nanotube Properties through Controlled Endohedral Filling, Nanoscale Horiz., 2016, 1(4), 317–324, 10.1039/C6NH00062B.
- J. A. Fagan, Aqueous Two-Polymer Phase Extraction of Single-Wall Carbon Nanotubes Using Surfactants, Nanoscale Adv., 2019, 1(9), 3307–3324, 10.1039/C9NA00280D.
- H. Li, G. Gordeev, O. Garrity, N. A. Peyyety, P. B. Selvasundaram, S. Dehm, R. Krupke, S. Cambré, W. Wenseleers, S. Reich, M. Zheng, J. A. Fagan and B. S. Flavel, Separation of Specific Single-Enantiomer Single-Wall Carbon Nanotubes in the Large-Diameter Regime, ACS Nano, 2020, 14(1), 948–963, DOI:10.1021/acsnano.9b08244.
- H. Qu, A. Rayabharam, X. Wu, P. Wang, Y. Li, J. Fagan, N. R. Aluru and Y. Wang, Selective Filling of N-Hexane in a Tight Nanopore, Nat. Commun., 2021, 12(1), 310, DOI:10.1038/s41467-020-20587-1.
- J. Streit, C. R. Snyder, J. Campo, M. Zheng, J. R. Simpson, A. R. Hight Walker and J. A. Fagan, Alkane Encapsulation Induces Strain in Small-Diameter Single-Wall Carbon Nanotubes, J. Phys. Chem. C, 2018, 122(21), 11577–11585, DOI:10.1021/acs.jpcc.8b03166.
- C. Nie, X. Tong, S. Wu, S. Gong and D. Peng, Paraffin Confined in Carbon Nanotubes as Nano-Encapsulated Phase Change Materials: Experimental and Molecular Dynamics Studies, RSC Adv., 2015, 5(113), 92812–92817, 10.1039/C5RA17152K.
- P. M. Ajayan and S. lijima, Capillarity-Induced Filling of Carbon Nanotubes, Nature, 1993, 361(6410), 333–334, DOI:10.1038/361333a0.
- S. Sandoval, G. Tobias and E. Flahaut, Structure of Inorganic Nanocrystals Confined within Carbon Nanotubes, Inorg. Chim. Acta, 2019, 492, 66–75, DOI:10.1016/j.ica.2019.04.004.
- M. Monthioux, E. Flahaut and J.-P. Cleuziou, Hybrid Carbon Nanotubes: Strategy, Progress, and Perspectives, J. Mater. Res., 2006, 21(11), 2774–2793, DOI:10.1557/jmr.2006.0366.
- M. Monthioux and E. Flahaut, Meta- and Hybrid-CNTs: A Clue for the Future Development of Carbon Nanotubes, Mater. Sci. Eng. C, 2007, 27(5–8), 1096–1101, DOI:10.1016/j.msec.2006.07.032.
- C. Nie, A.-M. Galibert, B. Soula, E. Flahaut, J. Sloan and M. Monthioux, A New Insight on the Mechanisms of Filling Closed Carbon Nanotubes with Molten Metal Iodides, Carbon, 2016, 110, 48–50, DOI:10.1016/j.carbon.2016.09.001.
- N. Demoncy, O. Stéphan, N. Bran, C. Colliex, A. Loiseau and H. Pascard, Sulfur: The Key for Filling Carbon Nanotubes with Metals, Synth. Met., 1999, 103(1), 2380–2383, DOI:10.1016/S0379-6779(98)00304-X.
- Z. Wang, Z. Zhao and J. Qiu, In Situ Synthesis of Super-Long Cu Nanowires inside Carbon Nanotubes with Coal as Carbon Source, Carbon, 2006, 44(9), 1845–1847, DOI:10.1016/j.carbon.2006.04.001.
- N. Grobert, M. Mayne, D. R. M. Walton, H. W. Kroto, M. Terrones, R. Kamalakaran, T. Seeger, M. Rühle, H. Terrones, J. Sloan, R. E. Dunin-Borkowski and J. L. Hutchison, Alloy Nanowires: Invar inside Carbon Nanotubes, Chem. Commun., 2001, 471–472, 10.1039/b100190f.
- Y. K. Chen, A. Chu, J. Cook, M. L. H. Green, P. J. F. Harris, R. Heesom, M. Humphries, J. Sloan, S. C. Tsang and J. F. C. Turner, Synthesis of Carbon Nanotubes Containing Metal Oxides and Metals of the D-Block and f-Block Transition Metals and Related Studies, J. Mater. Chem., 1997, 7(3), 545–549, 10.1039/a605652k.
- S. C. Tsang, Y. K. Chen, P. J. F. Harris and M. L. H. Green, A Simple Chemical Method of Opening and Filling Carbon Nanotubes, Nature, 1994, 372(6502), 159–162, DOI:10.1038/372159a0.
- C. Pham-Huu, N. Keller, C. Estournès, G. Ehret and M. J. Ledoux, Synthesis of CoFe 2 O 4 Nanowire in Carbon Nanotubes. A New Use of the Confinement Effect, Chem. Commun., 2002, 1882–1883, 10.1039/B203787B.
- L. Zhao and L. Gao, Filling of Multi-Walled Carbon Nanotubes with Tin(IV) Oxide, Carbon, 2004, 42(15), 3269–3272, DOI:10.1016/j.carbon.2004.08.009.
- J. Jorge, E. Flahaut, F. Gonzalez-Jimenez, G. Gonzalez, J. Gonzalez, E. Belandria, J. M. Broto and B. Raquet, Preparation and Characterization of α-Fe Nanowires Located inside Double Wall Carbon Nanotubes, Chem. Phys. Lett., 2008, 457(4–6), 347–351, DOI:10.1016/j.cplett.2008.04.019.
- E. Borowiak-Palen, M. H. Ruemmeli, T. Gemming, T. Pichler, R. J. Kalenczuk and S. R. P. Silva, Silver Filled Single-Wall Carbon Nanotubes—Synthesis, Structural and Electronic Properties, Nanotechnology, 2006, 17(9), 2415–2419, DOI:10.1088/0957-4484/17/9/058.
- X. Cui, Y. Wang, G. Jiang, Z. Zhao, C. Xu, A. Duan, J. Liu, Y. Wei and W. Bai, The Encapsulation of CdS in Carbon Nanotubes for Stable and Efficient Photocatalysis, J. Mater. Chem. A, 2014, 2(48), 20939–20946, 10.1039/C4TA04549A.
- M. Jesionek, M. Nowak, K. Mistewicz, M. Kępińska, D. Stróż, I. Bednarczyk and R. Paszkiewicz, Sonochemical Growth of Nanomaterials in Carbon Nanotube, Ultrasonics, 2018, 83, 179–187, DOI:10.1016/j.ultras.2017.03.014.
- J. Sloan, G. Matthewman, C. Dyer-Smith, A.-Y. Sung, Z. Liu, K. Suenaga, A. I. Kirkland and E. Flahaut, Direct Imaging of the Structure, Relaxation, and Sterically Constrained Motion of Encapsulated Tungsten Polyoxometalate Lindqvist Ions within Carbon Nanotubes, ACS Nano, 2008, 2(5), 966–976, DOI:10.1021/nn7002508.
- J. Sloan, J. Cook, A. Chu, M. Zwiefka-Sibley, M. L. H. Green and J. L. Hutchison, Selective Deposition of UCl4 and (KCl)x(UCl4)Y inside Carbon Nanotubes Using Eutectic and Noneutectic Mixtures of UCl4 with KCl, J. Solid State Chem., 1998, 140(1), 83–90, DOI:10.1006/jssc.1998.7863.
- M. Martincic, S. Vranic, E. Pach, S. Sandoval, B. Ballesteros, K. Kostarelos and G. Tobias, Non-Cytotoxic Carbon Nanocapsules Synthesized via One-Pot Filling and End-Closing of Multi-Walled Carbon Nanotubes, Carbon, 2019, 141, 782–793, DOI:10.1016/j.carbon.2018.10.006.
- G. Brown, S. R. Bailey, J. Sloan, C. Xu, S. Friedrichs, E. Flahaut, K. S. Coleman, M. L. H. Green, J. L. Hutchison and R. E. Dunin-Borkowski, Electron Beam Induced in Situ Clusterisation of 1D ZrCl4 Chains within Single-Walled Carbon Nanotubes, Chem. Commun., 2001, 845–846, 10.1039/b101261o.
- J. Chancolon, F. Archaimbault, A. Pineau and S. Bonnamy, Filling of Carbon Nanotubes with Selenium by Vapour Phase Process, J. Nanosci. Nanotechnol., 2006, 6(1), 82–86 CrossRef PubMed.
- P. M. F. J. Costa, J. Sloan, T. Rutherford and M. L. H. Green, Encapsulation of RexOy Clusters within Single-Walled Carbon Nanotubes and Their in Tubulo Reduction and Sintering to Re Metal, Chem. Mater., 2005, 17(26), 6579–6582, DOI:10.1021/cm0510209.
- C. Nie, A.-M. Galibert, B. Soula, L. Datas, J. Sloan, E. Flahaut and M. Monthioux, The Unexpected Complexity of Filling Double-Wall Carbon Nanotubes With Nickel (and Iodine) 1-D Nanocrystals, IEEE Trans. Nanotechnol., 2017, 16(5), 759–766, DOI:10.1109/TNANO.2017.2686434.
- J. Sloan, M. C. Novotny, S. R. Bailey, G. Brown, C. Xu, V. C. Williams, S. Friedrichs, E. Flahaut, R. L. Callender, A. P. E. York, K. S. Coleman, M. L. H. Green, R. E. Dunin-Borkowski and J. L. Hutchison, Two Layer 4:4 Co-Ordinated KI Crystals Grown within Single Walled Carbon Nanotubes, Chem. Phys. Lett., 2000, 329(1–2), 61–65, DOI:10.1016/S0009-2614(00)00998-2.
- E. Philp, J. Sloan, A. I. Kirkland, R. R. Meyer, S. Friedrichs, J. L. Hutchison and M. L. H. Green, An Encapsulated Helical One-Dimensional Cobalt Iodide Nanostructure, Nat. Mater., 2003, 2(12), 788–791, DOI:10.1038/nmat1020.
- E. Flahaut, J. Sloan, S. Friedrichs, A. I. Kirkland, K. S. Coleman, V. C. Williams, N. Hanson, J. L. Hutchison and M. L. H. Green, Crystallization of 2H and 4H PbI2 in Carbon Nanotubes of Varying Diameters and Morphologies, Chem. Mater., 2006, 18(8), 2059–2069, DOI:10.1021/cm0526056.
- A. A. Tonkikh, V. I. Tsebro, E. A. Obraztsova, D. V. Rybkovskiy, A. S. Orekhov, I. I. Kondrashov, E. I. Kauppinen, A. L. Chuvilin and E. D. Obraztsova, Films of Filled Single-Wall Carbon Nanotubes as a New Material for High-Performance Air-Sustainable Transparent Conductive Electrodes Operating in a Wide Spectral Range, Nanoscale, 2019, 11(14), 6755–6765, 10.1039/C8NR10238D.
- M. Sendova, L. Datas and E. Flahaut, Micro-Raman Scattering of Selenium-Filled Double-Walled Carbon Nanotubes: Temperature Study, J. Appl. Phys., 2009, 105(9), 094312, DOI:10.1063/1.3122301.
- J. Sloan; R. Carter; A. Vlandas; R. R. Meyer; Z. Liu; K. Suenaga; P. J. D. Lindan; G. Lin; J. Harding; E. Flahaut; C. Giusca; S. R. P. Silva; J. L. Hutchison and A. I. Kirkland, Band-Gap Modification Induced in HgTe by Dimensional Constraint in Carbon Nanotubes: Effect of Nanotube Diameter on Microstructure, in Microscopy of Semiconducting Materials 2007, ed. A. G. Cullis and P. A. Midgley, Springer, Netherlands, 2008, pp. 213–216 Search PubMed.
- G. Chimowa, M. Sendova, E. Flahaut, D. Churochkin and S. Bhattacharyya, Tuning the Electrical Transport Properties of Double-Walled Carbon Nanotubes by Semiconductor and Semi-Metal Filling, J. Appl. Phys., 2011, 110(12), 123708, DOI:10.1063/1.3670879.
- S. Ncube, C. Coleman, A. Strydom, E. Flahaut, A. de Sousa and S. Bhattacharyya, Kondo Effect and Enhanced Magnetic Properties in Gadolinium Functionalized Carbon Nanotube Supramolecular Complex, Sci. Rep., 2018, 8(1), 8057, DOI:10.1038/s41598-018-26428-y.
- O. Domanov, E. Weschke, T. Saito, H. Peterlik, T. Pichler, M. Eisterer and H. Shiozawa, Exchange Coupling in a Frustrated Trimetric Molecular Magnet Reversed by a 1D Nano-Confinement, Nanoscale, 2019, 11(22), 10615–10621, 10.1039/C9NR00796B.
- D. Iglesias and M. Melchionna, Enter the Tubes: Carbon Nanotube Endohedral Catalysis, Catalysts, 2019, 9(2), 128, DOI:10.3390/catal9020128.
- M. Martincic and G. Tobias, Filled Carbon Nanotubes in Biomedical Imaging and Drug Delivery, Expert Opin. Drug Delivery, 2015, 12(4), 563–581, DOI:10.1517/17425247.2015.971751.
- Y. C. Sharma, V. Srivastava, V. K. Singh, S. N. Kaul and C. H. Weng, Nano-adsorbents for the Removal of Metallic Pollutants from Water and Wastewater, Environ. Technol., 2009, 30(6), 583–609, DOI:10.1080/09593330902838080.
- G. Chimowa, L. Yang, P. Lonchambon, T. Hungria, L. Datas, C. Vieu and E. Flahaut, Tailoring of Double-Walled Carbon Nanotubes for Formaldehyde Sensing through Encapsulation of Selected Materials, Phys. Status Solidi A, 2019, 1900279, DOI:10.1002/pssa.201900279.
- Y. Teng, J. Li, J. Yao, L. Kang and Q. Li, Filled Carbon-Nanotube Heterostructures: From Synthesis to Application, Microstructures, 2023, 3, 2023019, DOI:10.20517/microstructures.2023.07.
- Y. R. Poudel and W. Li, Synthesis, Properties, and Applications of Carbon Nanotubes Filled with Foreign Materials: A Review, Mater. Today Phys., 2018, 7, 7–34, DOI:10.1016/j.mtphys.2018.10.002.
- M. Hart, E. R. White, J. Chen, C. M. McGilvery, C. J. Pickard, A. Michaelides, A. Sella, M. S. P. Shaffer and C. G. Salzmann, Encapsulation and Polymerization of White Phosphorus Inside Single-Wall Carbon Nanotubes, Angew. Chem., Int. Ed., 2017, 56(28), 8144–8148, DOI:10.1002/anie.201703585.
- T. Fujimori, A. Morelos-Gómez, Z. Zhu, H. Muramatsu, R. Futamura, K. Urita, M. Terrones, T. Hayashi, M. Endo, S. Young Hong, Y. Chul Choi, D. Tománek and K. Kaneko, Conducting Linear Chains of Sulphur inside Carbon Nanotubes, Nat. Commun., 2013, 4(1), 2162, DOI:10.1038/ncomms3162.
- V. V. Nascimento, W. Q. Neves, R. S. Alencar, G. Li, C. Fu, R. C. Haddon, E. Bekyarova, J. Guo, S. S. Alexandre, R. W. Nunes, A. G. Souza Filho and C. Fantini, Origin of the Giant Enhanced Raman Scattering by Sulfur Chains Encapsulated inside Single-Wall Carbon Nanotubes, ACS Nano, 2021, 15(5), 8574–8582, DOI:10.1021/acsnano.1c00390.
- K. Miyaura, Y. Miyata, B. Thendie, K. Yanagi, R. Kitaura, Y. Yamamoto, S. Arai, H. Kataura and H. Shinohara, Extended-Conjugation π-Electron Systems in Carbon Nanotubes, Sci. Rep., 2018, 8(1), 8098, DOI:10.1038/s41598-018-26379-4.
- E. Hernández, V. Meunier, B. W. Smith, R. Rurali, H. Terrones, M. Buongiorno Nardelli, M. Terrones, D. E. Luzzi and J.-C. Charlier, Fullerene Coalescence in Nanopeapods: A Path to Novel Tubular Carbon, Nano Lett., 2003, 3(8), 1037–1042, DOI:10.1021/nl034283f.
- A. Botos, J. Biskupek, T. W. Chamberlain, G. A. Rance, C. T. Stoppiello, J. Sloan, Z. Liu, K. Suenaga, U. Kaiser and A. N. Khlobystov, Carbon Nanotubes as Electrically Active Nanoreactors for Multi-Step Inorganic Synthesis: Sequential Transformations of Molecules to Nanoclusters and Nanoclusters to Nanoribbons, J. Am. Chem. Soc., 2016, 138(26), 8175–8183, DOI:10.1021/jacs.6b03633.
- T. W. Chamberlain, J. Biskupek, S. T. Skowron, A. V. Markevich, S. Kurasch, O. Reimer, K. E. Walker, G. A. Rance, X. Feng, K. Müllen, A. Turchanin, M. A. Lebedeva, A. G. Majouga, V. G. Nenajdenko, U. Kaiser, E. Besley and A. N. Khlobystov, Stop-Frame Filming and Discovery of Reactions at the Single-Molecule Level by Transmission Electron Microscopy, ACS Nano, 2017, 11(3), 2509–2520, DOI:10.1021/acsnano.6b08228.
- W. A. Chalifoux and R. R. Tykwinski, Synthesis of Polyynes to Model the Sp-Carbon Allotrope Carbyne, Nat. Chem., 2010, 2(11), 967–971, DOI:10.1038/nchem.828.
- Y. Gao, Y. Hou, F. Gordillo Gámez, M. J. Ferguson, J. Casado and R. R. Tykwinski, The Loss of Endgroup Effects in Long Pyridyl-Endcapped Oligoynes on the Way to Carbyne, Nat. Chem., 2020, 12(12), 1143–1149, DOI:10.1038/s41557-020-0550-0.
- R. Senga, H.-P. Komsa, Z. Liu, K. Hirose-Takai, A. V. Krasheninnikov and K. Suenaga, Atomic Structure and Dynamic Behaviour of Truly One-Dimensional Ionic Chains inside Carbon Nanotubes, Nat. Mater., 2014, 13(11), 1050–1054, DOI:10.1038/nmat4069.
- L. Shi, P. Rohringer, K. Suenaga, Y. Niimi, J. Kotakoski, J. C. Meyer, H. Peterlik, M. Wanko, S. Cahangirov, A. Rubio, Z. J. Lapin, L. Novotny, P. Ayala and T. Pichler, Confined Linear Carbon Chains as a Route to Bulk Carbyne, Nat. Mater., 2016, 15(6), 634–639, DOI:10.1038/nmat4617.
- L.-C. Qin, X. Zhao, K. Hirahara, Y. Miyamoto, Y. Ando and S. Iijima, The Smallest Carbon Nanotube, Nature, 2000, 408(6808), 50, DOI:10.1038/35040699.
- X. Zhao, Y. Ando, Y. Liu, M. Jinno and T. Suzuki, Carbon Nanowire Made of a Long Linear Carbon Chain Inserted Inside a Multiwalled Carbon Nanotube, Phys. Rev. Lett., 2003, 90(18), 187401, DOI:10.1103/PhysRevLett.90.187401.
- Z. Wang, X. Ke, Z. Zhu, F. Zhang, M. Ruan and J. Yang, Carbon-Atom Chain Formation in the Core of Nanotubes, Phys. Rev. B: Condens. Matter Mater. Phys., 2000, 61(4), R2472–R2474, DOI:10.1103/PhysRevB.61.R2472.
- V. Scuderi, S. Scalese, S. Bagiante, G. Compagnini, L. D’Urso and V. Privitera, Direct Observation of the Formation of Linear C Chain/Carbon Nanotube Hybrid Systems, Carbon, 2009, 47(8), 2134–2137, DOI:10.1016/j.carbon.2009.04.010.
- Y. Kang, Y.-C. Liu, Q. Wang, J.-W. Shen, T. Wu and W.-J. Guan, On the Spontaneous Encapsulation of Proteins in Carbon Nanotubes, Biomaterials, 2009, 30(14), 2807–2815, DOI:10.1016/j.biomaterials.2009.01.024.
- Y. Zhang, J. Zhao, Y. Fang, Y. Liu and X. Zhao, Preparation of Long Linear Carbon Chain inside Multi-Walled Carbon Nanotubes by Cooling Enhanced Hydrogen Arc Discharge Method, Nanoscale, 2018, 10(1), 17824–17833, 10.1039/C8NR05465G.
- K. Zhang, Y. Zhang and L. Shi, A Review of Linear Carbon Chains, Chin. Chem. Lett., 2020, 31(07), 1746–1756, DOI:10.1016/j.cclet.2020.03.019.
- C. Zhao, R. Kitaura, H. Hara, S. Irle and H. Shinohara, Growth of Linear Carbon Chains inside Thin Double-Wall Carbon Nanotubes, J. Phys. Chem. C, 2011, 115(27), 13166–13170, DOI:10.1021/jp201647m.
- L. Shi, P. Rohringer, M. Wanko, A. Rubio, S. Waßerroth, S. Reich, S. Cambré, W. Wenseleers, P. Ayala and T. Pichler, Electronic Band Gaps of Confined Linear Carbon Chains Ranging from Polyyne to Carbyne, Phys. Rev. Mater., 2017, 1(7), 075601, DOI:10.1103/PhysRevMaterials.1.075601.
- M. Endo, Y. A. Kim, T. Hayashi, H. Muramatsu, M. Terrones, R. Saito, F. Villalpando-Paez, S. G. Chou and M. S. Dresselhaus, Nanotube Coalescence-Inducing Mode: A Novel Vibrational Mode in Carbon Systems, Small, 2006, 2(8–9), 1031–1036, DOI:10.1002/smll.200600087.
- M. Jinno, Y. Ando, S. Bandow, J. Fan, M. Yudasaka and S. Iijima, Raman Scattering Study for Heat-Treated Carbon Nanotubes: The Origin of ≈1855 cm−1 Raman Band, Chem. Phys. Lett., 2006, 418(1–3), 109–114, DOI:10.1016/j.cplett.2005.10.089.
- L. Shi, L. Sheng, L. Yu, K. An, Y. Ando and X. Zhao, Ultra-Thin Double-Walled Carbon Nanotubes: A Novel Nanocontainer for Preparing Atomic Wires, Nano Res., 2011, 4(8), 759–766, DOI:10.1007/s12274-011-0132-y.
- J. Chimborazo, T. Saito, T. Pichler, L. Shi and P. Ayala, Towards Controllable Inner Chirality in Double-Walled Carbon Nanotubes, Appl. Phys. Lett., 2019, 115(10), 103102, DOI:10.1063/1.5095679.
- L. Shi, R. Senga, K. Suenaga, J. Chimborazo, P. Ayala and T. Pichler, Photothermal Synthesis of Confined Carbyne, Carbon, 2021, 182, 348–353, DOI:10.1016/j.carbon.2021.05.058.
- S. Toma, K. Asaka, M. Irita and Y. Saito, Bulk Synthesis of Linear Carbon Chains Confined inside Single-Wall Carbon Nanotubes by Vacuum Discharge, Surf. Interface Anal., 2019, 51(1), 131–135, DOI:10.1002/sia.6590.
- L. Shi, R. Senga, K. Suenaga, H. Kataura, T. Saito, A. P. Paz, A. Rubio, P. Ayala and T. Pichler, Toward Confined Carbyne with Tailored Properties, Nano Lett., 2021, 21(2), 1096–1101, DOI:10.1021/acs.nanolett.0c04482.
- W. Cui, L. Shi, K. Cao, U. Kaiser, T. Saito, P. Ayala and T. Pichler, Isotopic Labelling of Confined Carbyne, Angew. Chem., Int. Ed., 2021, 60(18), 9897–9901, DOI:10.1002/anie.202017356.
- W. Cui, F. Simon, Y. Zhang, L. Shi, P. Ayala and T. Pichler, Ultra-Clean Isotope Engineered Double-Walled Carbon Nanotubes as Tailored Hosts to Trace the Growth of Carbyne, Adv. Funct. Mater., 2022, 32(41), 2206491, DOI:10.1002/adfm.202206491.
- S. Yang and M. Kertesz, Bond Length Alternation and Energy Band Gap of Polyyne, J. Phys. Chem. A, 2006, 110, 9771–9774 CrossRef CAS PubMed.
- M. Wanko, S. Cahangirov, L. Shi, P. Rohringer, Z. J. Lapin, L. Novotny, P. Ayala, T. Pichler and A. Rubio, Polyyne Electronic and Vibrational Properties under Environmental Interactions, Phys. Rev. B: Condens. Matter Mater. Phys., 2016, 94(19), 195422, DOI:10.1103/PhysRevB.94.195422.
- S. Heeg, L. Shi, L. V. Poulikakos, T. Pichler and L. Novotny, Carbon Nanotube Chirality Determines Properties of Encapsulated Linear Carbon Chain, Nano Lett., 2018, 18(9), 5426–5431, DOI:10.1021/acs.nanolett.8b01681.
- M. Martinati, W. Wenseleers, L. Shi, S. M. Pratik, P. Rohringer, W. Cui, T. Pichler, V. Coropceanu, J.-L. Brédas and S. Cambré, Electronic Structure of Confined Carbyne from Joint Wavelength-Dependent Resonant Raman Spectroscopy and Density Functional Theory Investigations, Carbon, 2022, 189, 276–283, DOI:10.1016/j.carbon.2021.12.059.
- S. Heeg, L. Shi, T. Pichler and L. Novotny, Raman Resonance Profile of an Individual Confined Long Linear Carbon Chain, Carbon, 2018, 139, 581–585, DOI:10.1016/j.carbon.2018.07.007.
- J. Zhu, R. Bernhardt, W. Cui, R. German, J. Wagner, B. V. Senkovskiy, A. Grüneis, T. Pichler, Y. Li, X. Li, K. Wu, R. Liu, X. Zhu, P. H. M. Van Loosdrecht and L. Shi, Unraveling the Excitonic Transition and Associated Dynamics in Confined Long Linear Carbon Chains with Time-Resolved Resonance Raman Scattering, Laser Photonics Rev., 2021, 15(12), 2100259, DOI:10.1002/lpor.202100259.
- Y.-W. Son, M. L. Cohen and S. G. Louie, Energy Gaps in Graphene Nanoribbons, Phys. Rev. Lett., 2006, 97(21), 216803, DOI:10.1103/PhysRevLett.97.216803.
- L. Jiao, L. Zhang, X. Wang, G. Diankov and H. Dai, Narrow Graphene Nanoribbons from Carbon Nanotubes, Nature, 2009, 458(7240), 877–880, DOI:10.1038/nature07919.
- D. V. Kosynkin, A. L. Higginbotham, A. Sinitskii, J. R. Lomeda, A. Dimiev, B. K. Price and J. M. Tour, Longitudinal Unzipping of Carbon Nanotubes to Form Graphene Nanoribbons, Nature, 2009, 458(7240), 872–876, DOI:10.1038/nature07872.
- H. S. Wang, L. Chen, K. Elibol, L. He, H. Wang, C. Chen, C. Jiang, C. Li, T. Wu, C. X. Cong, T. J. Pennycook, G. Argentero, D. Zhang, K. Watanabe, T. Taniguchi, W. Wei, Q. Yuan, J. C. Meyer and X. Xie, Towards Chirality Control of Graphene Nanoribbons Embedded in Hexagonal Boron Nitride, Nat. Mater., 2021, 20(2), 202–207, DOI:10.1038/s41563-020-00806-2.
- J. Cai, P. Ruffieux, R. Jaafar, M. Bieri, T. Braun, S. Blankenburg, M. Muoth, A. P. Seitsonen, M. Saleh, X. Feng, K. Müllen and R. Fasel, Atomically Precise Bottom-up Fabrication of Graphene Nanoribbons, Nature, 2010, 466(7305), 470–473, DOI:10.1038/nature09211.
- H. Kuzmany, L. Shi, M. Martinati, S. Cambré, W. Wenseleers, J. Kürti, J. Koltai, G. Kukucska, K. Cao, U. Kaiser, T. Saito and T. Pichler, Well-Defined Sub-Nanometer Graphene Ribbons Synthesized inside Carbon Nanotubes, Carbon, 2021, 171, 221–229, DOI:10.1016/j.carbon.2020.08.065.
- V. Milotti, C. Berkmann, J. Laranjeira, W. Cui, K. Cao, Y. Zhang, U. Kaiser, K. Yanagi, M. Melle-Franco, L. Shi, T. Pichler and P. Ayala, Unravelling the Complete Raman Response of Graphene Nanoribbons Discerning the Signature of Edge Passivation, Small Methods, 2022, 6(8), 2200110, DOI:10.1002/smtd.202200110.
- H. Zhang, Y. Chen, K. Tang, Z. Lin, X. Li, H. Zhang, Y. Zhang, C. H. Wong, C. W. Leung, C. L. Mak, Y. Hu, W. Cui, K. Cao and L. Shi, Microwave Heating as a Universal Method to Transform Confined Molecules into Armchair Graphene Nanoribbons, Nano Res., 2023, 16(7), 10644–10651, DOI:10.1007/s12274-023-5632-z.
- T. W. Chamberlain, J. Biskupek, G. A. Rance, A. Chuvilin, T. J. Alexander, E. Bichoutskaia, U. Kaiser and A. N. Khlobystov, Size, Structure, and Helical Twist of Graphene Nanoribbons Controlled by Confinement in Carbon Nanotubes, ACS Nano, 2012, 6(5), 3943–3953, DOI:10.1021/nn300137j.
- A. Chuvilin, E. Bichoutskaia, M. C. Gimenez-Lopez, T. W. Chamberlain, G. A. Rance, N. Kuganathan, J. Biskupek, U. Kaiser and A. N. Khlobystov, Self-Assembly of a Sulphur-Terminated Graphene Nanoribbon within a Single-Walled Carbon Nanotube, Nat. Mater., 2011, 10(9), 687–692, DOI:10.1038/nmat3082.
- Y. Zhang, K. Cao, T. Saito, H. Kataura, H. Kuzmany, T. Pichler, U. Kaiser, G. Yang and L. Shi, Carbon Nanotube-Dependent Synthesis of Armchair Graphene Nanoribbons, Nano Res., 2022, 15(3), 1709–1714, DOI:10.1007/s12274-021-3819-8.
- A. Cadena, B. Botka, Á. Pekker, C. D. Tschannen, C. Lombardo, L. Novotny, A. N. Khlobystov and K. Kamarás, Molecular Encapsulation from the Liquid Phase and Graphene Nanoribbon Growth in Carbon Nanotubes, J. Phys. Chem. Lett., 2022, 13(41), 9752–9758, DOI:10.1021/acs.jpclett.2c02046.
- A. Cadena, Á. Pekker, B. Botka, E. Dodony, Z. Fogarassy, B. Pécz and K. Kamarás, Encapsulation of the Graphene Nanoribbon Precursor 1,2,4-Trichlorobenzene in Boron Nitride Nanotubes at Room Temperature, Phys. Status Solidi RRL – Rapid Res. Lett, 2023, 17(1), 2200284, DOI:10.1002/pssr.202200284.
- M. Vandescuren, P. Hermet, V. Meunier, L. Henrard and P. H. Lambin, Theoretical Study of the Vibrational Edge Modes in Graphene Nanoribbons, Phys. Rev. B: Condens. Matter Mater. Phys., 2008, 78(19), 195401, DOI:10.1103/PhysRevB.78.195401.
- A. I. Chernov, P. V. Fedotov, A. V. Talyzin, I. Suarez Lopez, I. V. Anoshkin, A. G. Nasibulin, E. I. Kauppinen and E. D. Obraztsova, Optical Properties of Graphene Nanoribbons Encapsulated in Single-Walled Carbon Nanotubes, ACS Nano, 2013, 7(7), 6346–6353, DOI:10.1021/nn4024152.
- A. Chu, J. Cook, R. J. R. Heesom, J. L. Hutchison, M. L. H. Green and J. Sloan, Filling of Carbon Nanotubes with Silver, Gold, and Gold Chloride, Chem. Mater., 1996, 8(12), 2751–2754, DOI:10.1021/cm960246w.
- C.-M. Tîlmaciu, B. Soula, A.-M. Galibert, P. Lukanov, L. Datas, J. González, L. F. Barquín, J. Rodríguez Fernández, F. González-Jiménez, J. Jorge and E. Flahaut, Synthesis of Superparamagnetic Iron(Iii) Oxide Nanowires in Double-Walled Carbon Nanotubes, Chem. Commun., 2009, 6664, 10.1039/b909035e.
- O. Ersen, S. Bégin, M. Houllé, J. Amadou, I. Janowska, J.-M. Grenèche, C. Crucifix and C. Pham-Huu, Microstructural Investigation of Magnetic CoFe2O4 Nanowires inside Carbon Nanotubes by Electron Tomography, Nano Lett., 2008, 8(4), 1033–1040, DOI:10.1021/nl072714e.
- B. C. Satishkumar, A. Govindaraj, J. Mofokeng, G. N. Subbanna and C. N. R. Rao, Novel Experiments with Carbon Nanotubes: Opening, Filling, Closing and Functionalizing Nanotubes, J. Phys. B: At., Mol. Opt. Phys., 1996, 29(21), 4925–4934, DOI:10.1088/0953-4075/29/21/006.
- M. Sauer, A. Briones-Leon, T. Saito, K. Yanagi, K. Schulte, T. Pichler and H. Shiozawa, Tailoring the Electronic Properties of Single-Walled Carbon Nanotubes via Filling with Nickel Acetylacetonate: Tailoring SWCNT via Filling with Nickel Acetylacetonate, Phys. Status Solidi B, 2015, 252(11), 2546–2550, DOI:10.1002/pssb.201552452.
- J. Sloan, J. Cook, J. R. Heesom, M. L. H. Green and J. L. Hutchison, The Encapsulation and in Situ Rearrangement of Polycrystalline SnO inside Carbon Nanotubes, J. Cryst. Growth, 1997, 173(1), 81–87, DOI:10.1016/S0022-0248(96)00833-0.
- O. Dubay, G. Kresse and H. Kuzmany, Phonon Softening in Metallic Nanotubes by a Peierls-like Mechanism, Phys. Rev. Lett., 2002, 88, 235506, DOI:10.1103/PhysRevLett.88.235506.
- A. Das, A. K. Sood, A. Govindaraj, A. M. Saitta, M. Lazzeri, F. Mauri and C. N. R. Rao, Doping in Carbon Nanotubes Probed by Raman and Transport Measurements, Phys. Rev. Lett., 2007, 99, 136803, DOI:10.1103/PhysRevLett.99.136803.
- S. Piscanec, M. Lazzeri, J. Robertson, A. C. Ferrari and F. Mauri, Optical Phonons in Carbon Nanotubes: Kohn Anomalies, Peierls Distortions, and Dynamic Effects, Phys. Rev. B: Condens. Matter Mater. Phys., 2007, 75(3), 035427 CrossRef.
- M. Fouquet, H. Telg, J. Maultzsch, Y. Wu, B. Chandra, J. Hone, T. F. Heinz and C. Thomsen, Longitudinal Optical Phonons in Metallic and Semiconducting Carbon Nanotubes, Phys. Rev. Lett., 2009, 102, 075501, DOI:10.1103/PhysRevLett.102.075501.
- S. D. M. Brown, A. Jorio, P. Corio, M. S. Dresselhaus, G. Dresselhaus, R. Saito and K. Kneipp, Origin of the Breit-Wigner-Fano Lineshape of the Tangential G -Band Feature of Metallic Carbon Nanotubes, Phys. Rev. B: Condens. Matter Mater. Phys., 2001, 63, 155414, DOI:10.1103/PhysRevB.63.155414.
- H. Kataura, Y. Kumazawa, Y. Maniwa, I. Umezu, S. Suzuki, Y. Ohtsuka and Y. Achiba, Optical Properties of Single-Wall Carbon Nanotubes, Synth. Met., 1999, 103(1–3), 2555–2558 CrossRef CAS.
- Y. Almadori, G. Delport, R. Chambard, L. Orcin-Chaix, A. C. Selvati, N. Izard, A. Belhboub, R. Aznar, B. Jousselme, S. Campidelli, P. Hermet, R. Le Parc, T. Saito, Y. Sato, K. Suenaga, P. Puech, J. S. Lauret, G. Cassabois, J.-L. Bantignies and L. Alvarez, Fermi Level Shift in Carbon Nanotubes by Dye Confinement, Carbon, 2019, 149, 772–780, DOI:10.1016/j.carbon.2019.04.041.
- J. C. Tsang, M. Freitag, V. Perebeinos, J. Liu and P. H. Avouris, Doping and Phonon Renormalization in Carbon Nanotubes, Nat. Nanotechnol., 2007, 2(11), 725–730, DOI:10.1038/nnano.2007.321.
- M. Lazzeri and F. Mauri, Nonadiabatic Kohn Anomaly in a Doped Graphene Monolayer, Phys. Rev. Lett., 2006, 97, 266407, DOI:10.1103/PhysRevLett.97.266407.
- A. Das and A. K. Sood, Renormalization of the Phonon Spectrum in Semiconducting Single-Walled Carbon Nanotubes Studied by Raman Spectroscopy, Phys. Rev. B: Condens. Matter Mater. Phys., 2009, 79, 235429, DOI:10.1103/PhysRevB.79.235429.
- N. Caudal, A. M. Saitta, M. Lazzeri and F. Mauri, Kohn Anomalies and Nonadiabaticity in Doped Carbon Nanotubes, Phys. Rev. B: Condens. Matter Mater. Phys., 2007, 75, 115423, DOI:10.1103/PhysRevB.75.115423.
- X. Liu, H. Kuzmany, P. Ayala, M. Calvaresi, F. Zerbetto and T. Pichler, Selective Enhancement of Photoluminescence in Filled Single-Walled Carbon Nanotubes, Adv. Funct. Mater., 2012, 22(15), 3202–3208, DOI:10.1002/adfm.201200224.
- A. Rakitin, C. Papadopoulos and J. M. Xu, Carbon Nanotube Self-Doping: Calculation of the Hole Carrier Concentration, Phys. Rev. B: Condens. Matter Mater. Phys., 2003, 67, 033411, DOI:10.1103/PhysRevB.67.033411.
- K. Liu, M. Burghard, S. Roth and P. Bernier, Conductance Spikes in Single-Walled Carbon Nanotube Field-Effect Transistor, Appl. Phys. Lett., 1999, 75(16), 2494–2496, DOI:10.1063/1.125059.
- R. Chambard, J. C. Moreno-López, P. Hermet, Y. Sato, K. Suenaga, T. Pichler, B. Jousselme, R. Aznar, J.-L. Bantignies, N. Izard and L. Alvarez, Tuning of Photoluminescence Intensity and Fermi Level Position of Individual Single-Walled Carbon Nanotubes by Molecule Confinement, Carbon, 2022, 186, 423–430, DOI:10.1016/j.carbon.2021.09.072.
- D. J. Bindl, M. Y. Wu, F. C. Prehn and M. S. Arnold, Efficiently Harvesting Excitons from Electronic Type-Controlled Semiconducting Carbon Nanotube Films, Nano Lett., 2011, 11(2), 455–460, DOI:10.1021/nl1031343.
- M. S. Arnold, J. L. Blackburn, J. J. Crochet, S. K. Doorn, J. G. Duque, A. Mohite and H. Telg, Recent Developments in the Photophysics of Single-Walled Carbon Nanotubes for Their Use as Active and Passive Material Elements in Thin Film Photovoltaics, Phys. Chem. Chem. Phys., 2013, 15(36), 14896–14918, 10.1039/c3cp52752b.
- H. Li, R. B. Martin, B. A. Harruff, R. A. Carino, L. F. Allard and Y.-P. Sun, Single-Walled Carbon Nanotubes Tethered with Porphyrins: Synthesis and Photophysical Properties, Adv. Mater., 2004, 16(11), 896–900, DOI:10.1002/adma.200306288.
- S. Campidelli, C. Sooambar, E. Lozano Diz, C. Ehli, D. M. Guldi and M. Prato, Dendrimer-Functionalized Single-Wall Carbon Nanotubes: Synthesis, Characterization, and Photoinduced Electron Transfer, J. Am. Chem. Soc., 2006, 128(38), 12544–12552, DOI:10.1021/ja063697i.
- A. Attanzio, A. Sapelkin, F. Gesuele, A. van der Zande, W. P. Gillin, M. Zheng and M. Palma, Carbon Nanotube-Quantum Dot Nanohybrids: Coupling with Single-Particle Control in Aqueous Solution, Small, 2017, 13(16), 1603042 CrossRef PubMed.
- A. Setaro, M. Adeli, M. Glaeske, D. Przyrembel, T. Bisswanger, G. Gordeev, F. Maschietto, A. Faghani, B. Paulus, M. Weinelt, R. Arenal, R. Haag and S. Reich, Preserving π-Conjugation in Covalently Functionalized Carbon Nanotubes for Optoelectronic Applications, Nat. Commun., 2017, 8(1), 14281, DOI:10.1038/ncomms14281.
- A. Setaro, Advanced Carbon Nanotubes Functionalization, J. Phys.: Condens. Matter, 2017, 29(42), 423003, DOI:10.1088/1361-648X/aa8248.
- M. Glaeske and A. Setaro, Nanoplasmonic Colloidal Suspensions for the Enhancement of the Luminescent Emission from Single-Walled Carbon Nanotubes, Nano Res., 2013, 6(8), 593–601, DOI:10.1007/s12274-013-0335-5.
- J. Yang, Q. Zhao, M. Lyu, Z. Zhang, X. Wang, M. Wang, Z. Gao and Y. Li, Chirality-Selective Photoluminescence Enhancement of ssDNA-Wrapped Single-Walled Carbon Nanotubes Modified with Gold Nanoparticles, Small, 2016, 12(23), 3164–3171, DOI:10.1002/smll.201503883.
- K. Yanagi, Y. Miyata and H. Kataura, Highly Stabilized β-Carotene in Carbon Nanotubes, Adv. Mater., 2006, 18(4), 437–441, DOI:10.1002/adma.200501839.
- K. Abe, D. Kosumi, K. Yanagi, Y. Miyata, H. Kataura and M. Yoshizawa, Light-Harvesting Function of β -Carotene inside Carbon Nanotubes Explored by Femtosecond Absorption Spectroscopy, Phys. Rev. B: Condens. Matter Mater. Phys., 2008, 77, 165436, DOI:10.1103/PhysRevB.77.165436.
- E. Gaufrès, N. Y. W. Tang, A. Favron, C. Allard, F. Lapointe, V. Jourdain, S. Tahir, C. N. Brosseau, R. Leonelli and R. Martel, Aggregation Control of α-Sexithiophene via Isothermal Encapsulation Inside Single-Walled Carbon Nanotubes, ACS Nano, 2016, 10(11), 10220–10226, DOI:10.1021/acsnano.6b05660.
- N. S. Mueller, S. Heeg, P. Kusch, E. Gaufrès, N. Y.-W. Tang, U. Hübner, R. Martel, A. Vijayaraghavan and S. Reich, Plasmonic Enhancement of SERS Measured on Molecules in Carbon Nanotubes, Faraday Discuss., 2017, 205, 85–103, 10.1039/C7FD00127D.
- S. van Bezouw, D. H. Arias, R. Ihly, S. Cambré, A. J. Ferguson, J. Campo, J. C. Johnson, J. Defillet, W. Wenseleers and J. L. Blackburn, Diameter-Dependent Optical Absorption and Excitation Energy Transfer from Encapsulated Dye Molecules toward Single-Walled Carbon Nanotubes, ACS Nano, 2018, 12(7), 6881–6894, DOI:10.1021/acsnano.8b02213.
- S. Cambré, J. Campo, C. Beirnaert, C. Verlackt, P. Cool and W. Wenseleers, Asymmetric Dyes Align inside Carbon Nanotubes to Yield a Large Nonlinear Optical Response, Nat. Nanotechnol., 2015, 10(3), 248–252, DOI:10.1038/nnano.2015.1.
- K. Yanagi, K. Iakoubovskii, S. Kazaoui, N. Minami, Y. Maniwa, Y. Miyata and H. Kataura, Light-Harvesting Function of β -Carotene inside Carbon Nanotubes, Phys. Rev. B: Condens. Matter Mater. Phys., 2006, 74(15), 155420, DOI:10.1103/PhysRevB.74.155420.
- C. Roquelet, D. Garrot, J. S. Lauret, C. Voisin, V. Alain-Rizzo, P. H. Roussignol, J. A. Delaire and E. Deleporte, Quantum Efficiency of Energy Transfer in Noncovalent Carbon Nanotube/Porphyrin Compounds, Appl. Phys. Lett., 2010, 97(14), 141918, DOI:10.1063/1.3496470.
- M. Ince, J. Bartelmess, D. Kiessling, K. Dirian, M. V. Martínez-Díaz, T. Torres, D. M. Guldi and N. I. R. Immobilizing, Absorbing Azulenocyanines onto Single Wall Carbon Nanotubes—From Charge Transfer to Photovoltaics, Chem. Sci., 2012, 3, 1472–1480, 10.1039/c2sc20071f.
- J. Bartelmess, A. R. M. Soares, M. V. Martínez-Díaz, M. G. P. M. S. Neves, A. C. Tomé, J. A. S. Cavaleiro, T. Torres and D. M. Guldi, Panchromatic Light Harvesting in Single Wall Carbon Nanotube Hybrids – Immobilization of Porphyrin-Phthalocyanine Conjugates, Chem. Commun., 2011, 47, 3490–3492, 10.1039/c0cc05576j.
- G. Magadur, J. S. Lauret, V. Alain-Rizzo, C. Voisin, P. Roussignol, E. Deleporte and J. A. Delaire, Excitation Transfer in Functionalized Carbon Nanotubes, Chem. Phys. Chem., 2008, 9(9), 1250–1253, DOI:10.1002/cphc.200800104.
- G. Delport, F. Vialla, S. Campidelli, C. Voisin and J. S. Lauret, Thermodynamics Study of the Noncovalent Functionalization of Surfactant Suspended Graphene Nanosheets with Porphyrin Molecules, Phys. Status Solidi B, 2016, 253(12), 2373–2376, DOI:10.1002/pssb.201600269.
- S. Cambré, W. Wenseleers, J. Čulin, S. Van Doorslaer, A. Fonseca, J. B. Nagy and E. Goovaerts, Characterisation of Nanohybrids of Porphyrins with Metallic and Semiconducting Carbon Nanotubes by EPR and Optical Spectroscopy, Chem. Phys. Chem., 2008, 9(13), 1930–1941, DOI:10.1002/cphc.200800317.
- C. Ehli, D. M. Guldi, M. Ángeles Herranz, N. Martín, S. Campidelli and M. Prato, Pyrene-Tetrathiafulvalene Supramolecular Assembly with Different Types of Carbon Nanotubes, J. Mater. Chem., 2008, 18, 1498–1503, 10.1039/b716892f.
- C. Ehli, G. M. Aminur Rahman, N. Jux, D. Balbinot, D. M. Guldi, F. Paolucci, M. Marcaccio, D. Paolucci, M. Melle-Franco, F. Zerbetto, S. Campidelli and M. Prato, Interactions in Single Wall Carbon Nanotubes/Pyrene/Porphyrin Nanohybrids, J. Am. Chem. Soc., 2006, 128(34), 11222–11231, DOI:10.1021/ja0624974.
- F. Ernst, T. Heek, A. Setaro, R. Haag and S. Reich, Energy Transfer in Nanotube-Perylene Complexes, Adv. Funct. Mater., 2012, 22(18), 3921–3926, DOI:10.1002/adfm.201200784.
- K. Huth, M. Glaeske, K. Achazi, G. Gordeev, S. Kumar, R. Arenal, S. K. Sharma, M. Adeli, A. Setaro, S. Reich and R. Haag, Fluorescent Polymer—Single-Walled Carbon Nanotube Complexes with Charged and Noncharged Dendronized Perylene Bisimides for Bioimaging Studies, Small, 2018, 14(28), 1800796, DOI:10.1002/smll.201800796.
- F. Ernst, T. Heek, A. Setaro, R. Haag and S. Reich, Functional Surfactants for Carbon Nanotubes: Effects of Design, J. Phys. Chem. C, 2013, 117(2), 1157–1162, DOI:10.1021/jp3098186.
- F. Ernst, T. Heek, A. Setaro, R. Haag and S. Reich, Excitation Characteristics of Different Energy Transfer in Nanotube-Perylene Complexes, Appl. Phys. Lett., 2013, 102, 233105, DOI:10.1063/1.4810912.
- L. Kortekaas and W. R. Browne, The Evolution of Spiropyran: Fundamentals and Progress of an Extraordinarily Versatile Photochrome, Chem. Soc. Rev., 2019, 48(12), 3406–3424, 10.1039/C9CS00203K.
- A. Setaro, P. Bluemmel, C. Maity, S. Hecht and S. Reich, Non-Covalent Functionalization of Individual Nanotubes with Spiropyran-Based Molecular Switches, Adv. Funct. Mater., 2012, 22(11), 2425–2431, DOI:10.1002/adfm.201102451.
- P. Bluemmel, A. Setaro, C. Maity, S. Hecht and S. Reich, Tuning the Interaction between Carbon Nanotubes and Dipole Switches: The Influence of the Change of the Nanotube-Spiropyran Distance, J. Phys.: Condens. Matter, 2012, 24, 394005, DOI:10.1088/0953-8984/24/39/394005.
- M. Glaeske, P. Bluemmel, S. Juergensen, A. Setaro and S. Reich, Dipole-Switch Induced Modification of the Emissive Response of Carbon Nanotubes, J. Phys.: Condens. Matter, 2017, 29, 454003, DOI:10.1088/1361-648X/aa8dcf.
- A. G. Godin, A. Setaro, M. Gandil, R. Haag, M. Adeli, S. Reich and L. Cognet, Photoswitchable Single-Walled Carbon Nanotubes for Super-Resolution Microscopy in the near-Infrared, Sci. Adv., 2019, 5(9), eaax1166, DOI:10.1126/sciadv.aax1166.
- Y. Chen, G. Royal, E. Flahaut, S. Cobo, V. Bouchiat, L. Marty and N. Bendiab, Light Control of Charge Transfer and Excitonic Transitions in a Carbon Nanotube/Porphyrin Hybrid, Adv. Mater., 2017, 29(18), 1605745, DOI:10.1002/adma.201605745.
- F. Vialla, C. Roquelet, B. Langlois, G. Delport, S. M. Santos, E. Deleporte, P. Roussignol, C. Delalande, C. Voisin and J. S. Lauret, Chirality Dependence of the Absorption Cross Section of Carbon Nanotubes, Phys. Rev. Lett., 2013, 111, 137402, DOI:10.1103/PhysRevLett.111.137402.
- K. Yanagi, K. Iakoubovskii, H. Matsui, H. Matsuzaki, H. Okamoto, Y. Miyata, Y. Maniwa, S. Kazaoui, N. Minami and H. Kataura, Photosensitive Function of Encapsulated Dye in Carbon Nanotubes, J. Am. Chem. Soc., 2007, 129(16), 4992–4997, DOI:10.1021/ja067351j.
- S. Forel, H. Li, S. Bezouw, J. van; Campo, L. Wieland, W. Wenseleers, B. S. Flavel and S. Cambré, Diameter-Dependent Single- and Double-File Stacking of Squaraine Dye Molecules inside Chirality-Sorted Single-Wall Carbon Nanotubes, Nanoscale, 2022, 14(23), 8385–8397, 10.1039/D2NR01630C.
- D. I. Levshov, R. Parret, H.-N. Tran, T. Michel, T. T. Cao, V. C. Nguyen, R. Arenal, V. N. Popov, S. B. Rochal, J.-L. Sauvajol, A.-A. Zahab and M. Paillet, Photoluminescence from an Individual Double-Walled Carbon Nanotube, Phys. Rev. B: Condens. Matter Mater. Phys., 2017, 96(19), 195410, DOI:10.1103/PhysRevB.96.195410.
- M. Erkens, D. Levshov, W. Wenseleers, H. Li, B. S. Flavel, J. A. Fagan, V. N. Popov, M. Avramenko, S. Forel, E. Flahaut and S. Cambré, Efficient Inner-to-Outer Wall Energy Transfer in Highly Pure Double-Wall Carbon Nanotubes Revealed by Detailed Spectroscopy, ACS Nano, 2022, 16(10), 16038–16053, DOI:10.1021/acsnano.2c03883.
- C. Roquelet, J. S. Lauret, V. Alain-Rizzo, C. Voisin, R. Fleurier, M. Delarue, D. Garrot, A. Loiseau, P. Roussignol, J. A. Delaire and E. Deleporte, Π-Stacking Functionalization of Carbon Nanotubes through Micelle Swelling, Chem. Phys. Chem., 2010, 11(8), 1667–1672, DOI:10.1002/cphc.201000067.
- C. Roquelet, B. Langlois, F. Vialla, D. Garrot, J. S. Lauret and C. Voisin, Light Harvesting with Non Covalent Carbon Nanotube/Porphyrin Compounds, Chem. Phys., 2013, 413, 45–54, DOI:10.1016/j.chemphys.2012.09.004.
- D. Garrot, B. Langlois, C. Roquelet, T. Michel, P. Roussignol, C. Delalande, E. Deleporte, J. S. Lauret and C. Voisin, Time-Resolved Investigation of Excitation Energy Transfer in Carbon Nanotube-Porphyrin Compounds, J. Phys. Chem. C, 2011, 115(47), 23283–23292, DOI:10.1021/jp207267e.
- F. Vialla, Y. Chassagneux, R. Ferreira, C. Roquelet, C. Diederichs, G. Cassabois, P. Roussignol, J. S. Lauret and C. Voisin, Unifying the Low-Temperature Photoluminescence Spectra of Carbon Nanotubes: The Role of Acoustic Phonon Confinement, Phys. Rev. Lett., 2014, 113(5), 57402, DOI:10.1103/PhysRevLett.113.057402.
- C. Roquelet, F. Vialla, C. Diederichs, P. Roussignol, C. Delalande, E. Deleporte, J.-S. Lauret and C. Voisin, Local Field Effects in the Energy Transfer between a Chromophore and a Carbon Nanotube: A Single-Nanocompound Investigation, ACS Nano, 2012, 6(10), 8796–8802, DOI:10.1021/nn302566e.
- E. Gaufrès, S. Marcet, V. Aymong, N. Y.-W. Tang, A. Favron, F. Thouin, C. Allard, D. Rioux, N. Cottenye, M. Verhaegen and R. Martel, Hyperspectral Raman Imaging Using Bragg Tunable Filters of Graphene and Other Low-Dimensional Materials: Hyperspectral Raman Imaging Using Bragg Tunable Filters of Graphene and Other Low-Dimensional Materials, J. Raman Spectrosc., 2018, 49(1), 174–182, DOI:10.1002/jrs.5298.
- X. Blase, A. Rubio, S. G. Louie and M. L. Cohen, Stability and Band Gap Constancy of Boron Nitride Nanotubes, Europhys. Lett. EPL, 1994, 28(5), 335–340, DOI:10.1209/0295-5075/28/5/007.
- J. Niskanen, I. Zhang, Y. Xue, D. Golberg, D. Maysinger and F. M. Winnik, Boron Nitride Nanotubes as Vehicles for Intracellular Delivery of Fluorescent Drugs and Probes, Nanomed., 2016, 11(5), 447–463, DOI:10.2217/nnm.15.214.
- C. Allard, L. Schué, F. Fossard, G. Recher, R. Nascimento, E. Flahaut, A. Loiseau, P. Desjardins, R. Martel and E. Gaufrès, Confinement of Dyes inside Boron Nitride Nanotubes: Photostable and Shifted Fluorescence down to the Near Infrared, Adv. Mater., 2020, 32(29), 2001429, DOI:10.1002/adma.202001429.
- N. J. Hestand and F. C. Spano, Expanded Theory of H- and J-Molecular Aggregates: The Effects of Vibronic Coupling and Intermolecular Charge Transfer, Chem. Rev., 2018, 118(15), 7069–7163, DOI:10.1021/acs.chemrev.7b00581.
- J. W. Jordan, A. I. Chernov, G. A. Rance, E. Stephen Davies, A. E. Lanterna, J. Alves Fernandes, A. Grüneis, Q. Ramasse, G. N. Newton and A. N. Khlobystov, Host–Guest Chemistry in Boron Nitride Nanotubes: Interactions with Polyoxometalates and Mechanism of Encapsulation, J. Am. Chem. Soc., 2023, 145(2), 1206–1215, DOI:10.1021/jacs.2c10961.
- R. W. Boyd, Nonlinear Optics, academic Press, New-York, 1992 Search PubMed.
- D. S. Chemla and J. Zyss, Nonlinear Optical Properties of Organic Molecules and Crystals, Academic Press, Orlando, 1987, vol. Quantum Electronics-Principles and Applications Search PubMed.
- P. N. Prasad and D. J. Williams, Introduction to Nonlinear Optical Effects in Molecules & Polymers, John Wiley, New York, 1991 Search PubMed.
- E. Goovaerts; W. Wenseleers; M. H. Garcia and G. H. Cross, Design and Characterization of Organic and Organometallic Molecules for Second Order Nonlinear Optics, in Handbook of Advanced Electronic and Photonic Materials and Devices, Academic Press, San Diego, 2001, vol. Nonlinear Optical Materials Search PubMed.
- L. R. Dalton, P. A. Sullivan and D. H. Bale, Electric Field Poled Organic Electro-Optic Materials: State of the Art and Future Prospects, Chem. Rev., 2010, 110(1), 25–55, DOI:10.1021/cr9000429.
- M. J. Cho, D. H. Choi, P. A. Sullivan, A. J. P. Akelaitis and L. R. Dalton, Recent Progress in Second-Order Nonlinear Optical Polymers and Dendrimers, Prog. Polym. Sci., 2008, 33(11), 1013–1058, DOI:10.1016/j.progpolymsci.2008.07.007.
- M. Li, Y. Li, H. Zhang, S. Wang, Y. Ao and Z. Cui, Molecular Engineering of Organic Chromophores and Polymers for Enhanced Bulk Second-Order Optical Nonlinearity, J. Mater. Chem. C, 2017, 5(17), 4111–4122, 10.1039/C7TC00713B.
- Y. Xiong, H. Tang, J. Zhang, Z. Y. Wang, J. Campo, W. Wenseleers and E. Goovaerts, Functionalized Picolinium Quinodimethane Chromophores for Electro-Optics: Synthesis, Aggregation Behavior, and Nonlinear Optical Properties, Chem. Mater., 2008, 20(24), 7465–7473, DOI:10.1021/cm802341j.
- S. D. Cox, T. E. Gier, G. D. Stucky and J. Bierlein, Inclusion Tuning of Nonlinear Optical Materials: Switching the SHG of p-Nitroaniline and 2-Methyl-p-Nitroaniline with Molecular Sieve Hosts, J. Am. Chem. Soc., 1988, 110(9), 2986–2987, DOI:10.1021/ja00217a057.
- T. C. T. Pham, H. S. Kim and K. B. Yoon, Large Increase in the Second-Order Nonlinear Optical Activity of a Hemicyanine-Incorporating Zeolite Film, Angew. Chem., 2013, 125(21), 5649–5653, DOI:10.1002/ange.201300326.
- R. Sola-Llano, V. Martínez-Martínez, Y. Fujita, L. Gómez-Hortigüela, A. Alfayate, H. Uji-i, E. Fron, J. Pérez-Pariente and I. López-Arbeloa, Formation of a Nonlinear Optical Host-Guest Hybrid Material by Tight Confinement of LDS 722 into Aluminophosphate 1D Nanochannels, Chem. – Eur. J., 2016, 22(44), 15700–15711, DOI:10.1002/chem.201601736.
- G. Y. Guo, K. C. Chu, D. Wang and C. Duan, Linear and Nonlinear Optical Properties of Carbon Nanotubes from First-Principles Calculations, Phys. Rev. B: Condens. Matter Mater. Phys., 2004, 69(20), 205416, DOI:10.1103/PhysRevB.69.205416.
- L. Vivien, E. Anglaret, D. Riehl, F. Hache, F. Bacou, M. Andrieux, F. Lafonta, C. Journet, C. Goze, M. Brunet and P. Bernier, Optical Limiting Properties of Singlewall Carbon Nanotubes, Opt. Commun., 2000, 174(1–4), 271–275, DOI:10.1016/S0030-4018(99)00656-2.
- S. R. Mishra, H. S. Rawat, S. C. Mehendale, K. C. Rustagi, A. K. Sood, R. Bandyopadhyay, A. Govindaraj and C. N. R. Rao, Optical Limiting in Single-Walled Carbon Nanotube Suspensions, Chem. Phys. Lett., 2000, 317(3–5), 510–514, DOI:10.1016/S0009-2614(99)01304-4.
- J. Wang, Y. Chen and W. J. Blau, Carbon Nanotubes and Nanotube Composites for Nonlinear Optical Devices, J. Mater. Chem., 2009, 19(40), 7425, 10.1039/b906294g.
- M. Feng, H. Zhan and Y. Chen, Nonlinear Optical and Optical Limiting Properties of Graphene Families, Appl. Phys. Lett., 2010, 96(3), 033107, DOI:10.1063/1.3279148.
- X. Liu, D. Han, Z. Sun, C. Zeng, H. Lu, D. Mao, Y. Cui and F. Wang, Versatile Multi-Wavelength Ultrafast Fiber Laser Mode-Locked by Carbon Nanotubes, Sci. Rep., 2013, 3(1), 2718, DOI:10.1038/srep02718.
- J. L. Oudar, Optical Nonlinearities of Conjugated Molecules. Stilbene Derivatives and Highly Polar Aromatic Compounds, J. Chem. Phys., 1977, 67(2), 446–457, DOI:10.1063/1.434888.
- Y. Zhang and W. J. Blau, Dipoles Align inside a Nanotube, Nat. Nanotechnol., 2015, 10(3), 205–206, DOI:10.1038/nnano.2015.9.
- T. Yumura and W. Yamamoto, Importance of the Alignment of Polar π Conjugated Molecules inside Carbon Nanotubes in Determining Second-Order Non-Linear Optical Properties, Phys. Chem. Chem. Phys., 2017, 19, 24819–24828, 10.1039/c7cp03128a.
- S. Sanyal, C. Sissa, F. Terenzionai and S. K. Pati, Painelli, anna. Superlinear Amplification of the First Hyperpolarizability of Linear Aggregates of DANS Molecules, Phys. Chem. Chem. Phys., 2017, 19, 24979–24984 RSC 10.1039/c7cp04732k.
- S. A. Maier, Spectroscopy and Sensing, in Plasmonics: Fundamentals and Applications, ed. S. A. Maier, New York, NY, 2007, pp. 177–191 DOI:10.1007/0-387-37825-1_10.
- L. Novotny and B. Hecht, Principles of Nano-Optics, Cambridge University Press, Cambridge, 2nd edn, 2012, ch. 8 and 9 DOI:10.1017/CBO9780511794193.
- R. Zhang, Y. Zhang, Z. C. Dong, S. Jiang, C. Zhang, L. G. Chen, L. Zhang, Y. Liao, J. Aizpurua, Y. Luo, J. L. Yang and J. G. Hou, Chemical Mapping of a Single Molecule by Plasmon-Enhanced Raman Scattering, Nature, 2013, 498(7452), 82–86, DOI:10.1038/nature12151.
- N. J. Halas, S. Lal, W.-S. Chang, S. Link and P. Nordlander, Plasmons in Strongly Coupled Metallic Nanostructures, Chem. Rev., 2011, 111(6), 3913–3961, DOI:10.1021/cr200061k.
- J. Langer, D. Jimenez de Aberasturi, J. Aizpurua, R. A. Alvarez-Puebla, B. Auguié, J. J. Baumberg, G. C. Bazan, S. E. J. Bell, A. Boisen, A. G. Brolo, J. Choo, D. Cialla-May, V. Deckert, L. Fabris, K. Faulds, F. J. García de Abajo, R. Goodacre, D. Graham, A. J. Haes, C. L. Haynes, C. Huck, T. Itoh, M. Käll, J. Kneipp, N. A. Kotov, H. Kuang, E. C. Le Ru, H. K. Lee, J.-F. Li, X. Y. Ling, S. A. Maier, T. Mayerhöfer, M. Moskovits, K. Murakoshi, J.-M. Nam, S. Nie, Y. Ozaki, I. Pastoriza-Santos, J. Perez-Juste, J. Popp, A. Pucci, S. Reich, B. Ren, G. C. Schatz, T. Shegai, S. Schlücker, L.-L. Tay, K. G. Thomas, Z.-Q. Tian, R. P. Van Duyne, T. Vo-Dinh, Y. Wang, K. A. Willets, C. Xu, H. Xu, Y. Xu, Y. S. Yamamoto, B. Zhao and L. M. Liz-Marzán, Present and Future of Surface-Enhanced Raman Scattering, ACS Nano, 2020, 14(1), 28–117, DOI:10.1021/acsnano.9b04224.
- N. S. Mueller and S. Reich, Modeling Surface-Enhanced Spectroscopy With Perturbation Theory, Front. Chem., 2019, 7, 470, DOI:10.3389/fchem.2019.00470.
- W. Zhu and K. B. Crozier, Quantum Mechanical Limit to Plasmonic Enhancement as Observed by Surface-Enhanced Raman Scattering, Nat. Commun., 2014, 5(1), 1–8, DOI:10.1038/ncomms6228.
- W. Zhu, R. Esteban, A. G. Borisov, J. J. Baumberg, P. Nordlander, H. J. Lezec, J. Aizpurua and K. B. Crozier, Quantum Mechanical Effects in Plasmonic Structures with Subnanometre Gaps, Nat. Commun., 2016, 7(1), 1–14, DOI:10.1038/ncomms11495.
- M. Fleischmann, P. J. Hendra and A. J. McQuillan, Raman Spectra of Pyridine Adsorbed at a Silver Electrode, Chem. Phys. Lett., 1974, 26(2), 163–166, DOI:10.1016/0009-2614(74)85388-1.
- D. L. Jeanmaire and R. P. Van Duyne, Surface Raman Spectroelectrochemistry: Part I. Heterocyclic, Aromatic, and Aliphatic Amines Adsorbed on the Anodized Silver Electrode, J. Electroanal. Chem. Interfacial Electrochem., 1977, 84(1), 1–20, DOI:10.1016/S0022-0728(77)80224-6.
- S. Wasserroth, S. Heeg, N. S. Mueller, P. Kusch, U. Hübner, E. Gaufrès, N. Y.-W. Tang, R. Martel, A. Vijayaraghavan and S. Reich, Resonant, Plasmonic Raman Enhancement of α-6T Molecules Encapsulated in Carbon Nanotubes, J. Phys. Chem. C, 2019, 123(16), 10578–10585, DOI:10.1021/acs.jpcc.9b01600.
- S. Heeg, R. Fernandez-Garcia, A. Oikonomou, F. Schedin, R. Narula, S. A. Maier, A. Vijayaraghavan and S. Reich, Polarized Plasmonic Enhancement by Au Nanostructures Probed through Raman Scattering of Suspended Graphene, Nano Lett., 2013, 13(1), 301–308, DOI:10.1021/nl3041542.
- S. Heeg, A. Oikonomou, R. Fernandez-Garcia, C. Lehmann, S. A. Maier, A. Vijayaraghavan and S. Reich, Plasmon-Enhanced Raman Scattering by Carbon Nanotubes Optically Coupled with Near-Field Cavities, Nano Lett., 2014, 14(4), 1762–1768, DOI:10.1021/nl404229w.
- L. Jensen, C. M. Aikens and G. C. Schatz, Electronic Structure Methods for Studying Surface-Enhanced Raman Scattering, Chem. Soc. Rev., 2008, 37(5), 1061–1073, 10.1039/B706023H.
- S. Heeg, N. Clark, A. Oikonomou, A. Vijayaraghavan and S. Reich, Plasmon-Enhanced Raman Scattering by Suspended Carbon Nanotubes, Phys. Status Solidi RRL – Rapid Res. Lett., 2014, 08(09), 785–789, DOI:10.1002/pssr.201409253.
- S. Heeg, N. Clark and A. Vijayaraghavan, Probing Hotspots of Plasmon-Enhanced Raman Scattering by Nanomanipulation of Carbon Nanotubes, Nanotechnology, 2018, 29(46), 465710, DOI:10.1088/1361-6528/aaded9.
- M. Takase, H. Ajiki, Y. Mizumoto, K. Komeda, M. Nara, H. Nabika, S. Yasuda, H. Ishihara and K. Murakoshi, Selection-Rule Breakdown in Plasmon-Induced Electronic Excitation of an Isolated Single-Walled Carbon Nanotube, Nat. Photonics, 2013, 7(7), 550–554, DOI:10.1038/nphoton.2013.129.
- R. Chikkaraddy, B. Nijs, F. de; Benz, S. J. Barrow, O. A. Scherman, E. Rosta, A. Demetriadou, P. Fox, O. Hess and J. J. Baumberg, Single-Molecule Strong Coupling at Room Temperature in Plasmonic Nanocavities, Nature, 2016, 535(7610), 127–130, DOI:10.1038/nature17974.
- S. Heeg, N. S. Mueller, S. Wasserroth, P. Kusch and S. Reich, Experimental Tests of Surface-Enhanced Raman Scattering: Moving beyond the Electromagnetic Enhancement Theory, J. Raman Spectrosc., 2021, 52(2), 310–322, DOI:10.1002/jrs.6014.
- Z. J. Lapin, R. Beams, L. G. Cançado and L. Novotny, Near-Field Raman Spectroscopy of Nanocarbon Materials, Faraday Discuss., 2015, 184(0), 193–206, 10.1039/C5FD00050E.
- A. Hartschuh, E. J. Sánchez, X. S. Xie and L. Novotny, High-Resolution Near-Field Raman Microscopy of Single-Walled Carbon Nanotubes, Phys. Rev. Lett., 2003, 90(9), 095503, DOI:10.1103/PhysRevLett.90.095503.
- A. Jorio; L. G. Cançado; S. Heeg; L. Novotny and A. Hartschuh, Tip-Enhanced Spectroscopy and Imaging of Carbon Nanomaterials, Handbook of Carbon Nanomaterials; World Scientific Series on Carbon Nanoscience, World Scientific, 2019, vol. 9 and 10, pp. 175–221 DOI:10.1142/9789813235465_0005.
- C. S. Casari, M. Tommasini, R. R. Tykwinski and A. Milani, Carbon-Atom Wires: 1-D Systems with Tunable Properties, Nanoscale, 2016, 8(8), 4414–4435, 10.1039/C5NR06175J.
- C. D. Tschannen, G. Gordeev, S. Reich, L. Shi, T. Pichler, M. Frimmer, L. Novotny and S. Heeg, Raman Scattering Cross Section of Confined Carbyne, Nano Lett., 2020, 20(9), 6750–6755, DOI:10.1021/acs.nanolett.0c02632.
- C. D. Tschannen, M. Frimmer, G. Gordeev, T. L. Vasconcelos, L. Shi, T. Pichler, S. Reich, S. Heeg and L. Novotny, Anti-Stokes Raman Scattering of Single Carbyne Chains, ACS Nano, 2021, 15(7), 12249–12255, DOI:10.1021/acsnano.1c03893.
- N. S. Mueller, S. Juergensen, K. Höflich, S. Reich and P. Kusch, Excitation-Tunable Tip-Enhanced Raman Spectroscopy, J. Phys. Chem. C, 2018, 122(49), 28273–28279, DOI:10.1021/acs.jpcc.8b10272.
- N. Fakhri, F. C. MacKintosh, B. Lounis, L. Cognet and M. Pasquali, Brownian Motion of Stiff Filaments in a Crowded Environment, Science, 2010, 330(6012), 1804–1807, DOI:10.1126/science.1197321.
- Z. Liu, S. Tabakman, S. Sherlock, X. Li, Z. Chen, K. Jiang, S. Fan and H. Dai, Multiplexed Five-Color Molecular Imaging of Cancer Cells and Tumor Tissues with Carbon Nanotube Raman Tags in the near-Infrared, Nano Res., 2010, 3(3), 222–233, DOI:10.1007/s12274-010-1025-1.
- Q. Ma, M. Jebb, M. F. Tweedle and L. J. Wilson, The Gadonanotubes: Structural Origin of Their High-Performance MRI Contrast Agent Behavior, J. Mater. Chem. B, 2013, 1(42), 5791–5797, 10.1039/C3TB20870B.
- E. J. Rivera, L. A. Tran, M. Hernández-Rivera, D. Yoon, A. G. Mikos, I. A. Rusakova, B. Y. Cheong, M. da G. Cabreira-Hansen, J. T. Willerson, E. C. Perin and L. J. Wilson, Bismuth@US-Tubes as a Potential Contrast Agent for X-Ray Imaging Applications, J. Mater. Chem. B, 2013, 1(37), 4792–4800, 10.1039/C3TB20742K.
- J. M. Ashcroft, K. B. Hartman, K. R. Kissell, Y. Mackeyev, S. Pheasant, S. Young, P. A. W. VanderHeide, A. G. Mikos and L. J. Wilson, Single-Molecule I2@US-Tube Nanocapsules: A New X-Ray Contrast-Agent Design, Adv. Mater., 2007, 19(4), 573–576, DOI:10.1002/adma.200601424.
- Y. A. Mackeyev, J. W. Marks, M. G. Rosenblum and L. J. Wilson, Stable Containment of Radionuclides on the Nanoscale by Cut Single-Wall Carbon Nanotubes, J. Phys. Chem. B, 2005, 109(12), 5482–5484, DOI:10.1021/jp0456436.
- B. Sitharaman, K. R. Kissell, K. B. Hartman, L. A. Tran, A. Baikalov, I. Rusakova, Y. Sun, H. A. Khant, S. J. Ludtke, W. Chiu, S. Laus, É. Tóth, L. Helm, A. E. Merbach and L. J. Wilson, Superparamagnetic Gadonanotubes Are High-Performance MRI Contrast Agents, Chem. Commun., 2005, 3915–3917, 10.1039/B504435A.
- B. M. Maciejewska, A. Warowicka, A. Baranowska-Korczyc, K. Załęski, T. Zalewski, K. K. Kozioł and S. Jurga, Magnetic and Hydrophilic MWCNT/Fe Composites as Potential T2-Weighted MRI Contrast Agents, Carbon, 2015, 94, 1012–1020, DOI:10.1016/j.carbon.2015.07.091.
- S. Y. Hong, G. Tobias, K. T. Al-Jamal, B. Ballesteros, H. Ali-Boucetta, S. Lozano-Perez, P. D. Nellist, R. B. Sim, C. Finucane, S. J. Mather, M. L. H. Green, K. Kostarelos and B. G. Davis, Filled and Glycosylated Carbon Nanotubes for in Vivo Radioemitter Localization and Imaging, Nat. Mater., 2010, 9(6), 485–490, DOI:10.1038/nmat2766.
- U. Weissker, S. Hampel, A. Leonhardt and B. Büchner, Carbon Nanotubes Filled with Ferromagnetic Materials, Materials, 2010, 3(8), 4387–4427, DOI:10.3390/ma3084387.
- X. Liu, I. Marangon, G. Melinte, C. Wilhelm, C. Ménard-Moyon, B. P. Pichon, O. Ersen, K. Aubertin, W. Baaziz, C. Pham-Huu, S. Bégin-Colin, A. Bianco, F. Gazeau and D. Bégin, Design of Covalently Functionalized Carbon Nanotubes Filled with Metal Oxide Nanoparticles for Imaging, Therapy, and Magnetic Manipulation, ACS Nano, 2014, 8(11), 11290–11304, DOI:10.1021/nn5040923.
- R. Marega, F. D. Leo, F. Pineux, J. Sgrignani, A. Magistrato, A. D. Naik, Y. Garcia, L. Flamant, C. Michiels and D. Bonifazi, Functionalized Fe-Filled Multiwalled Carbon Nanotubes as Multifunctional Scaffolds for Magnetization of Cancer Cells, Adv. Funct. Mater., 2013, 23(25), 3173–3184, DOI:10.1002/adfm.201202898.
- M.-L. Chen, Y.-J. He, X.-W. Chen and J.-H. Wang, Quantum Dots Conjugated with Fe3O4-Filled Carbon Nanotubes for Cancer-Targeted Imaging and Magnetically Guided Drug Delivery, Langmuir, 2012, 28(47), 16469–16476, DOI:10.1021/la303957y.
- N. Cottenye, N. Y.-W. Tang, E. Gaufrès, A. Leduc, J. Barbeau and R. Martel, Raman Tags Derived from Dyes Encapsulated inside Carbon Nanotubes for Raman Imaging of Biological Samples, Phys. Status Solidi A, 2014, 211(12), 2790–2794, DOI:10.1002/pssa.201431401.
- G. Hong, A. L. Antaris and H. Dai, Near-Infrared Fluorophores for Biomedical Imaging, Nat. Biomed. Eng., 2017, 1(1), 1–22, DOI:10.1038/s41551-016-0010.
- C. Sun, B. Li, M. Zhao, S. Wang, Z. Lei, L. Lu, H. Zhang, L. Feng, C. Dou, D. Yin, H. Xu, Y. Cheng and F. Zhang, J-Aggregates of Cyanine Dye for NIR-II in Vivo Dynamic Vascular Imaging beyond 1500 Nm, J. Am. Chem. Soc., 2019, 141(49), 19221–19225, DOI:10.1021/jacs.9b10043.
- T. Tanaka, M. Ishitobi, T. Aoyama and S. Matsumoto, Highly Oriented J-Aggregates of Nitroazo Dye and Its Surface-Induced Chromism, Langmuir, 2016, 32(19), 4710–4718, DOI:10.1021/acs.langmuir.6b00289.
- T. A. Hilder and J. M. Hill, Modelling the Encapsulation of the Anticancer Drug Cisplatin into Carbon Nanotubes, Nanotechnology, 2007, 18(27), 275704, DOI:10.1088/0957-4484/18/27/275704.
- T. A. Hilder and J. M. Hill, Probability of Encapsulation of Paclitaxel and Doxorubicin into Carbon Nanotubes, Micro Amp Nano Lett., 2008, 3(2), 41–49, DOI:10.1049/mnl:20080008.
- U. Arsawang, O. Saengsawang, T. Rungrotmongkol, P. Sornmee, K. Wittayanarakul, T. Remsungnen and S. Hannongbua, How Do Carbon Nanotubes Serve as Carriers for Gemcitabine Transport in a Drug Delivery System?, J. Mol. Graph. Model., 2011, 29(5), 591–596, DOI:10.1016/j.jmgm.2010.11.002.
- A. Mejri, D. Vardanega, B. Tangour, T. Gharbi and F. Picaud, Encapsulation into Carbon Nanotubes and Release of Anticancer Cisplatin Drug Molecule, J. Phys. Chem. B, 2015, 119(2), 604–611, DOI:10.1021/jp5102384.
- L. Zhang, G. Peng, J. Li, L. Liang, Z. Kong, H. Wang, L. Jia, X. Wang, W. Zhang and J.-W. Shen, Molecular Dynamics Study on the Configuration and Arrangement of Doxorubicin in Carbon Nanotubes, J. Mol. Liq., 2018, 262, 295–301, DOI:10.1016/j.molliq.2018.04.097.
- V. V. Chaban, T. I. Savchenko, S. M. Kovalenko and O. V. Prezhdo, Heat-Driven Release of a Drug Molecule from Carbon Nanotubes: A Molecular Dynamics Study, J. Phys. Chem. B, 2010, 114(42), 13481–13486, DOI:10.1021/jp104507g.
- M. Rezvani, M. Darvish Ganji and M. Faghihnasiri, Encapsulation of Lamivudine into Single Walled Carbon Nanotubes: A vdW-DF Study, Phys. E, 2013, 52, 27–33, DOI:10.1016/j.physe.2013.03.024.
- Y. Belmiloud, M. Ouraghi, M. Brahimi, A. Benaboura, D. Charqaoui and B. Tangour, Theoretical Study of the Anti-Human Immuno-Deficiency Virus TIBO Molecule Confined Into Carbon Nanotubes, J. Comput. Theor. Nanosci., 2012, 9(8), 1101–1108, DOI:10.1166/jctn.2012.2150.
- J. Chen, D. Mao, X. Wang, G. Zhou, S. Zeng, L. Chen, C. Dai and S. Feng, Encapsulation and Release of Drug Molecule Pregabalin Based on Ultrashort Single-Walled Carbon Nanotubes, J. Phys. Chem. C, 2019, 123(14), 9567–9574, DOI:10.1021/acs.jpcc.9b00675.
- N. Saikia, A. N. Jha and R. Ch Deka, Dynamics of Fullerene-Mediated Heat-Driven Release of Drug Molecules from Carbon Nanotubes, J. Phys. Chem. Lett., 2013, 4(23), 4126–4132, DOI:10.1021/jz402231p.
- E. Hicks, C. Desgranges and J. Delhommelle, Adsorption and Diffusion of the Antiparkinsonian Drug Amantadine in Carbon Nanotubes, Mol. Simul, 2014, 40(7–9), 656–663, DOI:10.1080/08927022.2013.841908.
- Q. Xue, N. Jing, L. Chu, C. Ling and H. Zhang, Release of Encapsulated Molecules from Carbon Nanotubes Using a Displacing Method: A MD Simulation Study, RSC Adv, 2012, 2(17), 6913–6920, 10.1039/C2RA20446K.
- H. Gao, Y. Kong, D. Cui and C. S. Ozkan, Spontaneous Insertion of DNA Oligonucleotides into Carbon Nanotubes, Nano Lett., 2003, 3(4), 471–473, DOI:10.1021/nl025967a.
- Q. Chen, Q. Wang, Y.-C. Liu, T. Wu, Y. Kang, J. D. Moore and K. E. Gubbins, Energetics Investigation on Encapsulation of Protein/Peptide Drugs in Carbon Nanotubes, J. Chem. Phys., 2009, 131(1), 015101, DOI:10.1063/1.3148025.
- Y. Kang, Q. Wang, Y.-C. Liu, J.-W. Shen and T. Wu, Diameter Selectivity of Protein Encapsulation in Carbon Nanotubes, J. Phys. Chem. B, 2010, 114(8), 2869–2875, DOI:10.1021/jp905995s.
- S. Hampel, D. Kunze, D. Haase, K. Krämer, M. Rauschenbach, M. Ritschel, A. Leonhardt, J. Thomas, S. Oswald, V. Hoffmann and B. Büchner, Carbon Nanotubes Filled with a Chemotherapeutic Agent: A Nanocarrier Mediates Inhibition of Tumor Cell Growth, Nanomed., 2008, 3(2), 175–182, DOI:10.2217/17435889.3.2.175.
- L. Wu, C. Man, H. Wang, X. Lu, Q. Ma, Y. Cai and W. Ma, PEGylated Multi-Walled Carbon Nanotubes for Encapsulation and Sustained Release of Oxaliplatin, Pharm. Res., 2013, 30(2), 412–423, DOI:10.1007/s11095-012-0883-5.
- L. Muzi, C. Ménard-Moyon, J. Russier, J. Li, C. F. Chin, W. H. Ang, G. Pastorin, G. Risuleo and A. Bianco, Diameter-Dependent Release of a Cisplatin pro-Drug from Small and Large Functionalized Carbon Nanotubes, Nanoscale, 2015, 7(12), 5383–5394, 10.1039/C5NR00220F.
- A. Guven, I. A. Rusakova, M. T. Lewis and L. J. Wilson, Cisplatin@US-Tube Carbon Nanocapsules for Enhanced Chemotherapeutic Delivery, Biomaterials, 2012, 33(5), 1455–1461, DOI:10.1016/j.biomaterials.2011.10.060.
- A. Guven, G. J. Villares, S. G. Hilsenbeck, A. Lewis, J. D. Landua, L. E. Dobrolecki, L. J. Wilson and M. T. Lewis, Carbon Nanotube Capsules Enhance the in Vivo Efficacy of Cisplatin, Acta Biomater., 2017, 58, 466–478, DOI:10.1016/j.actbio.2017.04.035.
- G. Ciofani, G. G. Genchi, I. Liakos, A. Athanassiou, D. Dinucci, F. Chiellini and V. Mattoli, A Simple Approach to Covalent Functionalization of Boron Nitride Nanotubes, J. Colloid Interface Sci., 2012, 374(1), 308–314, DOI:10.1016/j.jcis.2012.01.049.
- D. García-Toral, M. González-Melchor, J. F. Rivas-Silva, E. Meneses-Juárez, J. Cano-Ordaz and G. H. Cocoletzi, Dopamine and Caffeine Encapsulation within Boron Nitride (14,0) Nanotubes: Classical Molecular Dynamics and First Principles Calculations, J. Phys. Chem. B, 2018, 122(22), 5885–5896, DOI:10.1021/acs.jpcb.8b00116.
- M. E. Khalifi, E. Duverger, T. Gharbi, H. Boulahdour and F. Picaud, Theoretical Demonstration of the Potentiality of Boron Nitride Nanotubes to Encapsulate Anticancer Molecule, Phys. Chem. Chem. Phys., 2015, 17(44), 30057–30064, 10.1039/C5CP05148G.
- S. Roosta, S. J. Nikkhah, M. Sabzali and S. M. Hashemianzadeh, Molecular Dynamics Simulation Study of Boron-Nitride Nanotubes as a Drug Carrier: From Encapsulation to Releasing, RSC Adv., 2016, 6(11), 9344–9351, 10.1039/C5RA22945F.
- I. Dierking, G. Scalia and P. Morales, Liquid Crystal–Carbon Nanotube Dispersions, J. Appl. Phys., 2005, 97(4), 044309, DOI:10.1063/1.1850606.
- C. Zamora-Ledezma, C. Blanc, N. Puech, M. Maugey, C. Zakri, E. Anglaret and P. Poulin, Conductivity Anisotropy of Assembled and Oriented Carbon Nanotubes, Phys. Rev. E: Stat., Nonlinear, Soft Matter Phys., 2011, 84(6), 062701, DOI:10.1103/PhysRevE.84.062701.
- C. Zamora-Ledezma, C. Blanc, M. Maugey, C. Zakri, P. Poulin and E. Anglaret, Anisotropic Thin Films of Single-Wall Carbon Nanotubes from Aligned Lyotropic Nematic Suspensions, Nano Lett., 2008, 8(12), 4103–4107, DOI:10.1021/nl801525x.
- A. Baydin, N. Komatsu, F. Tay, S. Ghosh, T. Makihara, G. T. Noe and J. Kono, Giant Terahertz Polarization Rotation in Ultrathin Films of Aligned Carbon Nanotubes, Optica, 2021, 8(5), 760–764, DOI:10.1364/OPTICA.422826.
- Z. J. Jakubek, M. Chen, Y. Martinez Rubi, B. Simard and S. Zou, Conformational Order in Aggregated Rra-P3HT as an Indicator of Quality of Boron Nitride Nanotubes, J. Phys. Chem. Lett., 2020, 11(10), 4179–4185, DOI:10.1021/acs.jpclett.0c01023.
- Y. Martinez-Rubi, Z. J. Jakubek, M. B. Jakubinek, K. S. Kim, F. Cheng, M. Couillard, C. Kingston and B. Simard, Self-Assembly and Visualization of Poly(3-Hexyl-Thiophene) Chain Alignment along Boron Nitride Nanotubes, J. Phys. Chem. C, 2015, 119(47), 26605–26610, DOI:10.1021/acs.jpcc.5b09049.
- A. Badon, J.-B. Marceau, C. Allard, F. Fossard, A. Loiseau, L. Cognet, E. Flahaut, G. Recher, N. Izard, R. Martel and E. Gaufrès, Fluorescence Anisotropy Using Highly Polarized Emitting Dyes Confined inside BNNTs, Mater. Horiz., 2023, 10(3), 983–992, 10.1039/D2MH01239A.
- D. D. Tune, B. S. Flavel, R. Krupke and J. G. Shapter, Carbon Nanotube-Silicon Solar Cells, Adv. Energy Mater., 2012, 2(9), 1043–1055, DOI:10.1002/aenm.201200249.
- D. D. Tune and B. S. Flavel, Advances in Carbon Nanotube–Silicon Heterojunction Solar Cells, Adv. Energy Mater., 2018, 8(15), 1703241, DOI:10.1002/aenm.201703241.
- D. Zielke, C. Niehaves, W. Lövenich, A. Elschner, M. Hörteis and J. Schmidt, Organic-Silicon Solar Cells Exceeding 20% Efficiency, Energy Procedia, 2015, 77(Supplement C), 331–339, DOI:10.1016/j.egypro.2015.07.047.
- X. Li, Z. Lv and H. Zhu, Carbon/Silicon Heterojunction Solar Cells: State of the Art and Prospects, Adv. Mater., 2015, 27(42), 6549–6574, DOI:10.1002/adma.201502999.
- L. Wang, H. Q. Liu, R. M. Konik, J. A. Misewich and S. S. Wong, Carbon Nanotube-Based Heterostructures for Solar Energy Applications, Chem. Soc. Rev., 2013, 42(20), 8134–8156, 10.1039/c3cs60088b.
- M. Pfohl, D. D. Tune, A. Graf, J. Zaumseil, R. Krupke and B. S. Flavel, Fitting Single-Walled Carbon Nanotube Optical Spectra, ACS Omega, 2017, 2(3), 1163–1171, DOI:10.1021/acsomega.6b00468.
- L. Yang, P. Kim, H. M. Meyer and S. Agnihotri, Aging of Nanocarbons in Ambient Conditions: Probable Metastability of Carbon Nanotubes, J. Colloid Interface Sci., 2009, 338(1), 128–134, DOI:10.1016/j.jcis.2009.06.017.
- G. Chen, T. M. Paronyan, E. M. Pigos and A. R. Harutyunyan, Enhanced Gas Sensing in Pristine Carbon Nanotubes under Continuous Ultraviolet Light Illumination, Sci. Rep., 2012, 2, 343, DOI:10.1038/srep00343.
- T. Durkop, S. A. Getty, E. Cobas and M. S. Fuhrer, Extraordinary Mobility in Semiconducting Carbon Nanotubes, Nano Lett., 2004, 4(1), 35–39, DOI:10.1021/nl034841q.
- C. G. Hu, Z. L. Chen, A. G. Shen, X. C. Shen, H. Li and S. S. Hu, Water-Soluble Single-Walled Carbon Nanotubes via Noncovalent Functionalization by a Rigid, Planar and Conjugated Diazo Dye, Carbon, 2006, 44(3), 428–434, DOI:10.1016/j.carbon.2005.09.003.
- A. Javey, H. Kim, M. Brink, Q. Wang, A. Ural, J. Guo, P. McIntyre, P. McEuen, M. Lundstrom and H. J. Dai, High-Kappa Dielectrics for Advanced Carbon-Nanotube Transistors and Logic Gates, Nat. Mater., 2002, 1(4), 241–246, DOI:10.1038/nmat769.
- J. Bartelmess, B. Ballesteros, G. de la Torre, D. Kiessling, S. Campidelli, M. Prato, T. Torres and D. M. Guldi, Phthalocyanine-Pyrene Conjugates: A Powerful Approach toward Carbon Nanotube Solar Cells, J. Am. Chem. Soc., 2010, 132(45), 16202–16211, DOI:10.1021/ja107131r.
- N. M. Gabor, Z. H. Zhong, K. Bosnick, J. Park and P. L. McEuen, Extremely Efficient Multiple Electron-Hole Pair Generation in Carbon Nanotube Photodiodes, Science, 2009, 325(5946), 1367–1371, DOI:10.1126/science.1176112.
- A. Graf, C. Murawski, Y. Zakharko, J. Zaumseil and M. C. Gather, Infrared Organic Light-Emitting Diodes with Carbon Nanotube Emitters, Adv. Mater., 2018, 30(12), 1706711, DOI:10.1002/adma.201706711 ARTN.
- V. F. Pyatkov, S. Khasminskaya, B. S. Flavel, F. Hennrich, M. D. M. Kappes, R. Krupke and W. H. P. Pernice, Cavity-Enhanced Light Emission from Electrically Driven Carbon Nanotubes, Nat. Photonics, 2016, 10, 420 CrossRef.
- E. Adam, C. M. Aguirre, L. Marty, B. C. St-Antoine, F. Meunier, P. Desjardins, D. Ménard and R. Martel, Electroluminescence from Single-Wall Carbon Nanotube Network Transistors, Nano Lett., 2008, 8(8), 2351–2355, DOI:10.1021/nl8011825.
- C. M. Aguirre, S. Auvray, S. Pigeon, R. Izquierdo, P. Desjardins and R. Martel, Carbon Nanotube Sheets as Electrodes in Organic Light-Emitting Diodes, Appl. Phys. Lett., 2006, 88, 183104, DOI:10.1063/1.2199461.
- A. Falco, L. Cina, G. Scarpa, P. Lugli and A. Abdellah, Fully-Sprayed and Flexible Organic Photodiodes with Transparent Carbon Nanotube Electrodes, Acs Appl. Mater. Interfaces, 2014, 6(13), 10593–10601, DOI:10.1021/am5022123.
- J. Li, L. Hu, L. Wang, Y. Zhou, G. Gruner and T. J. Marks, Organic Light-Emitting Diodes Having Carbon Nanotube Anodes, Nano Lett., 2006, 6(11), 2472–2477, DOI:10.1021/nl061616a.
- E. Gaufrès, N. Izard, A. Noury, X. Le Roux, G. Rasigade, A. Beck and L. Vivien, Light Emission in Silicon from Carbon Nanotubes, ACS Nano, 2012, 6(5), 3813–3819, DOI:10.1021/nn204924n.
- N. Izard, E. Gaufrès, X. L. Roux, S. Kazaoui, Y. Murakami, D. Marris-Morini, E. Cassan, S. Maruyama and L. Vivien, Electroabsorption Study of Index-Defined Semiconducting Carbon Nanotubes – A Direct Probe into Carbon Nanotube Excitonic States, Eur. Phys. J.: Appl. Phys., 2011, 55(2), 20401, DOI:10.1051/epjap/2011110034.
- E. Kymakis and G. A. J. Amaratunga, Photovoltaic Cells Based on Dye-Sensitisation of Single-Wall Carbon Nanotubes in a Polymer Matrix, Sol. Energy Mater. Sol. Cells, 2003, 80(4), 465–472, DOI:10.1016/j.solmat.2003.08.013.
- E. Kymakis and G. A. J. Amaratunga, Single-Wall Carbon Nanotube/Conjugated Polymer Photovoltaic Devices, Appl. Phys. Lett., 2002, 80(1), 112–114, DOI:10.1063/1.1428416.
- P. Fournet, J. N. Coleman, B. Lahr, A. Drury, W. J. Blau, D. F. O’Brien and H. H. Horhold, Enhanced Brightness in Organic Light-Emitting Diodes Using a Carbon Nanotube Composite as an Electron-Transport Layer, J. Appl. Phys., 2001, 90(2), 969–975, DOI:10.1063/1.1383023.
- E. C. W. Ou, L. B. Hu, G. C. R. Raymond, O. K. Soo, J. S. Pan, Z. Zheng, Y. Park, D. Hecht, G. Irvin, P. Drzaic and G. Gruner, Surface-Modified Nanotube Anodes for High Performance Organic Light-Emitting Diode, ACS Nano, 2009, 3(8), 2258–2264, DOI:10.1021/nn900406n.
- J. M. Holt, A. J. Ferguson, N. Kopidakis, B. A. Larsen, J. Bult, G. Rumbles and J. L. Blackburn, Prolonging Charge Separation in P3HT-SWNT Composites Using Highly Enriched Semiconducting Nanotubes, Nano Lett., 2010, 10(11), 4627–4633, DOI:10.1021/nl102753z.
- S. Q. Ren, M. Bernardi, R. R. Lunt, V. Bulovic, J. C. Grossman and S. Gradecak, Toward Efficient Carbon Nanotube/P3HT Solar Cells: Active Layer Morphology, Electrical, and Optical Properties, Nano Lett., 2011, 11(12), 5316–5321, DOI:10.1021/nl202796u.
- H. S. Woo, R. Czerw, S. Webster, D. L. Carroll, J. Ballato, A. E. Strevens, D. O’Brien and W. J. Blau, Hole Blocking in Carbon Nanotube-Polymer Composite Organic Light-Emitting Diodes Based on Poly (m-Phenylene Vinylene-Co-2,5-Dioctoxy-p-Phenylene Vinylene), Appl. Phys. Lett., 2000, 77, 1393–1395, DOI:10.1063/1.1290275.
- J. B. Dominick, S. S. Nathaniel and S. A. Michael, Dissociating Excitons Photogenerated in Semiconducting Carbon Nanotubes at Polymeric Photovoltaic Heterojunction Interfaces, ACS Nano, 2010, 4, 5657–5664 CrossRef PubMed.
- D. O. Bellisario, R. M. Jain, Z. Ulissi and M. S. Strano, Deterministic Modelling of Carbon Nanotube Near-Infrared Solar Cells, Energy Environ. Sci., 2014, 7(11), 3769–3781, 10.1039/C4EE01765J.
- M. Engel, K. E. Moore, A. Alam, S. Dehm, R. Krupke and B. S. Flavel, Photocurrent Spectroscopy of (n,m) Sorted Solution-Processed Single-Walled Carbon Nanotubes, ACS Nano, 2014, 8(9), 9324–9331 CrossRef CAS PubMed.
- M. Pfohl, K. Glaser, J. Ludwig, D. D. Tune, S. Dehm, C. Kayser, A. Colsmann, R. Krupke and B. S. Flavel, Performance Enhancement of Polymer Free Carbon Nanotube Solar Cells via Transfer Matrix Modeling, Adv. Energy Mater., 2016, 6(1), 1501345 CrossRef.
- S. L. Guillot, K. S. Mistry, A. D. Avery, J. Richard, A. M. Dowgiallo, P. F. Ndione, J. van de Lagemaat, M. O. Reese and J. L. Blackburn, Precision Printing and Optical Modeling of Ultrathin SWCNT/C-60 Heterojunction Solar Cells, Nanoscale, 2015, 7(15), 6556–6566, 10.1039/c5nr00205b.
- M. J. Shea and M. S. Arnold, 1% Solar Cells Derived from Ultrathin Carbon Nanotube Photoabsorbing Films, Appl. Phys. Lett., 2013, 102, 243101, DOI:10.1063/1.4811359.
- S. Campidelli, B. Ballesteros, A. Filoramo, D. D. Diaz, G. de la Torre, T. Torres, G. M. A. Rahman, C. Ehli, D. Kiessling, F. Werner, V. Sgobba, D. M. Guldi, C. Cioffi, M. Prato and J. P. Bourgoin, Facile Decoration of Functionalized Single-Wall Carbon Nanotubes with Phthalocyanines via “Click Chemistry.”, J. Am. Chem. Soc., 2008, 130(34), 11503–11509, DOI:10.1021/ja8033262.
- C. Ehli, G. M. A. Rahman, N. Jux, D. Balbinot, D. M. Guldi, F. Paolucci, M. Marcaccio, D. Paolucci, M. Melle-Franco, F. Zerbetto, S. Campidelli and M. Prato, Interactions in Single Wall Carbon Nanotubes/Pyrene/Porphyrin Nanohybrids, J. Am. Chem. Soc., 2006, 128(34), 11222–11231, DOI:10.1021/ja0624974.
- D. M. Guldi, G. M. A. Rahman, M. Prato, N. Jux, S. H. Qin and W. Ford, Single-Wall Carbon Nanotubes as Integrative Building Blocks for Solar-Energy Conversion, Angew. Chem., Int. Ed., 2005, 44(13), 2015–2018, DOI:10.1002/anie.200462416.
- J. M. Harris, M. R. Semler, S. May, J. A. Fagan and E. K. Hobbie, Nature of Record Efficiency Fluid-Processed Nanotube-Silicon Heterojunctions, J. Phys. Chem. C, 2015, 119(19), 10295–10303, DOI:10.1021/acs.jpcc.5b02626.
- J. Q. Wei, Y. Jia, Q. K. Shu, Z. Y. Gu, K. L. Wang, D. M. Zhuang, G. Zhang, Z. C. Wang, J. B. Luo, A. Y. Cao and D. H. Wu, Double-Walled Carbon Nanotube Solar Cells, Nano Lett., 2007, 7(8), 2317–2321, DOI:10.1021/nl070961c.
- K. Cui, Y. Qian, I. Jeon, A. Anisimov, Y. Matsuo, E. I. Kauppinen and S. Maruyama, Scalable and Solid-State Redox Functionalization of Transparent Single-Walled Carbon Nanotube Films for Highly Efficient and Stable Solar Cells, Adv. Energy Mater., 2017, 7(18), 1700449, DOI:10.1002/aenm.201700449.
- Y. Jung, X. K. Li, N. K. Rajan, A. D. Tayor and M. A. Reed, Record High Efficiency Single-Walled Carbon Nanotube/Silicon p-n Junction Solar Cells, Nano Lett., 2013, 13(1), 95–99, DOI:10.1021/nl3035652.
- M. D. Ye, X. R. Wen, M. Y. Wang, J. Iocozzia, N. Zhang, C. J. Lin and Z. Q. Lin, Recent Advances in Dye-Sensitized Solar Cells: From Photoanodes, Sensitizers and Electrolytes to Counter Electrodes, Mater. Today, 2015, 18(3), 155–162, DOI:10.1016/j.mattod.2014.09.001.
- M. Batmunkh, M. J. Biggs and J. G. Shapter, Carbon Nanotubes for Dye-Sensitized Solar Cells, Small, 2015, 11(25), 2963–2989, DOI:10.1002/smll.201403155.
- M. Chen and L. L. Shao, Review on the Recent Progress of Carbon Counter Electrodes for Dye-Sensitized Solar Cells, Chem. Eng. J., 2016, 304, 629–645, DOI:10.1016/j.cej.2016.07.001.
- Q. Liu, J. Mao, Z. F. Liu, N. Zhang, Y. Wang, L. Y. Yang, S. G. Yin and Y. S. Chen, A Photovoltaic Device Based on a Poly(Phenyleneethynylene)/SWNT Composite Active Layer, Nanotechnology, 2008, 19, 115601, DOI:10.1088/0957-4484/19/11/115601.
- D. J. Bindl, N. S. Safron and M. S. Arnold, Dissociating Excitons Photogenerated in Semiconducting Carbon Nanotubes at Polymeric Photovoltaic Heterojunction Interfaces, ACS Nano, 2010, 4(10), 5657–5664, DOI:10.1021/nn1012397.
- M. Pfohl, K. Glaser, A. Graf, A. Mertens, D. D. Tune, T. Puerckhauer, A. Alam, L. Wei, Y. Chen, J. Zaumseil, A. Colsmann, R. Krupke and B. S. Flavel, Probing the Diameter Limit of Single Walled Carbon Nanotubes in SWCNT:Fullerene Solar Cells, Adv. Energy Mater., 2016, 6(21), 1600890 CrossRef.
- R. M. Jain, R. Howden, K. Tvrdy, S. Shimizu, A. J. Hilmer, T. P. McNicholas, K. K. Gleason and M. S. Strano, Polymer-Free Near-Infrared Photovoltaics with Single Chirality (6,5) Semiconducting Carbon Nanotube Active Layers, Adv. Mater., 2012, 24(32), 4436–4439, DOI:10.1002/adma.201202088.
- M. G. Gong, T. A. Shastry, Y. Xie, M. Bernardi, D. Jasion, K. A. Luck, T. J. Marks, J. C. Grossman, S. Q. Ren and M. C. Hersam, Polychiral Semiconducting Carbon Nanotube-Fullerene Solar Cells, Nano Lett., 2014, 14(9), 5308–5314, DOI:10.1021/nl5027452.
- A. Alam, S. Dehm, F. Hennrich, Y. Zakharko, A. Graf, M. Pfohl, I. M. Hossain, M. M. Kappes, J. Zaumseil, R. Krupke and B. S. Flavel, Photocurrent Spectroscopy of Dye-Sensitized Carbon Nanotubes, Nanoscale, 2017, 9(31), 11205–11213, 10.1039/C7NR04022A.
- X. Zhou, T. Zifer, B. M. Wong, K. L. Krafcik, F. Léonard and A. L. Vance, Color Detection Using Chromophore-Nanotube Hybrid Devices, Nano Lett., 2009, 9(3), 1028–1033, DOI:10.1021/nl8032922.
- N. Murakami, H. Miyake, T. Tajima, K. Nishikawa, R. Hirayama and Y. Takaguchi, Enhanced Photosensitized Hydrogen Production by Encapsulation of Ferrocenyl Dyes into Single-Walled Carbon Nanotubes, J. Am. Chem. Soc., 2018, 140(11), 3821–3824, DOI:10.1021/jacs.7b12845.
- C. Bosch-Navarro, B. Matt, G. Izzet, C. Romero-Nieto, K. Dirian, A. Raya, S. I. Molina, A. Proust, D. M. Guldi, C. Martí-Gastaldo and E. Coronado, Charge Transfer Interactions in Self-Assembled Single Walled Carbon Nanotubes/Dawson–Wells Polyoxometalate Hybrids, Chem. Sci., 2014, 5(11), 4346–4354, 10.1039/C4SC01335B.
- D. D. Tune, F. Hennrich, S. Dehm, M. F. G. Klein, K. Glaser, A. Colsmann, J. G. Shapter, U. Lemmer, M. M. Kappes, R. Krupke and B. S. Flavel, The Role of Nanotubes in Carbon Nanotube-Silicon Solar Cells, Adv. Energy Mater., 2013, 3(8), 1091–1097, DOI:10.1002/aenm.201200949.
- D. D. Tune, A. J. Blanch, R. Krupke, S. B. Flavel and J. G. Shapter, Nanotube Film Metallicity and Its Effect on the Performance of Carbon Nanotube-Silicon Solar Cells, Phys. Status Solidi A, 2014, 211(7), 1479–1487 CrossRef CAS.
- D. D. Tune, S. F. Benjamin, S. F. Jamie, S. Q. Amanda, V. Ellis and J. G. Shapter, Single-Walled Carbon Nanotube/Polyaniline/n-Silicon Solar Cells: Fabrication, Characterization, and Performance Measurements, ChemSusChem, 2013, 6, 320–327 CrossRef CAS PubMed.
- D. D. Tune, N. Mallik, H. Fornasier and B. S. Flavel, Breakthrough Carbon Nanotube–Silicon Heterojunction Solar Cells., Adv. Energy Mater., 2020, 10(1), 1903261, DOI:10.1002/aenm.201903261.
- J. Chen, L. Wan, H. Li, J. Yan, J. Ma, B. Sun, F. Li and B. S. Flavel, A Polymer/Carbon-Nanotube Ink as a Boron-Dopant/Inorganic-Passivation Free Carrier Selective Contact for Silicon Solar Cells with over 21% Efficiency, Adv. Funct. Mater., 2020, 30(38), 2004476, DOI:10.1002/adfm.202004476.
- J. Chen, D. D. Tune, K. Ge, H. Li and B. S. Flavel, Front and Back-Junction Carbon Nanotube-Silicon Solar Cells with an Industrial Architecture, Adv. Funct. Mater., 2020, 30(17), 2000484, DOI:10.1002/adfm.202000484.
- J. Yan, C. Zhang, H. Li, X. Yang, L. Wan, F. Li, K. Qiu, J. Guo, W. Duan, A. Lambertz, W. Lu, D. Song, K. Ding, B. S. Flavel and J. Chen, Stable Organic Passivated Carbon Nanotube–Silicon Solar Cells with an Efficiency of 22%, Adv. Sci., 2021, 8(20), 2102027, DOI:10.1002/advs.202102027.
- X. Li, M. Mariano, L. McMillon-Brown, J.-S. Huang, M. Y. Sfeir, M. A. Reed, Y. Jung and A. D. Taylor, Charge Transfer from Carbon Nanotubes to Silicon in Flexible Carbon Nanotube/Silicon Solar Cells, Small, 2017, 1702387, DOI:10.1002/smll.201702387.
- T. Takenobu, T. Takano, M. Shiraishi, Y. Murakami, M. Ata, H. Kataura, Y. Achiba and Y. Iwasa, Stable and Controlled Amphoteric Doping by Encapsulation of Organic Molecules inside Carbon Nanotubes, Nat. Mater., 2003, 2, 683–688, DOI:10.1038/nmat976.
- V. Sgobba and D. M. Guldi, Carbon Nanotubes-Electronic/Electrochemical Properties and Application for Nanoelectronics and Photonics, Chem. Soc. Rev., 2009, 38(1), 165–184, 10.1039/b802652c.
- N. Tezuka, T. Umeyama, Y. Matano, T. Shishido, K. Yoshida, T. Ogawa, S. Isoda, K. Stranius, V. Chukharev, N. V. Tkachenko, H. Lemmetyinen and H. Imahori, Photophysics and Photoelectrochemical Properties of Nanohybrids Consisting of Fullerene-Encapsulated Single-Walled Carbon Nanotubes and Poly(3-Hexylthiophene), Energy Environ. Sci., 2011, 4(3), 741–750, 10.1039/c0ee00482k.
- M. Monthioux, Filling Single-Wall Carbon Nanotubes, Carbon, 2002, 40(10), 1809–1823, DOI:10.1016/S0008-6223(02)00102-1.
- A. N. Khlobystov, D. A. Britz and G. A. D. Briggs, Molecules in Carbon Nanotubes, Acc. Chem. Res., 2005, 38(12), 901–909, DOI:10.1021/ar040287v.
- J. Lee, H. Kim, S. J. Kahng, G. Kim, Y. W. Son, J. Ihm, H. Kato, Z. W. Wang, T. Okazaki, H. Shinohara and Y. Kuk, Bandgap Modulation of Carbon Nanotubes by Encapsulated Metallofullerenes, Nature, 2002, 415(6875), 1005–1008, DOI:10.1038/4151005a.
- T. Okazaki, S. Okubo, T. Nakanishi, S. K. Joung, T. Saito, M. Otani, S. Okada, S. Bandow and S. Iijima, Optical Band Gap Modification of Single-Walled Carbon Nanotubes by Encapsulated Fullerenes, J. Am. Chem. Soc., 2008, 130(12), 4122–4128, DOI:10.1021/ja711103y.
- R. Hatakeyama, Y. F. Li, T. Y. Kato and T. Kaneko, Infrared Photovoltaic Solar Cells Based on C-60 Fullerene Encapsulated Single-Walled Carbon Nanotubes, Appl. Phys. Lett., 2010, 97, 013104, DOI:10.1063/1.3462313.
- P. V. Kamat, Harvesting Photons with Carbon Nanotubes, Nano Today, 2006, 1(4), 20–27, DOI:10.1016/S1748-0132(06)70113-X.
- Y. P. Gong, P. Adhikari, Q. F. Liu, T. Wang, M. G. Gong, W. L. Chan, W. Y. Ching and J. D. Wu, Designing the Interface of Carbon Nanotube/Biomaterials for High Performance Ultra-Broadband Photodetection, ACS Appl. Mater. Interfaces, 2017, 9(12), 11016–11024, DOI:10.1021/acsami.7b00352.
- C. Ehli, C. Oelsner, D. M. Guldi, A. Mateo-Alonso, M. Prato, C. Schmidt, C. Backes, F. Hauke and A. Hirsch, Manipulating Single-Wall Carbon Nanotubes by Chemical Doping and Charge Transfer with Perylene Dyes, Nat. Chem., 2009, 1(3), 243–249, DOI:10.1038/Nchem.214.
- S. Bhattacharyya, E. Kymakis and G. A. J. Amaratunga, Photovoltaic Properties of Dye Functionalized Single-Wall Carbon Nanotube/Conjugated Polymer Devices, Chem. Mater., 2004, 16(23), 4819–4823, DOI:10.1021/cm0496063.
- D. M. Guldi, G. M. A. Rahman, F. Zerbetto and M. Prato, Carbon Nanotubes in Electron Donor-Acceptor Nanocomposites, Acc. Chem. Res., 2005, 38(11), 871–878, DOI:10.1021/ar040238i.
- D. D. Tune, B. S. Flavel, J. S. Quinton, A. V. Ellis and J. G. Shapter, Single-Walled Carbon Nanotube Network Electrodes for Dye Solar Cells, Sol. Energy Mater. Sol. Cells, 2010, 94(10), 1665–1672 CrossRef CAS.
- F. Wang, G. Dukovic, L. E. Brus and T. F. Heinz, The Optical Resonances in Carbon Nanotubes Arise from Excitons, Science, 2005, 308(5723), 838–841, DOI:10.1126/science.1110265.
- J. Maultzsch, R. Pomraenke, S. Reich, E. Chang, D. Prezzi, A. Ruini, E. Molinari, M. S. Strano, C. Thomsen and C. Lienau, Exciton Binding Energies in Carbon Nanotubes from Two-Photon Photoluminescence, Phys. Rev. B: Condens. Matter Mater. Phys., 2005, 72, 241402(R), DOI:10.1103/physrevb.72.241402.
- F. Wang, D. J. Cho, B. Kessler, J. Deslippe, P. J. Schuck, S. G. Louie, A. Zettl, T. F. Heinz and Y. R. Shen, Observation of Excitons in One-Dimensional Metallic Single-Walled Carbon Nanotubes, Phys. Rev. Lett., 2007, 99, 227401, DOI:10.1103/Physrevlett.99.227401.
- M. S. Arnold, S. I. Stupp and M. C. Hersam, Enrichment of Single-Walled Carbon Nanotubes by Diameter in Density Gradients, Nano Lett., 2005, 5(4), 713–718 CrossRef CAS PubMed.
- X. Huang, R. S. McLean and M. Zheng, High-Resolution Length Sorting and Purification of DNA-Wrapped Carbon Nanotubes by Size-Exclusion Chromatography, Anal. Chem., 2005, 77(19), 6225–6228 CrossRef CAS PubMed.
- K. E. Moore, M. Pfohl, F. Hennrich, V. S. K. Chakradhanula, C. Kuebel, M. M. Kappes, J. G. Shapter, R. Krupke and B. S. Flavel, Separation of Double-Walled Carbon Nanotubes by Size Exclusion Column Chromatography, ACS Nano, 2014, 8(7), 6756–6764 CrossRef CAS PubMed.
- M. S. Arnold, A. A. Green, J. F. Hulvat, S. I. Stupp and M. C. Hersam, Sorting Carbon Nanotubes by Electronic Structure Using Density Differentiation, Nat. Nanotechnol., 2006, 1(1), 60–65, DOI:10.1038/nnano.2006.52.
- X. Wei, T. Tanaka, T. Hirakawa, Y. Yomogida and H. Kataura, Determination of Enantiomeric Purity of Single-Wall Carbon Nanotubes Using Flavin Mononucleotide, J. Am. Chem. Soc., 2017, 139(45), 16068–16071 CrossRef CAS PubMed.
- K. E. Moore, M. Pfohl, D. D. Tune, F. Hennrich, S. Dehm, V. S. K. Chakradhanula, C. Kubel, R. Krupke and B. S. Flavel, Sorting of Double-Walled Carbon Nanotubes According to Their Outer Wall Electronic Type via a Gel Permeation Method, ACS Nano, 2015, 9(4), 3849–3857, DOI:10.1021/nn506869h.
- M. C. Gwinner, F. Jakubka, F. Gannott, H. Sirringhaus and J. Zaumseil, Enhanced Ambipolar Charge Injection with Semiconducting Polymer/Carbon Nanotube Thin Films for Light-Emitting Transistors, ACS Nano, 2011, 6(1), 539–548 CrossRef PubMed.
- S. Khasminskaya, F. Pyatkov, B. S. Flavel, W. H. Pernice and R. Krupke, Waveguide-Integrated Light-Emitting Carbon Nanotubes, Adv. Mater., 2014, 26(21), 3465–3472 CrossRef CAS PubMed.
- A. Nish, J.-Y. Hwang, J. Doig and R. J. Nicholas, Highly Selective Dispersion of Single-Walled Carbon Nanotubes Using Aromatic Polymers, Nat. Nanotechnol., 2007, 2(10), 640 CrossRef CAS PubMed.
- H. Wang and Z. Bao, Conjugated Polymer Sorting of Semiconducting Carbon Nanotubes and Their Electronic Applications, Nano Today, 2015, 10(6), 737–758 CrossRef CAS.
- S. K. Samanta, M. Fritsch, U. Scherf, W. Gomulya, S. Z. Bisri and M. A. Loi, Conjugated Polymer-Assisted Dispersion of Single-Wall Carbon Nanotubes: The Power of Polymer Wrapping, Acc. Chem. Res., 2014, 47(8), 2446–2456 CrossRef CAS PubMed.
- C. Y. Khripin, J. A. Fagan and M. Zheng, Spontaneous Partition of Carbon Nanotubes in Polymer-Modified Aqueous Phases, J. Am. Chem. Soc., 2013, 135(18), 6822–6825 CrossRef CAS PubMed.
- A. Graf, Y. Zakharko, S. P. Schiessl, C. Backes, M. Pfohl, B. S. Flavel and J. Zaumseil, Large Scale, Selective Dispersion of Long Single-Walled Carbon Nanotubes with High Photoluminescence Quantum Yield by Shear Force Mixing, Carbon, 2016, 105, 593–599, DOI:10.1016/j.carbon.2016.05.002.
- D. D. Tune, B. W. Stolz, M. Pfohl and B. S. Flavel, Dry Shear Aligning: A Simple and Versatile Method to Smooth and Align the Surfaces of Carbon Nanotube Thin Films, Nanoscale, 2016, 8, 3232–3236 RSC.
- D. D. Tune, A. J. Blanch, C. J. Shearer, K. E. Moore, M. Pfohl, J. G. Shapter and B. S. Flavel, Aligned Carbon Nanotube Thin Films from Liquid Crystal Polyelectrolyte Inks, ACS Appl. Mater. Interfaces, 2015, 7(46), 25857–25864 CrossRef CAS PubMed.
- H. L. Wang, G. I. Koleilat, P. Liu, G. Jimenez-Oses, Y. C. Lai, M. Vosgueritchian, Y. Fang, S. Park, K. N. Houk and Z. N. Bao, High-Yield Sorting of Small-Diameter Carbon Nanotubes for Solar Cells and Transistors, ACS Nano, 2014, 8(3), 2609–2617, DOI:10.1021/nn406256y.
- S. Park, S. J. Kim, J. H. Nam, G. Pitner, T. H. Lee, A. L. Ayzner, H. L. Wang, S. W. Fong, M. Vosgueritchian, Y. J. Park, M. L. Brongersma and Z. A. Bao, Significant Enhancement of Infrared Photodetector Sensitivity Using a Semiconducting Single-Walled Carbon Nanotube/C-60 Phototransistor, Adv. Mater., 2015, 27(4), 759–765, DOI:10.1002/adma.201404544.
- R. Ihly, K. S. Mistry, A. J. Ferguson, T. T. Clikeman, B. W. Larson, O. Reid, O. V. Boltalina, S. H. Strauss, G. Rumbles and J. L. Blackburn, Tuning the Driving Force for Exciton Dissociation in Single-Walled Carbon Nanotube Heterojunctions, Nat. Chem., 2016, 8(6), 603–609, DOI:10.1038/Nchem.2496.
- T. A. Shastry, S. C. Clark, A. J. E. Rowberg, K. A. Luck, K. S. Chen, T. J. Marks and M. C. Hersam, Enhanced Uniformity and Area Scaling in Carbon Nanotube-Fullerene Bulk-Heterojunction Solar Cells Enabled by Solvent Additives, Adv. Energy Mater., 2016, 6(2), 1501466, DOI:10.1002/aenm.201501466.
- A. Classen, L. Einsiedler, T. Heumuelier, A. Graf, M. Brohmann, F. Berger, S. Kahmann, M. Richter, G. J. Matt, K. Forberich, J. Zaumseil and C. J. Brabec, Absence of Charge Transfer State Enables Very Low V-OC Losses in SWCNT:Fullerene Solar Cells, Adv. Energy Mater., 2019, 9(1), 1801913, DOI:10.1002/aenm.201801913.
- A. Star, Y. Lu, K. Bradley and G. Grüner, Nanotube Optoelectronic Memory Devices, Nano Lett., 2004, 4(9), 1587–1591, DOI:10.1021/nl049337f.
- D. S. Hecht, R. J. A. Ramirez, M. Briman, E. Artukovic, K. S. Chichak, J. F. Stoddart and G. Gruner, Bioinspired Detection of Light Using a Porphyrin-Sensitized Single-Wall Nanotube Field Effect Transistor, Nano Lett., 2006, 6(9), 2031–2036, DOI:10.1021/nl061231s.
- J. Borghetti, V. Derycke, S. Lenfant, P. Chenevier, A. Filoramo, M. Goffman, D. Vuillaume and J.-P. Bourgoin, Optoelectronic Switch and Memory Devices Based on Polymer-Functionalized Carbon Nanotube Transistors, Adv. Mater., 2006, 18(19), 2535–2540, DOI:10.1002/adma.200601138.
- F. Leonard, M. E. Foster and C. D. Spataru, Prospects for Bioinspired Single-Photon Detection Using Nanotube-Chromophore Hybrids, Sci. Rep., 2019, 9, 3268, DOI:10.1038/s41598-019-39195-1.
- M. Barkelid and V. Zwiller, Single Carbon Nanotube Photovoltaic Device, J. Appl. Phys., 2013, 114, 164320, DOI:10.1063/1.4828485.
- M. Barkelid and V. Zwiller, Photocurrent Generation in Semiconducting and Metallic Carbon Nanotubes, Nat. Photonics, 2014, 8(1), 48–52, DOI:10.1038/Nphoton.2013.311.
- T. DeBorde, L. Aspitarte, T. Sharf, J. W. Kevek and E. D. Minot, Photothermoelectric Effect in Suspended Semiconducting Carbon Nanotubes, ACS Nano, 2014, 8(1), 216–221, DOI:10.1021/Nn403137a.
- M. Engel, M. Steiner, R. S. Sundaram, R. Krupke, A. A. Green, M. C. Hersam and P. Avouris, Spatially Resolved Electrostatic Potential and Photocurrent Generation in Carbon Nanotube Array Devices, ACS Nano, 2012, 6(8), 7303–7310, DOI:10.1021/Nn302416e.
- J. U. Lee, P. P. Gipp and C. M. Heller, Carbon Nanotube P-n Junction Diodes, Appl. Phys. Lett., 2004, 85(1), 145–147, DOI:10.1063/1.1769595.
- J. U. Lee, Photovoltaic Effect in Ideal Carbon Nanotube Diodes, Appl. Phys. Lett., 2005, 87, 073101, DOI:10.1063/1.2010598.
- P. Avouris, M. Freitag and V. Perebeinos, Carbon-Nanotube Photonics and Optoelectronics, Nat. Photonics, 2008, 2(6), 341–350, DOI:10.1038/Nphoton.2008.94.
- K. Balasubramanian, M. Burghard, K. Kern, M. Scolari and A. Mews, Photocurrent Imaging of Charge Transport Barriers in Carbon Nanotube Devices, Nano Lett., 2005, 5(3), 507–510, DOI:10.1021/Nl050053k.
- M. V. Kharlamova, Advances in Tailoring the Electronic Properties of Single-Walled Carbon Nanotubes, Prog. Mater. Sci., 2016, 77, 125–211, DOI:10.1016/j.pmatsci.2015.09.001.
Footnote |
| † Electronic supplementary information (ESI) available. See DOI: https://doi.org/10.1039/d3cs00467h |
| This journal is © The Royal Society of Chemistry 2024 |