 Open Access Article
Creative Commons Attribution 3.0 Unported Licence
Chemically accurate predictions for water adsorption on Brønsted sites of zeolite H-MFI†
Henning
Windeck
 a,
Fabian
Berger‡
 a and
Joachim
Sauer
 *ab
*ab
aInstitut für Chemie, Humboldt-Universität zu Berlin, Unter den Linden 6, 10099 Berlin, Germany. E-mail: js@chemie.hu-berlin.de
bDepartment of Physical and Macromolecular Chemistry and Charles University Centre of Advanced Materials, Charles University, 12843 Prague, Czech Republic
First published on 4th September 2024
Abstract
We investigate the adsorption of water molecules in the zeolite H-MFI at isolated Brønsted acid sites (BAS) for loadings of 1, 2, and 3 H2O/BAS. We consider two approaches to the O3Al–O(H)–Si sites: the Brønsted-type approach of H2O to the acidic proton and the Lewis-type approach to the aluminium atom of the AlO4 tetrahedron. From the twelve crystallographically inequivalent framework sites for Al, a representative set of six active site positions is chosen. For them, we calculate CCSD(T)-quality adsorption energies at MP2-quality adsorption structures for different approaches, 48 in total. The Brønsted-type approach is favoured for most cases but the Lewis-type approach has similar stability for some framework positions. We predict heats of adsorption per molecule ranging from 60 to 76, 56 to 65, and 56 to 64 kJ mol−1 for loadings of 1, 2, and 3 H2O/BAS, respectively. For 1 H2O/BAS, the experimental result (70 kJ mol−1) falls into the range of our predictions, whereas for 2 and 3 H2O/BAS, the measured adsorption heats per molecule (74 and 70 kJ mol−1, respectively) are larger than our predictions. For 2 H2O/BAS, the ion-pair structure generated by proton transfer to the water dimer competes with the neutral adsorption complex. The DFT adsorption energies (PBE+D2) deviate significantly from the CCSD(T)-quality reference energies, by up to 25 kJ mol−1 for 1 H2O/BAS, 25 kJ mol−1 per H2O for 2 H2O/BAS, and 18 kJ mol−1 per H2O for 3 H2O/BAS. Specifically, PBE+D2 overstabilises the ion-pair structure, i.e. in many cases the PBE+D2 error is much larger for ionic than for neutral adsorption structures.
1. Introduction
Zeolites are solid catalysts that are widely used in industry.1 There is renewed interest2–4 triggered by catalytic biomass conversion in the aqueous phase.5 Thus, understanding water adsorption in zeolites is of fundamental importance. Water is also produced in many zeolite-catalysed reactions, e.g. in the methanol-to-olefin (MTO) process.6,7 Residual and defect-bound water may also result from activation of “as-synthesised” samples which removes water from the pores and unlocks the active sites. Since decades ago, numerous experimental and computational studies have examined the interaction of water molecules with acidic zeolite catalysts.8,9The proton form of zeolites is formally obtained from a nanoporous SiO2 framework by substituting a silicon atom with an aluminium atom and adding a charge-compensating proton. This creates Si–O(H)⋯AlO3 bridges which are the main active sites of zeolite catalysts. Since they are the origin of the Brønsted acidity of zeolites,10 Si–O(H)⋯AlO3 bridges are referred to as Brønsted acid sites (BAS). While H-bonding of water molecules to BAS is well-known,11–13 it was only in 2015 that a second, albeit energetically less favourable, adsorption structure for H2O has been suggested14 in which the four-coordinated Al of the bridging Si–O(H)⋯AlO3 group acts as Lewis acid, see Fig. 1.
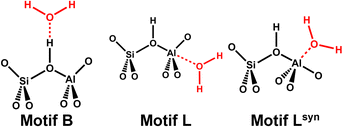 | ||
| Fig. 1 Interaction motifs for water adsorption on bridging Si–O(H)⋯AlO3 groups: Brønsted approach forming an H-bond (motif B) or Lewis-type approach (motifs L or Lsyn). | ||
In the present computational study, we investigate water adsorption at isolated BAS of the ideal H-MFI structure in the low-loading regime, i.e. for 1, 2, and 3 H2O/BAS. We take both the Brønsted-type and the Lewis-type approach into account, see Fig. 1. We will address the central question if the proton is transferred from the BAS to the adsorbed water molecules and how this depends on the number of adsorbed water molecules. We will show that reliable predictions of the protonation state and chemically accurate predictions of the heat of adsorption requires to go beyond commonly applied levels of density functional theory (DFT), the so-called generalised gradient approximation (GGA).15,16 To do so, we use our hybrid high-level QM: low-level QM method (QM = quantum mechanics)17 which yields chemically accurate results (±4 kJ mol−1)18 at the level of coupled cluster theory with singles, doubles, and perturbative triples substitutions (CCSD(T)).19,20
Early calculations11–13 predicted for a single adsorbed molecule that the neutral adsorption complex is a minimum on the potential energy surface whereas the hydronium ion is a transition structure for proton exchange.11,12 They further showed that an ion-pair complex cannot explain the characteristic pair of infrared (IR) bands observed in the H-bond region (2885 and 2460 cm−1), contrary to the experimental assignment.21 The conclusive experiment was 18O substitution of H2O which showed no effect on this pair of bands.22 The calculations for the neutral H-bonded complex explained this pair of bands assuming a Fermi resonance between the strongly red-shifted bridging OH group engaged in H-bonding and the overtone of the in-plane Si–O–H bending.8,11,23 Additional evidence came from an inelastic neutron scattering (INS) spectrum which could be only explained assuming a neutral adsorption complex.24 For loading of two water molecules per BAS (2 H2O/BAS), proton transfer with formation of H5O2+ was predicted as a minimum energy structure,11–13 in agreement25 with evidence for protonated adsorbed water molecules produced by neutron diffraction.26 Subsequent Car–Parrinello molecular dynamics (CPMD) simulations showed that, for 2 H2O/BAS, the neutral (H2O)2 complex and the H5O2+ ion-pair structure are about equally stable,27,28 but the precise energy balance depends on the specific functional used for the DFT calculations.8 Further DFT-based simulations27,29 predicted that, at finite temperatures, the protonated dimer is not stable, protonated water trimers may exist as a short-lived species, and only the tetramer forms a stable protonated cluster. The trend to more stable protonated clusters with increasing number of water molecules corresponds to the increasing proton affinity of water clusters.27,30
Recent meta-dynamics simulations with the PBE15 functional augmented with Grimme's D2 dispersion term31 for up to eight water molecules in four different zeolite frameworks32 confirmed the earlier findings and reached an important additional conclusion. With a properly chosen collective variable it was possible to distinguish two states of protonated water clusters. In the first, the proton is transferred to the water molecule closest to the BAS forming a Zundel-type structure. In the second, a hydronium ion is formed that is fully solvated by other water molecules. From 2D IR experiments for H-MFI and molecular dynamics (MD) with the revPBE functional33 augmented with Grimme's D3 dispersion term,34 a similar conclusion has been reached:35,36 For 2 H2O/BAS, the proton is shared between the water molecule and the BAS whereas for 3–8 H2O/BAS, proton sharing occurs primarily between two water molecules. For loadings of 2–9 H2O/BAS, Hu, Lercher, and co-workers observed a 1H-NMR signal at 9 ppm and assigned it to hydrated hydronium ions,2 in agreement with an early prediction of a signal at 9.5 ppm for protonated water dimers in zeolites.37
For adsorption energies, DFT (PBE functional) calculations for 1, 2, 3, and 4 H2O/BAS in H-CHA yielded the expected monotonous decrease with the number of water molecules, 76, 61, 59, 60 kJ mol−1, respectively.29 This was consistent with the monotonous decrease of the heat of adsorption from 80 ± 10 kJ mol−1 (1 H2O/BAS) to 60 ± 10 kJ mol−1 (2–4 H2O/BAS) derived by Olson, Haag, and Borghard from isotherms38 and measured by Bolis, Busco, and Ugliengo using microcalorimetry.39 Liu, Lercher, and co-workers studied the gradual hydration of H-MFI using microcalorimetry for samples with varying Si/Al ratios.3 For water loadings ≥3 H2O/BAS, they found the expected trend of steadily decreasing heats of adsorption which eventually reach the condensation enthalpy of water (−45 kJ mol−1), but that adsorption of the second water molecule per BAS is more exothermic than the first water came as a surprise. For the samples with Si/Al = 110 and 45, they measured integral heats of adsorption per molecule of 70.2 ± 0.5, 74.4 ± 0.7, and 69.7 ± 2.1 kJ mol−1 for loadings of 1, 2, and 3 H2O/BAS, respectively, see Section S4 of the ESI.†
Previous DFT studies of water adsorption in H-MFI2,14,32,35,36,40–43 all relied on GGA-type functionals which – due to the self-interaction error – overstabilise polar structures. At this rung of the Jacob's ladder,44 PBE15 is probably the most widely applied functional for solids and surfaces. Augmented with Grimme's D2 or D3 dispersion terms,31,34 absolute errors of about 20–70 kJ mol−1 have been reported for adsorption and reactions in zeolites.45–51 For H-bonded systems, too low proton jump barriers52 and too strong H-bonding is found. For example, for adsorption of methanol and ethanol in H-MFI, the adsorption energies predicted by PBE+D2 are 17 and 22 kJ mol−1, respectively, too binding.53 Moreover, GGA-type functionals yield too weak and too long O–H bonds54 which are too much stretched on H-bond formation.55 This leads to a too large red-shift of the O–H stretching band upon adsorption.54,56 Comparison of PBE+D2 results with converged CCSD(T) calculations for the cyclic water trimer, tetramer, and pentamer57 provides further evidence for the shortcomings of GGA functionals for H-bonded systems, see Section S1.5 of the ESI.†
To go beyond DFT in general and beyond PBE+D2/D3 in particular, we combine Møller–Plesset perturbation theory to second order (MP2)58 for cluster models with PBE+D2 on periodic models (hybrid MP2:PBE+D2) for optimising structures.17 We stay with D2 because for zeolites D3 is no improvement over D2.48 At the MP2-quality structures, we employ smaller cluster models to evaluate the CCSD(T)-MP2 energy difference. This defines the hybrid MP2:(PBE+D2)+ΔCC approach applied before to a variety of molecule–surface interactions.17,56,59 In addition, we test the Becke 3-parameter Lee–Yang–Parr (B3LYP)60,61 exchange correlation functional augmented with Grimme's D3 dispersion term34 (B3LYP+D3) as an alternative to MP2 in hybrid B3LYP+D3:PBE+D2 structure optimisations.
For brevity and readability, we will refer to our hybrid MP2:PBE+D2 and MP2:(PBE+D2)+ΔCC results as MP2 and MP2+ΔCC results, respectively. The MP2+ΔCC energies are single-point results at MP2 structures.
2. Methods and models
2.1. Computational details
Periodic DFT calculations are performed with the PBE15 exchange correlation functional augmented with Grimme's D2 dispersion term31 and Ewald summation62 as implemented in VASP 5.4.1.63–66 Plane wave basis sets are used for the valence electrons. The projector augmented wave method (PAW) is used for core electrons (standard potentials). The Brillouin-zone is sampled at the Γ-point only. These settings have performed well for similar systems.47–49,51,67 A kinetic energy cut-off of 400 eV is chosen, except for the iterative cell vector optimisations which use a cut-off of 800 eV to minimise the effect of volume change on the basis set in each iteration.68 Cell vectors are optimised for the most stable conformer of each active site position individually, see Table S18 in the ESI.† Convergence thresholds are set to 10−7 eV for changes in energy and 0.005 eV Å−1 for changes in structure. Hessian matrices are calculated numerically using central finite differences and Cartesian displacements of 0.01 Å with an energy convergence threshold of 10−8 eV. They are used to verify stationary points by normal mode analysis as well as to obtain zero-point vibrational energies and thermal enthalpy contributions.We perform hybrid MP2:PBE+D2 calculations using a mechanical embedding scheme69,70 which combines MP258,71 calculations on cluster models with PBE+D2 calculations on the periodic system.52,59,72 We use hybrid MP2:PBE+D2 forces to reoptimise PBE+D2 structures. These calculations are performed with the MonaLisa code73,74 which couples ORCA 4.2.175,76 for cluster calculations with VASP 5.4.163–66 for periodic calculations. Section S3 of the ESI† presents all cluster models. As suggested previously,69,70 dangling bonds are capped by hydrogen atoms with a fixed O–H bond length of 95.3 pm. As an alternative to MP2 as high-level method, B3LYP+D3 is tested in hybrid B3LYP+D3:PBE+D2 structure optimisations. Hybrid structure optimisations use the def2-TZVP basis set77 for PBE+D2 low-level cluster calculations and the def2-TZVPP basis set77 for MP2 or B3LYP+D3 high-level cluster calculations.67,78,79
The domain-based local pair natural orbital (DLPNO) approximation (tightPNO settings) is used with MP2 and CCSD(T) in hybrid MP2:(PBE+D2)+ΔCC single-point calculations,80,81 but not for hybrid MP2:PBE+D2 structure optimisations which are performed with standard RI-MP2 (RI = resolution of identity approximation82). MP2 and CCSD(T) energies are extrapolated to the complete basis set (CBS) limit using the cc-pVnZ (n = T, Q) basis sets83,84 in a two-point extrapolation scheme.85,86 Adsorption energies are counterpoise-corrected to minimise the effect of the basis set superposition error,87 but not in hybrid MP2:PBE+D2 structure optimisations. The employed hybrid methodology has been tested extensively, see Section S1 of the ESI.†
2.2. Periodic H-MFI models
The MFI framework features straight and zigzag channels with spacious cavities at their intersection, see Fig. 2. In the orthorhombic MFI framework,88 12 crystallographically unique tetrahedral sites (T-sites) exist which can be occupied by aluminium and each aluminium atom is surrounded by four crystallographically distinct oxygen atoms to which the proton can be attached. This results in 48 possible BAS positions. We consider only isolated BAS, i.e. one aluminium substitution per unit cell (Si/Al ratio of 95).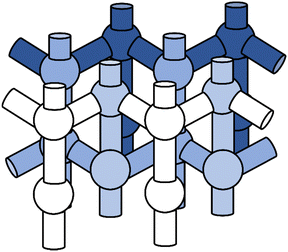 | ||
| Fig. 2 Topology of the MFI framework featuring straight and zigzag channels as well as intersection regions. | ||
Depending on the aluminium and proton positions, the sites for Brønsted and Lewis approach to the BAS can be in different regions of the framework. To examine the effect of the active site heterogeneity on the adsorption of water, we define a representative set of five sites that covers all regions in H-MFI, see Table 1. Whereas the aluminium siting is not governed by thermodynamic stability, but depends on the synthesis conditions,89–91 the protons are mobile92 and will assume their most stable position, in particular in the presence of water.93 We follow previous work54 in selecting most probable Al lattice positions, and for each of them we choose the most stable proton position, see Table 1. The Al3–O5(H)–Si2 site, which is also in the very accessible intersection region, is added for comparison with a previous study.14 Having defined the proton positions in Table 1, we will refer to the BAS simply using the T-site at which the aluminium atom resides: T2, T3, T6, T7, T11, and T12. BAS with aluminium at T7 (regular site) or T12 (intersection site)94 are commonly used in computational studies. e.g. ref. 94 and 95.
| Lewis-type approach (L) | Brønsted-type approach (B) | ||
|---|---|---|---|
| Straight | Zigzag | Intersection | |
| Straight | — | Al11–O24(H)–Si10 | — |
| Zigzag | Al7–O17(H)–Si8 | — | — |
| Intersection | Al2–O7(H)–Si6 | Al6–O10(H)–Si3 | — |
| Wall | — | — | Al12–O8(H)–Si3 |
| Wall | — | — | Al3–O5(H)–Si2 |
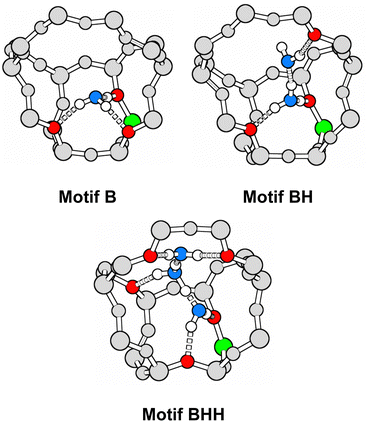
For loadings of 2 and 3 H2O/BAS, H-bonding (H) between water molecules is an option. Hence, the adsorption motifs are BH, BL, and LH for 2 H2O/BAS as well as BHH, LHH, BHL, and BLH for 3 H2O/BAS, see Fig. 3. The periodic models contain one active site per unit cell which implies a homogeneous distribution of water molecules over the active sites.
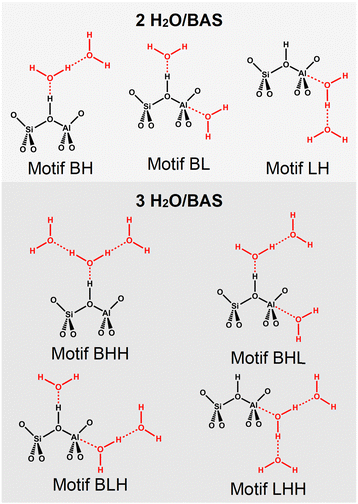 | ||
| Fig. 3 Interaction motifs for water adsorption via Brønsted-type (B) and Lewis-type (L) approach in H-MFI. Additional water molecules can form H-bonds (H) with other water molecules. | ||
3. Results and discussion
3.1. PBE+D2 structures and energies: conformational diversity
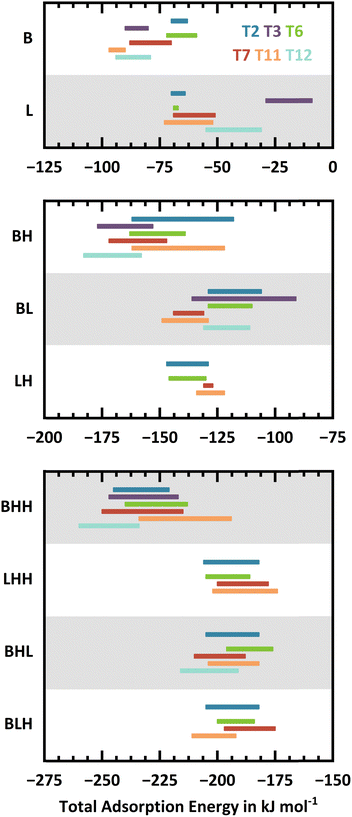
For adsorption of two and three water molecules, different combinations of Brønsted-type (motif B) and Lewis-type approach (motif L)14 exist for each framework position, see Fig. 3. The syn-approach to the Lewis site (Lsyn, see Fig. 1) is considered whenever steric constraints prohibit an approach in anti-position. In addition to the primary H-bond with the BAS, water molecules can form secondary H-bonds with oxygen atoms in different Si–O–Si framework sites, leading to multiple conformers for each interaction motif at each framework position. Fig. 4 shows the B, BH, and BHH adsorption structures at T11 as an example. As the secondary H-bonding interactions can be strong, the conformers can differ significantly in adsorption energy. We use chemical intuition to find all sensible adsorption structures. Overall, 538 unique adsorption structures were identified: 78, 182, and 278 for loadings of 1, 2, and 3 H2O/BAS, respectively. This illustrates that water adsorption in H-MFI is a complex computational problem.Fig. 5 shows the ranges of PBE+D2 adsorption energies for different conformers at the same site, see ESI,† Section S2.2 for details. For a given framework position, the adsorption energy for a particular motif varies vastly across the different conformers. In most cases, the difference between the most and least stable conformer is between 10 and 30 kJ mol−1. Fig. S5 in the ESI† presents the variation of adsorption energies across the conformers and Fig. S6 in the ESI† the adsorption energy differences with respect to the most stable conformer. These figures show that the large ranges between most and least stable conformer are not caused by outliers, which points to the importance of a comprehensive sampling of conformers when a local approach is used for thermodynamic predictions instead of global sampling with, e.g., molecular dynamics.
As a trend, the energy ranges become broader with increasing water loading. Larger water clusters can form H-bonds to framework oxygen atoms that are farther away from the active sites. The overall number of H-bonding opportunities increases and thus a larger number of conformers is observed. While a single water molecule can only form H-bonds with framework oxygen atoms that are in direct vicinity to the active site, a cluster of three water molecules can extend across the channels. When divided by the number of water molecules the energy ranges become narrower with increasing water loading, see ESI,† Fig. S7.
3.2. MP2 adsorption structures compared to PBE+D2 results
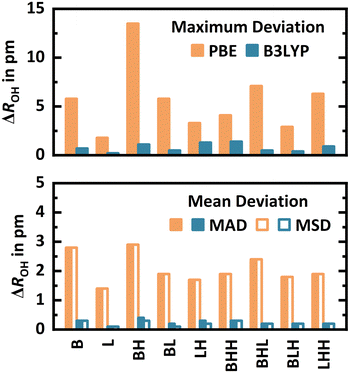
For each interaction motif (B, L, BH, BL, LH, BHH, LHH, BHL, and BLH) at every framework position (T2, T3, T6, T7, T11, and T12), the most stable conformer at the PBE+D2 level is selected for a structure optimisation with MP2. Since at some T-sites certain Lewis-type interaction motifs are not possible, this yields 48 conformers in total.For the different interaction motifs, Fig. 6 shows the maximum deviation (signed) as well as the mean absolute (MAD) and mean signed (MSD) deviation of all OH bond lengths obtained with PBE+D2 from the MP2 reference values, see Section S2.3 of the ESI† for details. By far, BH shows the highest maximum deviations of up to 13.5 pm. MADs and MSDs are equivalent in all cases, demonstrating that PBE+D2 systematically predicts too long, i.e., too weak, covalent OH bonds. The MAD is highest for B (2.8 pm), BH (2.9 pm), and BHL (2.4 pm). Adsorption via the Lewis-type approach is less affected by the limitations of PBE+D2. Still, MP2 reoptimisation leads to a shortening of Al⋯OH2 distances (which are typically around 200 pm) by 1–5 pm in many cases, see Section S2.3 of the ESI.†
As a computationally less demanding alternative, hybrid B3LYP+D3:PBE+D2 structure optimisations are also conducted, see Fig. 6. The adsorption structures obtained are very similar to the MP2 ones, see Section S2.3 of the ESI.† Referenced to MP2 structures, the MADs are 1.4–2.9 pm for PBE+D2 but only 0.1–0.4 pm for hybrid B3LYP+D3:PBE+D2. For the latter, also the maximum deviations are small, with values between 0.2–1.4 pm. These results, obtained for a diverse set of 48 water adsorption structures, show that hybrid B3LYP+D3:PBE+D2 is indeed a cost-efficient alternative to MP2 for structure optimisations. For adsorption energies, however, it does not reach MP2 accuracy, see Section S2.3 of the ESI.†
3.3. Protonation state of water clusters attached to Brønsted acid sites
When water molecules interact with a BAS, they can get protonated and thus deprotonate the BAS.11,96 As a structural descriptor, we introduce the degree of deprotonation (DoD) of the BAS: | (1) |
 is the distance between the proton of the bridging hydroxyl group and the oxygen atom of the adsorbed water molecule and
  is the OH bond distance in the isolated hydronium ion. Consequently, the limiting case of DoD = 0 (neutral complex) corresponds to no deprotonation of the BAS, i.e. an unperturbed BAS, while DoD = 1 (ion-pair complex) implies full deprotonation of the BAS and thus formation of a protonated water cluster, see Fig. 7.
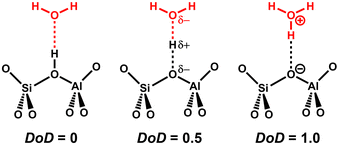 | ||
| Fig. 7 Schematic representation of borderline cases of the degree of deprotonation (DoD) of the BAS, see eqn (1). | ||
Table 2 shows DoD values and energies for adsorption at all framework positions. For comparison, PBE+D2 results are also shown. For further details, see Section S1.4 of the ESI.† For a loading of 1 H2O/BAS, structures optimised at the MP2 level do not indicate deprotonation of the BAS. The DoD values are between 0.03–0.10 for interaction motif B at the different framework positions. In contrast, for 3 H2O/BAS, DoD values between 0.91–0.97 indicate full deprotonation of the BAS for all adsorption sites (motif BHH), see Table S31 in the ESI.† For 2 H2O/BAS, interaction motif BH, MP2+ΔCC predicts both neutral complex structures and ion-pair structures. With MP2+ΔCC these have similar stabilities.
| PBE+D2 | PBE+D2 | MP2+ΔCC | MP2 | |||||
|---|---|---|---|---|---|---|---|---|
| E ads | DoD | E ads | DoD | |||||
| ZO−⋯H5O2+ | ZOH⋯H4O2 | ZO−⋯H5O2+ | ZOH⋯H4O2 | ZO−⋯H5O2+ | ZOH⋯H4O2 | ZO−⋯H5O2+ | ZOH⋯H4O2 | |
| T2 | −162 | −141 | 0.95 | 0.58 | −123 | −125 | 0.92 | 0.14 |
| T3 | −177 | −168 | 0.94 | 0.48 | −139 | −137 | 0.92 | 0.19 |
| T6 | −163 | −141 | 0.92 | 0.37 | −124 | −121 | 0.91 | 0.14 |
| T7 | −172 | −162 | 0.89 | 0.67 | −128 | −134 | 0.88 | 0.21 |
| T11 | −162 | −138 | 0.82 | 0.27 | −112 | −113 | 0.82 | 0.08 |
| T12 | −182 | −161 | 0.92 | 0.30 | −136 | −133 | 0.91 | 0.14 |
As an illustrative example, Fig. 8 shows the respective structures at T7. With MP2+ΔCC, the neutral complex, ZOH⋯H4O2, is 6 kJ mol−1 more stable than the ion-pair structure, ZO−⋯H5O2+, whereas with PBE+D2 the ion-pair complex is 10 kJ mol−1 more stable than the neutral complex. The difference between MP2+ΔCC and PBE+D2 adsorption energies is 44 kJ mol−1 for the ion-pair, but only 28 kJ mol−1 for the neutral complex. This is a clear manifestation of the overstabilisation of polar structures with GGA-type functionals due to the self-interaction error.
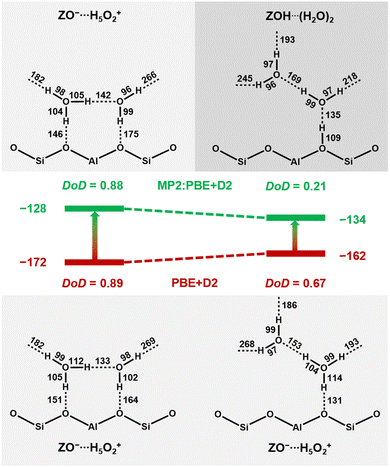 | ||
| Fig. 8 Ion-pair complex, ZO−⋯H5O2+, and neutral complex, ZOH⋯(H2O)2, for adsorption motif BH at T7 as obtained via structure optimisation with PBE+D2 (bottom) and MP2 (top), see Table 2. DoD defined in eqn (1). The middle part shows MP2+ΔCC adsorption energies in kJ mol−1. | ||
At the PBE+D2 potential energy surface, the O–H bonds are stretched too much and the proton of the zeolitic OH group moves to the adsorbed water dimer, resulting in a DoD of 0.67 instead of 0.21. This means that the isomer which was a neutral complex on the MP2 potential energy surface becomes a second ion-pair structure at the PBE+D2 surface. For the ion-pair structures with similar DoD for both methods (left side of Fig. 8), the O–H bonds are much more stretched on H-bond formation. For example, the O–H bond involving the shared proton of the adsorbed protonated water dimer is much longer with PBE+D2 (112 pm) than with MP2 (105 pm). Both for the relative stabilities and O–H bond lengths, the results for other framework positions are similar to those for T7, see Table 2. Further, Table 2 shows that PBE+D2 artificially predicts ambiguous protonation states (0.27 < DoD < 0.67) for all framework positions.
3.4. MP2+ΔCC adsorption energies compared to PBE+D2 results
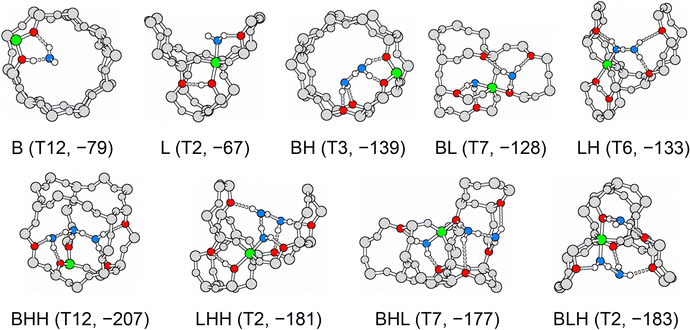
Table 3 shows the MP2+ΔCC adsorption energies for the most stable conformers and compares them with PBE+D2 results. For each interaction motif, Fig. 9 shows the adsorption structure at the T-site at which this motif is most stable as predicted by MP2+ΔCC.| BAS | 1 H2O/BAS | 2 H2O/BAS | 3 H2O/BAS | |||||||
|---|---|---|---|---|---|---|---|---|---|---|
| B | La | BH | BLb | LH | BHH | LHH | BHL | BLH | ||
| a Lsyn for T3. b BLsyn for T3. c Al position, see Table 1. d MP2 structure optimisation. | ||||||||||
| T2c | PBE+D2 | −70 | −70 | −162 | −128 | −147 | −245 | −207 | −205 | −205 |
| MP2+ΔCCd | −64 | −67 | −123 | −116 | −133 | −198 | −181 | −178 | −183 | |
| T3c | PBE+D2 | −90 | −29 | −177 | −139 | — | −246 | — | — | — |
| MP2+ΔCCd | −74 | −25 | −139 | −110 | — | −191 | — | — | — | |
| T6c | PBE+D2 | −72 | −69 | −163 | −128 | −146 | −240 | −205 | −196 | −200 |
| MP2+ΔCCd | −67 | −64 | −124 | −123 | −133 | −197 | −176 | −167 | −179 | |
| T7c | PBE+D2 | −88 | −69 | −172 | −145 | −132 | −250 | −202 | −210 | −198 |
| MP2+ΔCCd | −74 | −63 | −128 | −128 | −119 | −201 | −174 | −177 | −174 | |
| T11c | PBE+D2 | −97 | −73 | −162 | −149 | −134 | −234 | −201 | −204 | −210 |
| MP2+ΔCCd | −72 | −63 | −112 | −125 | −112 | −181 | −166 | −166 | −176 | |
| T12c | PBE+D2 | −94 | −55 | −182 | −130 | — | −259 | — | −215 | — |
| MP2+ΔCCd | −79 | −45 | −136 | −108 | — | −207 | — | −177 | — | |
The ΔCC corrections (CCSD(T) – MP2 differences) are much smaller than the ΔMP2 corrections (MP2–PBE+D2 differences), with maximum absolute values of 6 and 50 kJ mol−1, respectively, see Tables S34 and S35 in the ESI.† While the MP2 corrections are always positive, i.e. destabilising, the CCSD(T) corrections can be positive or negative. For most interaction motifs, the ΔCC corrections are negligible. Only for motifs BH and BHH, they are between 2–6 kJ mol−1. We conclude that adding the MP2 correction to PBE+D2 is already enough to reach chemical accuracy in most cases.
Fig. 10 shows the variation of MP2+ΔCC adsorption energies for motifs B and L across different framework positions compared to PBE+D2. For motif B, the range of adsorption energies for the different T-sites extends over 15 kJ mol−1 with MP2+ΔCC, but over 24 kJ mol−1 with PBE+D2, see Table 3 and Fig. 10. This shows that PBE+D2 not only overestimates water adsorption strengths but also artificially amplifies differences between the framework positions. For T6 and T2, the differences between PBE+D2 and MP2+ΔCC are −5 and −6 kJ mol−1, respectively, whereas they are −14, −15, and −16 kJ mol−1 for T7, T12, and T3, respectively, and −25 kJ mol−1 for T11. The large error for T11 changes the sequence of adsorption strengths of the different T-sites, from T12 > T3 ≈ T7 > T11 with MP2+ΔCC to T11 > T12 > T3 > T7 with PBE+D2.
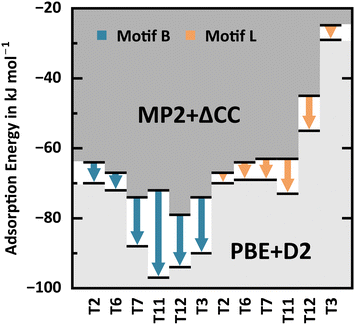 | ||
| Fig. 10 PBE+D2 and MP2+ΔCC adsorption energies (black bars) for motifs B and L at different framework positions, see also Table 3. Arrows indicate the PBE+D2 error. | ||
For motif L, the MP2+ΔCC energies for adsorption on T2, T6, T7, and T11 are in a narrow range between −67 and −63 kJ mol−1, whereas for adsorption on T12 and T3 they are significantly less exoenergetic, −45 and −25 kJ mol−1, respectively. At the latter framework positions, the AlO4 Lewis-site lies in a small, sterically less accessible cage which can accommodate water only under destabilising framework distortions or in the unfavourable syn-position, see Fig. 1. For T6 and T2, the adsorption energies for motif L are comparable with those of motif B within ±3 kJ mol−1, but these are the sites which are least exoenergetic for motif B, −67 and −64 kJ mol−1, respectively. Hence, only for H-MFI samples with Al in T6 and T2, a partial population of L-type adsorption structures can be expected, and only after the BAS at all other T-sites have been populated, if energetically favoured, even with more than one water molecule. Similarly to motif B, PBE+D2 overestimates the water adsorption strengths compared to MP2+ΔCC. For motif L, however, the errors are much smaller, between 3 and 10 kJ mol−1. The PBE+D2 energies for adsorption on T6 and T2 remain comparable with those of motif B within ±3 kJ mol−1.
For 2 H2O/BAS, interaction motif BH, Fig. 11 shows the PBE+D2 adsorption energy errors with respect to MP2+ΔCC for Al in different T-sites. Due to the self-interaction error, they are significantly larger for the ion-pair complex, 38–50 kJ mol−1, than for the neutral complex, 16–31 kJ mol−1, see also Table 2. While MP2+ΔCC predicts similar stability of ion-pair complex and neutral complex, PBE+D2 erroneously favours the ion-pair complex.
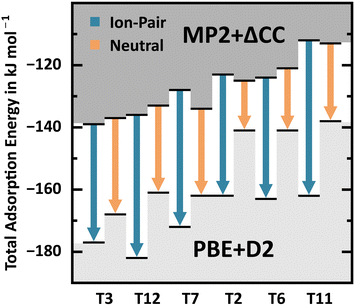 | ||
| Fig. 11 PBE+D2 and MP2+ΔCC adsorption energies (black bars) for ion-pair complex and neutral complex for BAS at different T-sites, see also Table 2. Arrows indicate the PBE+D2 error. | ||
With regard to the different interaction motifs for 2 H2O/BAS, with MP2+ΔCC BH is favoured for T3, T7, and T12, whereas BL is favoured for T11 and LH is favoured for T2 and T6. Conversely, PBE+D2 clearly favours motif BH for all framework positions, predicting the formation of an ion-pair complex, i.e. complete deprotonation of the BAS. This shows that PBE+D2 seriously overestimates the stability of the ion-pair complex, see also Table 2. Overall, the range of adsorption energies for BH, BL, and LH is much narrower with MP2+ΔCC (−108 to −139 kJ mol−1) than with PBE+D2 (−128 to −182 kJ mol−1). Not only does PBE+D2 show errors as large as 50 kJ mol−1, but these errors are also not consistent. Errors for the different stationary points vary between 5 and 50 kJ mol−1. In addition, the nature of stationary points (neutral complex vs. ion-pair structure) may change.
For 3 H2O/BAS, both MP2+ΔCC and PBE+D2 favour interaction motif BHH. For all interaction motifs with 3 H2O/BAS at all T-sites, the PBE+D2 errors with respect to MP2+ΔCC vary between 21–55 kJ mol−1. While Lewis-type approach of water molecules to the aluminium atom of the AlO4 tetrahedron may be relevant for loading 1–2 H2O/BAS, the formation of protonated water clusters for the BHH motif offers a much higher stabilisation at loading 3 H2O/BAS. We expect a preference for protonated water clusters also at loadings larger than 3 H2O/BAS.
Since the revPBE functional33 augmented with the D3 dispersion term34 is widely used for simulating water,97 we test it for water adsorption in H-MFI, comparing to our benchmark MP2 structures and MP2+ΔCC energies, see Section S1.6 of the ESI.† We find that revPBE+D3 performs much better than PBE+D2 – both for structures and energies. Thus, it may be worth considering in future studies on the type of systems considered here.
3.5. Comparison with experiment
Table 4 shows MP2+ΔCC and PBE+D2 adsorption enthalpies at 298 K, see Section S2.4 of the ESI† for the individual contributions. They are based on the electronic adsorption energies shown in Table 3 and include PBE+D2-quality zero-point vibrational energies and thermal contributions obtained from vibrational partition functions. We always assume a homogeneous distribution of water molecules over the available adsorption sites, i.e. for a global loading of 1 H2O/BAS we assume that each BAS is occupied with one H2O molecule. In Section S5 of the ESI† we show that taking into account heterogeneous distributions,29 for example with half of the BAS unoccupied and half of them occupied with 2 H2O/BAS, does not change the predicted heats of adsorption.| BAS | 1 H2O/BAS | 2 H2O/BAS | 3 H2O/BAS | |||||||
|---|---|---|---|---|---|---|---|---|---|---|
| B | La | BH | BLb | LH | BHH | LHH | BHL | BLH | ||
| a Lsyn for T3. b BLsyn for T3. c Al position, see Table 1. d MP2 structure optimization. e Ref. 3, see Section S4 of the ESI. | ||||||||||
| T2c | PBE+D2 | −63 | −63 | −155 | −115 | −134 | −228 | −187 | −188 | −185 |
| MP2+ΔCCd | −57 | −60 | −116 | −102 | −119 | −181 | −162 | −161 | −163 | |
| T3c | PBE+D2 | −86 | −22 | −166 | −129 | — | −233 | — | — | — |
| MP2+ΔCCd | −70 | −18 | −129 | −101 | — | −178 | — | — | — | |
| T6c | PBE+D2 | −65 | −62 | −155 | −115 | −133 | −221 | −185 | −179 | −179 |
| MP2+ΔCCd | −61 | −57 | −116 | −109 | −120 | −178 | −156 | −151 | −158 | |
| T7c | PBE+D2 | −87 | −64 | −168 | −132 | −120 | −235 | −184 | −196 | −179 |
| MP2+ΔCCd | −73 | −58 | −124 | −116 | −108 | −186 | −157 | −163 | −156 | |
| T11c | PBE+D2 | −93 | −65 | −155 | −136 | −122 | −221 | −186 | −189 | −189 |
| MP2+ΔCCd | −69 | −55 | −105 | −112 | −101 | −168 | −151 | −151 | −155 | |
| T12c | PBE+D2 | −91 | −47 | −172 | −117 | — | −243 | — | −198 | — |
| MP2+ΔCCd | −76 | −37 | −127 | −96 | — | −191 | — | −160 | — | |
| Min/Max | MP2+ΔCCd | −60/−76 | −112/−129 | −168/−191 | ||||||
| Per molecule | −60/−76 | −56/−65 | −56/−64 | |||||||
| Exp.e | Integral | −70.2 ± 0.5 | −148.8 ± 1.4 | −209.0 ± 6.2 | ||||||
| Per molecule | −70.2 ± 0.5 | −74.4 ± 0.7 | −69.7 ± 2.1 | |||||||
Fig. 12 compares our MP2+ΔCC adsorption enthalpies calculated for BAS in different framework positions with calorimetrically measured integral heats of adsorption reported by Liu, Lercher, and co-workers,3 see ESI,† Section S4, as well as with data derived from isotherm measurements of Olson, Haag, and Borghard.38 Comparison between theory and experiment is complicated by the fact that, for a given H-MFI sample, the distribution of Al and hence the BAS over different framework positions is largely unknown.89–91
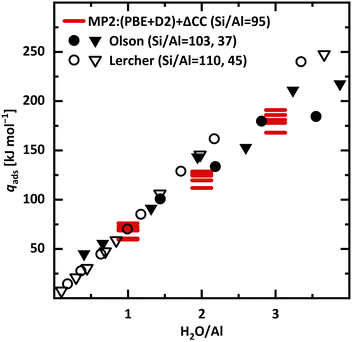 | ||
| Fig. 12 Experimental integral heats of adsorption (qads) as reported by Liu, Lercher and co-workers3 (calorimetry, empty symbols) as well as Olson, Haag, and Borghard38 (isotherms, full symbols). For both, two samples with different Si/Al ratio are included. MP2+ΔCC adsorption enthalpies (absolute values) for all six framework positions (red bars). The respective most stable adsorption motif is chosen, see Table 4. | ||
For 1 H2O/BAS, the MP2+ΔCC predictions for the adsorption heats at different sites vary over 16 kJ mol−1. For T3, T7, and T11, the predictions (70, 73, and 69 kJ mol−1, respectively) agree with experiment3 (70.2 ± 0.5 kJ mol−1, see ESI,† Section S4) within chemical accuracy limits (±4 kJ mol−1). For T2 and T6, the predicted heats (60 and 61 kJ mol−1, respectively) are about 10 kJ mol−1 lower and for T12 (76 kJ mol−1) 6 kJ mol−1 higher than experiment. For loadings ≤1.5 H2O/BAS, the calorimetric heats3 coincide with the ones derived from isotherms.38
For 2 and 3 H2O/BAS, the predicted heats (Table 4) are 20 to 37 and 18 to 41 kJ mol−1, respectively, lower than the calorimetric values3 of 149 ± 1 and 209 ± 6 kJ mol−1, respectively, see ESI,† Section S4. Per molecule, they are 10 to 18 and 6 to 14 kJ mol−1, respectively, lower. Whereas for 1 H2O/BAS we find good agreement with experiment, for 2 and 3 H2O/BAS the predicted heats are significantly lower (6 to 18 kJ mol−1 per H2O molecule) than the ones obtained by calorimetry.3 Our predictions are in better agreement with the lower values from isotherm measurements38 than with the calorimetric values.3 The latter, however, are expected to be potentially more accurate.
One possible reason for that we find good agreement with experiment for 1 H2O/BAS, but significantly lower heats of adsorption for 2 and 3 H2O/BAS could be that we did not find the most stable conformers of the adsorbed water molecules yet, which is less unlikely for adsorption of more than one water molecule per BAS. Another possibility is that BAS at other framework positions which we did not investigate may adsorb water more strongly. However, this is not very likely as a PBE+D3 study of methanol adsorption on BAS in all T-site positions shows.98 It identified T12 and T7 as strongest adsorption sites,98 but found BAS at T10 and T4 which we did not consider about equally stable.
A more likely reason for our underestimation of the heats of adsorption for 2 and 3 H2O/BAS is that we have only considered isolated BAS. We have shown that larger water clusters can form H-bonds to framework oxygen atoms that are farther away from the active sites. If in such a position, e.g. across a channel or ring, another spatially proximate BAS was present, cooperativity between active sites could lead to a more exothermic water adsorption once a threshold loading is reached. Water adsorption at two BAS in spatial proximity is beyond the scope of this study and may be subject of future work.
4. Conclusions
For loading 1 H2O/BAS, the Brønsted-type approach is clearly favoured for most framework positions, but for some sites (T2, T6) very similar water adsorption energies are obtained for the Lewis-type approach. This highlights the relevance of this approach to BAS, e.g. for dealumination.99For 1 H2O/BAS we reach agreement within chemical accuracy limits (±4 kJ mol−1) between our MP2+ΔCC results for isolated BAS and experimental heats of adsorption.3,38 This shows that our method yields chemically accurate results and that our model (ideal, isolated active sites) accurately describes the experimental situation. This makes it possible to add the results for 1 H2O/BAS at T3 (intersection) and T7 (zig-zag channel) sites of H-MFI to our set of reference data for testing quantum chemical methods for molecule–surface interactions.17,47,51 For loadings of 2 and 3 H2O/BAS, our MP2+ΔCC predictions for ideal, isolated BAS are 6 to 18 kJ mol−1 per H2O molecule lower than the experimental heats of adsorption.3 This calls for a more thorough exploration of the conformational space using molecular dynamics or global optimisation methods as well as for the consideration of additional T-sites and pairs of sites100 in future studies.
Comparison of PBE+D2 results with MP2 structures and MP2+ΔCC energies provides further evidence that GGA-level exchange–correlation functionals in general, and PBE+D2 in particular, are unable to accurately describe H-bonded systems. The covalent O–H donor bonds are too much stretched (Fig. 6) and the degree of deprotonation is too high. The PBE+D2 adsorption energies are too binding and – even more critical – the error varies strongly between the different T-sites (Fig. 10) and different types of local minima (Fig. 11). The stability of the Brønsted-type approach compared to the Lewis-type approach is overestimated and ionic adsorption structures are overly stabilised.
This creates a dilemma for global sampling studies.101 Millions of points on the potential energy surface need to be calculated, and, therefore, many studies still rely on force fields. When DFT is used, GGA-type functionals such as PBE are the only ones affordable, see ref. 32, 41 and 100, for water–zeolite interactions. To close this gap, machine learning interatomic potentials (MLIP) hold promise,100,102,103 but they inherit all the limitations of the functionals on which they are parameterised. We have shown that GGA-functionals, and MLIPs parametrised on them, will not be able to reliably describe water–zeolite interactions, in particular not those which involve proton transfer. MLIPs based on MP2 data seem within reach now at least when very efficient periodic MP2 codes are used.104 With the MP2 code81 we have used for the cluster models, the computational cost per structure optimisation step is only four times higher for MP2 than for PBE+D2. In any case, the MP2 structures and MP2+ΔCC energies presented here will be useful benchmarks for MLIPs at the MP2 level. Availability of such MLIPs would also allow to expand the scope of water–zeolite studies to models that take site–site interactions and site heterogeneity into account. Moreover, the full range of water loading up to completely filled water pores could be studied and all this for different framework structures.
Author contributions
H. Windeck: conceptualisation, writing – original draft, writing – review and editing, data curation, formal analysis, investigation, methodology, validation, visualisation, funding acquisition. F. Berger: conceptualisation, writing – review and editing, formal analysis, methodology, validation, supervision, funding acquisition. J. Sauer: conceptualisation, writing – original draft, writing – review and editing, formal analysis, supervision, funding acquisition, project administration, resources.Data availability
The data supporting this article, x,y,z coordinates and absolute energies of the MP2:PBE+D2 optimised structures as well as example inputs have been included as part of the ESI.†Conflicts of interest
The authors declare no conflict of interest.Acknowledgements
Dedicated to the memory of Petr Nachtigall, Prague, who prematurely passed away on December 28, 2022. We thank Dr Yue Liu and Prof. Johannes Lercher for providing the original data from ref. 3. We also acknowledge the late Prof. Petr Nachtigall (Prague) and his group for discussions. This work has been funded by the Deutsche Forschungsgemeinschaft (DFG, German Research Foundation) – 514934444 and by the Charles University Centre of Advanced Materials (CUCAM, OPVVV Excellent Research Teams, project number CZ.02.1.01/0.0/0.0/15_003/0000417). Support by the Fonds der Chemischen Industrie is also acknowledged. H. W. is a member of the International Max Planck Research School for Elementary Processes in Physical Chemistry and holds a Kekulé fellowship of the Fonds der Chemischen Industrie. F. B. is indebted to the German Academic Scholarship Foundation for a PhD fellowship, to the Alexander von Humboldt Foundation for a Feodor Lynen Research Fellowship, to the Isaac Newton Trust for an Early Career Fellowship, and to Churchill College, Cambridge, for a Postdoctoral By-Fellowship. The North German Supercomputing Alliance (HLRN) is acknowledged for computer time (grant bec00241).References
- P. del Campo, C. Martínez and A. Corma, Chem. Soc. Rev., 2021, 50, 8511–8595 RSC.
- M. Wang, N. R. Jaegers, M.-S. Lee, C. Wan, J. Z. Hu, H. Shi, D. Mei, S. D. Burton, D. M. Camaioni, O. Y. Gutiérrez, V.-A. Glezakou, R. Rousseau, Y. Wang and J. A. Lercher, J. Am. Chem. Soc., 2019, 141, 3444–3455 CrossRef CAS PubMed.
- S. Eckstein, P. H. Hintermeier, R. Zhao, E. Baráth, H. Shi, Y. Liu and J. A. Lercher, Angew. Chem., Int. Ed., 2019, 58, 3450–3455 CrossRef CAS PubMed.
- J. S. Bates, B. C. Bukowski, J. Greeley and R. Gounder, Chem. Sci., 2020, 11, 7102–7122 RSC.
- D. Mei and J. A. Lercher, J. Phys. Chem. C, 2019, 123, 25255–25266 CrossRef CAS.
- K. De Wispelaere, C. S. Wondergem, B. Ensing, K. Hemelsoet, E. J. Meijer, B. M. Weckhuysen, V. Van Speybroeck and J. Ruiz-Martínez, ACS Catal., 2016, 6, 1991–2002 CrossRef CAS.
- C. Wang, M. Zheng, M. Hu, W. Cai, Y. Chu, Q. Wang, J. Xu and F. Deng, J. Am. Chem. Soc., 2024, 146, 8688–8696 CrossRef CAS PubMed.
- J. Sauer, in Handbook of Hydrogen Transfer, ed. R. L. Schowen, J. P. Klinman, J. T. Hynes and H.-H. Limbach, Wiley-VCH, Weinheim, 2006, vol. 2, pp. 685–707 Search PubMed.
- D. E. Resasco, S. P. Crossley, B. Wang and J. L. White, Catal. Rev., 2021, 63, 302–362 CrossRef CAS.
- W. J. Mortier, J. Sauer, J. A. Lercher and H. Noller, J. Phys. Chem., 1984, 88, 905–912 CrossRef CAS.
- M. Krossner and J. Sauer, J. Phys. Chem., 1996, 100, 6199–6211 CrossRef CAS.
- S. A. Zygmunt, L. A. Curtiss, L. E. Iton and M. K. Erhardt, J. Phys. Chem., 1996, 100, 6663–6671 CrossRef CAS.
- E. Nusterer, P. E. Blöchl and K. Schwarz, Chem. Phys. Lett., 1996, 253, 448–455 CrossRef CAS.
- M.-C. Silaghi, C. Chizallet, E. Petracovschi, T. Kerber, J. Sauer and P. Raybaud, ACS Catal., 2015, 5, 11–15 CrossRef CAS.
- J. P. Perdew, K. Burke and M. Ernzerhof, Phys. Rev. Lett., 1996, 77, 3865–3868 CrossRef CAS PubMed.
- L. Li and K. Burke, in Handbook of Materials Modeling: Methods: Theory and Modeling, ed. W. Andreoni and S. Yip, Springer International Publishing, Cham, 2020, pp. 213–226 DOI:10.1007/978-3-319-44677-6_11.
- J. Sauer, Acc. Chem. Res., 2019, 52, 3502–3510 CrossRef CAS PubMed.
- J. A. Pople, Angew. Chem., Int. Ed., 1999, 38, 1894–1902 CrossRef CAS PubMed.
- M. Urban, J. Noga, S. J. Cole and R. J. Bartlett, J. Chem. Phys., 1985, 83, 4041–4046 CrossRef CAS.
- K. Raghavachari, G. W. Trucks, J. A. Pople and M. Head-Gordon, Chem. Phys. Lett., 1989, 157, 479–483 CrossRef CAS.
- A. Jentys, G. Warecka, M. Derewinski and J. A. Lercher, J. Phys. Chem., 1989, 93, 4837–4843 CrossRef CAS.
- F. Wakabayashi, J. N. Kondo, K. Domen and C. Hirose, J. Phys. Chem., 1996, 100, 1442–1444 CrossRef CAS.
- V. V. Mihaleva, R. A. van Santen and A. P. J. Jansen, J. Chem. Phys., 2004, 120, 9212–9221 CrossRef CAS PubMed.
- H. Jobic, A. Tuel, M. Krossner and J. Sauer, J. Phys. Chem., 1996, 100, 19545–19550 CrossRef CAS.
- J. Sauer, Science, 1996, 271, 774–775 CrossRef.
- L. Smith, A. K. Cheetham, R. E. Morris, L. Marchese, J. M. Thomas, P. A. Wright and J. Chen, Science, 1996, 271, 799–802 CrossRef CAS.
- V. Termath, F. Haase, J. Sauer, J. Hutter and M. Parrinello, J. Am. Chem. Soc., 1998, 120, 8512–8516 CrossRef CAS.
- Y. Jeanvoine, J. G. Angyan, G. Kresse and J. Hafner, J. Phys. Chem. B, 1998, 102, 7307–7310 CrossRef CAS.
- M. V. Vener, X. Rozanska and J. Sauer, Phys. Chem. Chem. Phys., 2009, 11, 1702–1712 RSC.
- W. Reschetilowski and W. Hönle, On Catalysis, VWB, Verlag für Wiss. und Bildung, 2010 Search PubMed.
- S. Grimme, J. Comput. Chem., 2006, 27, 1787–1799 CrossRef CAS PubMed.
- E. Grifoni, G. Piccini, J. A. Lercher, V.-A. Glezakou, R. Rousseau and M. Parrinello, Nat. Commun., 2021, 12, 2630 CrossRef CAS PubMed.
- Y. Zhang and W. Yang, Phys. Rev. Lett., 1998, 80, 890 CrossRef CAS.
- S. Grimme, J. Antony, S. Ehrlich and H. Krieg, J. Chem. Phys., 2010, 132, 154104 CrossRef PubMed.
- J. H. Hack, J. P. Dombrowski, X. Ma, Y. Chen, N. H. C. Lewis, W. B. Carpenter, C. Li, G. A. Voth, H. H. Kung and A. Tokmakoff, J. Am. Chem. Soc., 2021, 143, 10203–10213 CrossRef CAS PubMed.
- J. H. Hack, X. Ma, Y. Chen, J. P. Dombrowski, N. H. C. Lewis, C. Li, H. H. Kung, G. A. Voth and A. Tokmakoff, J. Phys. Chem. C, 2023, 127, 16175–16186 CrossRef CAS.
- F. Haase and J. Sauer, J. Phys. Chem., 1994, 98, 3083–3085 CrossRef CAS.
- D. H. Olson, W. O. Haag and W. S. Borghard, Microporous Mesoporous Mater., 2000, 35–36, 435–446 CrossRef CAS.
- V. Bolis, C. Busco and P. Ugliengo, J. Phys. Chem. B, 2006, 110, 14849–14859 CrossRef CAS PubMed.
- K. L. Joshi, G. Psofogiannakis, A. C. T. van Duin and S. Raman, Phys. Chem. Chem. Phys., 2014, 16, 18433–18441 RSC.
- P. Liu and D. Mei, J. Phys. Chem. C, 2020, 124, 22568–22576 CrossRef CAS.
- K. Stanciakova, B. Ensing, F. Göltl, R. E. Bulo and B. M. Weckhuysen, ACS Catal., 2019, 9, 5119–5135 CrossRef CAS.
- D. Mei and J. A. Lercher, AlChE J., 2017, 63, 172–184 CrossRef CAS.
- J. P. Perdew and K. Schmidt, AIP Conf. Proc., 2001, 577, 1–20 CrossRef CAS.
- G. Piccini, M. Alessio, J. Sauer, Y. Zhi, Y. Liu, R. Kolvenbach, A. Jentys and J. A. Lercher, J. Phys. Chem. C, 2015, 119, 6128–6137 CrossRef CAS.
- T. J. Goncalves, P. N. Plessow and F. Studt, ChemCatChem, 2019, 11, 4368–4376 CrossRef CAS.
- Q. Ren, M. Rybicki and J. Sauer, J. Phys. Chem. C, 2020, 124, 10067–10078 CrossRef CAS.
- F. R. Rehak, G. Piccini, M. Alessio and J. Sauer, Phys. Chem. Chem. Phys., 2020, 22, 7577–7585 RSC.
- F. Berger, M. Rybicki and J. Sauer, J. Catal., 2021, 395, 117–128 CrossRef CAS.
- K. Stanciakova, J. N. Louwen, B. M. Weckhuysen, R. E. Bulo and F. Göltl, J. Phys. Chem. C, 2021, 125, 20261–20274 CrossRef CAS.
- F. Berger, M. Rybicki and J. Sauer, ACS Catal., 2023, 13, 2011–2024 CrossRef CAS.
- C. Tuma and J. Sauer, Chem. Phys. Lett., 2004, 387, 388–394 CrossRef CAS.
- G. Piccini, M. Alessio and J. Sauer, Phys. Chem. Chem. Phys., 2018, 20, 19964–19970 RSC.
- H. Windeck, F. Berger and J. Sauer, Angew. Chem., Int. Ed., 2023, 62, e202303204 CrossRef CAS PubMed.
- J. Sauer, P. Ugliengo, E. Garrone and V. R. Saunders, Chem. Rev., 1994, 94, 2095–2160 CrossRef CAS.
- F. Berger and J. Sauer, Angew. Chem., Int. Ed., 2021, 60, 3529–3533 CrossRef CAS PubMed.
- Y. Xue, T. M. Sexton, J. Yang and G. S. Tschumper, Phys. Chem. Chem. Phys., 2024, 26, 12483–12494 RSC.
- J. A. Pople, J. S. Binkley and R. Seeger, Int. J. Quantum Chem., 1976, 10, 1–19 CrossRef CAS.
- M. Alessio, D. Usvyat and J. Sauer, J. Chem. Theory Comput., 2019, 15, 1329–1344 CrossRef CAS PubMed.
- A. D. Becke, J. Chem. Phys., 1993, 98, 5648–5652 CrossRef CAS.
- C. Lee, W. Yang and R. G. Parr, Phys. Rev. B: Condens. Matter Mater. Phys., 1988, 37, 785–789 CrossRef CAS PubMed.
- T. Kerber, M. Sierka and J. Sauer, J. Comput. Chem., 2008, 29, 2088–2097 CrossRef CAS PubMed.
- G. Kresse and J. Furthmüller, Comput. Mater. Sci., 1996, 6, 15–50 CrossRef CAS.
- G. Kresse and J. Furthmüller, Phys. Rev. B: Condens. Matter Mater. Phys., 1996, 54, 11169–11186 CrossRef CAS PubMed.
- G. Kresse and J. Hafner, Phys. Rev. B: Condens. Matter Mater. Phys., 1993, 47, 558–561 CrossRef CAS PubMed.
- G. Kresse and D. Joubert, Phys. Rev. B: Condens. Matter Mater. Phys., 1999, 59, 1758–1775 CrossRef CAS.
- M. Rybicki and J. Sauer, J. Am. Chem. Soc., 2018, 140, 18151–18161 CrossRef CAS PubMed.
- A. Hoffman, M. DeLuca and D. Hibbitts, J. Phys. Chem. C, 2019, 123, 6572–6585 CrossRef CAS.
- U. Eichler, C. M. Kölmel and J. Sauer, J. Comput. Chem., 1997, 18, 463–477 CrossRef CAS.
- M. Sierka and J. Sauer, J. Chem. Phys., 2000, 112, 6983–6996 CrossRef CAS.
- C. Møller and M. S. Plesset, Phys. Rev., 1934, 46, 618–622 CrossRef.
- C. Tuma and J. Sauer, Phys. Chem. Chem. Phys., 2006, 8, 3955–3965 RSC.
- M. Alessio, F. A. Bischoff and J. Sauer, Phys. Chem. Chem. Phys., 2018, 20, 9760–9769 RSC.
- F. A. Bischoff, M. Alessio, F. Berger, M. John, M. Rybicki and J. Sauer, Multi-Level Energy Landscapes: The MonaLisa Program, 2019 Search PubMed.
- F. Neese, Wiley Interdiscip. Rev.: Comput. Mol. Sci., 2012, 2, 73–78 CAS.
- F. Neese, Wiley Interdiscip. Rev.: Comput. Mol. Sci., 2018, 8, e1327 Search PubMed.
- F. Weigend and R. Ahlrichs, Phys. Chem. Chem. Phys., 2005, 7, 3297–3305 RSC.
- C. Tuma and J. Sauer, J. Chem. Phys., 2015, 143, 102810 CrossRef PubMed.
- S. Svelle, C. Tuma, X. Rozanska, T. Kerber and J. Sauer, J. Am. Chem. Soc., 2009, 131, 816–825 CrossRef CAS PubMed.
- F. Pavošević, P. Pinski, C. Riplinger, F. Neese and E. F. Valeev, J. Chem. Phys., 2016, 144, 144109 CrossRef PubMed.
- P. Pinski, C. Riplinger, E. F. Valeev and F. Neese, J. Chem. Phys., 2015, 143, 034108 CrossRef PubMed.
- M. Feyereisen, G. Fitzgerald and A. Komornicki, Chem. Phys. Lett., 1993, 208, 359–363 CrossRef CAS.
- T. H. Dunning, Jr., J. Chem. Phys., 1989, 90, 1007–1023 CrossRef.
- D. E. Woon and T. H. Dunning, Jr., J. Chem. Phys., 1993, 98, 1358–1371 CrossRef CAS.
- F. Jensen, Theor. Chem. Acc., 2005, 113, 267–273 Search PubMed.
- T. Helgaker, W. Klopper, H. Koch and J. Noga, J. Chem. Phys., 1997, 106, 9639–9646 CrossRef CAS.
- S. F. Boys and F. Bernardi, Mol. Phys., 1970, 19, 553–566 CrossRef CAS.
- H. V. Koningsveld, Acta Crystallogr., Sect. B, 1990, 46, 731–735 CrossRef.
- O. H. Han, C.-S. Kim and S. B. Hong, Angew. Chem., Int. Ed., 2002, 41, 469–472 CrossRef CAS PubMed.
- S. Sklenak, J. Dědeček, C. Li, B. Wichterlová, V. Gábová, M. Sierka and J. Sauer, Angew. Chem., Int. Ed., 2007, 46, 7286–7289 CrossRef CAS PubMed.
- B. C. Knott, C. T. Nimlos, D. J. Robichaud, M. R. Nimlos, S. Kim and R. Gounder, ACS Catal., 2018, 8, 770–784 CrossRef CAS.
- M. Sierka and J. Sauer, J. Phys. Chem. B, 2001, 105, 1603–1613 CrossRef CAS.
- J. A. Ryder, A. K. Chakraborty and A. T. Bell, J. Phys. Chem. B, 2000, 104, 6998–7011 CrossRef CAS.
- M. Brändle and J. Sauer, J. Am. Chem. Soc., 1998, 120, 1556–1570 CrossRef.
- A. Ghorbanpour, J. D. Rimer and L. C. Grabow, Catal. Commun., 2014, 52, 98–102 CrossRef CAS.
- J. Sauer, H. Horn, M. Häser and R. Ahlrichs, Chem. Phys. Lett., 1990, 173, 26–32 CrossRef CAS.
- L. Ruiz Pestana, N. Mardirossian, M. Head-Gordon and T. Head-Gordon, Chem. Sci., 2017, 8, 3554–3565 RSC.
- A. T. Smith, P. N. Plessow and F. Studt, J. Phys. Chem. C, 2021, 125, 20373–20379 CrossRef CAS.
- M.-C. Silaghi, C. Chizallet, J. Sauer and P. Raybaud, J. Catal., 2016, 339, 242–255 CrossRef CAS.
- M. Zheng and B. C. Bukowski, J. Phys. Chem. C, 2024, 128, 7549–7559 CrossRef CAS.
- J. Sauer, J. Catal., 2024, 433, 115482 CrossRef CAS.
- A. Erlebach, P. Nachtigall and L. Grajciar, npj Comput. Mater., 2022, 8, 174 CrossRef CAS.
- A. Erlebach, M. Šípka, I. Saha, P. Nachtigall, C. J. Heard and L. Grajciar, Nat. Commun., 2024, 15, 4215 CrossRef CAS PubMed.
- N. O’Neill, B. X. Shi, K. Fong, A. Michaelides and C. Schran, J. Phys. Chem. Lett., 2024, 15, 6081–6091 CrossRef PubMed.
Footnotes |
| † Electronic supplementary information (ESI) available: Tests for settings within the embedding scheme, as well as energies, structural features, and experimental data. In addition, we provide x,y,z coordinates and absolute energies of the MP2:PBE+D2 optimised structures as well as example inputs. See DOI: https://doi.org/10.1039/d4cp02851a |
| ‡ Present address: Yusuf Hamied Department of Chemistry, University of Cambridge, CB2 1EW Cambridge, UK. |
| This journal is © the Owner Societies 2024 |

