
Understanding the motional dynamics of the ammonium ion in the mechanism of multiferroicity of Cr(V) peroxychromates: a 1H NMR study
Raghabendra
Samantaray†
*a,
Debashis
Acharya†
a,
Anulipsa
Priyadarshini
a,
Rojalin
Sahu
 *a,
T.
Besara
bc and
Naresh S.
Dalal
bc
*a,
T.
Besara
bc and
Naresh S.
Dalal
bc
aKalinga School of Applied Sciences, KIIT University, Bhubaneswar, Odisha, India. E-mail: raghabendra.samantarayfch@kiit.ac.in
bDepartment of Chemistry and Biochemistry, Florida State University, Tallahassee, 32306, USA
cNational High Magnetic Field Laboratory, Tallahassee, Florida 32310, USA
First published on 5th September 2024
Abstract
Cr(5+)-based peroxychromates, M3Cr(O2)4, with M = NH4 or a mixed NH4-alkali metal are a new class of multiferroics for potential use in molecular memory devices, with the NH4+ being a key element, but the underlying chemical mechanism is not fully understood. The NH4+ ion occupies two different sites, but their specific roles are not known. We thus performed detailed 1H NMR spin-relaxation (T1) measurements on (NH4)3Cr(O2)4 over a wide temperature range (120–300 K) to probe the displacive as well as hindered rotational dynamics of the NH4+ ions with the view of understanding their specific roles in the phase transitions. The NH4+ dynamics is seen to consist of at least three different processes with varying activation energies. The sharp jump in the T1 at around 250 K is assigned to the change in the displacive motion at one of the two sites, while a kink around 140 K is ascribed to motional slowing at the second site. Interestingly, the slowing down starts around 250 K, well above the structural phase transition at 140 K. Taken together, these results provide a clue to the role of the site and symmetry of the NH4+ ion in the mechanism of solid–solid phase transitions.
1. Introduction
Multiferroics, with their concurrent magnetic and electric ordering, are potential candidates as materials for digital data storage and manipulation with significant advantages over the usual electric or magnetic elements.1–6 The ferroic order in these materials can be manipulated by material fabrication,7,8 and application of pressure,9 which can significantly improve the magnetoelectric coupling in the crystal. However, a clear understanding of the structural behavior is key to such modifications in these multiferroic materials. Earlier, we reported the multiferroic behavior of ammonium peroxychromate, (NH4)3Cr(O2)4, hereafter referred to as APC, showing that the introduction of N–H⋯O hydrogen bonding could induce ferroelectricity10,11 in the alkali metal peroxychromate12–15via hydrogen bonding behavior. Alkali metals of M3Cr(O2)4, where M = Na, K, Rb, and Cs, were replaced by NH4+ ions completely or partially to develop a new family of magnetic ferroelectrics. This strategy worked also for other families of multiferroics, such as those based on the dimethylammonium cation (DMA).16–20 However, the mechanism underlying the cooperative phenomenon leading to the multiferroic behavior, and especially the role of the NH4+ site, has not been clarified, which prompted us to undertake the present study.Another important reason for the present undertaking was that while many ferroelectric materials are known to involve the order–disorder behavior of the NH4+ ion, the role of its site symmetry has not been well studied because it is hard to find a lattice with two or more well characterized NH4+ sites. APC, which crystallizes with a space group of I![[4 with combining macron]](https://www.rsc.org/images/entities/char_0034_0304.gif) 2m at room temperature, features two distinctly different NH4+ ion sites located at and 2m respectively in the unit cell, labeled N1 and N2 (see Fig. 1), with different site symmetry. Each site could be substituted with an alkali metal to shift the transition temperature and probe its role in the transition mechanism. The present study thus enabled us to probe the role of the two different sites in a cooperative phase transition involving the NH4+ ion.
2m at room temperature, features two distinctly different NH4+ ion sites located at and 2m respectively in the unit cell, labeled N1 and N2 (see Fig. 1), with different site symmetry. Each site could be substituted with an alkali metal to shift the transition temperature and probe its role in the transition mechanism. The present study thus enabled us to probe the role of the two different sites in a cooperative phase transition involving the NH4+ ion.
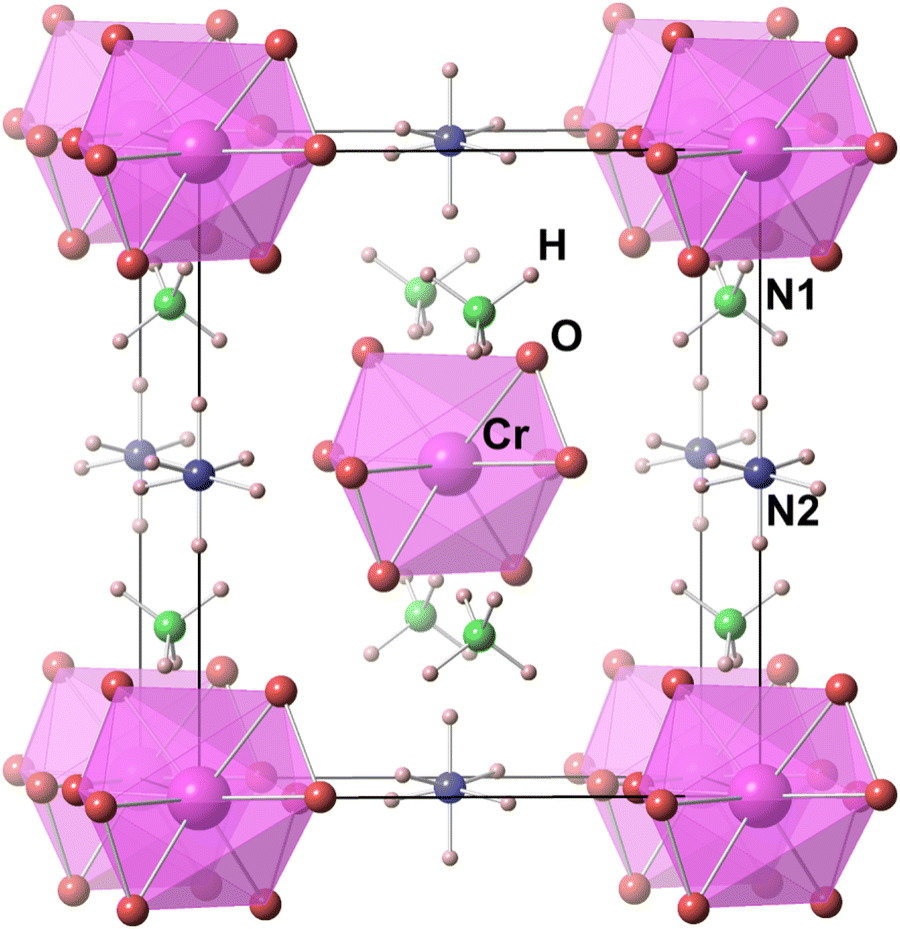 | ||
| Fig. 1 Room temperature structure of (NH4)3Cr(O2)4. Note that NH4+ at N1 (green) has a tetrahedral symmetry while NH4+ at N2 (blue), due to its orientational disorder, gives rise to an octahedral symmetry. Dodecahedron peroxychromate Cr(O2)43− groups are shown as light pink polyhedra. | ||
In our earlier studies on APC,10,11 we carried out variable temperature X-ray diffraction and heat capacity measurements to probe the displacements of the alkali metal and NH4+ ions related to the three different phase transitions, at temperatures 250 K (Tc1), 207 K (Tc2), and 137 K (Tc3). The report detailed X-ray structures at various temperatures, below and above each phase transition. Heat capacity measurements showed λ-type anomalies at Tc1 and Tc3, essentially first order character. At Tc2, however, the peak was broad, a signature of second order phase change and was ascribed to the internal dynamics of the ammonium ions. Dielectric measurements supported the heat capacity results, suggesting that the internal dynamics of the ammonium ions had a significant role in the transition mechanism but definitive measurement of the motional dynamics at the two NH4+ sites begged for further studies.
Since it is known that the motional dynamics of the NH4+ ion fall in the NMR range,21–24 we carried out 1H NMR on APC to help answer the following questions: (a) do the internal dynamics of ammonium ions at two sites differ significantly, (b) are the barriers to these motions different for the two sites, and (c) could we correlate the two sites to the phase transitions at Tc1, Tc2 and Tc3? Our findings are detailed below.
2. Experimental techniques
2.1. Synthesis, crystal preparation and sample purity
(NH4)3Cr(O2)4 was synthesized via the method described earlier by our group12–15 by dissolving 1 g (0.01 mol) of CrO3 in 10 ml of 25% (wt/wt) NH4OH at room temperature. This solution was then cooled to ∼5 C in an ice bath and then 30–40 ml of cold 20% H2O2 was added dropwise, with the solution in an ice bath, without stirring over the course of 1–2 hours. The reaction solution was kept in a refrigerator. The process of slow evaporation yielded 2 to 3 mm-size crystals after 6–7 days. The crystal structure and the overall sample purity were verified by single crystal and powder X-ray diffraction, respectively.10,112.2. NMR measurements
To study the role of the NH4+ ions, and their role in the dynamics of the phase transitions of APC, we measured the nuclear spin–lattice relaxation time T1 of the 1H nuclei across the phase transition temperatures (Tc1 ≈ 250 K, Tc2 ≈ 207 K, and Tc3 ≈ 137 K) over a relatively wide temperature range (120–290 K). T1 was used as a probe of the local order and molecular dynamics (time scale approximately 10−7–10−12 s) of the NH4+ units and was measured using a locally developed spectrometer available at the National High Magnetic Field Laboratory (NHMFL), Tallahassee, FL. For rf pulse generation, we used a computer-controlled pulse programmer, the PTS frequency synthesizer (Programmed Test Sources, Inc.). The standard π/2–τ–π/2 saturation recovery procedure was used with a field of 6.46 T (corresponding to 275 MHz for protons). The nuclear spin–lattice relaxation rates, 1/T1, were measured using a saturation recovery pulse sequence, and the NMR spectra were recorded by Fourier-transforming the FID (free induction decay) signals. The sample temperature was controlled to better than 0.1 K using a standard helium flow cryostat.3. Results
3.1. Linewidth
The first clear evidence of the dynamic nature of the NH4+ ion was observed in the temperature dependence of the 1H NMR signal.25Fig. 2(a) shows a typical 1H NMR signal from APC along with a Gaussian fit. Fig. 2(b) shows the temperature dependence of the full peak width at half maximum (FWHM). The line width broadens progressively upon cooling from room temperature, since it is related to the rate of atomic motion in a crystal. The tunnelling rate of the hydrogen atoms in the ammonium ion decreases upon cooling, gradually reducing the anisotropic dipolar interactions, and broadens the line width.26,27 | ||
| Fig. 2 (a) 1H NMR spectrum at 280 K along with a Gaussian fit of the peak. (b) Full width at half maximum of the spectra across the whole temperature region. The dashed lines are guides to the eye highlighting the different slopes. The transition temperatures are indicated by arrows. (c) Temperature dependence of the heat capacity of APC indicating phase transition temperatures. The red line refers to the heat capacity measurements at an applied magnetic field of 9 Tesla. | ||
Observing anomalies in the form of slope changes, the whole region can be roughly divided into five regions by considering the natural breaks: (a) 280–240 K, (b) 240–200 K, (c) 200–160 K, (d) 160–140 K, and (e) 140–120 K. These anomalies align with the observed phase transitions from heat capacity measurements in APC over a temperature range of 100–300 K (see Fig. 2(c)). Heat capacity measurements were conducted at a magnetic field of 9 Tesla to check if the magnetic field affects the phase transition temperatures. However, no significant change was observed, indicating that the phase transitions are completely structural in nature. The breaks in the line width are in close proximity to the phase transition temperatures, indicating that each of these regions broadly represents one characteristic structural phase in APC. After each structural phase change (Tc1, Tc2, and Tc3, marked on the figure), the local symmetry of NH4+ ions changes and that alters the tunnelling rate of the NH4+ ion resulting in the change of slope at around that temperature. This behavior is discussed in detail below when discussing the temperature dependence of the spin–lattice relaxation time T1.
3.2. Proton spin–lattice relaxation rates
Fig. 3 shows the proton spin–lattice relaxation rates, T1−1, across the temperature range 120–280 K. For convenience, the figure has been divided into four regions: (A) 280–260 K, (B) 260–210 K, (C) 210–140 K, and (D) 140–120 K, guided roughly by the phase transition temperatures.10,28 Upon cooling, T1−1 increases steadily in region (A), before it falls sharply at approximately 260 K. Below 260 K, T1−1 rises swiftly in region (B) but shows a divergence at approximately 207 K (Tc2), due to a possible freezing of the rotational degree of freedom of the NH4+ ion. On further temperature lowering, T1−1 decreases continually in region (C), before the spin–lattice relaxation adopts a different pathway at approximately 140 K (Tc3), as shown in region (D). The behavior of T1−1 in regions (B) and (C) is of particular interest as it represents the NH4+ ion dynamics at cation site N2 and also coincides with a characteristic slope change in the FWHM in Fig. 2(b). | ||
| Fig. 3 Proton spin–lattice relaxation rates, T1−1, as a function of temperature. The rates have been divided into four regions (A)–(D), roughly based on the phase transitions. | ||
4. Discussions
The reorientational motion of NH4+ ions that alters the intra-dipolar (1H–1H) interactions, tunes the spin–lattice relaxation time. Correlation times (τc), the timeframe between spin states of rotationally tunnelling molecules, are derived from the temperature dependence spin–lattice relaxation time by employing the Bloembergen–Purcell–Pound (BPP) equation29 | (1) |
 | (2) |
| Temperature range (K) | E a (kJ mol−1) | τ 0 (s) |
|---|---|---|
| 280–260 | 8.7 ± 0.7 | (4.5 ± 2.6) × 10−8 |
| 260–210 | 10.5 ± 0.4 | (2.5 ± 0.7) × 10−7 |
| 210–140 | 10.2 ± 0.6 | (1.4 ± 0.4) × 10−12 |
| 140–120 | 6.1 ± 2.0 | (1.2 ± 1) × 10−11 |
Since APC has two distinct cation sites occupied by NH4+ ions, we thus considered overlapping of T1 values from both sites at any given temperature, and observed anomalies in T1 as the NH4+ ions in the two sites started to order. In order to understand the spin–lattice relaxation rates, we made use of our detailed X-ray measurements to help with the assignments to the underlying motional changes. One of the significant observations from the X-ray studies is that the cation at site N2 undergoes hindered rotational motion about one axis whereas the cation at N1 does not. Space-filling considerations indicate that the NH4+ ion at site N2 with its continuous reorientational motion goes through an approximately inverted V-shaped minima in T1 (see Fig. 3) and is therefore responsible for the transition from region (B) to region (C). The activation energy for the reorientational motion of NH4+ ions at cation site N2 above and below Tc1 was determined to be 10.5 and 10.2 kJ mol−1 for the 1H nucleus, respectively. The ion at site N1 is responsible for the phase transition at 250 K, since it exhibits a discontinuity arising from a change in the diffusional motion occurring at a temperature close to the first structural phase transition, Tc1, a first-order phase transition.30 This result is in fair agreement with our previous result from heat capacity and dielectric studies.11
Further details follow from the fact that the N1 and N2 sites have distinctly different local environments: the ions at N1 have twelve O atoms as nearest neighbors whereas those at N2 have eight O atoms (see Fig. 4). In the presence of more than four O atoms (hydrogen bond acceptors) or at a similar distance from the nitrogen atom, there is the possibility of a disordered structure.31,32 In the case of APC, twelve neighboring O atoms of NH4+ ions at site N1 are at a range of N–H⋯O bond distances (2.811, 3.194, and 3.267 Å, see Table 2) whereas the eight oxygen neighbors of N2 are at two sets of bond distances (2.964 and 3.012 Å, see Table 2). It can be noticed that for N1, the cations are caged by O atoms in an uneven orientation, while those at site N2 have equivalent orientations. For N2, the N–H⋯O distances between 2 sets of oxygen atoms are approximately similar, varying by just ∼0.05 Å. In comparison to N1, the difference between the N–H⋯O distances between 3 sets of oxygen atoms varies by a noticeable ∼0.5 Å. The geometric relationship between the tetrahedron (N2–O2) and the square plane (N2–O1) (see Fig. 4(A)) indeed implies more complex disorder on this site. NH4+ ions at N1 form hydrogen bonds with neighboring oxygen atoms with a tetrahedral (Td) point group symmetry, whereas those at site N2 undergo a free rotation, essentially between two energy states with a low energy barrier to the hindered rotation.33–38
 | ||
| Fig. 4 (A) The crystal structure of ammonium peroxychromates showing hydrogen bonding arrangements (N–H⋯O): the seemingly octahedral ammonium cation is surrounded by 8 oxygen atoms, arranged in two sets of bond distances 2.964 and 3.012 Å, and the tetrahedral ammonium cation is surrounded by 12 oxygen atoms (three sets) at bond distances 2.811, 3.194, and 3.267 Å, respectively. (B) The possible symmetry axes for rotational motion of the tetrahedral ammonium cation. | ||
| No. of bonds | N1–H⋯O | N2–H⋯O |
|---|---|---|
| 1 | 3.267 | 2.964 |
| 2 | 2.811 | 3.012 |
| 3 | 2.811 | 3.012 |
| 4 | 3.194 | 2.964 |
| 5 | 3.267 | 2.964 |
| 6 | 3.267 | 3.012 |
| 7 | 3.194 | 3.012 |
| 8 | 2.811 | 2.964 |
| 9 | 2.811 | |
| 10 | 3.267 | |
| 11 | 3.194 | |
| 12 | 3.194 |
In summary, we can now understand why the NH4+ ions at the N2 site appear to be octahedral at T > TC. The hindered orientational motion of the ions at N2 appears to involve two distinct rotations, along C3 and C2 symmetry axis (see Fig. 4(B)) that gives rise to a pseudo-octahedral symmetry. Freezing of the rotational motion of these NH4+ ions at lower temperature creates new hydrogen bonding that leads to a phase transition in the crystal lattice.39–45
On the other hand, the reorientational motion of the NH4+ ion at N1 is usual, and does not change abruptly at the observed phase transition, and the ions exhibit the expected tetrahedral site symmetry. This implies that different motions are responsible for each region, with different correlation times for each motion (see Table 1).
5. Conclusions
This work was initiated with the view to understand how an NH4+ could appear to be octahedral at one site while exhibiting the usual, tetrahedral symmetry at a neighboring site. Clearly, we believe that the site symmetry and the surrounding barriers to its reorientational motion must be the underlying cause, but to our knowledge there has been no previous report relating site symmetry and molecular motion of an NH4+ ion, in a solid well characterized by variable temperature X-ray diffraction. In our case, our NMR studies reveal that among the two groups of NH4+ ions, at N1 and N2, only those at N2 undergo hindered reorientational motion with a barrier high enough that they are localized at temperatures higher than the transition temperature, and when their motion freezes, the lattice undergoes a phase transition. This knowledge should help design new multiferroics based on hydrogen bonded ferroelectrics using site symmetry analogy.Data availability
The crystallographic, heat capacity, dielectric, Raman and EPR data that support the findings of this study, which include the NMR analysis of the motional dynamics of ammonium ions in ammonium peroxychromate (APC), are reported in our earlier articles. The DOIs of those articles are as follows: (i) https://doi.org/10.1021/ja3065705, (ii) https://doi.org/10.1021/ja1117683.Conflicts of interest
There are no conflicts to declare.Acknowledgements
The NMR measurements were performed at the National High Magnetic Field Laboratory in Tallahassee, FL. We wish to thank Drs. Arneil P. Reyes and Philip L. Kuhns for significant help in the measurements. NHMFL is supported by the National Science Foundation cooperative agreement DMR-1157490 and the State of Florida.References
- N. A. Spaldin, S.-W. Cheong and R. Ramesh, Phys. Today, 2010, 63, 38–43 CrossRef.
- A. K. Cheetham and C. Rao, Science, 2007, 318, 58–59 CrossRef CAS PubMed.
- W. Eerenstein, N. Mathur and J. F. Scott, Nature, 2006, 442, 759–765 CrossRef CAS PubMed.
- D. Lebeugle, D. Colson, A. Forget, M. Viret, A. Bataille and A. Gukasov, Phys. Rev. Lett., 2008, 100, 227602 CrossRef CAS PubMed.
- E. Pardo, C. Train, H. Liu, L. M. Chamoreau, B. Dkhil, K. Boubekeur, F. Lloret, K. Nakatani, H. Tokoro and S. I. Ohkoshi, Angew. Chem., Int. Ed., 2012, 51, 8356–8360 CrossRef CAS PubMed.
- Y. Hu, S. Broderick, Z. Guo, A. T. N’Diaye, J. S. Bola, H. Malissa, C. Li, Q. Zhang, Y. Huang and Q. Jia, Nat. Commun., 2021, 12, 4602 CrossRef CAS PubMed.
- H. Sharifi Dehsari, M. Hassanpour Amiri and K. Asadi, ACS Nano, 2023, 17, 8064–8073 CrossRef CAS PubMed.
- M. Wu, J. Burton, E. Y. Tsymbal, X. C. Zeng and P. Jena, J. Am. Chem. Soc., 2012, 134, 14423–14429 CrossRef CAS PubMed.
- H. Zhou, H. Ding, Z. Yu, T. Yu, K. Zhai, B. Wang, C. Mu, F. Wen, J. Xiang and T. Xue, Inorg. Chem., 2022, 61, 9631–9637 CrossRef CAS PubMed.
- R. Samantaray, R. J. Clark, E. S. Choi, H. Zhou and N. S. Dalal, J. Am. Chem. Soc., 2011, 133, 3792–3795 CrossRef CAS PubMed.
- R. Samantaray, R. J. Clark, E. S. Choi, H. Zhou and N. S. Dalal, J. Am. Chem. Soc., 2012, 134, 15953–15962 CrossRef CAS PubMed.
- B. Cage, W. Geyer, K. A. Abboud and N. S. Dalal, Chem. Mater., 2001, 13, 871–879 CrossRef CAS.
- B. Cage and N. S. Dalal, Chem. Mater., 2001, 13, 880–890 CrossRef CAS.
- A. Harter, B. Cage, P. Nguyen, K. Abboud and N. Dalal, Polyhedron, 2005, 24, 2350–2354 CrossRef CAS.
- C. M. Ramsey, B. Cage, P. Nguyen, K. A. Abboud and N. S. Dalal, Chem. Mater., 2003, 15, 92–99 CrossRef CAS.
- P. Jain, N. S. Dalal, B. H. Toby, H. W. Kroto and A. K. Cheetham, J. Am. Chem. Soc., 2008, 130, 10450–10451 CrossRef CAS PubMed.
- P. Jain, V. Ramachandran, R. J. Clark, H. D. Zhou, B. H. Toby, N. S. Dalal, H. W. Kroto and A. K. Cheetham, J. Am. Chem. Soc., 2009, 131, 13625–13627 CrossRef CAS PubMed.
- T. Besara, P. Jain, N. S. Dalal, P. L. Kuhns, A. P. Reyes, H. W. Kroto and A. K. Cheetham, Proc. Natl. Acad. Sci. U. S. A., 2011, 108, 6828–6832 CrossRef.
- N. Abhyankar, M. Lee, M. Foley, E. S. Choi, G. Strouse, H. W. Kroto and N. S. Dalal, Phys. Status Solidi RRL, 2016, 10, 600–605 CrossRef CAS.
- J. S. Kinyon, R. Clark, N. S. Dalal, E. S. Choi and H. Zhou, Phys. Rev. B: Condens. Matter Mater. Phys., 2015, 92, 144103 CrossRef.
- O. Gunaydin-Sen, R. Fu, R. Achey and N. Dalal, Ferroelectrics, 2006, 337, 153–160 CrossRef CAS.
- R. Mukhopadhyay, P. Goyal and C. Carlile, Phys. Rev. B: Condens. Matter Mater. Phys., 1993, 48, 2880 CrossRef CAS PubMed.
- D. A. Johnson, Phys. Chem. Chem. Phys., 2000, 2, 2903–2906 RSC.
- M. Trefler and G. Wilkinson, Discuss. Faraday Soc., 1969, 48, 108–115 RSC.
- K. Rawlings, R. Marzke and W. Glaunsinger, J. Phys. Chem., 1984, 88, 3880–3885 CrossRef CAS.
- D. Smith, Chem. Rev., 1994, 94, 1567–1584 CrossRef CAS.
- N. Bloembergen, E. M. Purcell and R. V. Pound, Phys. Rev., 1948, 73, 679 CrossRef CAS.
- R. Samantaray and H. Zhou, Mater. Res. Bull., 2018, 107, 41–45 CrossRef CAS.
- W. Wong-Ng, L. Cook, C. Chiang, L. Swartzendruber, L. Bennett, J. Blendell and D. Minor, J. Mater. Res., 1988, 3, 832–839 CrossRef CAS.
- A. Desmedt, S. J. Kitchin, K. D. Harris, F. Guillaume, R. R. Tykwinski, M. Xu and M. A. Gonzalez, J. Phys. Chem. C, 2008, 112, 15870–15879 CrossRef CAS.
- H. Yu, D. Duan, H. Liu, T. Yang, F. Tian, K. Bao, D. Li, Z. Zhao, B. Liu and T. Cui, Sci. Rep., 2016, 6, 18918 CrossRef CAS PubMed.
- A. Remhof, Z. Łodziana, P. Martelli, O. Friedrichs, A. Züttel, A. V. Skripov, J. P. Embs and T. Strässle, Phys. Rev. B: Condens. Matter Mater. Phys., 2010, 81, 214304 CrossRef.
- A. Onodera and Y. Shiozaki, J. Phys. Soc. Jpn., 1979, 46, 157–166 CrossRef CAS.
- S. J. Grabowski, Chem. Rev., 2011, 111, 2597–2625 CrossRef CAS PubMed.
- E. Mason and M. Kreevoy, J. Am. Chem. Soc., 1955, 77, 5808–5814 CrossRef CAS.
- E. Kassab and E. Evleth, J. Am. Chem. Soc., 1987, 109, 1653–1661 CrossRef CAS.
- H. Hallam, Annu. Rep. Prog. Chem., Sect. A: Gen., Phys. Inorg. Chem., 1970, 67, 117–149 CAS.
- I. Brown, Acta Crystallogr., Sect. A: Cryst. Phys., Diffr., Theor. Gen. Crystallogr., 1976, 32, 24–31 CrossRef.
- J.-H. Kim, J. Baek and P. S. Halasyamani, Chem. Mater., 2007, 19, 5637–5641 CrossRef CAS.
- A. Birczyński, Z. Lalowicz and Z. Łodziana, Chem. Phys., 2004, 299, 113–122 CrossRef.
- A. V. Skripov, A. V. Soloninin, O. A. Babanova, H. Hagemann and Y. Filinchuk, J. Phys. Chem. C, 2010, 114, 12370–12374 CrossRef CAS.
- K. Shin, I. L. Moudrakovski, M. D. Davari, S. Alavi, C. I. Ratcliffe and J. A. Ripmeester, CrystEngComm, 2014, 16, 7209–7217 RSC.
- L. M. Malec, M. Gryl and K. M. Stadnicka, Inorg. Chem., 2018, 57, 4340–4351 CrossRef CAS PubMed.
- S. Li, K. Wang, M. Zhou, Q. Li, B. Liu, G. Zou and B. Zou, J. Phys. Chem. B, 2011, 115, 8981–8988 CrossRef CAS PubMed.
- C. J. Pickard and R. Needs, Nat. Mater., 2008, 7, 775–779 CrossRef CAS PubMed.
Footnote |
| † Equal contributions. |
| This journal is © the Owner Societies 2024 |