
 Open Access Article
 This Open Access Article is licensed under a
 Creative Commons Attribution 3.0 Unported Licence
On the influence of metal nanoparticle and π-system sizes in the stability of noncovalent adducts: a theoretical study†
Sergi
Burguera
,
María de las Nieves
Piña
 and
Antonio
Bauzá
*
and
Antonio
Bauzá
*
Department of Chemistry, Ctra. de Valldemossa, km. 7.5, Universitat de les Illes Balears, Palma de Mallorca (Baleares), 07122, Spain. E-mail: antonio.bauza@uib.es
First published on 15th July 2024
Abstract
Herein we have computationally evaluated the relationship between Ag and Au nanoparticle (Ag/AuNP) size and π-surface extension in the formation of noncovalent complexes at the PBE0-D3/def2-TZVP level of theory. The NP–π interaction is known in supramolecular chemistry as a Regium–π bond (Rg–π), and differentiates from classical coordination bonds in strength and type of metal orbitals involved. In this study, the Rg–π complexes involved small Ag/AuNPs composed by 1 to 5 atoms and benzene, naphthalene and anthracene as π-systems, being characterized using several molecular modeling tools, including molecular electrostatic potential (MEP) calculations, energy decomposition analysis (EDA), quantum theory of atoms in molecules (QTAIM), non covalent interaction plot (NCIplot) and natural bonding orbital (NBO) methodologies. We believe the results reported herein will be useful for those scientists working in catalysis, molecular recognition and materials science fields, where structural–energetic relationships of weak interactions are crucial to achieve product selectivity, a particular molecular recognition mode or a specific molecular assembly.
Introduction
The incorporation of nanotechnology in the field of catalysis has led to a myriad of transformative possibilities, where the unique properties of nanomaterials facilitate new applications for catalytic processes.1 Among them, Ag and Au nanoparticles (NPs) have emerged as powerful catalysts, showcasing a remarkable efficacy in a wide variety of processes.2 Consequently, the development of novel synthetic approaches, such as seed-mediated growth, template-assisted synthesis or microfluidic synthesis, has enabled the obtention of metal NPs with specific morphologies and enhanced catalytic activity.3–5 In this context, the interaction of Ag and AuNPs with aromatic substrates has attracted significant attention, owing to the intricate interplay between surface chemistry, electronic structure, and catalytic activity.6 Aromatic molecules are interesting substrates for catalytic transformations, since their π-basicity facilitates adsorption onto the metal NP surface, where they undergo activation and subsequent transformations.7Ag and Au NPs catalyse a plethora of reactions involving aromatic substrates, including the synthesis of heterocycles,8 cross-coupling reactions,9 and functional group transformations.10 For instance, AuNPs functionalized with ligands or supported on solid substrates exhibit high activity and selectivity in the synthesis of benzimidazoles,11 benzofurans,12 and other heterocyclic compounds. Similarly, AgNPs serve as efficient catalysts for the arylation of aromatic compounds and the functionalization of aromatic rings with diverse functional groups.13
Beyond organic synthesis, the catalytic processes involving Ag and AuNPs and aromatic substrates have shown potential application in environmental remediation and energy-related applications. For instance, they facilitate the degradation of aromatic pollutants, such as phenols, dyes, and pesticides, through heterogeneous catalytic reactions.14 Moreover, Ag and AuNPs are involved in the conversion of biomass-derived aromatic molecules into valuable chemicals and fuels, thus contributing to the development of sustainable energy technologies.15 Lastly, novel applications have been found in emerging areas such as electrocatalysis,16 photocatalysis,17 and enzymatic catalysis.18 Consequently, advancing in the understanding of the underlying mechanisms governing the catalytic activity of Ag/AuNPs (e.g. the role of surface defects, ligand interactions, and electronic structure) is crucial to provide valuable insights into catalyst–substrate interactions and reaction pathways.
Our aim in this exploratory work is to investigate the structural–energetic relationship between small Ag/AuNPs and π-surface sizes, and their influence on the stability of NP–π noncovalent adducts. The NP–π noncovalent binding is achieved through the formation of Regium–π bonds (Rg–π),19 and several theoretical and experimental studies have delved into their physical nature and applications in supramolecular chemistry,20 environmental chemistry21 and materials science fields.22 To achieve this, we have used Ag/AuNPs of different sizes (from 1 to 5 atoms) and several electron rich π-systems (benzene, naphthalene and anthracene) (see Fig. 1). In addition, we have characterized the noncovalent complexes studied herein by means of molecular electrostatic potential (MEP) surface analysis, energy decomposition analysis (EDA) as well as the quantum theory of atoms in molecules (QTAIM), non covalent interaction plot (NCIplot) and natural bonding orbital (NBO) methodologies. We believe the results reported herein will be useful for those scientists working in catalysis, molecular recognition and materials science fields, where the fine-tuning of weak interactions is crucial to achieve product selectivity, a particular molecular conformation or a precise supramolecular architecture.
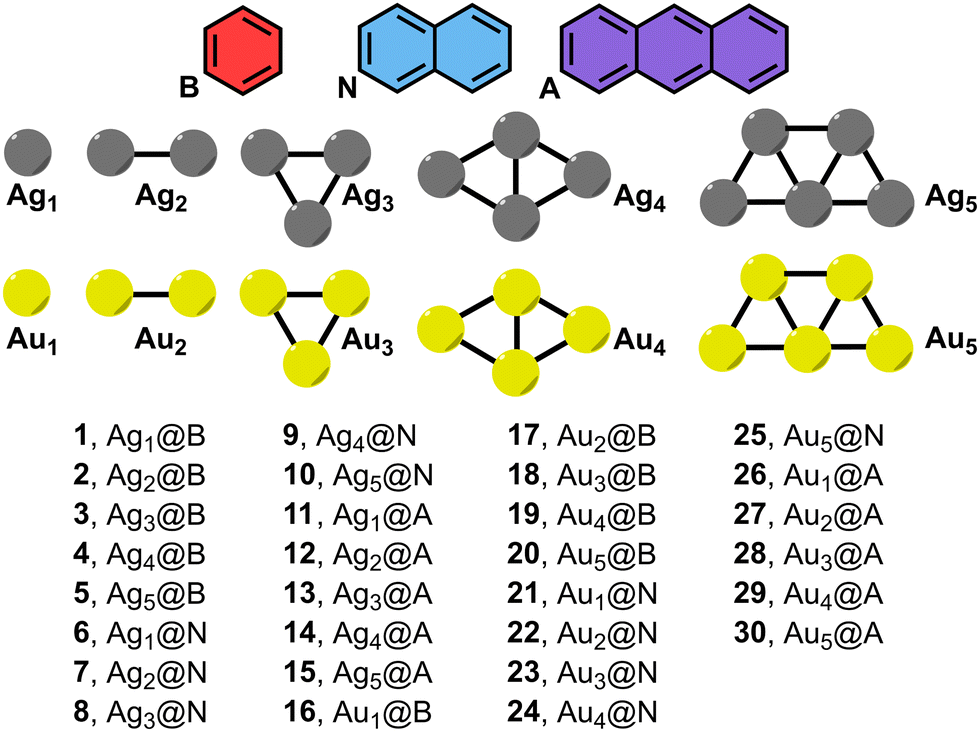 | ||
| Fig. 1 Compounds and complexes 1 to 30 used in this study (B = benzene, N = naphthalene and A = anthracene). | ||
Computational methods
The interaction energies of all complexes included in this study were computed at the PBE023,24-D325/def2-TZVP26 level of theory. The calculations have been performed using the program TURBOMOLE version 7.7.27 The interaction energies were calculated using the supermolecule approximation (ΔE = ERg–π complex − Eπ-system − EAg/AuNP). During the optimizations no symmetry point group was imposed, except for complexes 2, 13, 14, 17 and 29, where the Cs symmetry point group was used. In addition, for complexes 3 and 20 one Ag/Au⋯C–C angle was kept frozen during the optimization (see Fig. 2 below), while for complexes 8 and 23 one Ag–Ag/Au–Au distance was fixed to preserve the NP geometry (see Fig. S1 in ESI† for more details). The MEP surfaces were computed at the PBE0/def2-TZVP level of theory by means of the Gaussian 16 software28 and analyzed using the Gaussview 5.0 program.29 The calculations for the wavefunction analysis were carried out at the PBE0/def2-TZVP level of theory (also using the Gaussian 16 software) and analyzed by means of the AIMall software.30 The NBO31 analyses were performed at the PBE0-D3/def2-TZVP level of theory. In addition, the energy decomposition analysis (EDA)32,33 scheme was used to understand the role of electrostatics, exchange-repulsion, orbital, dispersion and electron correlation contributions in the formation of the noncovalent complexes studied herein at the PBE0-D3/def2-TZVP level of theory, also using TURBOMOLE 7.7 software.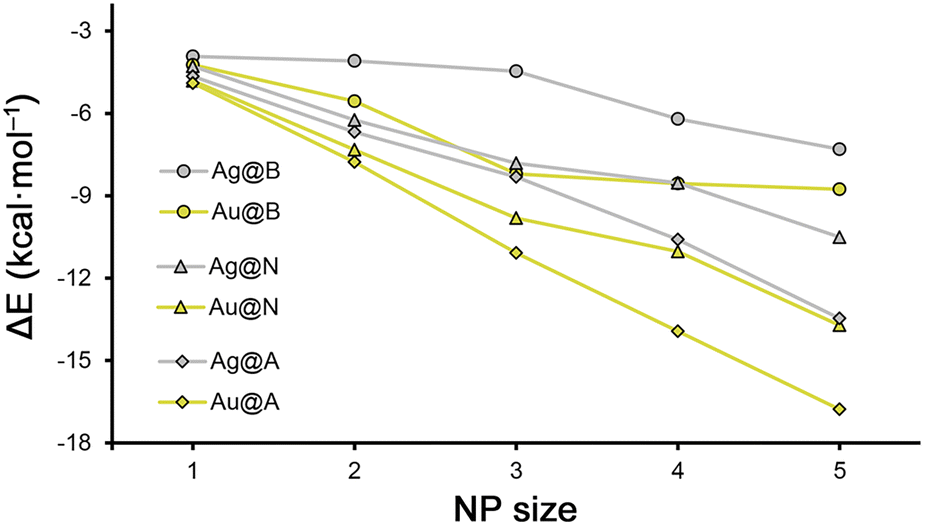 | ||
| Fig. 2 Rg–π interaction energies (ΔE) vs. Ag/AuNP size for benzene (B), naphthalene (N) and anthracene (A) rings. | ||
Lastly, the NCIplot34 isosurfaces correspond to both favorable and unfavorable interactions, as differentiated by the sign of the second-density Hessian eigenvalue and defined by the isosurface color. The color scheme is a red–yellow–green–blue scale, with red for repulsive (ρcut+) and blue for attractive (ρcut−) NCI interaction density. Yellow and green surfaces correspond to weak repulsive and weak attractive interactions, respectively. The surfaces were visualized using the visual molecular dynamics (VMD) software.35
Results and discussion
Energetic study
As a starting point, we computed the interaction energies of the Rg–π complexes 1 to 30 (see Table 1 below). Firstly, in all the cases the energetic values obtained were attractive, varying from weak (e.g. complex 1 (Ag1@B), −3.9 kcal mol−1) to moderately strong nature (e.g. complex 30 (Au5@A), −16.8 kcal mol−1). Secondly, for both Ag and AuNPs, the interaction energies became more favorable upon increasing the NP size (e.g. complex 6 (Ag1@N), −4.3 kcal mol−1 and complex 10 (Ag5@N), −10.5 kcal mol−1) as well as the π-system used (e.g. complex 17 (Au2@B), −5.6 kcal mol−1, complex 22 (Au2@N), −7.3 kcal mol−1 and complex 27 (Au2@A), −7.8 kcal mol−1).| Complex | ΔE | d | ρ × 100 |
|---|---|---|---|
| a Values measured as the shortest Rg⋯C distance. | |||
| 1 (Ag1@B) | −3.9 | 3.557 | 0.65 |
| 2 (Ag2@B) | −4.1 | 3.426 | 0.84 |
| 3 (Ag3@B) | −4.5 | 3.183 | 0.77 |
| 4 (Ag4@B) | −6.2 | 3.443 | 0.65 |
| 5 (Ag5@B) | −7.3 | 3.092 | 1.35 |
| 6 (Ag1@N) | −4.3 | 3.301 | 0.98 |
| 7 (Ag2@N) | −6.2 | 3.506 | 0.63 |
| 8 (Ag3@N) | −7.8 | 3.450 | 0.83 |
| 9 (Ag4@N) | −8.5 | 3.490 | 0.67 |
| 10 (Ag5@N) | −10.5 | 3.221 | 0.75 |
| 11 (Ag1@A) | −4.7 | 3.477 | 0.72 |
| 12 (Ag2@A) | −6.7 | 3.417 | 0.77 |
| 13 (Ag3@A) | −8.3 | 3.318 | 0.84 |
| 14 (Ag4@A) | −10.6 | 3.399 | 0.68 |
| 15 (Ag5@A) | −13.5 | 3.464 | 0.77 |
| 16 (Au1@B) | −4.2 | 3.492 | 0.82 |
| 17 (Au2@B) | −5.6 | 3.309 | 1.23 |
| 18 (Au3@B) | −8.2 | 3.075 | 1.80 |
| 19 (Au4@B) | −8.6 | 3.331 | 0.89 |
| 20 (Au5@B) | −8.8 | 3.268 | 0.99 |
| 21 (Au1@N) | −4.8 | 3.126 | 1.55 |
| 22 (Au2@N) | −7.3 | 3.461 | 0.75 |
| 23 (Au3@N) | −9.8 | 3.398 | 1.11 |
| 24 (Au4@N) | −11.0 | 3.419 | 0.88 |
| 25 (Au5@N) | −13.7 | 3.074 | 0.48 |
| 26 (Au1@A) | −4.9 | 3.429 | 0.93 |
| 27 (Au2@A) | −7.8 | 3.298 | 1.01 |
| 28 (Au3@A) | −11.1 | 3.235 | 1.10 |
| 29 (Au4@A) | −13.9 | 3.201 | 0.81 |
| 30 (Au5@A) | −16.8 | 3.459 | 0.99 |
Despite of this, there are several cases where the increase in the stability of the Rg–π complex while increasing the NP size is subtle (less than 0.5 kcal mol−1), such as between complexes 1, 2 and 3 involving Ag1, Ag2 and Ag3 and benzene (−3.9, −4.1 and −4.5 kcal mol−1, respectively), or between complexes 18, 19 and 20 involving Au3, Au4 and Au5 and benzene (−8.2, −8.6 and −8.8. kcal mol−1, respectively). Additionally, when varying the size of the π-system used, we found some cases where the energy gain was also minimal, such as between complexes 6 and 11 (−4.3 and −4.7 kcal mol−1), and between complexes 21 and 26 (−4.8 and −4.9 kcal mol−1), involving Ag1 and Au1 and naphthalene and anthracene rings, respectively.
On the other hand, among the rest of the Rg–π complexes, the gain in stability upon increasing the NP size is of approximately 1 to 3 kcal mol−1, while when expanding the aromatic π-surface from benzene to anthracene, it is comprised between 1 and 3.5 kcal mol−1. These results are interesting, since they evidence a similar reinforcement of the Rg–π interaction strength upon increasing either the NP or the π-system size.
Ag/AuNP size vs. Rg–π strength
In Fig. 2 and 3 several plots are shown involving the strength of the Rg–π interaction and the increase in size of the metal NPs and π-systems considered. More in detail, in Fig. 2, the Rg–π interaction energy values vs. the NP size are represented, following the general tendency discussed above where the strength of the Rg–π increases upon increasing both the NP size and the extension of the π-system.Despite of this, when comparing all the series together, there are several Ag/Au Rg–π complexes that do not follow the general trend. For instance, we observed that complexes 8 (Ag3@N) and 13 (Ag3@A) obtained very similar interaction energy values (−7.8 and −8.3 kcal mol−1), thus mitigating the effect of increasing the π-surface available, which might be related to the size of the metal NP. In addition, between complexes 9 (Ag4@N) and 19 (Au4@B), where very similar interaction energy values were obtained (−8.5 and −8.6 kcal mol−1), which might be due to a compensating effect between the metal atom (Au is more polarisable than Ag) and the extension of the π-system used (naphthalene is larger than benzene). Lastly, between complexes 14 (Ag4@A) and 24 (Au4@N) and between complexes 15 (Ag5@A) and 25 (Au5@N) very similar Rg–π interaction strength values were also observed, also possibly due to the same reason as before. Furthermore, we also observed that those complexes involving anthracene as a π-system exhibited an almost linear profile in Fig. 2, in contrast to their analogues involving benzene and naphthalene, where we observed the formation of a “shoulder like” profile.
On the other hand, in Fig. 3a and b, the regression plots of the Rg–π interaction energies vs. the NP size are shown. More in detail, in the case of Fig. 3a each series involve a π-system, obtaining very good correlation coefficients in all three cases (R = 0.80 for benzene, 0.90 for naphthalene and 0.95 for anthracene, respectively). Additionally, very good correlation coefficients were obtained when all Ag and Au Rg–π complexes are gathered in the same representation (R = 0.79 for AgNPs and 0.84 for AuNPs, see Fig. 3b). These results are interesting, since they support the Rg–π interaction as a metal NP-aromatic surface recognition mode and can be used as a predicting tool for other metal NP sizes or aromatic systems.
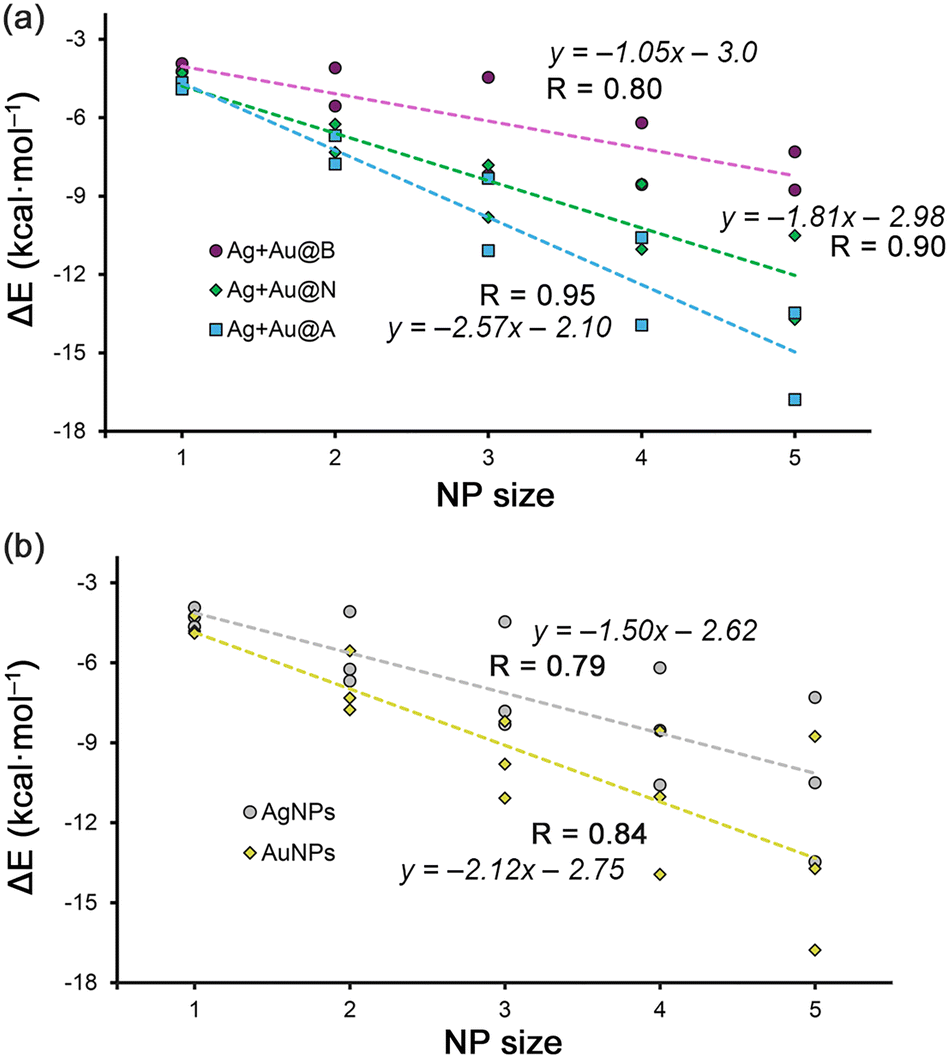 | ||
| Fig. 3 (a) and (b) Regression plots of the Rg–π interaction energy vs. Ag/AuNP size for benzene (B), naphthalene (N) and anthracene (A) systems. | ||
QTAIM and NCIplot analyses
In Fig. 4 the results from the combined QTAIM36 and NCIplot analyses are shown for a set of representative complexes (see Fig. S1 and S2 in ESI† for the rest of Rg–π complexes). As noted, in all the cases the Rg–π interaction is characterized by the presence of several intermolecular bond critical points (BCPs) and bond paths that connect the Ag/Au atoms from the metal NPs to the C atoms from the aromatic moieties. In most complexes, the BCP distribution is symmetrical, except for complexes 11 (Ag1@A) and 26 (Au1@A), where only a BCP and a bond path between the Ag/Au atom and one of the ring C atoms was found. Interestingly, no additional BCPs involving ancillary interactions were found, thus indicating that the interaction energies obtained for complexes 1 to 30 are totally related to the Rg–π interaction, thus giving reliability to the correlation coefficients shown above.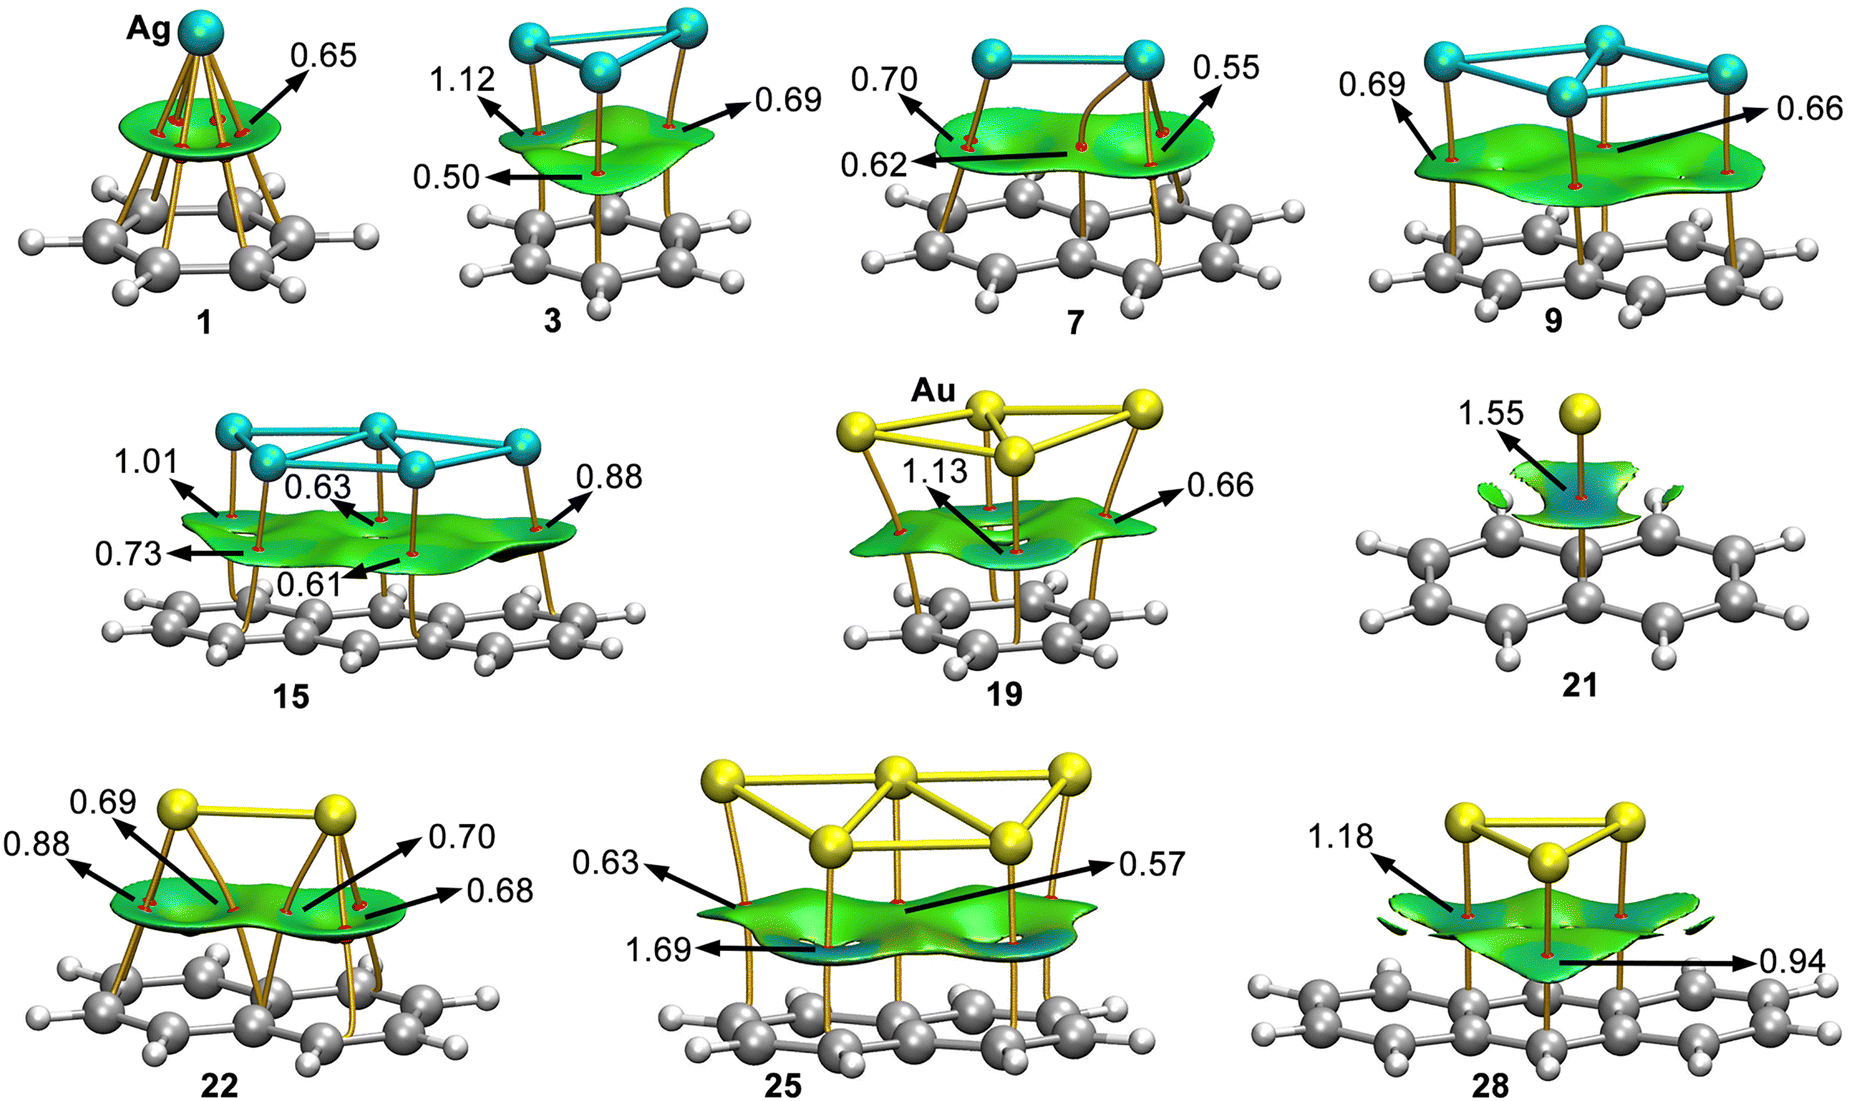 | ||
| Fig. 4 Distribution of intermolecular BCPs (red dots) and bond paths in complexes 1, 3, 7, 9, 15, 19, 21, 22, 25 and 28. The values of the density (ρ × 100) related to specific BCPs that characterize the Rg–π interactions are also included in a.u. NCIplot color range−0.03 a.u. ≤ (signλ2)ρ ≤ +0.03 a.u. | ||
In addition, the NCIplot surfaces are also shown in Fig. 4, covering the space between both interacting partners. These surfaces are colored in green for most complexes, indicating the presence of weak but attractive interactions. Moreover, in the majority of complexes the NCI surface covers most of the space between the NP and the aromatic moiety, however, there are some NP-aromatic systems combinations (e.g. complexes 21 and 28 in Fig. 4, complexes 6, 11 to 13 and 14 in Fig. S1, ESI† and complexes 26 and 27 in Fig. S2, ESI†) where the π-system is much larger than the NP size, leading to a partial interaction with the aromatic surface, in line with the energetic results discussed above. Moreover, for some complexes the NCIplot isosurface presented a bluish color (e.g. complex 18 (Au3@B) and complex 25 (Au5@N)), indicating regions of the space where stronger interactions take place.
Lastly, in Table S1 (see ESI†) the average values of the laplacian at the BCPs that characterize the Rg–π bond (∇2ρ × 100) are shown, resulting in positive values in all cases, as it is common for noncovalent interactions. Furthermore, the values of the potential (V × 100) and kinetic (G × 100) energy densities lie within the same range in all the cases, confirming the noncovalent nature of the complexes studied herein.
EDA study
To further investigate the physical nature of the Rg–π complexes studied herein, we have performed an energy decomposition analysis (EDA) on complexes 1 to 30. The energy partition scheme used unveiled the contribution of electrostatics, exchange-repulsion, orbital, dispersion, and electron correlation contributions (see Table 2).| Complex | E ex-rep | E el | E orb | E cor | E disp |
|---|---|---|---|---|---|
| 1 (Ag1@B) | 10.5 | −5.6 | −2.8 | −3.2 | −2.8 |
| 2 (Ag2@B) | 15.4 | −6.4 | −4.7 | −4.6 | −3.8 |
| 3 (Ag3@B) | 18.4 | −7.5 | −5.7 | −5.7 | −5.7 |
| 4 (Ag4@B) | 18.1 | −6.8 | −5.6 | −6.1 | −6.2 |
| 5 (Ag5@B) | 28.9 | −14.3 | −8.2 | −8.1 | −5.6 |
| 6 (Ag1@N) | 12.5 | −6.5 | −3.1 | −3.7 | −3.5 |
| 7 (Ag2@N) | 17.7 | −8.2 | −4.3 | −6.0 | −5.4 |
| 8 (Ag3@N) | 24.2 | −10.5 | −6.4 | −7.9 | −7.2 |
| 9 (Ag4@N) | 23.8 | −8.9 | −6.5 | −8.3 | −8.7 |
| 10 (Ag5@N) | 31.2 | −12.8 | −8.6 | −10.3 | −9.9 |
| 11 (Ag1@A) | 11.3 | −5.8 | −2.7 | −3.5 | −3.9 |
| 12 (Ag2@A) | 17.9 | −8.5 | −4.0 | −6.1 | −6.1 |
| 13 (Ag3@A) | 24.9 | −11.6 | −6.6 | −8.4 | −8.1 |
| 14 (Ag4@A) | 24.5 | −10.4 | −5.9 | −9.0 | −10.3 |
| 15 (Ag5@A) | 36.0 | −15.2 | −9.1 | −12.7 | −12.7 |
| 16 (Au1@B) | 11.7 | −5.5 | −3.5 | −4.0 | −3.0 |
| 17 (Au2@B) | 22.0 | −8.9 | −7.3 | −6.6 | −4.8 |
| 18 (Au3@B) | 41.1 | −18.8 | −13.9 | −11.1 | −6.5 |
| 19 (Au4@B) | 26.9 | −11.0 | −8.1 | −8.8 | −8.0 |
| 20 (Au5@B) | 25.2 | −9.9 | −7.0 | −7.0 | −8.7 |
| 21 (Au1@N) | 18.1 | −8.4 | −5.3 | −5.5 | −3.8 |
| 22 (Au2@N) | 19.7 | −8.3 | −5.1 | −7.1 | −6.6 |
| 23 (Au3@N) | 30.9 | −13.2 | −8.6 | −10.1 | −8.9 |
| 24 (Au4@N) | 30.5 | −12.0 | −8.1 | −10.6 | −10.9 |
| 25 (Au5@N) | 46.6 | −19.9 | −13.6 | −14.5 | −12.9 |
| 26 (Au1@A) | 12.4 | −5.7 | −3.3 | −4.3 | −4.1 |
| 27 (Au2@A) | 20.0 | −8.6 | −4.7 | −7.2 | −7.3 |
| 28 (Au3@A) | 31.2 | −14.1 | −7.8 | −10.9 | −10.4 |
| 29 (Au4@A) | 41.1 | −17.2 | −10.7 | −14.1 | −13.5 |
| 30 (Au5@A) | 45.1 | −19.0 | −11.7 | −15.8 | −15.7 |
As noted, for complexes 1 to 15 involving AgNPs, we observed an increase of all attractive terms (Eel, Eorb, Ecor and Edisp in Table 3) upon increasing the NP size, in agreement with the progressive increase in Rg–π complex stability discussed above. The only exception are complexes 9 and 14, where the electrostatic term slightly diminishes when comparing these to complexes 8 and 13, respectively. Firstly, among complexes 1 to 5 involving benzene, the electrostatics is the dominant energy term while the rest of attractive contributions show proximal values between them. More in detail, in the case of complexes 2 and 5 the contributions from orbital and correlation terms are higher than those involving the dispersion term, contrary to that observed in complexes 1, 3 and 4.
| Complex | Donor | Acceptor | E (2) |
|---|---|---|---|
| 1 | BD C–C | 5p* Ag | 0.62 |
| 3 | BD C–C | 5p* Ag | 0.57 |
| BD C–C | BD*Ag–Ag | 1.01 | |
| 7 | BD C–C | 5p* Ag | 1.20 |
| BD C–C | BD*Ag–Ag | 2.20 | |
| 9 | BD C–C | 5p* Ag | 2.61 |
| BD C–C | BD*Ag–Ag | 1.28 | |
| 15 | BD C–C | 5p* Ag | 0.34 |
| BD C–C | BD*Ag–Ag | 0.51 | |
| 5s Ag | BD* C–C | 0.20 | |
| 19 | BD C–C | 6s* Au | 6.41 |
| BD C–C | 6p* Au | 1.71 | |
| 5d Au | BD* C–C | 6.84 | |
| 21 | BD C–C | 6p* Au | 1.33 |
| 5d Au | BD* C–C | 0.48 | |
| 22 | BD C–C | 6p* Au | 1.60 |
| BD C–C | BD* Au–Au | 3.02 | |
| 25 | BD C–C | 6s* Au | 0.48 |
| BD C–C | 6p* Au | 2.32 | |
| 5d Au | BD* C–C | 1.24 | |
| 28 | BD C–C | 6p* Au | 0.81 |
| BD C–C | BD* Au–Au | 0.94 | |
| 6s Au | BD* C–C | 0.89 | |
| 5d Au | BD* C–C | 0.98 |
Secondly, among complexes 6 to 10 involving naphthalene, the correlation term is more prominent than orbital and dispersion terms in complexes 6 to 8 and 10, while in complex 9 dispersion is the most prominent contribution.
Lastly, for complexes 11 to 15 involving anthracene, the dispersion term is the predominant contribution in complex 11 while in complex 13 correlation was the leading term. In addition, for complexes 12 and 15 dispersion and correlation exhibited the same magnitude while in complex 14 dispersion showed a more prominent value.
Among complexes 16 to 30 involving AuNPs, we observed that for those complexes involving benzene (16 to 20), the correlation term is predominant in complexes 16 and 19, while in complexes 17, 18 and 20, the orbital and dispersion terms are more noticeable. For complexes 21 to 25 involving naphthalene, the correlation term is the most predominant energy contribution of all these three, except for complex 24, where the dispersion term shows a slightly larger magnitude. Lastly, for complexes 26 to 30 involving anthracene, the correlation term exhibited larger values than orbital and dispersion terms. However, in complex 27 the dispersion term was slightly more favorable compared to the correlation energy.
From these analyses, we conclude that although electrostatics is the main driving force of the Rg–π complex formation, the rest of attractive energy terms (orbital, electron correlation and dispersion) also contribute to the stabilization of the metal NPs onto the aromatic surfaces, with their values being close to electrostatics in some complexes (e.g.4, 9, 14 or 20) and depending on the combination of metal NP and π-system used. This can be observed if dispersion and correlation terms are considered together (see Table S3 in ESI†), showing a larger magnitude than electrostatics in most of the complexes, thus recovering the typical picture of a dominating dispersion term, especially in larger complexes.
MEP surface analyses
With the purpose to rationalize and complement the results obtained from the EDA study, we also computed the MEP surfaces of the Ag/AuNPs and the aromatic molecules used herein (see Fig. 5 below). As noticed, for Ag/AuNPs composed by 2 to 5 atoms, we observed an anisotropic electron density distribution around the metal atoms, exhibiting regions of positive electrostatic potential (coloured in green and blue) and regions of negative electrostatic potential (coloured in orange and red). In addition, each NP size exhibits a different number of very positive electrostatic potential regions (coloured in blue), also known as σ-holes, which varied upon incrementing the NP size and were located on the extension of the Rg–Rg coordination bonds.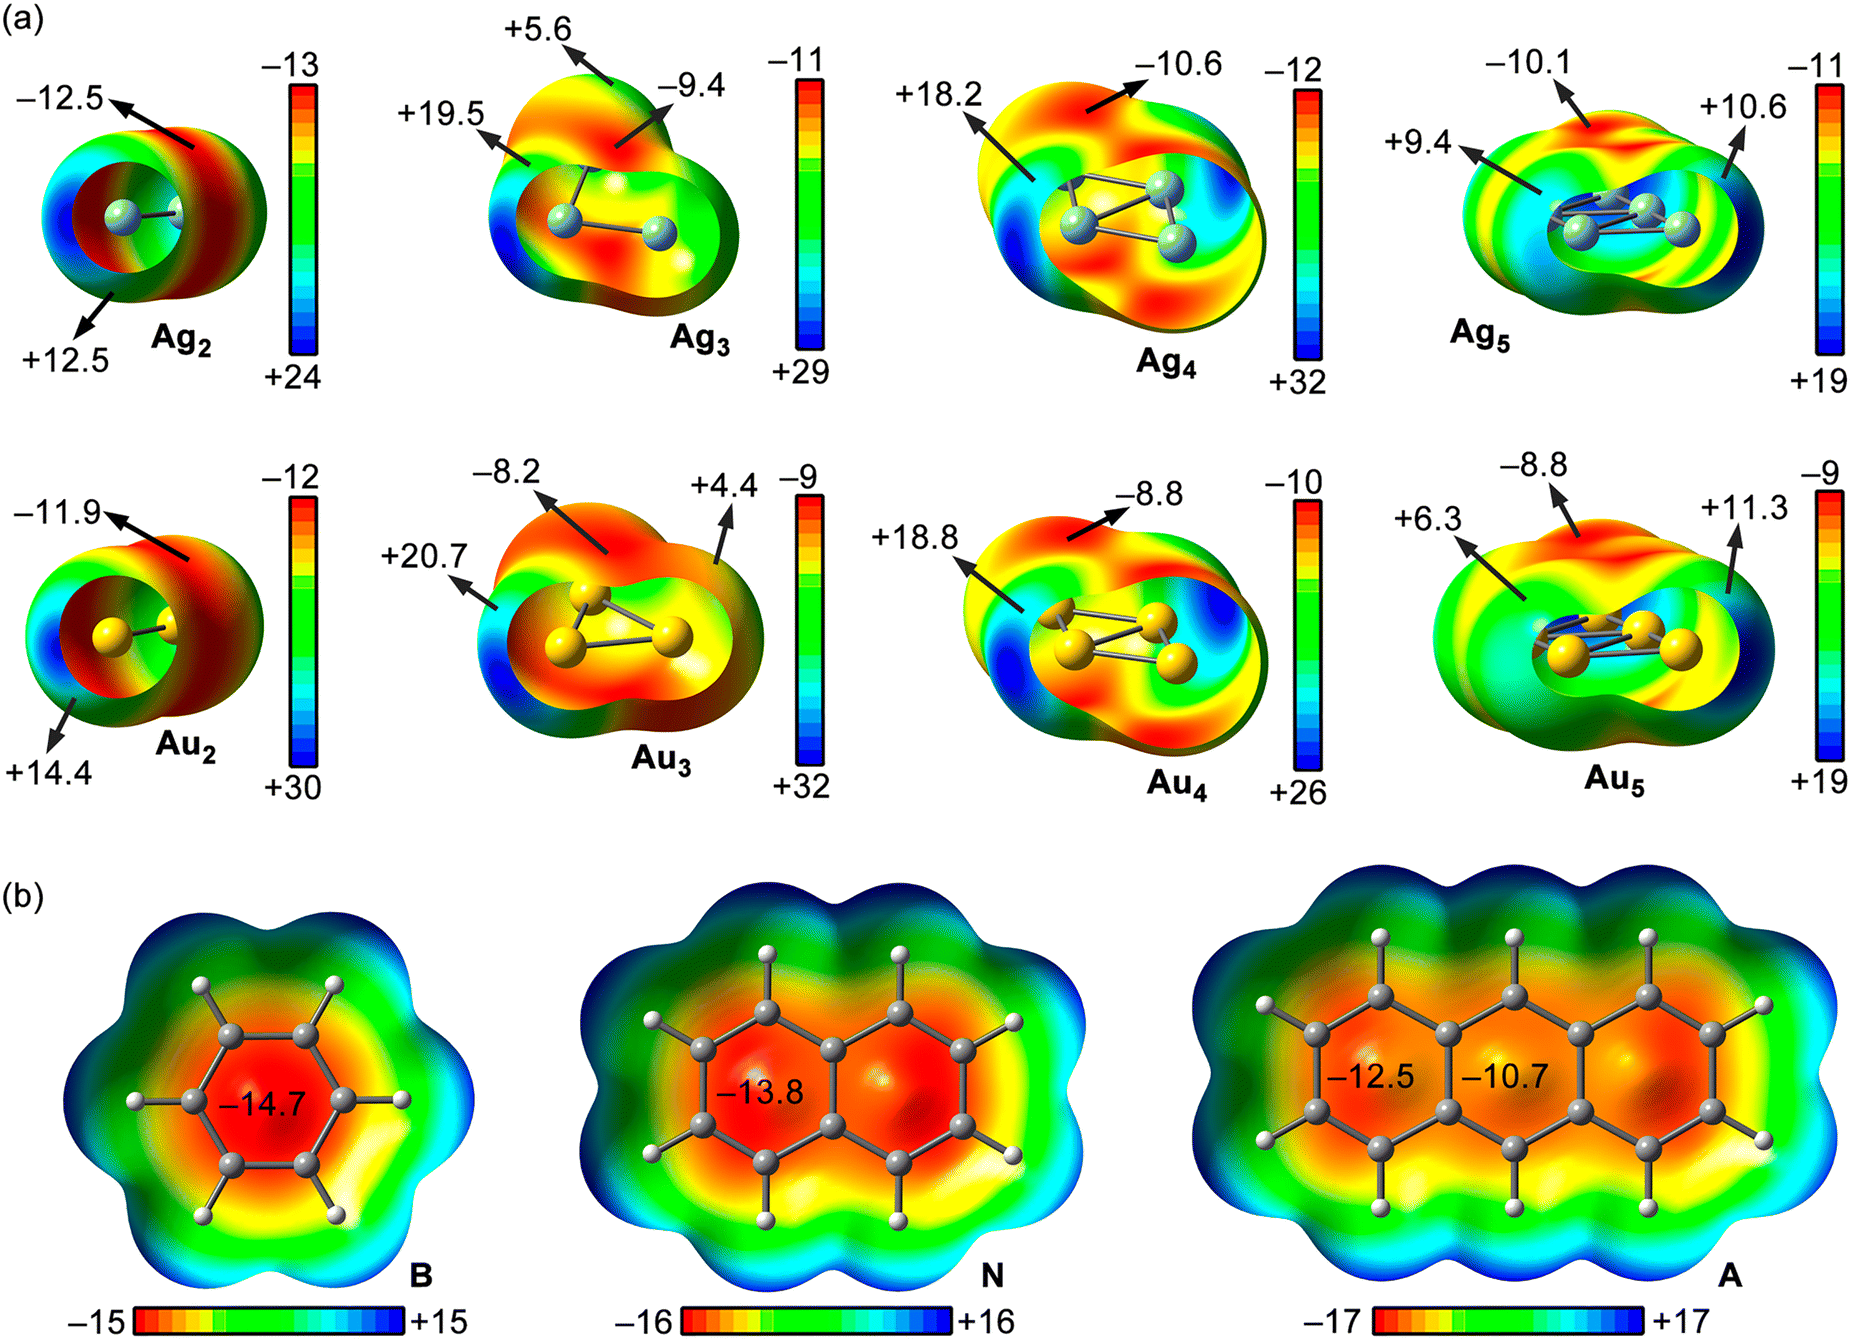 | ||
Fig. 5 MEP surfaces of Rg2 to Rg5NPs (Rg![[double bond, length as m-dash]](https://www.rsc.org/images/entities/char_e001.gif) Ag and Au) (a) and benzene (B), naphthalene (N) and anthracene (A) (b). Energy values at concrete points of the surfaces are given in kcal mol−1 (0.001 a.u.). The Ag1/Au1NPs MEP surfaces are not shown in the figure since they present a spherical electron density distribution around the metal atom. Ag and Au) (a) and benzene (B), naphthalene (N) and anthracene (A) (b). Energy values at concrete points of the surfaces are given in kcal mol−1 (0.001 a.u.). The Ag1/Au1NPs MEP surfaces are not shown in the figure since they present a spherical electron density distribution around the metal atom. | ||
Interestingly, when these regions were used to interact with the π-surface, they led to the formation of a coordinated adduct, however, when the electropositive regions gathered around the σ-holes were used (coloured in light blue and green), noncovalent adducts (Rg–π bonds) were obtained, leading to complexes 1 to 30. These results indicate a preferential orientation of the metal nanoparticle to noncovalently interact with the aromatic surface dictated by electrostatics.
A comparison of the MEP values at these regions for the different sizes of metal NPs revealed that their magnitude increased ongoing from Rg1NPs (+4.0 and +3.5 kcal mol−1 for Ag1/Au1NPs, respectively) to Rg3NPs (+19.5 and +20.7 kcal mol−1, respectively) and then decreased in Rg4NPs (+18.2 and +18.8 kcal mol−1) and Rg5NPs (+9.4/+10.6 and +6.3/+11.3 kcal mol−1). However, the number of these regions per NP has also to be considered, since it also increases upon growing the NP size and participate in the overlapping with the π-surface, thus leading to the interaction energies discussed above.
On the other hand, the regions of negative electrostatic potential exhibit MEP values of similar magnitude among the metal NPs, ranging from −12.5 to −9.4 kcal mol−1, showing an irregular tendency upon increasing from 2 to 5 atom size. These are typically located above the Rg–Rg coordination bonds and compensated by the σ-hole MEP values, which are larger in magnitude, leading to favourable electrostatics upon interacting with the aromatic rings, as revealed from the EDA study (see Table 3 above).
Lastly, among the π-systems considered, the MEP values over the aromatic rings were negative in all three rings, ranging from −14.7 to −10.7 kcal mol−1 from benzene to anthracene, in line with the increase of electron delocalization and aromaticity, as it is commonly known.
NBO analysis
As the last part of this research, we have carried out NBO calculations,37 with particular emphasis on the second order perturbation analysis on complexes 1 to 30, owing to its usefulness when studying donor–acceptor interactions (see Table 3 and Table S2 in ESI†).As noted, in all the cases we found an orbital interaction that consisted in the donation from a π bonding C–C orbital (BD C–C) to unfilled s and p orbitals (s* and p*, respectively) from Ag/Au atoms, with a magnitude comprised between 0.14 and 12.74 kcal mol−1. In addition, we also found an orbital contribution that involved the donation from a BD C–C orbital to an antibonding (BD*) Rg–Rg orbital in complexes 2 to 5, 7, 9, 10, 12 to 15, 17, 18, 20, 22, 24, 27 to 29, with a magnitude spanning from 0.45 to 3.83 kcal mol−1, which was less prominent than the former. Both orbital interactions are consistent with the formation of a Rg–π bond, agreeing with that observed for previous computational studies carried out by some of us.19a,22,38,39
Lastly, for complexes 11 to 25 and 27 to 30 we found a back-donating contribution from s and d orbitals belonging to the metal atom to an π antibonding C–C orbital (BD* C–C), exhibiting the lowest energetic value of all three orbital contributions observed (between 0.20 and 1.83 kcal mol−1).
In general, we observed that complexes involving Au1-5NPs exhibited a larger number of orbital interactions (see also Table S2 in ESI†), in agreement with the more favorable interaction energies obtained. The results gathered herein highlight the importance of orbital contributions to the global stabilization of the complexes studied herein, in agreement with the results obtained from the EDA study (see Table 2 above).
Conclusions
In summary, we have computationally studied the strength and physical nature of a series of Rg–π complexes involving small Ag/AuNPs of different size (up to 5 atoms) and benzene, naphthalene and anthracene as aromatic systems at the PBE0-D3/def2-TZVP level of theory. The results allowed us to correlate the interaction energy of the Rg–π bond with the size of both the metal NP as well as the π-system used, obtaining excellent correlation coefficients. Additionally, the Rg–π complexes studied herein were computationally characterized using several theoretical tools, such as the EDA, QTAIM, NCIplot and NBO analyses, which pointed out to a shared role between orbital, electron correlation and dispersion contributions, while electrostatics resulted as the most predominant energy term. We believe the results reported herein can be used as a first step towards the development of prediction tools for studying nanoscale materials, thus making impact in the fields of catalysis, supramolecular chemistry, and materials science.Author contributions
Most of the computational studies were conducted by S. B. and M. N. P. A. B. wrote the article and directed the study.Data availability
The data supporting this article have been included as part of the ESI.†Conflicts of interest
There are no conflicts to declare.Acknowledgements
This research was funded by the MICIU/AEI of Spain (project PID2020-115637GB-I00 FEDER funds). We thank the CTI (UIB) for computational facilities.Notes and references
-
(a) D. Astruc, Chem. Rev., 2020, 120, 461 CrossRef CAS
; (b) M.-C. Daniel and D. Astruc, Chem. Rev., 2004, 104, 293 CrossRef CAS
-
(a) S. Francis, K. M. Nair, N. Paul, E. P. Koshy and B. Mathew, Mater. Today Proc., 2019, 9, 97 CrossRef CAS
-
(a) P. G. Jamkhande, N. W. Ghule, A. H. Bamer and M. G. Kalaskar, J. Drug Delivery Technol., 2019, 53, 101174 CrossRef CAS
- S. Panigrahi, S. Kundu, S. Ghosh, S. Nath and T. Pal, J. Nanopart. Res., 2004, 6, 411 CrossRef CAS
- P. Slepička, N. Slepičková Kasálková, J. Siegel, Z. Kolská and V. Švorčík, Materials, 2020, 13, 1 CrossRef
-
(a) G. Lu, H. Li, C. Liusman, Z. Yin, S. Wu and H. Zhang, Chem. Sci., 1817, 2011, 2 Search PubMed
-
(a) H. Zhu, X. Ke, X. Yang, S. Sarina and H. Liu, Angew. Chem., Int. Ed., 2010, 49, 9657 CrossRef CAS
- R. Kaur, J. Bariwal, L. G. Voskressensky and E. V. Van der Eycken, Chem. Heterocycl. Compd., 2018, 54, 241 CrossRef CAS
- A. Nijamudheen and A. Datta, Chem. – Eur. J., 2020, 26, 1442 CrossRef CAS PubMed
- A. Noujima, T. Mitsudome, T. Mizugaki, K. Jitsukawa and K. Kaneda, Angew. Chem., Int. Ed., 2011, 123, 3042 CrossRef
- L. Hao, Y. Zhao, B. Yu, H. Zhang, H. Xu and Z. Liu, Green Chem., 2014, 16, 3039 RSC
- P. Fernández-Canelas, E. Rubio and J. M. González, Org. Lett., 2019, 21, 6566 CrossRef PubMed
- Q.-Z. Zheng and N. Jiao, Chem. Soc. Rev., 2016, 45, 4590 RSC
- Y. Qu, X. Pei, W. Shen, X. Zhang, J. Wang, Z. Zhang, S. Li, S. You, F. Ma and J. Zhou, Phys. E, 2017, 88, 133 CrossRef CAS
- Y. Song, J. K. Mobley, A. H. Motagamwala, M. Isaacs, J. A. Dumesic, J. Ralph, A. F. Lee, K. Wilson and M. Crocker, Chem. Sci., 2018, 9, 8127 RSC
- C. Li, O. J. H. Chai, Q. Yao, Z. Liu, L. Wang, H. Wang and J. Xie, Mater. Horiz., 2021, 8, 1657 RSC
- S. Sarina, E. R. Waclawik and H. Zhu, Green Chem., 2013, 15, 1814 RSC
- R. Bonomi, A. Cazzolaro, A. Sansone, P. Scrimin and L. J. Prins, Angew. Chem., Int. Ed., 2011, 50, 2307 CrossRef CAS PubMed
-
(a) A. Frontera and A. Bauzá, Chem. – Eur. J., 2018, 24, 7228 CrossRef CAS
- M. N. Piña, T. J. Mooibroek, A. Frontera and A. Bauzá, Phys. Chem. Chem. Phys., 2022, 24, 24983 RSC
- Q. Li, J.-J. Liu, X. Sun and L. Xu, ACS Sustainable Chem. Eng., 2019, 7, 867 CrossRef CAS
- M. N. Piña, J. Morey, A. Frontera and A. Bauzá, J. Mater. Chem. A, 2023, 11, 25865 RSC
- C. Adamo and V. Barone, J. Chem. Phys., 1999, 110, 6158 CrossRef CAS
- M. Ernzerhof and G. E. Scuseria, J. Chem. Phys., 1999, 110, 5029 CrossRef CAS
- S. Grimme, J. Antony, S. Ehrlich and H. Krieg, J. Chem. Phys., 2010, 132, 154104 CrossRef
- A. Schäfer, H. Horn and R. Ahlrichs, J. Chem. Phys., 1992, 97, 2571 CrossRef
- S. G. Balasubramani, G. P. Chen, S. Coriani, M. Diedenhofen, M. S. Frank, Y. J. Franzke, F. Furche, R. Grotjahn, M. E. Harding, C. Hättig, A. Hellweg, B. Helmich-Paris, C. Holzer, U. Huniar, M. Kaupp, A. M. Khah, S. K. Khani, T. Müller, F. Mack, B. D. Nguyen, S. M. Parker, E. Perlt, D. Rappoport, K. Reiter, S. Roy, M. Rückert, G. Schmitz, M. Sierka, E. Tapavicza, D. P. Tew, C. van Wüllen, V. K. Voora, F. Weigend, A. Wodyński and J. M. Yu, J. Chem. Phys., 2020, 152, 184107 CrossRef CAS PubMed
-
M. J. Frisch, G. W. Trucks, H. B. Schlegel, G. E. Scuseria, M. A. Robb, J. R. Cheeseman, G. Scalmani, V. Barone, G. A. Petersson, H. Nakatsuji, X. Li, M. Caricato, A. V. Marenich, J. Bloino, B. G. Janesko, R. Gomperts, B. Mennucci, H. P. Hratchian, J. V. Ortiz, A. F. Izmaylov, J. L. Sonnenberg, D. Williams-Young, F. Ding, F. Lipparini, F. Egidi, J. Goings, B. Peng, A. Petrone, T. Henderson, D. Ranasinghe, V. G. Zakrzewski, J. Gao, N. Rega, G. Zheng, W. Liang, M. Hada, M. Ehara, K. Toyota, R. Fukuda, J. Hasegawa, M. Ishida, T. Nakajima, Y. Honda, O. Kitao, H. Nakai, T. Vreven, K. Throssell, J. A. Montgomery Jr., J. E. Peralta, F. Ogliaro, M. J. Bearpark, J. J. Heyd, E. N. Brothers, K. N. Kudin, V. N. Staroverov, T. A. Keith, R. Kobayashi, J. Normand, K. Raghavachari, A. P. Rendell, J. C. Burant, S. S. Iyengar, J. Tomasi, M. Cossi, J. M. Millam, M. Klene, C. Adamo, R. Cammi, J. W. Ochterski, R. L. Martin, K. Morokuma, O. Farkas, J. B. Foresman and D. J. Fox, Gaussian 16, Revision C.01, Gaussian, Inc., Wallingford CT, 2016 Search PubMed
-
R. Dennington, T. A. Keith and J. M. Millam, GaussView, Version 5, Semichem Inc., Shawnee Mission, KS, USA, 2016 Search PubMed
- AIMAll (Version 19.10.12), T. A. Keith, TK Gristmill Software, Overland Park KS, USA, 2019.
- E. D. Glendening, J. K. Badenhoop, A. E. Reed, J. E. Carpenter, J. A. Bohmann, C. M. Morales, P. Karafiloglou, C. R. Landis and F. Weinhold, Theoretical Chemistry Institute; University of Wisconsin: Madison, 2018.
- L. Zhao and M. von Hopffgarten, WIREs Comp. Rev., 2018, 8, e1345 Search PubMed
- K. Kitaura and K. Morokuma, Int. J. Quantum Chem., 1976, 10, 325 CrossRef CAS
- J. Contreras-García, E. R. Johnson, S. Keinan, R. Chaudret, J.-P. Piquemal, D. N. Beratan and W. Yang, J. Chem. Theory Comput., 2011, 7, 625 CrossRef
- W. Humphrey, A. Dalke and K. Schulten, J. Molec. Graph., 1996, 14, 33 CrossRef CAS
- R. F. W. Bader, Acc. Chem. Res., 1985, 18, 9 CrossRef CAS
- F. Weinhold, C. R. Landis and E. D. Glendening, Int. Rev. Phys. Chem., 2016, 35, 399 Search PubMed
- M. N. Piña, A. Frontera and A. Bauzá, J. Phys. Chem. Lett., 2020, 11, 8259 CrossRef
- S. Burguera, A. Frontera and A. Bauzá, Inorg. Chem., 2023, 62, 6740 CrossRef CAS PubMed
Footnote |
| † Electronic supplementary information (ESI) available: Fig. S1 and S2, Tables S1 and S2 and cartesian coordinates of complexes 1 to 30. See DOI: https://doi.org/10.1039/d4cp02149e |
| This journal is © the Owner Societies 2024 |