
 Open Access Article
 This Open Access Article is licensed under a
 Creative Commons Attribution 3.0 Unported Licence
Impact of magnetic and electric fields on the free energy to form a calcium carbonate ion-pair†‡
Ke
Yuan
 *a,
Nikhil
Rampal§
a,
Xuewei
Du
b,
Fangjun
Shu
c,
Yanxing
Wang
c,
Huiyao
Wang
b,
Andrew G.
Stack
a,
Paul
Ben Ishai
d,
Lawrence M.
Anovitz
a and
Pei
Xu
b
*a,
Nikhil
Rampal§
a,
Xuewei
Du
b,
Fangjun
Shu
c,
Yanxing
Wang
c,
Huiyao
Wang
b,
Andrew G.
Stack
a,
Paul
Ben Ishai
d,
Lawrence M.
Anovitz
a and
Pei
Xu
b
aChemical Sciences Division, Oak Ridge National Laboratory, Oak Ridge, TN 37830, USA. E-mail: yuank@ornl.gov
bDepartment of Civil Engineering, New Mexico State University, Las Cruces, NM 88003, USA
cDepartment of Mechanical & Aerospace Engineering, New Mexico State University, NM 88003, USA
dDepartment of Physics, Ariel University, 4070000 Ariel, Israel
First published on 6th September 2024
Abstract
Electromagnetic fields are used in water treatment and desalination to regulate scale formation and extend the lifetime of membranes. External electric and magnetic fields can promote or suppress mineral nucleation and growth. However, the molecular-scale mechanisms of such processes remain unknown. Computing the free energies needed to form ion pairs under external fields provides important insights into understanding the elemental steps during the initial formation of mineral scales. In this paper, we used molecular dynamics combined with metadynamics simulations to investigate the free energies of forming the [Ca–CO3]0 ion pair, a fundamental building block of carbonate scales, under a range of magnetic (up to 10 T) and electric (up to 10 V m−1) fields in water. The presence of constant magnetic or electric fields favored the ion pairing reaction and lowered the free energies by up to 3% to 6%. The internal energy and entropic components of the free energy showed significant changes and exhibited non-linear behavior with increasing field strength. The [Ca–CO3]0 ion pairing is an entropy-driven process in the absence of an external field, but the mechanism shifts to an internal energy-driven process under selected external fields, suggesting possible changes in the nucleation pathways.
1. Introduction
Reduction of scale deposits in water purification systems is a significant technical and economic challenge.1,2 Conventional scale treatments involve pH adjustment using acids, addition of antiscalants or scale inhibitors, and softening to remove hardness and other scale-forming minerals.1,3 These processes are costly, chemical-intensive, and may cause severe ecological and environmental issues. However, it has been suggested that many of these limitations can be avoided using electromagnetic fields (EMF) to control scaling.3–8 EMF treatment is a low-cost, antiscaling technology requiring low energy input.5,9 An EMF can be applied using permanent or electro-magnets installed inside or outside a water pipe (static or dynamic magnetic systems), electromagnetically using an external inductor positioned near a water pipe (induction systems), or by introducing alternating and pulsed currents of varying frequencies directly onto water pipes (applied current systems). EMF treatment has been found effective in preventing SiO2, CaSO4, and CaCO3 scaling during desalination of brackish and reclaimed water, and in reducing the size and adherence of precipitates such that simple hydraulic rinsing can recover membrane performance.1,3While EMF can change the rates of nucleation and growth, inconsistent results have been observed for different materials. For instance, several studies have reported that a constant magnetic field can decrease the nucleation and growth rates of organic crystals. Zhao et al. reported that crystals of polyamide salt became more soluble under an applied magnetic field up to 0.5 T,10 reducing the rates of nucleation and growth. They suggested that this was due to an increase in the nucleation barrier caused by the directional motion of particles under the magnetic field. Sazaki et al. studied the crystallization of hen egg-white protein under a uniform 10 T magnetic field.11 They found that fewer nuclei formed, and the crystals became aligned with the field. Rao et al. showed that alternating potentials applied to conductive membranes prevented the formation of CaSO4 and silicate scales.12 Theoretical work by Kashchiev13 showed that an electric field can inhibit nucleation when the dielectric permeability of the new phase is larger than that of the old one.
In contrast, other studies showed that electromagnetic fields either promoted nucleation or had no impact. For example, Guan et al. studied the impact of magnetic fields on sodium arsenate growth, and found a decrease in solubility, an increase in nucleation rate, and a decrease in growth rate.14 Alexander et al.15 showed that protein crystallization was significantly enhanced under a wide range of EMF conditions including internal and external, alternating (AC) and direct (DC) currents. However, Konak et al. showed that the nucleation and growth rates of gypsum crystals were not impacted by a magnetic field using permanent magnets at fields up to 16 kOe.16 Yurov et al. reported the promotion of NH4Cl and NH4Br nucleation under an electric field, but no impact on growth rate of the crystals was observed.17 Many studies also investigated the impact of external fields on ice nucleation. Woo et al. showed that a DC electric field induces an increase in ice nucleation whereas an AC field delays ice nucleation and increases induction time. Park et al. showed that water molecules polarized by a 104 V m−1 electric field on a clay surface can promote gas hydrates nucleation such that the induction time was reduced by 5.8 times.18
These sometimes contradictory and highly variable results clearly imply that the effects of EMF on crystal nucleation and growth are not fully understood. Nonetheless, a large variety of EMF devices are sold for residential and commercial use due to the high demand for simple, low-maintenance, non-chemical methods of scale control. The utility of these designs is, unfortunately, uncertain. Electric or magnetic fields may impact crystal nucleation and growth by affecting the dynamics of water and dissolved ions, but no studies show precisely how EMF treatment affects chemical reactivity, and thus there is no way to evaluate potential new designs.19 A better understanding of how EMF impacts nucleation and crystal growth in aqueous solutions should, therefore, constrain the conditions under which such an approach is most effective.
This study used classical molecular dynamics, coupled with metadynamics simulations to calculate the free energy of formation of [Ca–CO3]0 ion pairs in water. This fundamental chemical reaction may initiate mineral nucleation and is a likely candidate for a process that would be affected by EMF. To do so we split the free energy into internal energy (ion binding energy) and entropic terms (re-organization of the solvent). The internal energy was further decomposed into solvent and solute portions to investigate the role of water reorganization during the ion-pair formation. The results help explain how external fields impact ion paring, which could lead to changes in nucleation, phase selection, and crystal growth habits observed experimentally.
2. Computational details
Molecular dynamics (MD) simulations were performed using LAMMPS,20,21 and compiled with PLUMED22 in the canonical (NVT) ensemble at 300 K and 320 K. The application of a constant magnetic field, up to 10 T, was adopted from the work of Panczyk et al., which was compiled as a separate plugin for LAMMPS.23 This allows accurate calculations of forces under acceleration. For simulation under electric fields up to 10 V m−1, the forces exerted on the charged particles were computed using the fix_efield.cpp module in LAMMPS. For both magnetic and electric fields, a constant field was applied to the z-direction of the simulation cell. The force fields used for simulating the [Ca–CO3]0 ion-pair were specifically developed for the alkaline-earth carbonate system in water by Raiteri et al., and are thermodynamically consistent with experimental measures of ion hydration structures, ion hydration energies, solubilities of carbonate minerals, and the ion-pairing equilibrium constants.24 Parameters for water were obtained from the SPC/Fw model.25 During the biased simulations, the distance between Ca2+ and the C atom in the CO32− ion was biased in the well-tempered metadynamics simulation with a bias factor of 8. Gaussian-shaped bias potentials were deposited every 1000 steps (1 ps deposition time) at a height of 2.48 kJ mol−1 and a width of 0.1. The model had 12![[thin space (1/6-em)]](https://www.rsc.org/images/entities/char_2009.gif) 536 atoms, which included 1 Ca2+ and 1 CO32− in a cubic box 50 Å long, filled with 4177 H2O molecules, corresponding to a concentration of 0.01 M CaCO3(aq). The time step of the MD simulation was 1 fs and the system was equilibrated for 10 ns unbiased simulation followed by biased simulation up to around 200 ns to obtain the free energy profiles. Most of the computed free energy profiles reached their steady states beyond 150 ns and showed a small fluctuation (±0.1 kJ mol−1) in the free energy (ESI,‡ Fig. S1, S2, and Table S1). We further analyzed the errors of the computed free energies by using the block analysis26 and the averaged errors were around ±0.17 kJ mol−1 (Fig. S3 and Table S2, ESI‡). The entropic and enthalpic contributions to the free energy were calculated based on the finite-difference temperature derivative of the free energy as:27–29
536 atoms, which included 1 Ca2+ and 1 CO32− in a cubic box 50 Å long, filled with 4177 H2O molecules, corresponding to a concentration of 0.01 M CaCO3(aq). The time step of the MD simulation was 1 fs and the system was equilibrated for 10 ns unbiased simulation followed by biased simulation up to around 200 ns to obtain the free energy profiles. Most of the computed free energy profiles reached their steady states beyond 150 ns and showed a small fluctuation (±0.1 kJ mol−1) in the free energy (ESI,‡ Fig. S1, S2, and Table S1). We further analyzed the errors of the computed free energies by using the block analysis26 and the averaged errors were around ±0.17 kJ mol−1 (Fig. S3 and Table S2, ESI‡). The entropic and enthalpic contributions to the free energy were calculated based on the finite-difference temperature derivative of the free energy as:27–29 | (1) |
| ΔU = ΔF + TΔS | (2) |
| ΔUsolute = ΔU − Usolute | (3) |
In addition to using the Ca–C distance as the primary collective variable, the coordination number (CN) of Ca2+ by water in the first hydration shell was used as a secondary coordinate to obtain the two-dimensional free energy profiles. The CN of Ca to O in water was defined by using the switching function:
 | (4) |
3. Results and discussion
3.1. Free energy profiles of ion-pair formation under magnetic fields
The Helmholtz free energy (ΔF) curves for the [Ca–CO3]0 ion-pair at 300 K show subtle changes in the free energy minima under constant magnetic fields up to 10 T (Fig. 1). The collective variable, or reaction coordinate, used to trace the formation of [Ca–CO3]0 ion-pairs was the Ca–C distance. The free energy at Ca–C distances of 12.5 Å to 14.5 Å was used to align the free energy curves in order to compare the magnitudes of the energy minima, especially those that are at less than 4.0 Å (Fig. 1(b)). The general shapes of the free energy curves are similar under a series of magnetic fields at 300 K (Fig. 1). Energy minima located at a Ca–C distance of 3.5 Å showed the lowest values and corresponded to the formation of a monodentate contact [Ca–CO3]0 ion pair, with a less favorable bidentate ion pair at 2.9 Å. Local energy minima at 5.0 Å and 7.1 Å correspond to the formation of solvent-separated ion pairs mediated by water (Fig. 1(a)). The positions of the local minima for the four ion pairs did not change upon applying the magnetic fields, but the depths of the energy wells showed slight decrease. The free energy minima for forming these ion pairs are summarized in Table 1 and Table S3 (ESI‡). The corresponding dissociation constants listed in Table 1 were calculated based on two methods (free energy difference vs. integration of the free energy curves) described in the ESI.‡ The pKdiss calculated using the free energy difference method is 3.83 at 300 K without a magnetic field (Table 1), which is close to the reported experimental values, which range from 3.0 to 3.2.24 At 300 K, the free energies for forming the contact ion-pair first decreased from −21.89 kJ mol−1 at 0 T to −22.44 kJ mol−1 at 3 T and then reached a steady state up to 10 T. In general, applying a constant magnetic field decreased the free energy minima of the ion-paring reaction and generated less than 3% change in the free energies when forming a [Ca–CO3]0 ion-pair. | ||
| Fig. 1 (a) Free energy profiles of forming a [Ca–CO3]0 ion-pair under a series of magnetic fields (0 T, 1 T, 3 T, 5 T, 7 T, and 10 T) at 300 K and (b) A zoomed-in view at the region where the contact ion-pair was formed. | ||
| Magnetic field (T) | ΔF (± 0.16 kJ mol−1) | pKdiss (free energy difference) ± 0.03 pKdiss | pKdiss (integration) ± 0.03 pKdiss |
|---|---|---|---|
| 0 | −21.89 | 3.83 | 4.61 |
| 1 | −22.23 | 3.89 | 4.66 |
| 3 | −22.44 | 3.93 | 4.69 |
| 5 | −22.44 | 3.93 | 4.73 |
| 7 | −22.56 | 3.95 | 4.71 |
| 10 | −22.43 | 3.93 | 4.70 |
3.2. Internal energy and entropic contributions
Unlike the changes in free energies, which showed minor decrease under magnetic fields, the internal energies and entropic terms exhibited significant variations (Fig. 2 and Fig. S5, ESI‡). Here, we focus on the parts of the internal energy and entropy profiles relevant to forming the monodentate contact ion-pair at the energy minimum of 3.5 Å (Fig. 2(e)). At 0 T, ion-pair formation was driven by the large negative value of the −TΔS term (−25.9 kJ mol−1), where the internal energy was slightly positive (4.0 kJ mol−1). These calculated values are similar to experimental data determined by the potentiometric titration (ΔH = 8.7 ± 2.4 kJ mol−1, −TΔS = −26.7 ± 2.4 kJ mol−1).30 The internal energy (green curves) can be further decomposed to obtain the solvent contribution to the internal energy as ΔUsolvent (cyan curves in Fig. 2). In all cases, solvent internal energy due to the insertion and removal of water molecules showed more negative values than the total ΔU, implying that solvent reorganization energy is the major driving force for the ion-paring. Positive internal energies and negative −TΔS terms observed at 0 T suggested the reactions were entropy-driven (Fig. 2(a) and (e)). Under 1 T, 3 T, and 5 T fields, however, the internal energy was more negative than the entropic term, implying a switch in the reaction mechanism from entropy- to internal energy-driven. At higher magnetic fields of 7 T and 10 T, the reaction switched back to an entropy-driven process (Fig. 2(e)). | ||
| Fig. 2 Deconvoluting the free energy (ΔF) into internal energy (ΔU), internal energy of solvent (ΔUsolvent), and entropic terms (−TΔS) at 300 K under (a) 0 T, (b) 1 T, (c) 5 T, and (d) 10 T. (e) Changes in free energies and associated free energy components with magnetic fields from 0 T to 10 T. | ||
3.3. Changes in Ca2+ solvation environment during ion-pair formation under magnetic field
To explain the changes observed in the internal energy and entropic components, we investigated the role of water solvation environments by tracking the coordination number of water molecules around Ca2+ during the ion pairing process. We obtained 2D free energy surfaces by reweighting the 1D free energy profiles (Fig. 3 and Fig. S6, ESI‡). From these, we expanded the reaction coordinate from 1D to 2D by adding the hydration environments of Ca2+ to the original Ca–C distance coordinate (Fig. 3).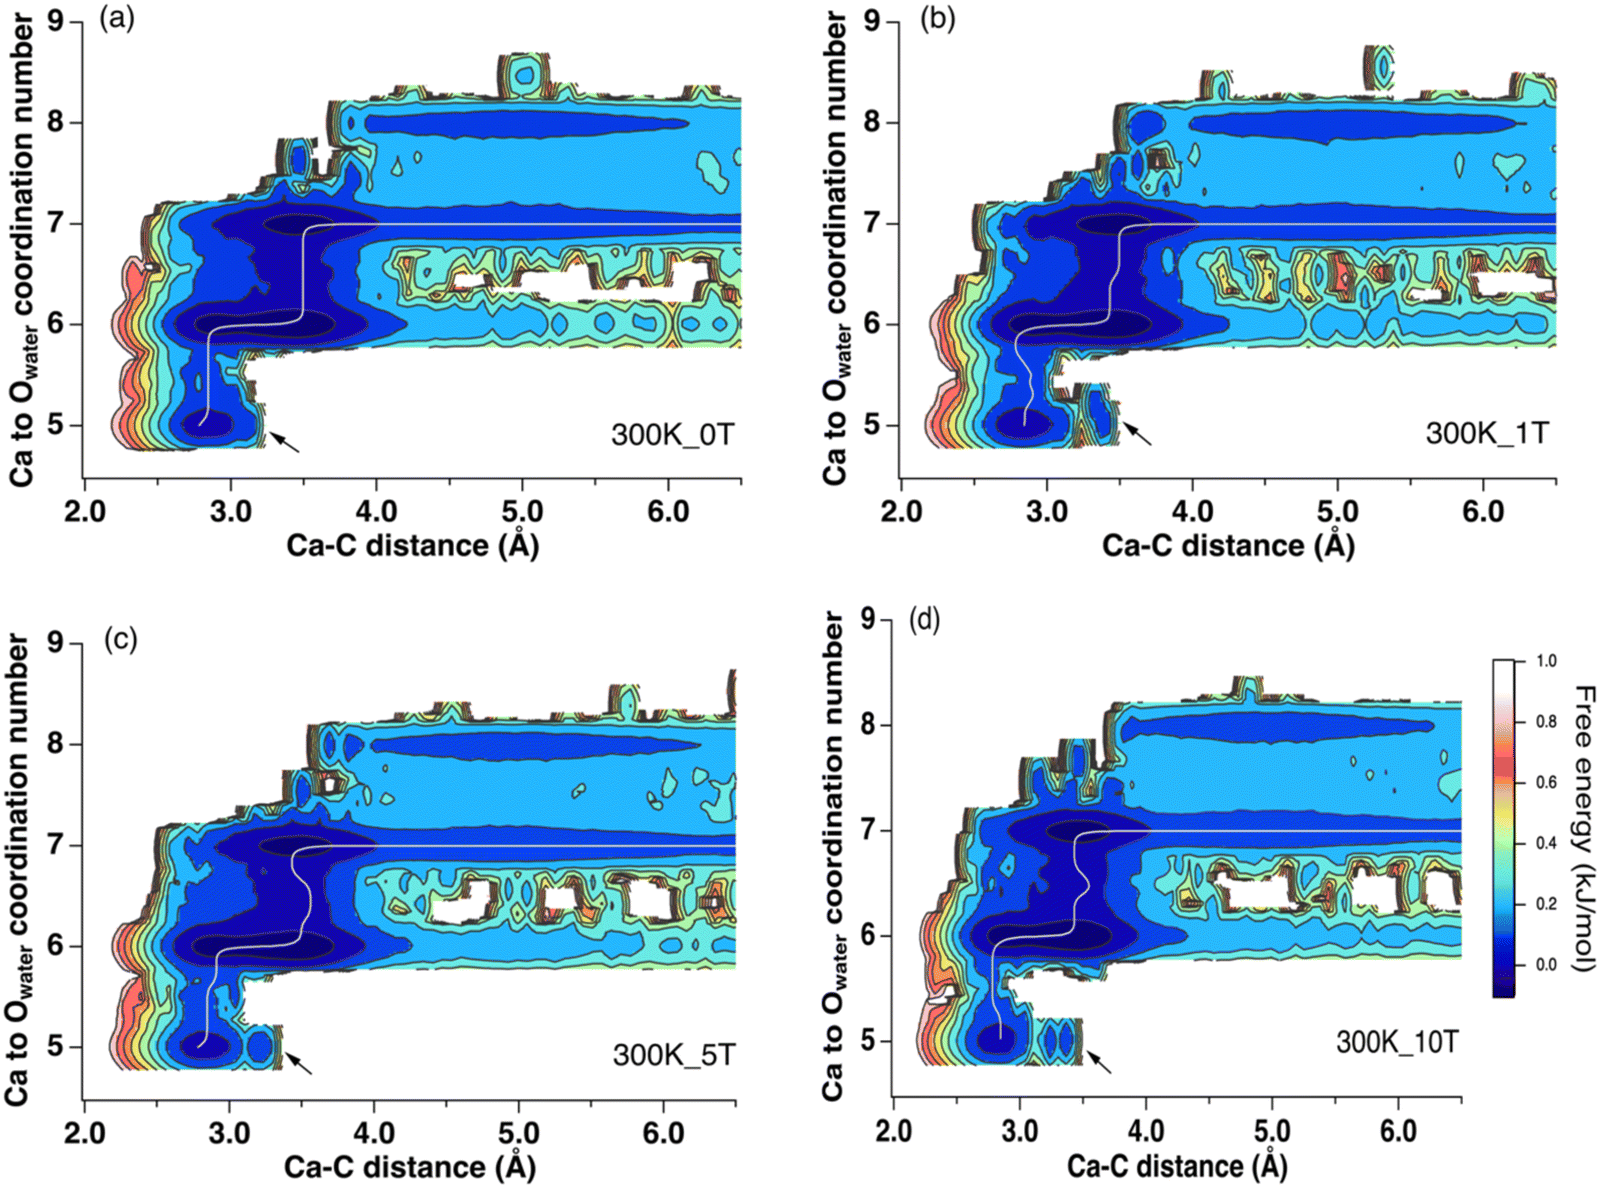 | ||
| Fig. 3 The reweighted 2D free energy for the formation of [Ca–CO3]0 ion-pair at 300 K. Arrows indicated new structures formed as contact ion-pairs under increasing magnetic fields. The white lines indicated the minimum energy path. | ||
The results of this analysis showed that the ion-pairing process was coupled with the desolvation of Ca2+. This involved a reduction of the Ca2+ CN from 7 to 5 and a decrease in the Ca–C distance to less than ∼3.5 Å. Several local energy minima were observed at Ca–C distances around 3.5 Å and 2.8 Å with reduction of the CN of Ca2+ from 7 and 5. At CN = 6, the two local minima were observed corresponding to the formation of bidentate and monodentate ion pairs (Fig. 4(a) and (b)). The energy minima at a CN of 5.0 and a Ca–C distance around 2.7 Å correspond to bidentate ion pairs with a closer Ca–C distance (Fig. 4(c)). A new, monodentate, contact ion-pair structure with a larger Ca to C distance of 3.3 Å to 3.5 Å was observed with increasing field strength (Fig. 3, arrows). This (Fig. 4(d)) formed solely under the magnetic field. In addition, the 10 T 2D free energy (Fig. S3, ESI‡) also shows a new local state beyond a 3.0 Å Ca–C distance at CN = 5 that is absent at 0 T. Thus, both the reweighted and directly calculated 2D free energy profiles show that a magnetic field promotes the formation of new ion pair structures. These detailed configurational changes were not observed in the 1D free energy profiles but were successfully resolved using higher dimensional analyses.
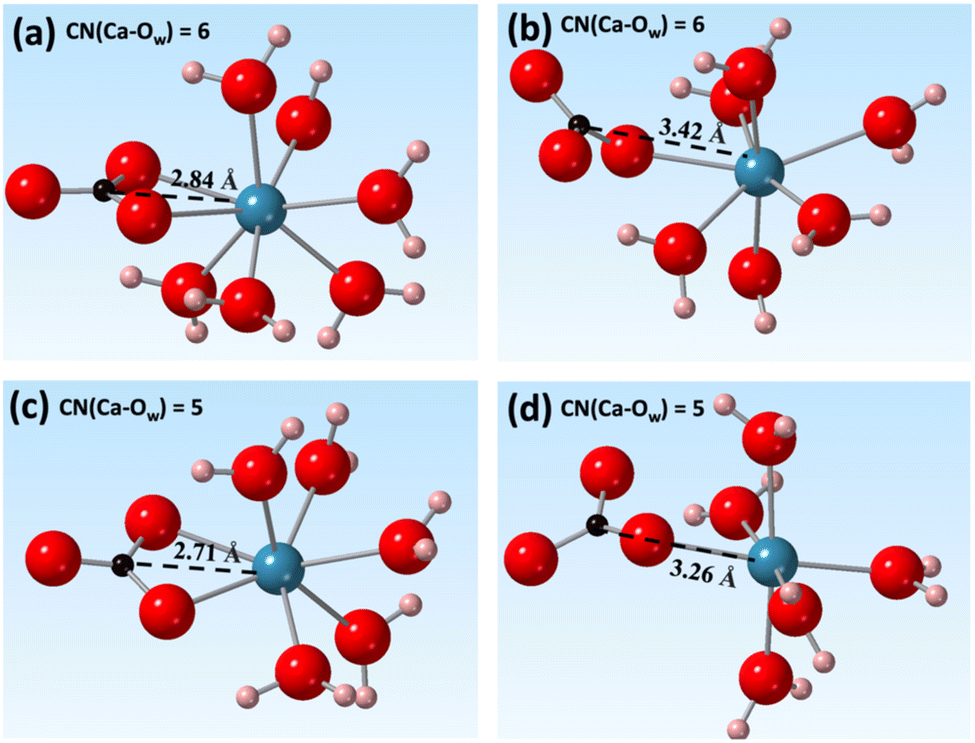 | ||
| Fig. 4 Contact ion-pair formed at Ca to Owater CNs of (a), (b) 6 and (c), (d) 5 with 5 T of magnetic field. In each coordination environment, either bidentate or monodentate binding of CO32− ion to Ca2+ was shown. Oxygen, hydrogen, carbon, and calcium atoms were shown as red, pink, black, and cyan spheres. | ||
3.4. Free energy profiles of ion-pair formation under electric fields
The free energy profiles show larger changes under electric fields when compared with those observed under magnetic fields (Fig. 5 and Table S4, ESI‡). The values of the free energies at 3.5 Å, corresponding to the formation of the monodentate contact ion-pairs, decreased first with increasing field and then reached steady states at higher field strength (Table 2 and Fig. 5(c)). At 300 K, the free energy minima all decrease under an electric field up to 6% (at 5 V m−1), reflecting a change in the dissociation constant of +0.25 pKdiss (Table 2). | ||
| Fig. 5 (a) The free energy profiles of forming the [Ca–CO3]0 ion-pair under a series of electric fields (0 V m−1, 1 V m−1, 3 V m−1, 5 V m−1, 7 V m−1, and 10 V m−1) at 300 K and (b) A zoomed-in view at the region where the contact ion-pair was formed. (c) Comparison in free energies (ΔF in Tables 1 and 2) under increasing external field. | ||
| Electric field (V m−1) | ΔF (± 0.17 kJ mol−1) | pKdiss (energy difference) ± 0.03 pKdiss | pKdiss (integration) ± 0.03 pKdiss |
|---|---|---|---|
| 0 | −21.89 | 3.83 | 4.61 |
| 1 | −22.71 | 3.98 | 4.73 |
| 3 | −23.27 | 4.08 | 4.83 |
| 5 | −23.31 | 4.08 | 4.85 |
| 7 | −23.04 | 4.04 | 4.81 |
| 10 | −23.08 | 4.04 | 4.78 |
Internal energy, the internal energy of the solvent, and the entropic terms show larger changes under the electric fields when compared with changes in the free energy (Fig. 6 and Fig. S7, ESI‡). At 0 V m−1 and 10 V m−1, the entropic terms were more negative than the internal energies and the reactions are driven by the entropy changes (Fig. 6(d)). Under a wide range of external field from 1 V m−1 to 7 V m−1, however, the reactions were internal energy driven. For free energies that showed the most significant decreases under 5 V m−1 and at 7 T (Fig. 5(c)), we compared their free energy components (ΔU and −TΔS) obtained based on the finite-difference temperature derivative method and the linear fitting method and found consistent results that showed the reaction switched to an internal energy driven process under external fields (Fig. S8 and Table S5, ESI‡).
 | ||
| Fig. 6 Decomposition of the free energy (ΔF) as internal energy (ΔU), internal energy of solvent (ΔUsolvent), and entropic terms (−TΔS) at 300 K under (a) 1 V m−1, (b) 5 V m−1, and (c) 10 V m−1. (d) Changes in free energy and associated free energy components with electric fields. | ||
The 2D free energy surfaces are similar to those observed under magnetic fields, including the formation of new local energy minima at a Ca–C distance of 3.3 Å and CN of Ca around 5 (Fig. 7). New structures were also observed in the 2D plots with external electric fields, including a local minimum near a CN of 5.5 at a Ca–C distance of 3.7 Å (Fig. 7 and Fig. S6, ESI‡ arrows). Overall, applying an electric field changed both the free energy profiles and the free energy components, including a decrease in the free energy minima and the appearance of new close-contact ion pair structures.
 | ||
| Fig. 7 The reweighted 2D free energy for the formation of [Ca–CO3]0 ion pair at 300 K. Arrows indicated new structures formed as contact ion pairs under increasing electric field. The white lines indicated the minimum energy path. | ||
3.5. Implications for nucleation
A reduction in the free energy of forming the [Ca–CO3]0 ion pair in the presence of an external field could impact the nucleation of calcium carbonate minerals. In the absence of an external field, formation of [Ca–CO3]0 ion pairs is largely driven by the entropy change in the system, as the desolvated water molecules around the Ca2+ ion gain greater degrees of freedom (translational and rotational entropy), contributing to a large negative (−TΔS) term (Fig. 2(a)). When a magnetic or electric field was applied, however, the changes in internal energy and entropy do not follow simple linear relations with increasing field strength (Fig. 2(e) and 6(d)). The free energy changes were more negative when an electric field was applied and the free energy minima decreased first with field strength and did not show much variation beyond 5 T or 5 V m−1 (Fig. 5(c)).Nonlinear relations have also been observed in the response of other chemical/physical properties of an aqueous solution to an external field. Shafiei et al. studied the dynamics of water under an alternating electric field using MD simulations.31 While an alternating electric field affects the diffusion of charged particles, and may impact hydrogen bond alignment in water, these simulations, performed using both polarizable and non-polarizable water molecules, showed no substantial change in the water structure under a wide range of AC frequencies (100 to 500 GHz). They also observed a non-monotonic frequency dependence of the dynamic properties of water, including rates of bond breaking and diffusion, as the fastest dynamics were observed near 200 GHz instead of at 500 GHz.
Whether a magnetic field has any impact on the physical properties of liquid water remains debatable. Wu et al. showed that the proton concentration decreased under a multidirectional magnetic field with an increase in the electrical conductivity due to weakening of ions’ hydration shells.7 However, Panczyk et al. found that Lorentz forces had negligible effects on aqueous solutions in static magnetic fields up to 1.0 T using MD simulations.23 They reported that the diamagnetic properties of the solution are negligible when small molecules (e.g., DNA) or ions (e.g., Na+ and Cl−) are the primary charged particles and showed that the magnitude of the Lorentz force is up to eight orders of magnitude smaller than that of thermal fluctuations in a liquid at ambient conditions. Other studies showed that the magnetic field only has a significant impact on large particles, such as cells and macromolecules in solution.32,33 Our results showed that the free energies of [Ca–CO3]0 ion pairing showed slight decrease under external fields and the reaction mechanism switched from entropy-driven to internal-energy driven, possibly having an impact on the nucleation of calcium carbonate minerals.
The change in the ion pairing reaction mechanism from entropy- to internal energy-driven could provide insights into the nucleation pathways involved. The external fields impact the ion-pair formation by affecting the internal energy and entropy terms, although the free energy itself changed less radically. The ion-pairing reaction changed from an entropy-driven (0 T, 7 T, 10 T, and 10 V m−1,) to an internal energy-driven reaction under selected magnetic or electric fields (1 T to 5 T and 1 V m−1 to 7 V m−1). Previous simulations implied that the electrostatic forces between Ca2+ and CO32− ions, which often are the primary interactions in water, do not contribute significantly to ion pairing.30 Entropy-driven ion pairing of [Ca–CO3]0 promoted the formation of disordered pre-nucleation clusters in the form of DOLLOPs34 (dynamically ordered liquid-like oxyanion polymers). These are in the form of [Ca–CO3]0 ion-paired chains. The DOLLOP structures have been proposed to favor the nucleation of carbonate minerals via non-classical nucleation, where an amorphous calcium carbonate phase is formed first and then transforms into crystalline calcite, aragonite, or vaterite34 (Fig. 8). On the contrary, internal energy-driven ion pairing will likely favor the formation of individual [Ca–CO3]0 species. This process is driven by Coulombic interactions between Ca2+ and CO32− ions. Once the charge neutral [Ca–CO3]0 is formed, further aggregation of these ion pairs into amorphous pre-nucleation clusters may need to overcome a higher energy barrier than forming the dynamically ordered clusters (Fig. 8). This change in the driving force of the thermodynamic component can help us explain why CaCO3 formation was favored in some electromagnetic field but disfavored under other conditions observed during experimental studies.
 | ||
| Fig. 8 The schematic diagram showed two pathways leading to the formation of amorphous calcium carbonate under entropy- and internal energy-driven processes at selected magnetic or electric fields. Oxygen, carbon, and calcium atoms are shown as red, black, and cyan, respectively. | ||
3.6. Implications for phase selection and precipitation at charged mineral surfaces
Previous experimental studies investigating whether a magnetic field can promote or inhibit carbonate mineral nucleation, and which phases are likely to form under such a field, have yielded inconsistent results. Tia et al. reported suppression in crystal growth rate under higher magnetic fields (up to 0.3 T), and that aragonite was the dominant phase formed.35 Kobe et al. studied the crystallization of CaCO3, and found increasing aragonite formation with increasing static magnetic field strength.36 They attributed the phase difference to the electric fields induced by the applied magnetic fields under fluid flow and the presence of strong electric fields near a conductive surface. Saban et al. showed, however, that a static 0.75 T field can increase the number of critical nuclei formed and promote formation of parallelepipedic calcite.37The geometry of the contact [Ca–CO3]0 ion-pair could provide insight into the origin of the phase selection effects of magnetic or electric fields. Fig. 3, 4, and 7 show that the primary configuration of the contact [Ca–CO3]0 ion-pairs (CNCa = 5) had a Ca–C distance of 2.7 Å. This is closer to the Ca–C distance in aragonite (2.9 Å). With increasing magnetic field, new contact ion pairs formed with a Ca–C distance (3.3 Å) closer to that of calcite (3.2 Å) and vaterite (3.3 Å) (Fig. 4(d)). While nucleation of carbonates is complex, and involves multiple elemental steps beyond simple contact ion pair formation,38,39 the appearance of calcite- and vaterite-like [Ca–CO3]0 ion-pairs under magnetic or electric fields implies that calcite and vaterite formation may become energetically favored, although directly linking the energetics of ion pair formation to phase stability requires further investigations. Our simulation results were complementary with recent experimental investigations of CaCO3 precipitation under the electric field <0.15 V m−1 and magnetic field <0.03 mT.40 At zero field vaterite was found to form first in a super-saturated CaCO3 solution which then transformed to calcite. The rate of this transformation was, however, accelerated with the presence of an external field, leading to more rapid calcite formation. This observation is consistent with our simulation data, which showed that applying an external field favored [Ca–CO3]0 ion pairing thermodynamically and may increase the nucleation rate of carbonate minerals.
Electric or magnetic fields may also impact the formation of ion pairs at interfaces. Alimi et al. found that the nucleation of CaCO3 in the presence of a magnetic field is strongly dependent on the physicochemical properties of the pipe materials. The amount of precipitation was significantly enhanced when the magnetic field was applied to non-conductive materials, whereas conductive materials adsorbed and shielded the electromagnetic energy, allowing less impact on nucleation.4 This implies that nucleation and crystal growth may be enhanced at conducting solid–water interfaces in the presence of an electromagnetic field. For instance, the formation of contact ion pairs appears to be more disrupted near the mineral surface than in the bulk solution during [NaOH]0 interaction with a gibbsite surface.41 Charged surfaces are also known to impact the adsorption of metal ions and nanoclusters at negatively charged mineral surfaces such as muscovite.42,43 Our simulation results indicated that static electric or magnetic fields can impact the energetics of ion paring by lowering the free energy minima. This indicates that charged surfaces acting as the source for a static electric field may play an important role during the ion paring process. Recent laboratory and pilot testing results demonstrated that both magnetic fields and AC-induced electric fields were effective in reducing the adherence of the CaCO3 scale to the negatively charged reverse osmosis membrane surface during wastewater treatment and brackish water desalination. EMF treatment also led to formation of soft, powdery mineral precipitation on the membrane surface, which could be easily removed through hydraulic flushing.44–46
4. Conclusion
We used a molecular dynamics/metadynamics approach to simulate the free energy of formation of calcium carbonate ion pairs in water to understand the complex effects of magnetic and electric fields on mineral scale formation during water treatment. Application of a constant field resulted in noticeable decreases in ion-pairing free energies (up to 3% to 6% with the largest change of −1.4 kJ mol−1). However, the internal energy and entropic components showed more significant variations relative to results at zero field. The results show that the ion-pairing is entropy-driven in the absence of a magnetic or electric field but can be switched to internal energy-driven under selected external field conditions. New contact ion-pair structures separated by a Ca–C distance of 3.3 Å with CN of Ca to water around 5.0 were observed with increasing magnetic or electric fields. Previous simulation work primarily investigated the physical and chemical properties of water and hydrated ions under external fields with less focus on the impacts on the free energies of chemical reactions.23,31,47–50 We demonstrated that the ion pairing became slightly energetically more favorable (decrease by about 1 kJ mol−1) under most external fields. A change in the reaction mechanism from entropy-driven (0 T or 0 V m−1) to internal energy-driven under selected fields could change the mechanism of nuclei formation and impact the nucleation pathways. The contact ion-pair structures formed under external fields may be used to explain how magnetic and electric fields change the growth and formation of calcium carbonate polymorphs. Future MD simulation may focus on the free energy of formation of nano-sized nuclei in water under either constant or alternating external fields. Future experimental analysis of EMF effects on precipitation requires comprehensive experimental designs to control all the factors that could impact nucleation, such as surface properties, mixing process, supersaturation, and the composition of background electrolytes.Data availability
Additional data supporting this work have been included in the ESI.‡Conflicts of interest
The authors declare that they have no known competing financial interests or personal relationships that could have appeared to influence the work reported in this paper.Acknowledgements
This material is based upon work supported by the National Alliance for Water Innovation (NAWI), an Energy-Water Desalination Hub funded by the U.S. Department of Energy, Office of Energy Efficiency and Renewable Energy (EERE), Industrial Efficiency and Decarbonization Office, under Funding Opportunity Announcement DE-FOA-0001905. A. G. S. provided insight on ion pair dissociation constant calculations using support from the U.S. Department of Energy, Office of Science, Office of Basic Energy Sciences, Chemical Sciences, Geosciences, and Biosciences Division. This research used birthright cloud resources of the Compute and Data Environment for Science (CADES) at the Oak Ridge National Laboratory, which is supported by the Office of Science of the U.S. Department of Energy under contract no. DE-AC05-00OR22725. The authors thank Dr Tomasz Panczyk (Polish Academy of Science) for sharing packages in simulating the magnetic field in LAMMPS.References
- A. Antony, J. H. Low, S. Gray, A. E. Childress, P. Le-Clech and G. Leslie, J. Membr. Sci., 2011, 383, 1–16 CrossRef CAS.
- M. M. Pendergast and E. M. V. Hoek, Energy Environ. Sci., 2011, 4, 1946–1971 RSC.
- L. Lin, W. B. Jiang, X. S. Xu and P. Xu, npj Clean Water, 2020, 3(1), 25 CrossRef CAS.
- F. Alimi, M. M. Tlili, M. Ben Amor, G. Maurin and C. Gabrielli, Chem. Eng. Process., 2009, 48, 1327–1332 CrossRef CAS.
- J. M. D. Coey, Philos. Mag., 2012, 92, 3857–3865 CrossRef CAS.
- M. Seyyedi, T. Wu and J. A. Brant, J. Membr. Sci., 2023, 668, 121274 CrossRef CAS.
- T. Wu and J. A. Brant, Environ. Eng. Sci., 2020, 37, 717–727 CrossRef CAS.
- C. M. Khor, J. W. Wang, M. H. Li, B. A. Oettel, R. B. Kaner, D. Jassby and E. M. V. Hoek, Water, 2020, 12, 3426 CrossRef CAS.
- W. B. Jiang, X. S. Xu, L. Lin, H. Y. Wang, R. Shaw, D. Lucero and P. Xu, Water, 2019, 11, 1015 CrossRef CAS.
- Y. H. Zhao, B. H. Hou, C. H. Liu, X. T. Ji, Y. H. Huang, J. C. Sui, D. Liu, N. Wang and H. X. Hao, Ind. Eng. Chem. Res., 2021, 60, 15741–15751 CrossRef CAS.
- G. Sazaki, E. Yoshida, H. Komatsu, T. Nakada, S. Miyashita and K. Watanabe, J. Cryst. Growth, 1997, 173, 231–234 CrossRef CAS.
- U. Rao, A. Iddya, B. Jung, C. M. Khor, Z. Hendren, C. Turchi, T. Cath, E. M. V. Hoek, G. Z. Ramon and D. Jassby, Environ. Sci. Technol., 2020, 54, 3678–3690 CrossRef CAS PubMed.
- D. Kashchiev, J. Cryst. Growth, 1972, 13–14, 128–130 CrossRef CAS.
- Q. Guan, Y. Liu, B. Ling, G. S. Zeng, H. Y. Ji, J. F. Zhang and Q. Zhang, Int. J. Chem. Kinet., 2020, 52, 463–471 CrossRef CAS.
- L. F. Alexander and N. Radacsi, CrystEngComm, 2019, 21, 5014–5031 RSC.
- A. R. Konak, Krist. Tech., 1974, 9, 1355–1360 CrossRef CAS.
- V. M. Yurov, S. A. Guchenko, M. S. Gyngazova and IOP, Effect of an electric field on nucleation and growth of crystals, Tomsk, Russia, 2015 Search PubMed.
- T. Park and T. H. Kwon, Environ. Sci. Technol., 2018, 52, 3267–3274 CrossRef CAS PubMed.
- A. C. Cefalas, S. Kobe, G. Drazic, E. Sarantopoulou, Z. Kollia, J. Strazisar and A. Meden, Appl. Surf. Sci., 2008, 254, 6715–6724 CrossRef CAS.
- S. Plimpton, Comput. Mater. Sci., 1995, 4, 361–364 CrossRef CAS.
- S. Plimpton, J. Comput. Phys., 1995, 117, 1–19 CrossRef CAS.
- A. Laio and M. Parrinello, Proc. Natl. Acad. Sci. U. S. A., 2002, 99, 12562–12566 CrossRef CAS PubMed.
- T. Panczyk and P. J. Camp, J. Mol. Liq., 2021, 330, 115701 CrossRef CAS.
- P. Raiteri, R. Demichelis and J. D. Gale, J. Phys. Chem. C, 2015, 119, 24447–24458 CrossRef CAS.
- Y. J. Wu, H. L. Tepper and G. A. Voth, J. Chem. Phys., 2006, 124, 024503 CrossRef PubMed.
- D. Branduardi, G. Bussi and M. Parrinello, J. Chem. Theory Comput., 2012, 8, 2247–2254 CrossRef CAS PubMed.
- T. A. Ho and L. J. Criscenti, J. Colloid Interface Sci., 2021, 600, 310–317 CrossRef CAS PubMed.
- X. Yang, M. Y. Ji, C. Zhang, X. N. Yang and Z. J. Xu, J. Comput. Chem., 2022, 43, 1621–1632 CrossRef CAS PubMed.
- N. Choudhury and B. M. Pettitt, J. Phys. Chem. B, 2006, 110, 8459–8463 CrossRef CAS PubMed.
- M. Kellermeier, P. Raiteri, J. K. Berg, A. Kempter, J. D. Gale and D. Gebauer, ChemPhysChem, 2016, 17, 3535–3541 CrossRef CAS PubMed.
- M. Shafiei, N. Ojaghlou, S. G. Zamfir, D. Bratko and A. Luzar, Mol. Phys., 2019, 117, 3282–3296 CrossRef CAS.
- I. O. Shklyarevskiy, M. I. Boamfa, P. C. M. Christianen, F. Touhari, H. van Kempen, G. Deroover, P. Callant and J. C. Maan, J. Chem. Phys., 2002, 116, 8407–8410 CrossRef CAS.
- K. Guevorkian and J. M. Valles, Biophys. J., 2006, 90, 3004–3011 CrossRef CAS PubMed.
- R. Demichelis, P. Raiteri, J. D. Gale, D. Quigley and D. Gebauer, Nat. Commun., 2011, 2, 590 CrossRef PubMed.
- M. C. Chang and C. Y. Tai, Chem. Eng. J., 2010, 164, 1–9 CrossRef CAS.
- S. Kobe, G. Drazic, A. C. Cefalas, E. Sarantopoulou and J. Strazisar, Cryst. Eng., 2002, 5, 243–253 CrossRef CAS.
- K. V. Saban, T. Jini and G. Varghese, Cryst. Res. Technol., 2005, 40, 748–751 CrossRef CAS.
- J. J. De Yoreo, P. Gilbert, N. Sommerdijk, R. L. Penn, S. Whitelam, D. Joester, H. Z. Zhang, J. D. Rimer, A. Navrotsky, J. F. Banfield, A. F. Wallace, F. M. Michel, F. C. Meldrum, H. Colfen and P. M. Dove, Science, 2015, 349, aaa6760 CrossRef PubMed.
- M. H. Nielsen, S. Aloni and J. J. De Yoreo, Science, 2014, 345, 1158–1162 CrossRef CAS PubMed.
- X. Du, W. Jiang, Y. Wang, F. Shu, H. Wang, D. Vazquez, K. Yuan, L. M. Anovitz, P. B. Ishai and P. Xu, under review, 2024.
- W. Liu, M. Pouvreau, A. G. Stack, X. N. Yang and A. E. Clark, Phys. Chem. Chem. Phys., 2022, 24, 20998–21008 RSC.
- K. Yuan, J. N. Bracco, M. Schmidt, L. Soderholm, P. Fenter and S. S. Lee, J. Phys. Chem. C, 2019, 123, 16699–16710 CrossRef CAS.
- M. Schmidt, S. Hellebrandt, K. E. Knope, S. S. Lee, J. E. Stubbs, P. J. Eng, L. Soderholm and P. Fenter, Geochim. Cosmochim. Acta, 2015, 165, 280–293 CrossRef CAS.
- W. Jiang, X. Xu, D. Johnson, L. Lin, H. Wang and P. Xu, Sep. Purif. Technol., 2022, 280, 119823 CrossRef CAS.
- W. Jiang, X. Xu, L. Lin, H. Wang, R. Shaw, D. Lucero and P. Xu, Water, 2019, 11, 1015 CrossRef CAS.
- J. Penteado de Almeida, Z. Stoll and P. Xu, Water, 2023, 15, 2234 CrossRef CAS.
- F. Sofos, T. Karakasidis and I. E. Sarris, Nanomaterials, 2020, 10, 2373 CrossRef CAS PubMed.
- Z. J. He, H. S. Cui, S. H. Hao, L. P. Wang and J. Zhou, J. Phys. Chem. B, 2018, 122, 5991–5998 CrossRef CAS PubMed.
- S. Wei, C. Zhong and H. Su-Yi, Mol. Simul., 2005, 31, 555–559 CrossRef CAS.
- M. Kiselev and K. Heinzinger, J. Chem. Phys., 1996, 105, 650–657 CrossRef CAS.
Footnotes |
| † This manuscript has been authored in part by UT-Battelle, LLC, under contract DE-AC0500OR22725 with the US Department of Energy (DOE). The US government retains and the publisher, by accepting the article for publication, acknowledges that the US government retains a nonexclusive, paid-up, irrevocable, worldwide license to publish or reproduce the published form of this manuscript, or allow others to do so, for US government purposes. DOE will provide public access to these results of federally sponsored research in accordance with the DOE Public Access Plan (https://energy.gov/downloads/doe-public-access-plan). The views expressed herein do not necessarily represent the views of the U.S. Department of Energy or the United States Government. |
| ‡ Electronic supplementary information (ESI) available. See DOI: https://doi.org/10.1039/d4cp02041c |
| § Current address: Quantum Simulations Group, Lawrence Livermore National Laboratory, CA 94550, USA. |
| This journal is © the Owner Societies 2024 |